Cities with the Highest Percentage of Black / African American Population in Virginia
RELATED REPORTS & OPTIONS
Black / African American
Virginia
Compare Cities
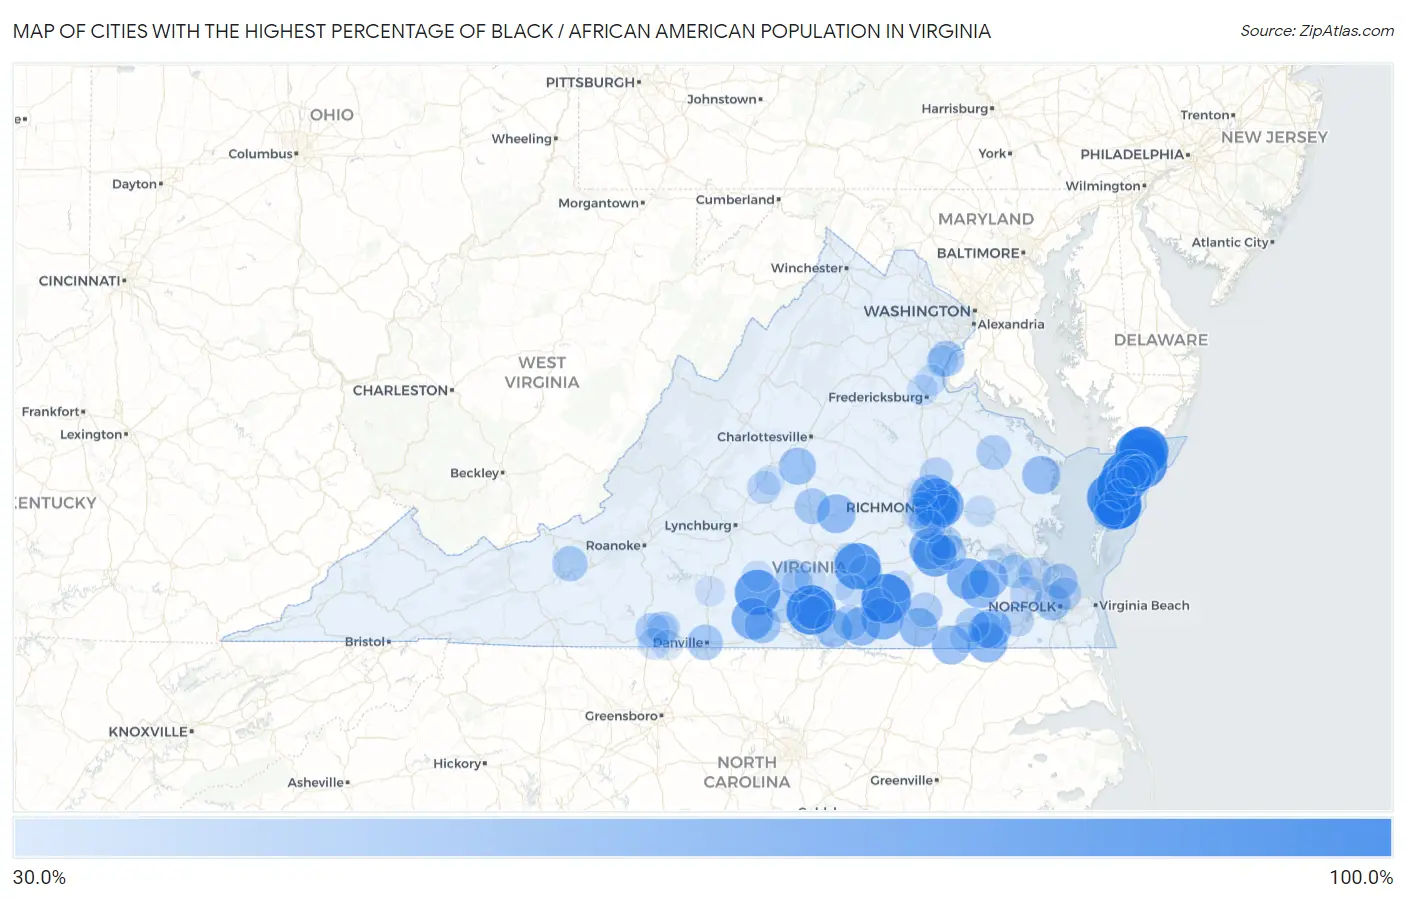
Map of Cities with the Highest Percentage of Black / African American Population in Virginia
0.0%
100.0%
Cities with the Highest Percentage of Black / African American Population in Virginia
| City | Black / African American | vs State | vs National | |
| 1. | Mappsville | 100.0% | 18.9%(+81.1)#1 | 12.5%(+87.5)#8 |
| 2. | Savage Town | 100.0% | 18.9%(+81.1)#2 | 12.5%(+87.5)#15 |
| 3. | Bayside | 100.0% | 18.9%(+81.1)#3 | 12.5%(+87.5)#17 |
| 4. | Makemie Park | 100.0% | 18.9%(+81.1)#4 | 12.5%(+87.5)#20 |
| 5. | Locust Mount | 100.0% | 18.9%(+81.1)#5 | 12.5%(+87.5)#27 |
| 6. | Thynedale | 100.0% | 18.9%(+81.1)#6 | 12.5%(+87.5)#39 |
| 7. | Warfield | 100.0% | 18.9%(+81.1)#7 | 12.5%(+87.5)#41 |
| 8. | Oak Hall | 100.0% | 18.9%(+81.1)#8 | 12.5%(+87.5)#42 |
| 9. | Boston | 96.1% | 18.9%(+77.2)#9 | 12.5%(+83.6)#102 |
| 10. | Cats Bridge | 94.6% | 18.9%(+75.7)#10 | 12.5%(+82.2)#117 |
| 11. | Savageville | 89.2% | 18.9%(+70.3)#11 | 12.5%(+76.7)#199 |
| 12. | Nottoway Court House | 88.3% | 18.9%(+69.4)#12 | 12.5%(+75.9)#214 |
| 13. | East Highland Park | 85.9% | 18.9%(+67.0)#13 | 12.5%(+73.5)#261 |
| 14. | Nathalie | 85.7% | 18.9%(+66.8)#14 | 12.5%(+73.2)#264 |
| 15. | Whitesville | 85.0% | 18.9%(+66.1)#15 | 12.5%(+72.5)#283 |
| 16. | Petersburg | 77.3% | 18.9%(+58.4)#16 | 12.5%(+64.8)#449 |
| 17. | Highland Springs | 73.9% | 18.9%(+54.9)#17 | 12.5%(+61.4)#529 |
| 18. | Montrose | 73.8% | 18.9%(+54.9)#18 | 12.5%(+61.4)#531 |
| 19. | Mountain Road | 71.5% | 18.9%(+52.6)#19 | 12.5%(+59.0)#587 |
| 20. | Lawrenceville | 71.0% | 18.9%(+52.1)#20 | 12.5%(+58.5)#596 |
| 21. | Ettrick | 70.8% | 18.9%(+51.9)#21 | 12.5%(+58.3)#601 |
| 22. | Fairview | 69.7% | 18.9%(+50.8)#22 | 12.5%(+57.2)#626 |
| 23. | Waverly | 69.6% | 18.9%(+50.6)#23 | 12.5%(+57.1)#632 |
| 24. | Southampton Meadows | 65.6% | 18.9%(+46.6)#24 | 12.5%(+53.1)#718 |
| 25. | Camptown | 65.2% | 18.9%(+46.3)#25 | 12.5%(+52.8)#730 |
| 26. | Cumberland | 61.1% | 18.9%(+42.2)#26 | 12.5%(+48.6)#861 |
| 27. | Branchville | 61.1% | 18.9%(+42.2)#27 | 12.5%(+48.6)#862 |
| 28. | Wakefield | 60.7% | 18.9%(+41.8)#28 | 12.5%(+48.3)#873 |
| 29. | Emporia | 60.6% | 18.9%(+41.7)#29 | 12.5%(+48.1)#878 |
| 30. | Brodnax | 60.5% | 18.9%(+41.6)#30 | 12.5%(+48.1)#879 |
| 31. | Dendron | 60.1% | 18.9%(+41.2)#31 | 12.5%(+47.6)#889 |
| 32. | Lancaster | 59.1% | 18.9%(+40.2)#32 | 12.5%(+46.6)#924 |
| 33. | Chamberlayne | 58.8% | 18.9%(+39.9)#33 | 12.5%(+46.4)#929 |
| 34. | Baskerville | 56.7% | 18.9%(+37.8)#34 | 12.5%(+44.2)#1,013 |
| 35. | Esmont | 55.9% | 18.9%(+37.0)#35 | 12.5%(+43.5)#1,038 |
| 36. | Metompkin | 54.1% | 18.9%(+35.2)#36 | 12.5%(+41.6)#1,100 |
| 37. | Innovation | 53.9% | 18.9%(+34.9)#37 | 12.5%(+41.4)#1,110 |
| 38. | South Boston | 53.1% | 18.9%(+34.2)#38 | 12.5%(+40.6)#1,141 |
| 39. | Portsmouth | 51.4% | 18.9%(+32.5)#39 | 12.5%(+39.0)#1,190 |
| 40. | Franklin | 51.4% | 18.9%(+32.5)#40 | 12.5%(+38.9)#1,193 |
| 41. | Cherry Hill | 51.3% | 18.9%(+32.4)#41 | 12.5%(+38.8)#1,199 |
| 42. | Dillwyn | 50.9% | 18.9%(+32.0)#42 | 12.5%(+38.4)#1,212 |
| 43. | Danville | 50.2% | 18.9%(+31.3)#43 | 12.5%(+37.7)#1,244 |
| 44. | Pastoria | 50.2% | 18.9%(+31.3)#44 | 12.5%(+37.7)#1,245 |
| 45. | Prince George | 49.1% | 18.9%(+30.2)#45 | 12.5%(+36.6)#1,287 |
| 46. | Hampton | 49.0% | 18.9%(+30.1)#46 | 12.5%(+36.5)#1,290 |
| 47. | New River | 48.6% | 18.9%(+29.7)#47 | 12.5%(+36.1)#1,301 |
| 48. | Greenbush | 47.7% | 18.9%(+28.7)#48 | 12.5%(+35.2)#1,336 |
| 49. | South Hill | 47.6% | 18.9%(+28.7)#49 | 12.5%(+35.1)#1,342 |
| 50. | Tappahannock | 47.5% | 18.9%(+28.6)#50 | 12.5%(+35.1)#1,345 |
| 51. | Jarratt | 46.8% | 18.9%(+27.9)#51 | 12.5%(+34.4)#1,390 |
| 52. | Blackstone | 46.4% | 18.9%(+27.5)#52 | 12.5%(+33.9)#1,411 |
| 53. | Courtland | 46.3% | 18.9%(+27.4)#53 | 12.5%(+33.9)#1,412 |
| 54. | Laurel Park | 46.1% | 18.9%(+27.1)#54 | 12.5%(+33.6)#1,424 |
| 55. | Martinsville | 45.4% | 18.9%(+26.5)#55 | 12.5%(+32.9)#1,454 |
| 56. | Charlotte Court House | 45.0% | 18.9%(+26.1)#56 | 12.5%(+32.5)#1,469 |
| 57. | Alberta | 44.4% | 18.9%(+25.5)#57 | 12.5%(+32.0)#1,498 |
| 58. | Leesylvania | 44.4% | 18.9%(+25.5)#58 | 12.5%(+31.9)#1,504 |
| 59. | Richmond | 44.0% | 18.9%(+25.1)#59 | 12.5%(+31.5)#1,528 |
| 60. | Clover | 43.5% | 18.9%(+24.6)#60 | 12.5%(+31.0)#1,549 |
| 61. | Gargatha | 43.4% | 18.9%(+24.5)#61 | 12.5%(+30.9)#1,557 |
| 62. | Hopewell | 43.3% | 18.9%(+24.4)#62 | 12.5%(+30.8)#1,562 |
| 63. | Rushmere | 43.2% | 18.9%(+24.3)#63 | 12.5%(+30.7)#1,567 |
| 64. | Meadowbrook | 42.0% | 18.9%(+23.1)#64 | 12.5%(+29.6)#1,629 |
| 65. | Suffolk | 41.6% | 18.9%(+22.6)#65 | 12.5%(+29.1)#1,654 |
| 66. | Hanover | 41.4% | 18.9%(+22.5)#66 | 12.5%(+29.0)#1,658 |
| 67. | Onancock | 41.2% | 18.9%(+22.3)#67 | 12.5%(+28.7)#1,667 |
| 68. | Newport News | 41.2% | 18.9%(+22.3)#68 | 12.5%(+28.7)#1,672 |
| 69. | Arrington | 41.1% | 18.9%(+22.2)#69 | 12.5%(+28.6)#1,673 |
| 70. | Exmore | 40.9% | 18.9%(+22.0)#70 | 12.5%(+28.4)#1,684 |
| 71. | Norfolk | 40.7% | 18.9%(+21.8)#71 | 12.5%(+28.2)#1,695 |
| 72. | Chase City | 40.3% | 18.9%(+21.4)#72 | 12.5%(+27.8)#1,722 |
| 73. | Benns Church | 40.1% | 18.9%(+21.2)#73 | 12.5%(+27.6)#1,732 |
| 74. | Crewe | 39.5% | 18.9%(+20.6)#74 | 12.5%(+27.0)#1,772 |
| 75. | Sandston | 39.1% | 18.9%(+20.2)#75 | 12.5%(+26.7)#1,787 |
| 76. | Mckenney | 37.2% | 18.9%(+18.3)#76 | 12.5%(+24.7)#1,894 |
| 77. | Drakes Branch | 37.2% | 18.9%(+18.3)#77 | 12.5%(+24.7)#1,895 |
| 78. | Parksley | 37.2% | 18.9%(+18.3)#78 | 12.5%(+24.7)#1,897 |
| 79. | Triangle | 37.0% | 18.9%(+18.1)#79 | 12.5%(+24.5)#1,905 |
| 80. | Ridgeway | 36.7% | 18.9%(+17.8)#80 | 12.5%(+24.2)#1,925 |
| 81. | Bellwood | 36.6% | 18.9%(+17.7)#81 | 12.5%(+24.1)#1,934 |
| 82. | Keysville | 36.4% | 18.9%(+17.5)#82 | 12.5%(+24.0)#1,943 |
| 83. | Keller | 35.7% | 18.9%(+16.8)#83 | 12.5%(+23.2)#1,993 |
| 84. | Kenbridge | 35.5% | 18.9%(+16.6)#84 | 12.5%(+23.0)#2,003 |
| 85. | Stafford Courthouse | 35.4% | 18.9%(+16.5)#85 | 12.5%(+22.9)#2,010 |
| 86. | Southern Gateway | 35.1% | 18.9%(+16.2)#86 | 12.5%(+22.6)#2,028 |
| 87. | New Kent | 35.1% | 18.9%(+16.1)#87 | 12.5%(+22.6)#2,030 |
| 88. | Brookneal | 34.9% | 18.9%(+16.0)#88 | 12.5%(+22.5)#2,036 |
| 89. | Woodlawn Cdp Fairfax County | 34.2% | 18.9%(+15.3)#89 | 12.5%(+21.8)#2,072 |
| 90. | Newsoms | 34.2% | 18.9%(+15.3)#90 | 12.5%(+21.7)#2,078 |
| 91. | Manchester | 34.1% | 18.9%(+15.2)#91 | 12.5%(+21.6)#2,084 |
| 92. | Fort Lee | 33.0% | 18.9%(+14.1)#92 | 12.5%(+20.5)#2,150 |
| 93. | Sandy Level | 32.4% | 18.9%(+13.5)#93 | 12.5%(+19.9)#2,187 |
| 94. | Nassawadox | 32.3% | 18.9%(+13.4)#94 | 12.5%(+19.9)#2,189 |
| 95. | Gretna | 31.9% | 18.9%(+13.0)#95 | 12.5%(+19.5)#2,212 |
| 96. | Chatmoss | 31.3% | 18.9%(+12.4)#96 | 12.5%(+18.8)#2,259 |
| 97. | Victoria | 31.2% | 18.9%(+12.3)#97 | 12.5%(+18.7)#2,269 |
| 98. | Laurel | 31.1% | 18.9%(+12.2)#98 | 12.5%(+18.6)#2,276 |
| 99. | Shipman | 31.0% | 18.9%(+12.1)#99 | 12.5%(+18.5)#2,284 |
| 100. | Scotland | 30.9% | 18.9%(+12.0)#100 | 12.5%(+18.4)#2,293 |
Common Questions
What are the Top 10 Cities with the Highest Percentage of Black / African American Population in Virginia?
Top 10 Cities with the Highest Percentage of Black / African American Population in Virginia are:
#1
100.0%
#2
100.0%
#3
100.0%
#4
100.0%
#5
100.0%
#6
100.0%
#7
100.0%
#8
96.1%
#9
94.6%
#10
89.2%
What city has the Highest Percentage of Black / African American Population in Virginia?
Mappsville has the Highest Percentage of Black / African American Population in Virginia with 100.0%.
What is the Percentage of Black / African American Population in the State of Virginia?
Percentage of Black / African American Population in Virginia is 18.9%.
What is the Percentage of Black / African American Population in the United States?
Percentage of Black / African American Population in the United States is 12.5%.