La Presa, CA Map & Demographics
La Presa Map
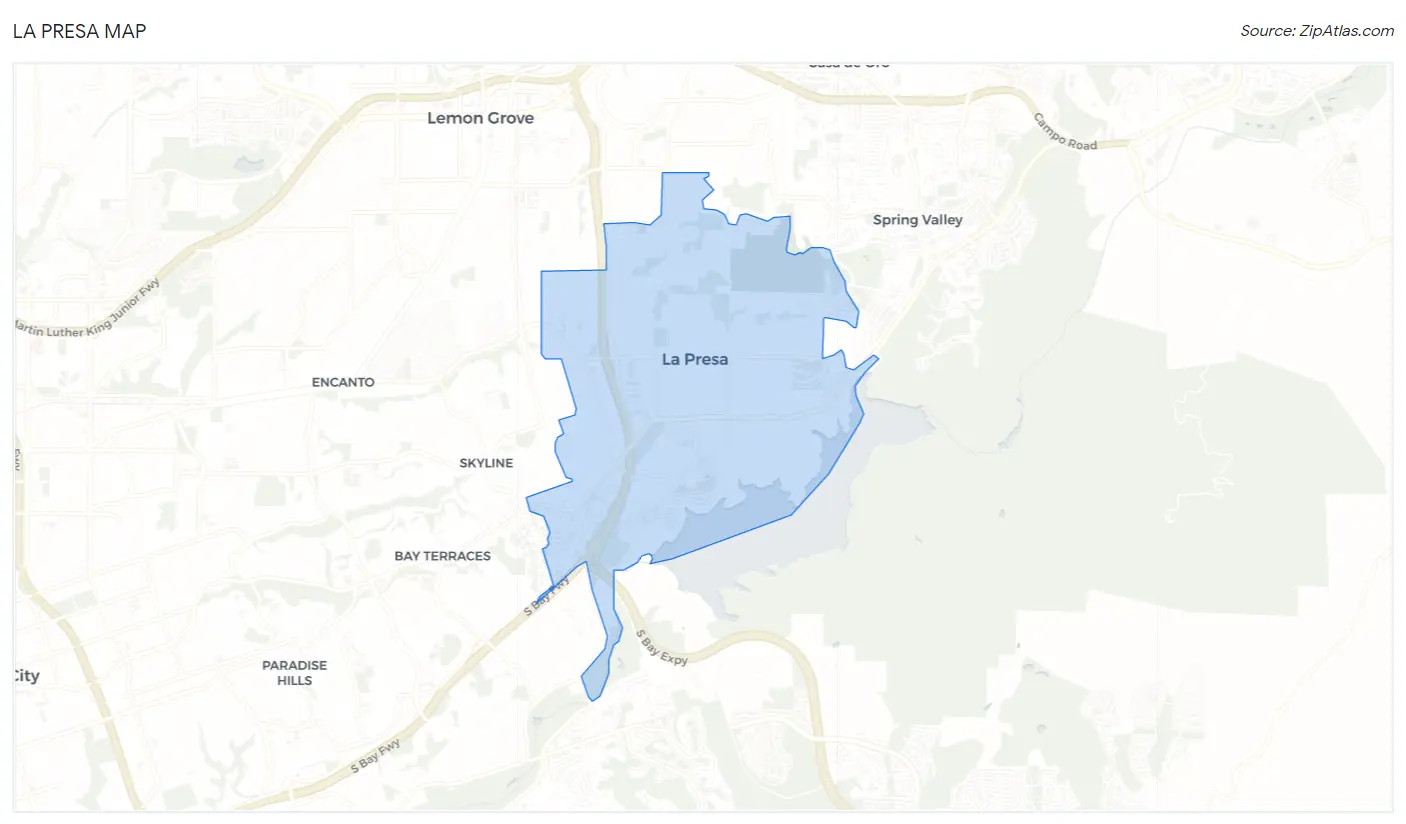
La Presa Overview
$33,784
PER CAPITA INCOME
$85,246
AVG FAMILY INCOME
$82,845
AVG HOUSEHOLD INCOME
26.7%
WAGE / INCOME GAP [ % ]
73.3¢/ $1
WAGE / INCOME GAP [ $ ]
$8,988
FAMILY INCOME DEFICIT
0.42
INEQUALITY / GINI INDEX
38,618
TOTAL POPULATION
19,690
MALE POPULATION
18,928
FEMALE POPULATION
104.03
MALES / 100 FEMALES
96.13
FEMALES / 100 MALES
35.2
MEDIAN AGE
3.9
AVG FAMILY SIZE
3.4
AVG HOUSEHOLD SIZE
19,169
LABOR FORCE [ PEOPLE ]
63.2%
PERCENT IN LABOR FORCE
8.7%
UNEMPLOYMENT RATE
Income in La Presa
Income Overview in La Presa
Per Capita Income in La Presa is $33,784, while median incomes of families and households are $85,246 and $82,845 respectively.
| Characteristic | Number | Measure |
| Per Capita Income | 38,618 | $33,784 |
| Median Family Income | 8,260 | $85,246 |
| Mean Family Income | 8,260 | $107,854 |
| Median Household Income | 11,330 | $82,845 |
| Mean Household Income | 11,330 | $109,677 |
| Income Deficit | 8,260 | $8,988 |
| Wage / Income Gap (%) | 38,618 | 26.66% |
| Wage / Income Gap ($) | 38,618 | 73.34¢ per $1 |
| Gini / Inequality Index | 38,618 | 0.42 |
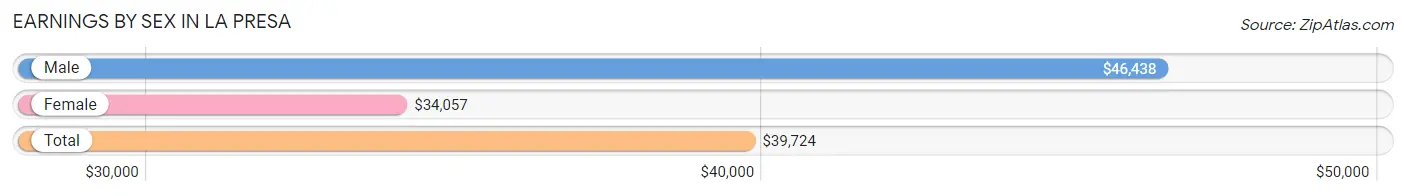
Earnings by Sex in La Presa
Average Earnings in La Presa are $39,724, $46,438 for men and $34,057 for women, a difference of 26.7%.
| Sex | Number | Average Earnings |
| Male | 10,616 (55.8%) | $46,438 |
| Female | 8,416 (44.2%) | $34,057 |
| Total | 19,032 (100.0%) | $39,724 |
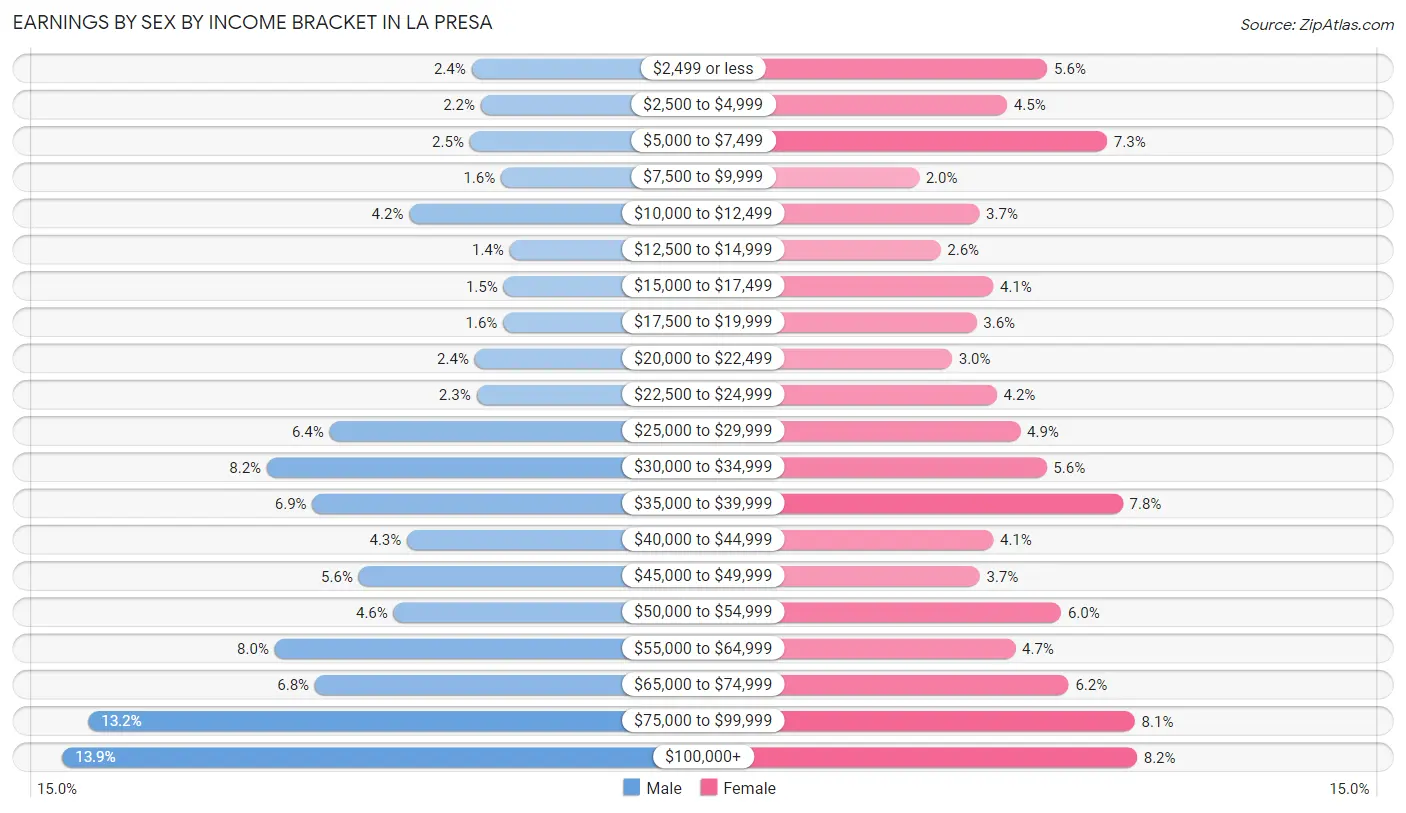
Earnings by Sex by Income Bracket in La Presa
The most common earnings brackets in La Presa are $100,000+ for men (1,480 | 13.9%) and $100,000+ for women (686 | 8.2%).
| Income | Male | Female |
| $2,499 or less | 259 (2.4%) | 474 (5.6%) |
| $2,500 to $4,999 | 231 (2.2%) | 379 (4.5%) |
| $5,000 to $7,499 | 264 (2.5%) | 615 (7.3%) |
| $7,500 to $9,999 | 171 (1.6%) | 170 (2.0%) |
| $10,000 to $12,499 | 445 (4.2%) | 313 (3.7%) |
| $12,500 to $14,999 | 145 (1.4%) | 221 (2.6%) |
| $15,000 to $17,499 | 164 (1.5%) | 346 (4.1%) |
| $17,500 to $19,999 | 165 (1.5%) | 306 (3.6%) |
| $20,000 to $22,499 | 250 (2.4%) | 248 (2.9%) |
| $22,500 to $24,999 | 244 (2.3%) | 354 (4.2%) |
| $25,000 to $29,999 | 683 (6.4%) | 410 (4.9%) |
| $30,000 to $34,999 | 869 (8.2%) | 472 (5.6%) |
| $35,000 to $39,999 | 734 (6.9%) | 652 (7.7%) |
| $40,000 to $44,999 | 451 (4.3%) | 346 (4.1%) |
| $45,000 to $49,999 | 596 (5.6%) | 314 (3.7%) |
| $50,000 to $54,999 | 491 (4.6%) | 507 (6.0%) |
| $55,000 to $64,999 | 846 (8.0%) | 398 (4.7%) |
| $65,000 to $74,999 | 726 (6.8%) | 524 (6.2%) |
| $75,000 to $99,999 | 1,402 (13.2%) | 681 (8.1%) |
| $100,000+ | 1,480 (13.9%) | 686 (8.2%) |
| Total | 10,616 (100.0%) | 8,416 (100.0%) |
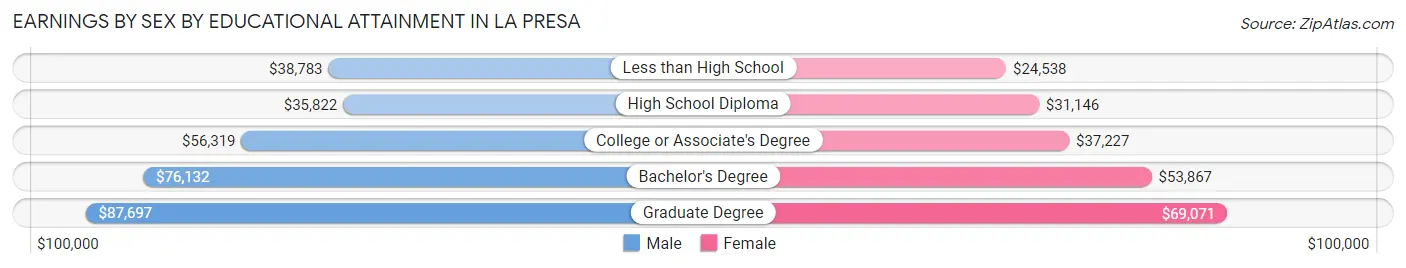
Earnings by Sex by Educational Attainment in La Presa
Average earnings in La Presa are $50,912 for men and $37,815 for women, a difference of 25.7%. Men with an educational attainment of graduate degree enjoy the highest average annual earnings of $87,697, while those with high school diploma education earn the least with $35,822. Women with an educational attainment of graduate degree earn the most with the average annual earnings of $69,071, while those with less than high school education have the smallest earnings of $24,538.
| Educational Attainment | Male Income | Female Income |
| Less than High School | $38,783 | $24,538 |
| High School Diploma | $35,822 | $31,146 |
| College or Associate's Degree | $56,319 | $37,227 |
| Bachelor's Degree | $76,132 | $53,867 |
| Graduate Degree | $87,697 | $69,071 |
| Total | $50,912 | $37,815 |
Family Income in La Presa
Family Income Brackets in La Presa
According to the La Presa family income data, there are 1,669 families falling into the $100,000 to $149,999 income range, which is the most common income bracket and makes up 20.2% of all families. Conversely, the less than $10,000 income bracket is the least frequent group with only 74 families (0.9%) belonging to this category.
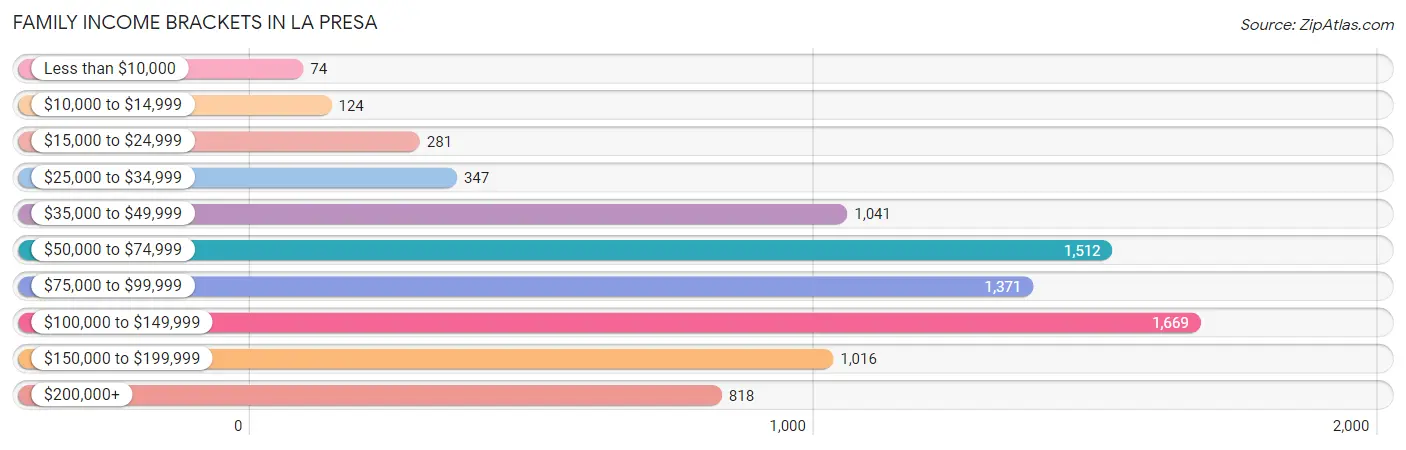
| Income Bracket | # Families | % Families |
| Less than $10,000 | 74 | 0.9% |
| $10,000 to $14,999 | 124 | 1.5% |
| $15,000 to $24,999 | 281 | 3.4% |
| $25,000 to $34,999 | 347 | 4.2% |
| $35,000 to $49,999 | 1,041 | 12.6% |
| $50,000 to $74,999 | 1,512 | 18.3% |
| $75,000 to $99,999 | 1,371 | 16.6% |
| $100,000 to $149,999 | 1,669 | 20.2% |
| $150,000 to $199,999 | 1,016 | 12.3% |
| $200,000+ | 818 | 9.9% |
Family Income by Famaliy Size in La Presa
6-person families (499 | 6.0%) account for the highest median family income in La Presa with $140,703 per family, while 2-person families (2,749 | 33.3%) have the highest median income of $35,944 per family member.
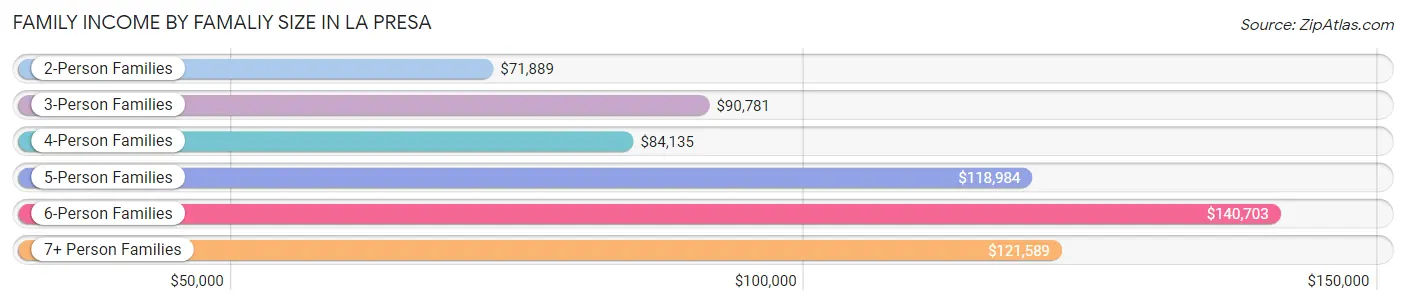
| Income Bracket | # Families | Median Income |
| 2-Person Families | 2,749 (33.3%) | $71,889 |
| 3-Person Families | 1,535 (18.6%) | $90,781 |
| 4-Person Families | 1,867 (22.6%) | $84,135 |
| 5-Person Families | 1,135 (13.7%) | $118,984 |
| 6-Person Families | 499 (6.0%) | $140,703 |
| 7+ Person Families | 475 (5.8%) | $121,589 |
| Total | 8,260 (100.0%) | $85,246 |
Family Income by Number of Earners in La Presa
The median family income in La Presa is $85,246, with families comprising 3+ earners (1,568) having the highest median family income of $147,969, while families with no earners (853) have the lowest median family income of $47,560, accounting for 19.0% and 10.3% of families, respectively.
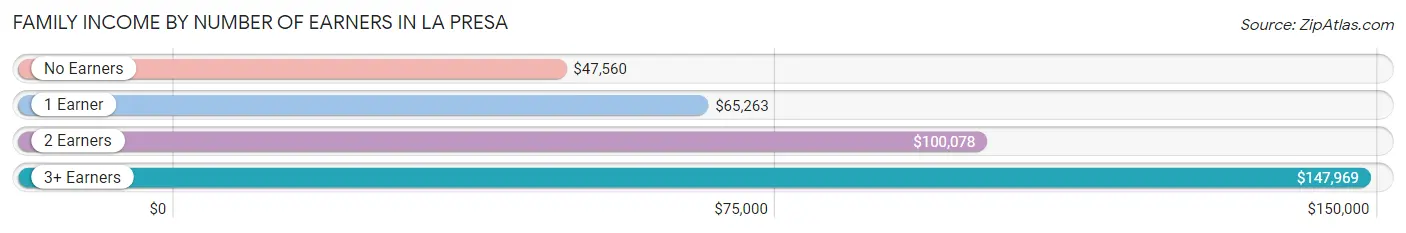
| Number of Earners | # Families | Median Income |
| No Earners | 853 (10.3%) | $47,560 |
| 1 Earner | 2,974 (36.0%) | $65,263 |
| 2 Earners | 2,865 (34.7%) | $100,078 |
| 3+ Earners | 1,568 (19.0%) | $147,969 |
| Total | 8,260 (100.0%) | $85,246 |
Household Income in La Presa
Household Income Brackets in La Presa
With 2,175 households falling in the category, the $100,000 to $149,999 income range is the most frequent in La Presa, accounting for 19.2% of all households. In contrast, only 249 households (2.2%) fall into the less than $10,000 income bracket, making it the least populous group.
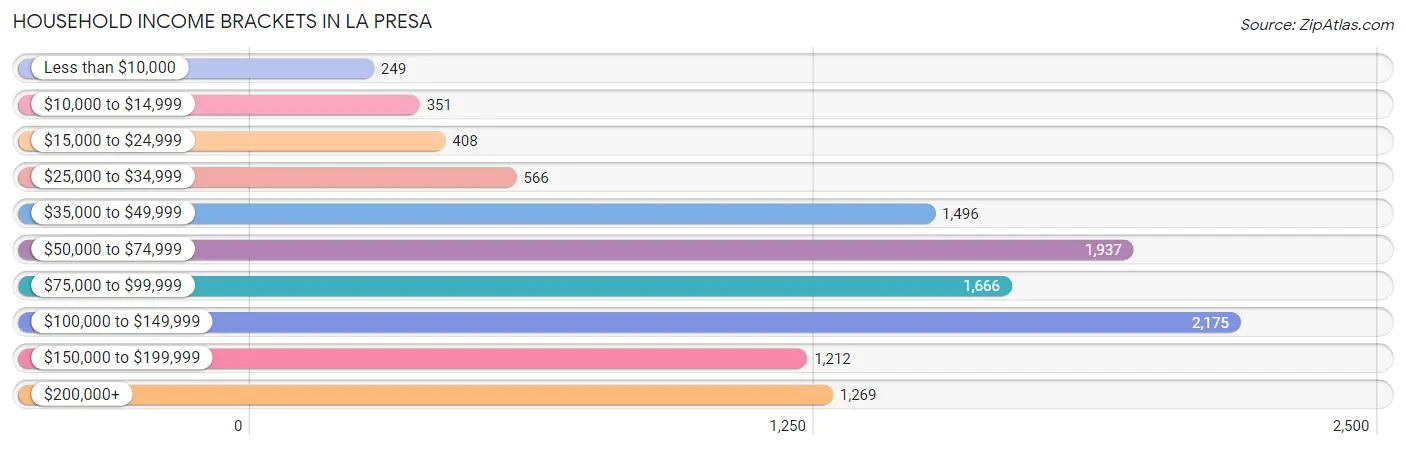
| Income Bracket | # Households | % Households |
| Less than $10,000 | 249 | 2.2% |
| $10,000 to $14,999 | 351 | 3.1% |
| $15,000 to $24,999 | 408 | 3.6% |
| $25,000 to $34,999 | 566 | 5.0% |
| $35,000 to $49,999 | 1,496 | 13.2% |
| $50,000 to $74,999 | 1,937 | 17.1% |
| $75,000 to $99,999 | 1,666 | 14.7% |
| $100,000 to $149,999 | 2,175 | 19.2% |
| $150,000 to $199,999 | 1,212 | 10.7% |
| $200,000+ | 1,269 | 11.2% |
Household Income by Householder Age in La Presa
The median household income in La Presa is $82,845, with the highest median household income of $93,000 found in the 25 to 44 years age bracket for the primary householder. A total of 3,908 households (34.5%) fall into this category. Meanwhile, the 15 to 24 years age bracket for the primary householder has the lowest median household income of $54,866, with 211 households (1.9%) in this group.
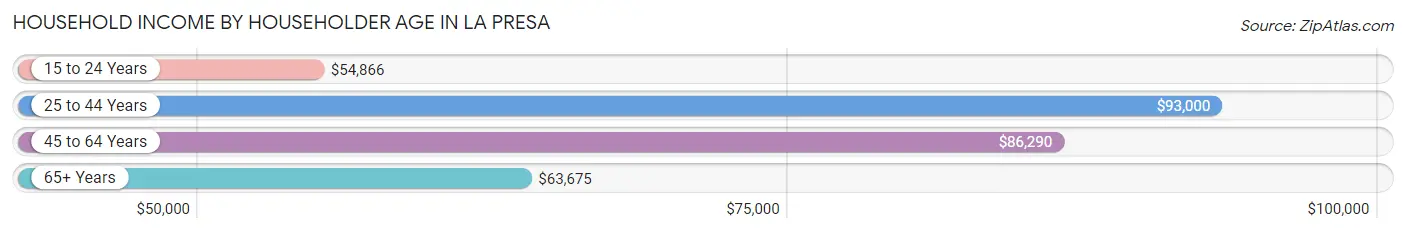
| Income Bracket | # Households | Median Income |
| 15 to 24 Years | 211 (1.9%) | $54,866 |
| 25 to 44 Years | 3,908 (34.5%) | $93,000 |
| 45 to 64 Years | 4,308 (38.0%) | $86,290 |
| 65+ Years | 2,903 (25.6%) | $63,675 |
| Total | 11,330 (100.0%) | $82,845 |
Poverty in La Presa
Income Below Poverty by Sex and Age in La Presa
With 8.7% poverty level for males and 11.6% for females among the residents of La Presa, 15 year old males and 15 year old females are the most vulnerable to poverty, with 89 males (36.0%) and 81 females (29.8%) in their respective age groups living below the poverty level.
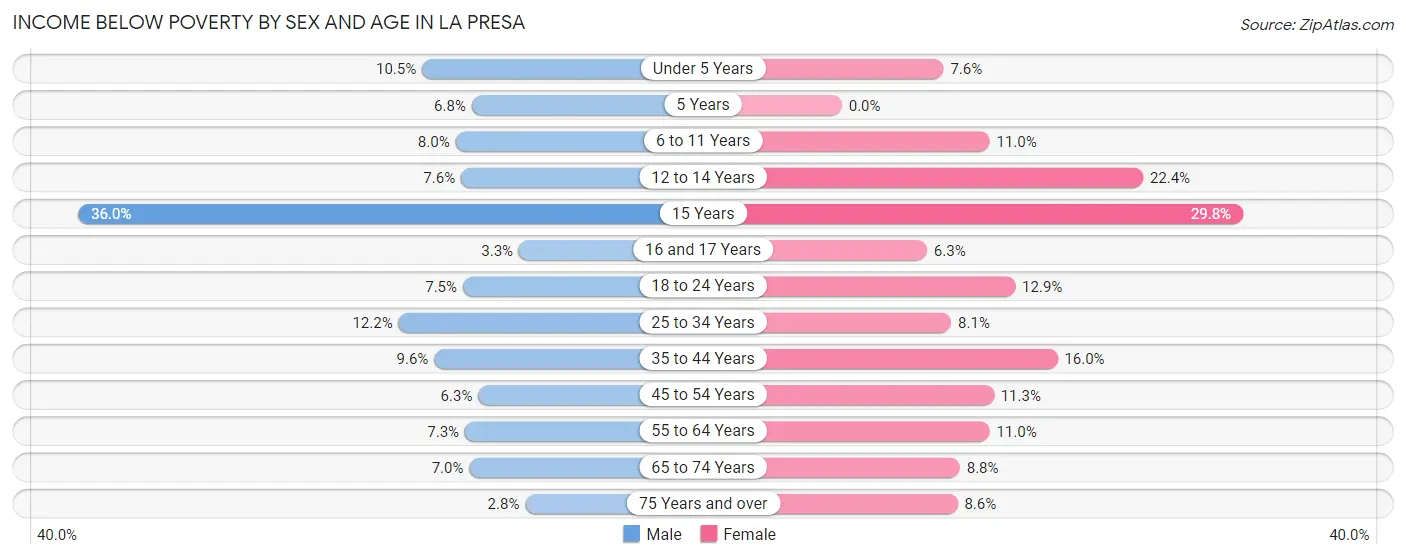
| Age Bracket | Male | Female |
| Under 5 Years | 123 (10.5%) | 92 (7.5%) |
| 5 Years | 10 (6.8%) | 0 (0.0%) |
| 6 to 11 Years | 142 (8.0%) | 153 (11.0%) |
| 12 to 14 Years | 67 (7.6%) | 186 (22.4%) |
| 15 Years | 89 (36.0%) | 81 (29.8%) |
| 16 and 17 Years | 13 (3.3%) | 30 (6.3%) |
| 18 to 24 Years | 128 (7.5%) | 246 (12.9%) |
| 25 to 34 Years | 440 (12.2%) | 221 (8.1%) |
| 35 to 44 Years | 246 (9.6%) | 468 (16.0%) |
| 45 to 54 Years | 162 (6.3%) | 218 (11.3%) |
| 55 to 64 Years | 147 (7.3%) | 235 (11.0%) |
| 65 to 74 Years | 114 (7.0%) | 136 (8.8%) |
| 75 Years and over | 25 (2.8%) | 108 (8.6%) |
| Total | 1,706 (8.7%) | 2,174 (11.6%) |
Income Above Poverty by Sex and Age in La Presa
According to the poverty statistics in La Presa, males aged 75 years and over and females aged 5 years are the age groups that are most secure financially, with 97.2% of males and 100.0% of females in these age groups living above the poverty line.
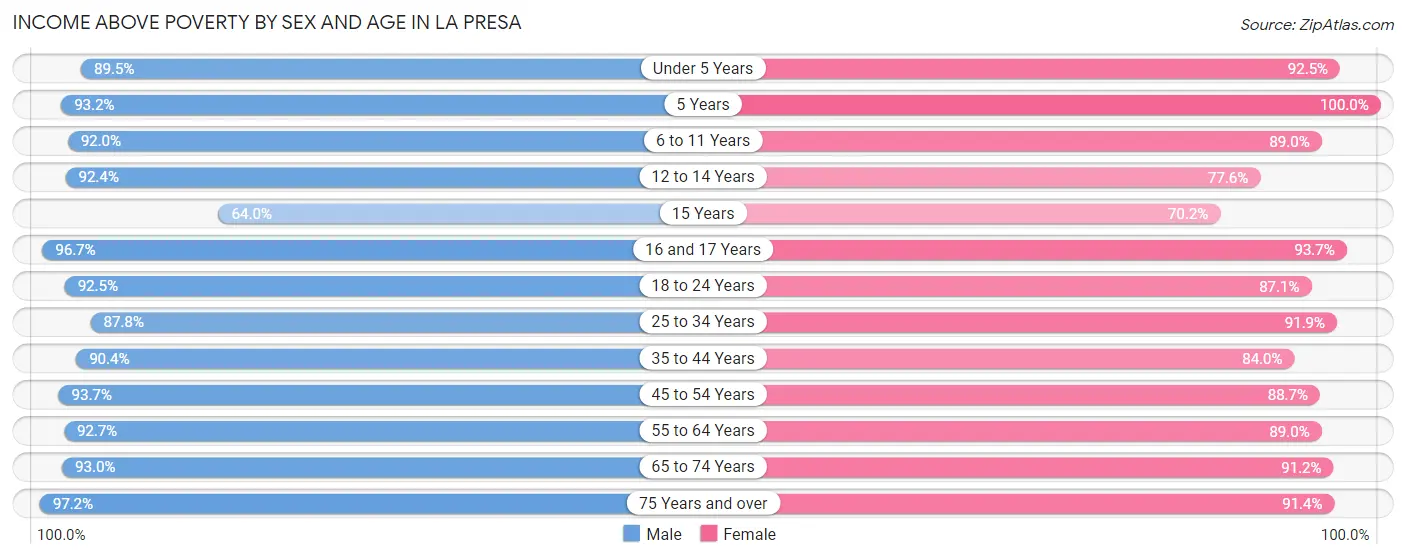
| Age Bracket | Male | Female |
| Under 5 Years | 1,050 (89.5%) | 1,126 (92.4%) |
| 5 Years | 137 (93.2%) | 153 (100.0%) |
| 6 to 11 Years | 1,631 (92.0%) | 1,242 (89.0%) |
| 12 to 14 Years | 815 (92.4%) | 646 (77.6%) |
| 15 Years | 158 (64.0%) | 191 (70.2%) |
| 16 and 17 Years | 381 (96.7%) | 445 (93.7%) |
| 18 to 24 Years | 1,587 (92.5%) | 1,666 (87.1%) |
| 25 to 34 Years | 3,154 (87.8%) | 2,500 (91.9%) |
| 35 to 44 Years | 2,318 (90.4%) | 2,456 (84.0%) |
| 45 to 54 Years | 2,400 (93.7%) | 1,714 (88.7%) |
| 55 to 64 Years | 1,864 (92.7%) | 1,907 (89.0%) |
| 65 to 74 Years | 1,519 (93.0%) | 1,417 (91.2%) |
| 75 Years and over | 857 (97.2%) | 1,150 (91.4%) |
| Total | 17,871 (91.3%) | 16,613 (88.4%) |
Income Below Poverty Among Married-Couple Families in La Presa
The poverty statistics for married-couple families in La Presa show that 2.3% or 128 of the total 5,532 families live below the poverty line. Families with 3 or 4 children have the highest poverty rate of 7.0%, comprising of 49 families. On the other hand, families with 5 or more children have the lowest poverty rate of 0.0%, which includes 0 families.
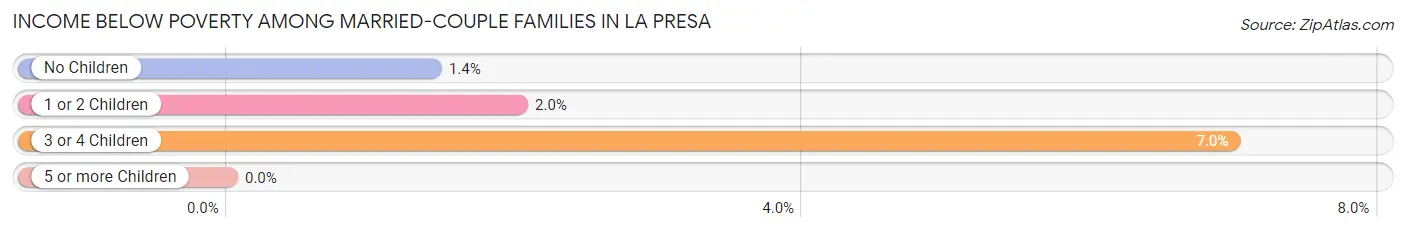
| Children | Above Poverty | Below Poverty |
| No Children | 2,705 (98.6%) | 39 (1.4%) |
| 1 or 2 Children | 1,943 (98.0%) | 40 (2.0%) |
| 3 or 4 Children | 653 (93.0%) | 49 (7.0%) |
| 5 or more Children | 103 (100.0%) | 0 (0.0%) |
| Total | 5,404 (97.7%) | 128 (2.3%) |
Income Below Poverty Among Single-Parent Households in La Presa
According to the poverty data in La Presa, 11.1% or 117 single-father households and 14.4% or 240 single-mother households are living below the poverty line. Among single-father households, those with 1 or 2 children have the highest poverty rate, with 64 households (15.5%) experiencing poverty. Likewise, among single-mother households, those with 3 or 4 children have the highest poverty rate, with 137 households (53.3%) falling below the poverty line.
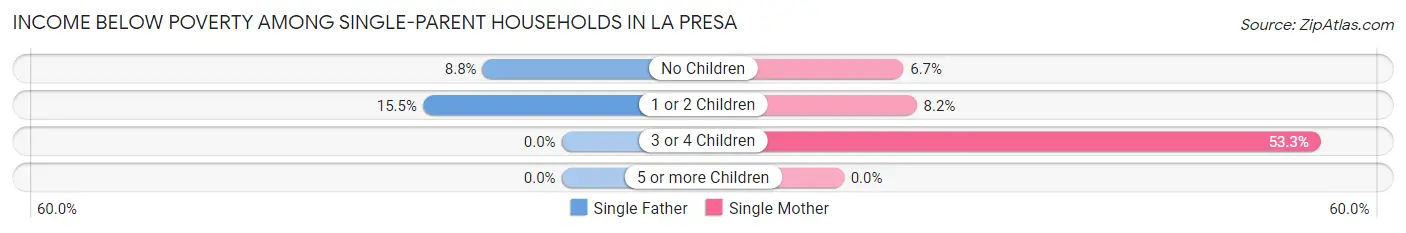
| Children | Single Father | Single Mother |
| No Children | 53 (8.8%) | 54 (6.7%) |
| 1 or 2 Children | 64 (15.5%) | 49 (8.2%) |
| 3 or 4 Children | 0 (0.0%) | 137 (53.3%) |
| 5 or more Children | 0 (0.0%) | 0 (0.0%) |
| Total | 117 (11.1%) | 240 (14.4%) |
Income Below Poverty Among Married-Couple vs Single-Parent Households in La Presa
The poverty data for La Presa shows that 128 of the married-couple family households (2.3%) and 357 of the single-parent households (13.1%) are living below the poverty level. Within the married-couple family households, those with 3 or 4 children have the highest poverty rate, with 49 households (7.0%) falling below the poverty line. Among the single-parent households, those with 3 or 4 children have the highest poverty rate, with 137 household (45.2%) living below poverty.
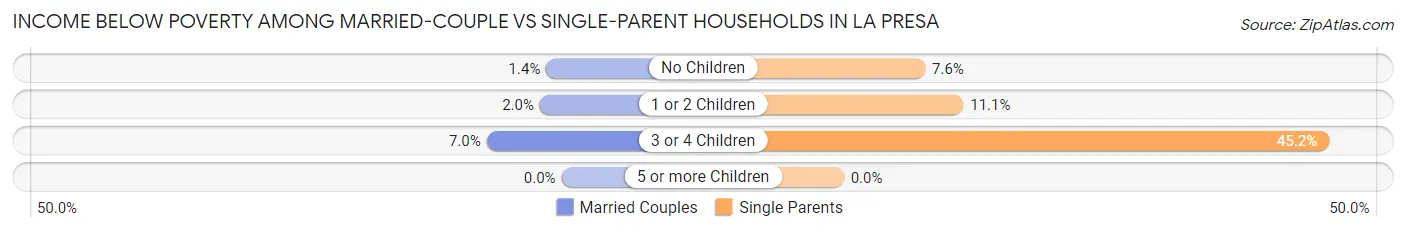
| Children | Married-Couple Families | Single-Parent Households |
| No Children | 39 (1.4%) | 107 (7.6%) |
| 1 or 2 Children | 40 (2.0%) | 113 (11.1%) |
| 3 or 4 Children | 49 (7.0%) | 137 (45.2%) |
| 5 or more Children | 0 (0.0%) | 0 (0.0%) |
| Total | 128 (2.3%) | 357 (13.1%) |
Race in La Presa
The most populous races in La Presa are Hispanic or Latino (18,995 | 49.2%), White / Caucasian (16,207 | 42.0%), and Some other Race (7,863 | 20.4%).

| Race | # Population | % Population |
| Asian | 3,040 | 7.9% |
| Black / African American | 5,270 | 13.7% |
| Hawaiian / Pacific | 35 | 0.1% |
| Hispanic or Latino | 18,995 | 49.2% |
| Native / Alaskan | 597 | 1.5% |
| White / Caucasian | 16,207 | 42.0% |
| Two or more Races | 5,606 | 14.5% |
| Some other Race | 7,863 | 20.4% |
| Total | 38,618 | 100.0% |
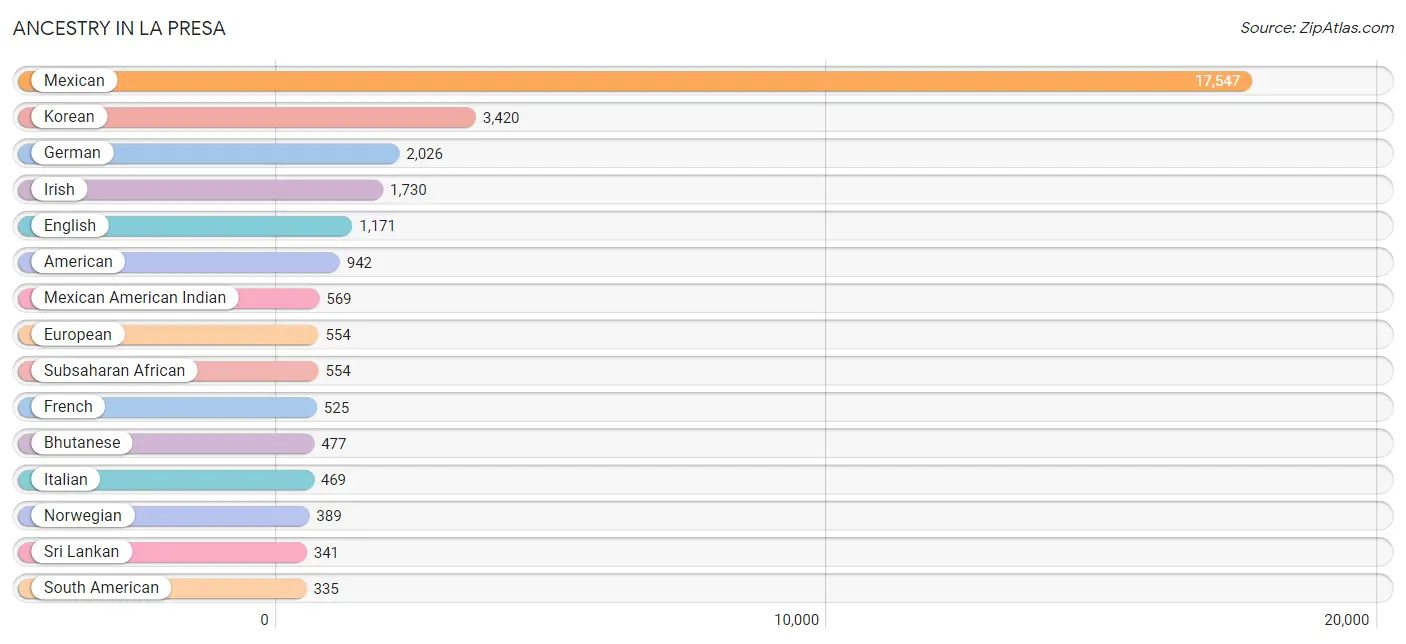
Ancestry in La Presa
The most populous ancestries reported in La Presa are Mexican (17,547 | 45.4%), Korean (3,420 | 8.9%), German (2,026 | 5.2%), Irish (1,730 | 4.5%), and English (1,171 | 3.0%), together accounting for 67.1% of all La Presa residents.
| Ancestry | # Population | % Population |
| African | 209 | 0.5% |
| American | 942 | 2.4% |
| Arab | 327 | 0.9% |
| Armenian | 26 | 0.1% |
| Assyrian / Chaldean / Syriac | 279 | 0.7% |
| Australian | 5 | 0.0% |
| Austrian | 18 | 0.1% |
| Bhutanese | 477 | 1.2% |
| Bolivian | 10 | 0.0% |
| British | 90 | 0.2% |
| Burmese | 105 | 0.3% |
| Cajun | 7 | 0.0% |
| Canadian | 7 | 0.0% |
| Celtic | 7 | 0.0% |
| Central American | 236 | 0.6% |
| Central American Indian | 19 | 0.1% |
| Cherokee | 80 | 0.2% |
| Chilean | 11 | 0.0% |
| Choctaw | 166 | 0.4% |
| Colombian | 10 | 0.0% |
| Comanche | 98 | 0.3% |
| Costa Rican | 5 | 0.0% |
| Croatian | 3 | 0.0% |
| Cuban | 5 | 0.0% |
| Czech | 14 | 0.0% |
| Danish | 41 | 0.1% |
| Dominican | 27 | 0.1% |
| Dutch | 264 | 0.7% |
| Dutch West Indian | 41 | 0.1% |
| Eastern European | 19 | 0.1% |
| Ecuadorian | 44 | 0.1% |
| Egyptian | 21 | 0.1% |
| English | 1,171 | 3.0% |
| Ethiopian | 56 | 0.2% |
| European | 554 | 1.4% |
| Filipino | 14 | 0.0% |
| French | 525 | 1.4% |
| French American Indian | 7 | 0.0% |
| French Canadian | 56 | 0.2% |
| German | 2,026 | 5.2% |
| Greek | 75 | 0.2% |
| Guamanian / Chamorro | 86 | 0.2% |
| Guatemalan | 29 | 0.1% |
| Guyanese | 196 | 0.5% |
| Honduran | 22 | 0.1% |
| Hungarian | 78 | 0.2% |
| Indian (Asian) | 141 | 0.4% |
| Iranian | 164 | 0.4% |
| Iraqi | 278 | 0.7% |
| Irish | 1,730 | 4.5% |
| Iroquois | 28 | 0.1% |
| Italian | 469 | 1.2% |
| Jamaican | 63 | 0.2% |
| Japanese | 62 | 0.2% |
| Korean | 3,420 | 8.9% |
| Laotian | 35 | 0.1% |
| Lithuanian | 11 | 0.0% |
| Malaysian | 59 | 0.2% |
| Mexican | 17,547 | 45.4% |
| Mexican American Indian | 569 | 1.5% |
| Mongolian | 41 | 0.1% |
| Native Hawaiian | 55 | 0.1% |
| Navajo | 41 | 0.1% |
| Nicaraguan | 42 | 0.1% |
| Nigerian | 49 | 0.1% |
| Northern European | 8 | 0.0% |
| Norwegian | 389 | 1.0% |
| Pakistani | 86 | 0.2% |
| Panamanian | 46 | 0.1% |
| Peruvian | 228 | 0.6% |
| Polish | 317 | 0.8% |
| Portuguese | 175 | 0.4% |
| Potawatomi | 15 | 0.0% |
| Puerto Rican | 331 | 0.9% |
| Russian | 90 | 0.2% |
| Salvadoran | 92 | 0.2% |
| Samoan | 55 | 0.1% |
| Scandinavian | 67 | 0.2% |
| Scotch-Irish | 64 | 0.2% |
| Scottish | 104 | 0.3% |
| Sioux | 19 | 0.1% |
| Somali | 223 | 0.6% |
| South American | 335 | 0.9% |
| South American Indian | 7 | 0.0% |
| Spaniard | 68 | 0.2% |
| Spanish | 258 | 0.7% |
| Sri Lankan | 341 | 0.9% |
| Subsaharan African | 554 | 1.4% |
| Swedish | 212 | 0.5% |
| Swiss | 10 | 0.0% |
| Thai | 64 | 0.2% |
| Tongan | 35 | 0.1% |
| Ukrainian | 15 | 0.0% |
| Welsh | 78 | 0.2% |
| West Indian | 11 | 0.0% |
| Yaqui | 36 | 0.1% |
| Yugoslavian | 22 | 0.1% | View All 97 Rows |
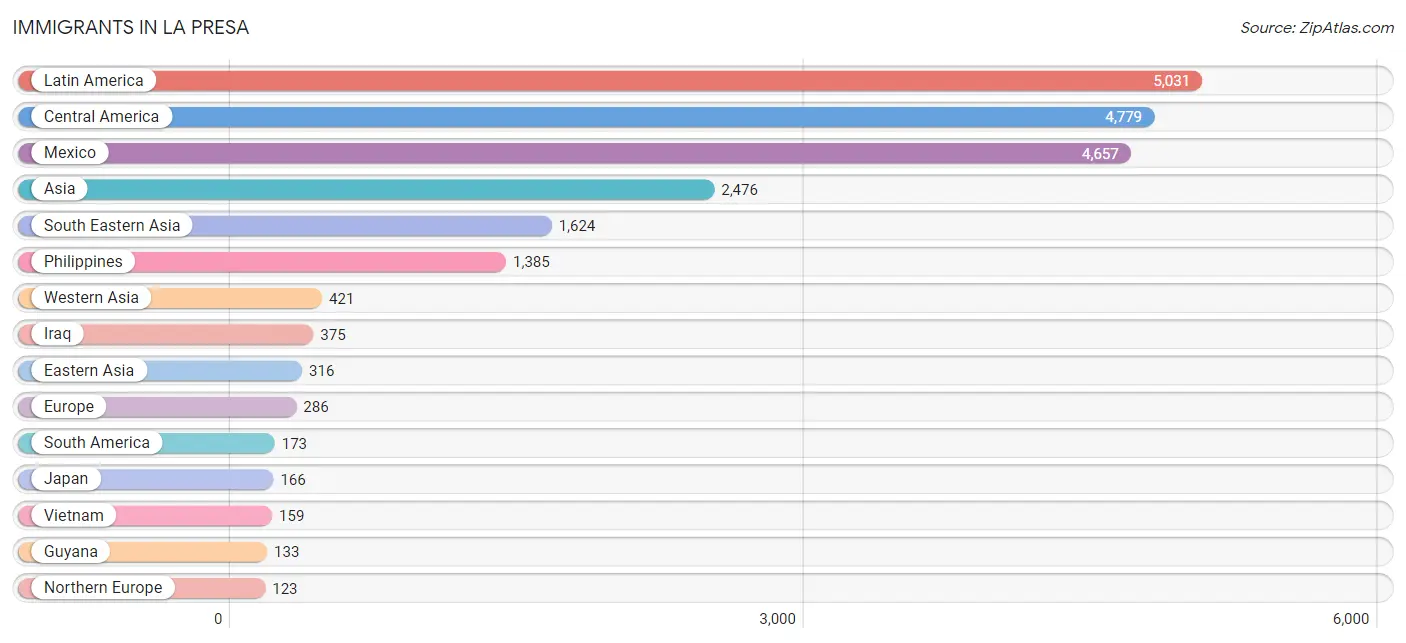
Immigrants in La Presa
The most numerous immigrant groups reported in La Presa came from Latin America (5,031 | 13.0%), Central America (4,779 | 12.4%), Mexico (4,657 | 12.1%), Asia (2,476 | 6.4%), and South Eastern Asia (1,624 | 4.2%), together accounting for 48.1% of all La Presa residents.
| Immigration Origin | # Population | % Population |
| Africa | 55 | 0.1% |
| Asia | 2,476 | 6.4% |
| Belgium | 23 | 0.1% |
| Belize | 43 | 0.1% |
| Brazil | 7 | 0.0% |
| Cambodia | 52 | 0.1% |
| Canada | 12 | 0.0% |
| Caribbean | 79 | 0.2% |
| Central America | 4,779 | 12.4% |
| Chile | 11 | 0.0% |
| China | 102 | 0.3% |
| Colombia | 10 | 0.0% |
| Costa Rica | 5 | 0.0% |
| Dominican Republic | 38 | 0.1% |
| Eastern Africa | 29 | 0.1% |
| Eastern Asia | 316 | 0.8% |
| El Salvador | 51 | 0.1% |
| England | 73 | 0.2% |
| Ethiopia | 17 | 0.0% |
| Europe | 286 | 0.7% |
| Germany | 34 | 0.1% |
| Guyana | 133 | 0.3% |
| Honduras | 23 | 0.1% |
| Iran | 115 | 0.3% |
| Iraq | 375 | 1.0% |
| Ireland | 35 | 0.1% |
| Israel | 6 | 0.0% |
| Italy | 11 | 0.0% |
| Jamaica | 25 | 0.1% |
| Japan | 166 | 0.4% |
| Korea | 48 | 0.1% |
| Laos | 28 | 0.1% |
| Latin America | 5,031 | 13.0% |
| Mexico | 4,657 | 12.1% |
| Netherlands | 15 | 0.0% |
| Nigeria | 13 | 0.0% |
| Northern Europe | 123 | 0.3% |
| Peru | 12 | 0.0% |
| Philippines | 1,385 | 3.6% |
| Portugal | 45 | 0.1% |
| Saudi Arabia | 3 | 0.0% |
| South Africa | 13 | 0.0% |
| South America | 173 | 0.4% |
| South Central Asia | 115 | 0.3% |
| South Eastern Asia | 1,624 | 4.2% |
| Southern Europe | 91 | 0.2% |
| Spain | 35 | 0.1% |
| Taiwan | 52 | 0.1% |
| Trinidad and Tobago | 16 | 0.0% |
| Vietnam | 159 | 0.4% |
| Western Africa | 13 | 0.0% |
| Western Asia | 421 | 1.1% |
| Western Europe | 72 | 0.2% | View All 53 Rows |
Sex and Age in La Presa
Sex and Age in La Presa
The most populous age groups in La Presa are 25 to 29 Years (1,840 | 9.3%) for men and 25 to 29 Years (1,542 | 8.2%) for women.
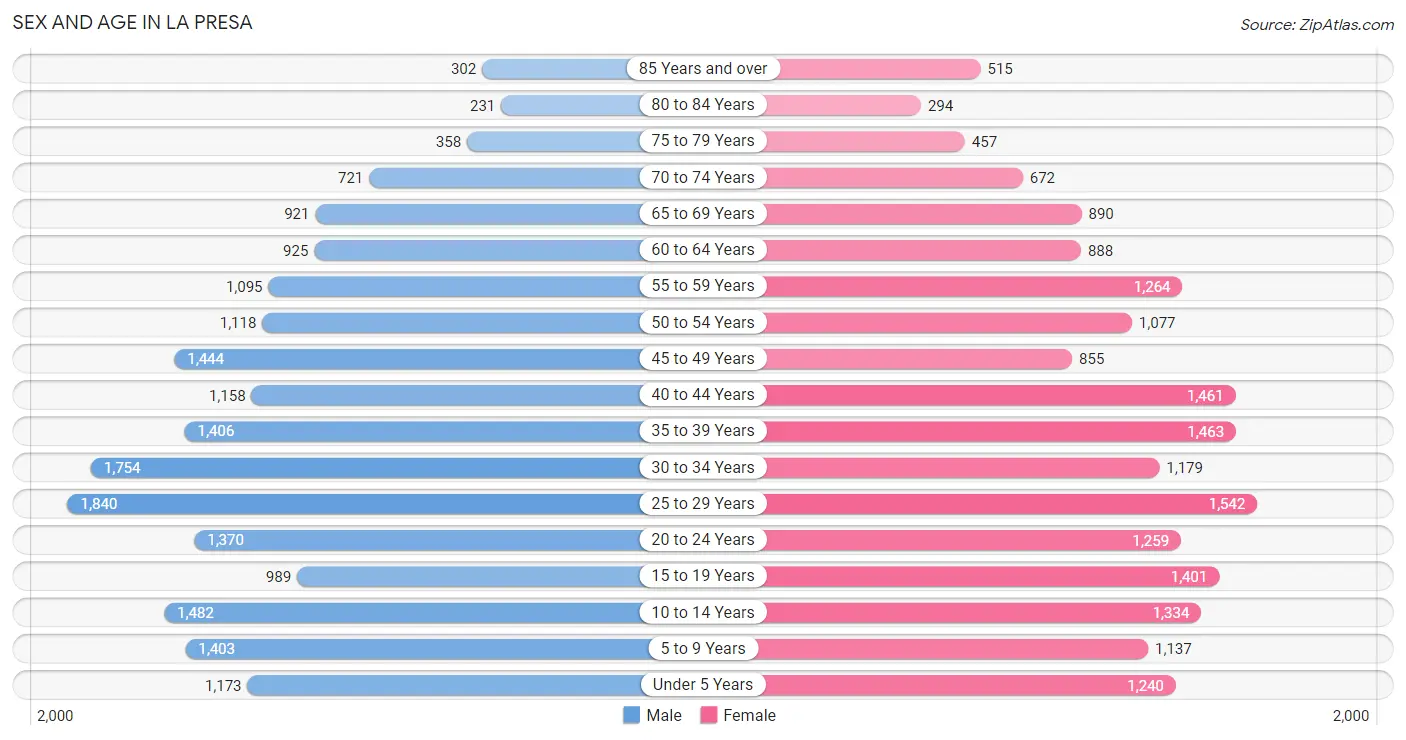
| Age Bracket | Male | Female |
| Under 5 Years | 1,173 (6.0%) | 1,240 (6.6%) |
| 5 to 9 Years | 1,403 (7.1%) | 1,137 (6.0%) |
| 10 to 14 Years | 1,482 (7.5%) | 1,334 (7.0%) |
| 15 to 19 Years | 989 (5.0%) | 1,401 (7.4%) |
| 20 to 24 Years | 1,370 (7.0%) | 1,259 (6.7%) |
| 25 to 29 Years | 1,840 (9.3%) | 1,542 (8.2%) |
| 30 to 34 Years | 1,754 (8.9%) | 1,179 (6.2%) |
| 35 to 39 Years | 1,406 (7.1%) | 1,463 (7.7%) |
| 40 to 44 Years | 1,158 (5.9%) | 1,461 (7.7%) |
| 45 to 49 Years | 1,444 (7.3%) | 855 (4.5%) |
| 50 to 54 Years | 1,118 (5.7%) | 1,077 (5.7%) |
| 55 to 59 Years | 1,095 (5.6%) | 1,264 (6.7%) |
| 60 to 64 Years | 925 (4.7%) | 888 (4.7%) |
| 65 to 69 Years | 921 (4.7%) | 890 (4.7%) |
| 70 to 74 Years | 721 (3.7%) | 672 (3.5%) |
| 75 to 79 Years | 358 (1.8%) | 457 (2.4%) |
| 80 to 84 Years | 231 (1.2%) | 294 (1.5%) |
| 85 Years and over | 302 (1.5%) | 515 (2.7%) |
| Total | 19,690 (100.0%) | 18,928 (100.0%) |
Families and Households in La Presa
Median Family Size in La Presa
The median family size in La Presa is 3.87 persons per family, with married-couple families (5,532 | 67.0%) accounting for the largest median family size of 4.1 persons per family. On the other hand, single male/father families (1,059 | 12.8%) represent the smallest median family size with 3.41 persons per family.
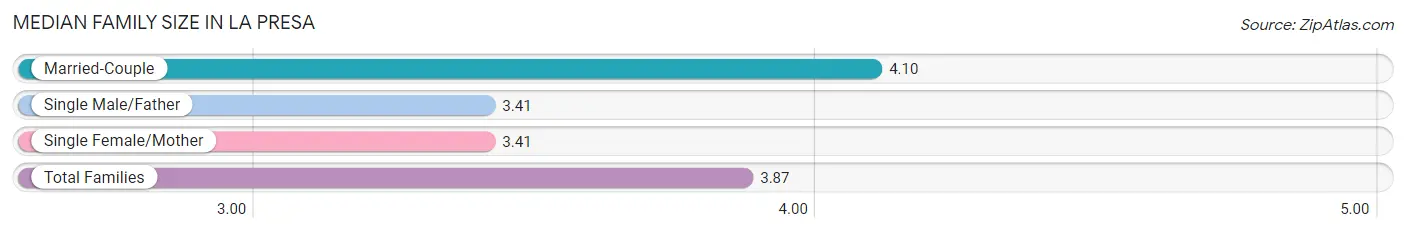
| Family Type | # Families | Family Size |
| Married-Couple | 5,532 (67.0%) | 4.10 |
| Single Male/Father | 1,059 (12.8%) | 3.41 |
| Single Female/Mother | 1,669 (20.2%) | 3.41 |
| Total Families | 8,260 (100.0%) | 3.87 |
Median Household Size in La Presa
The median household size in La Presa is 3.37 persons per household, with married-couple households (5,532 | 48.8%) accounting for the largest median household size of 4.19 persons per household. non-family households (3,070 | 27.1%) represent the smallest median household size with 1.48 persons per household.
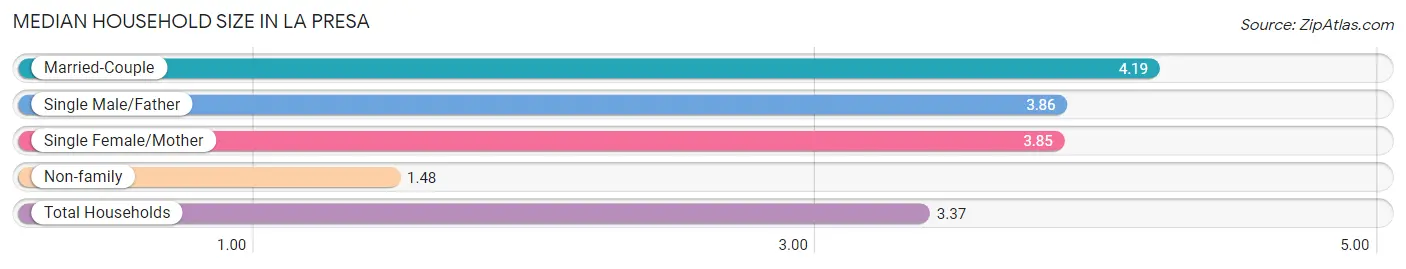
| Household Type | # Households | Household Size |
| Married-Couple | 5,532 (48.8%) | 4.19 |
| Single Male/Father | 1,059 (9.3%) | 3.86 |
| Single Female/Mother | 1,669 (14.7%) | 3.85 |
| Non-family | 3,070 (27.1%) | 1.48 |
| Total Households | 11,330 (100.0%) | 3.37 |
Household Size by Marriage Status in La Presa
Out of a total of 11,330 households in La Presa, 8,260 (72.9%) are family households, while 3,070 (27.1%) are nonfamily households. The most numerous type of family households are 4-person households, comprising 2,150, and the most common type of nonfamily households are 1-person households, comprising 2,256.
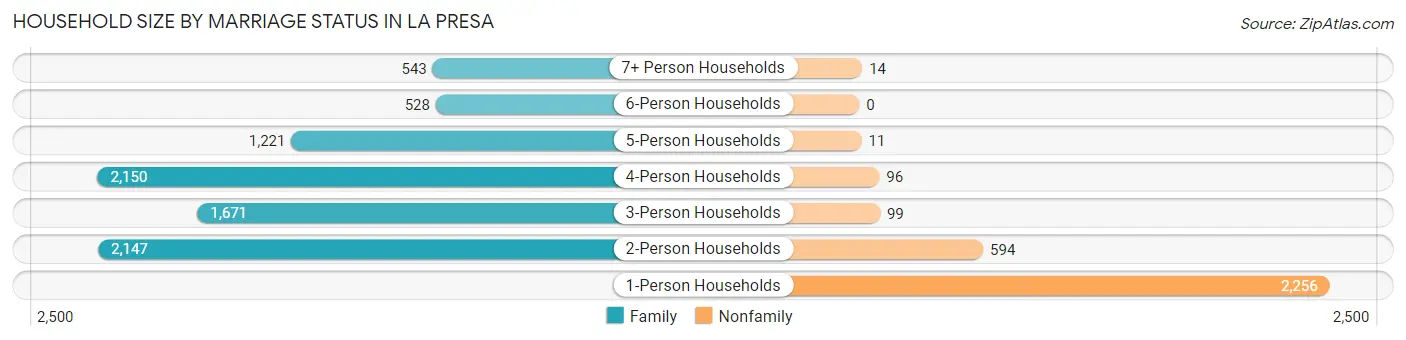
| Household Size | Family Households | Nonfamily Households |
| 1-Person Households | - | 2,256 (19.9%) |
| 2-Person Households | 2,147 (19.0%) | 594 (5.2%) |
| 3-Person Households | 1,671 (14.7%) | 99 (0.9%) |
| 4-Person Households | 2,150 (19.0%) | 96 (0.9%) |
| 5-Person Households | 1,221 (10.8%) | 11 (0.1%) |
| 6-Person Households | 528 (4.7%) | 0 (0.0%) |
| 7+ Person Households | 543 (4.8%) | 14 (0.1%) |
| Total | 8,260 (72.9%) | 3,070 (27.1%) |
Female Fertility in La Presa
Fertility by Age in La Presa
Average fertility rate in La Presa is 54.0 births per 1,000 women. Women in the age bracket of 20 to 34 years have the highest fertility rate with 83.0 births per 1,000 women. Women in the age bracket of 20 to 34 years acount for 64.6% of all women with births.
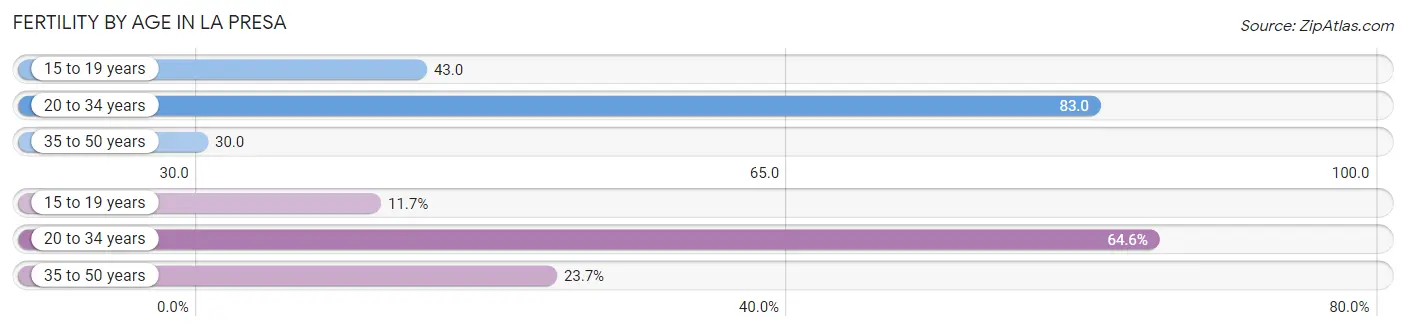
| Age Bracket | Women with Births | Births / 1,000 Women |
| 15 to 19 years | 60 (11.7%) | 43.0 |
| 20 to 34 years | 330 (64.6%) | 83.0 |
| 35 to 50 years | 121 (23.7%) | 30.0 |
| Total | 511 (100.0%) | 54.0 |
Fertility by Age by Marriage Status in La Presa
55.2% of women with births (511) in La Presa are married. The highest percentage of unmarried women with births falls into 15 to 19 years age bracket with 76.7% of them unmarried at the time of birth, while the lowest percentage of unmarried women with births belong to 20 to 34 years age bracket with 36.7% of them unmarried.
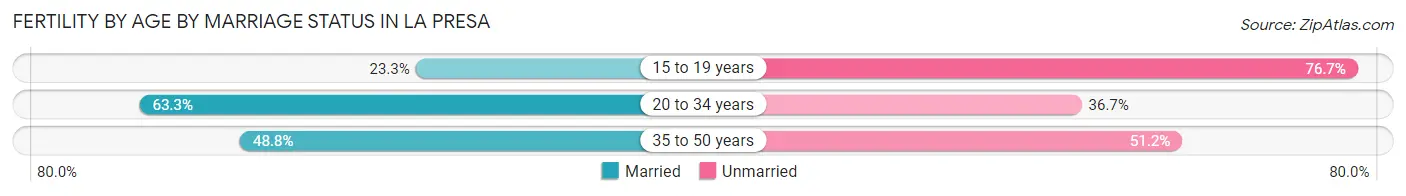
| Age Bracket | Married | Unmarried |
| 15 to 19 years | 14 (23.3%) | 46 (76.7%) |
| 20 to 34 years | 209 (63.3%) | 121 (36.7%) |
| 35 to 50 years | 59 (48.8%) | 62 (51.2%) |
| Total | 282 (55.2%) | 229 (44.8%) |
Fertility by Education in La Presa
Average fertility rate in La Presa is 54.0 births per 1,000 women. Women with the education attainment of college or associate's degree have the highest fertility rate of 74.0 births per 1,000 women, while women with the education attainment of high school diploma have the lowest fertility at 28.0 births per 1,000 women. Women with the education attainment of college or associate's degree represent 46.6% of all women with births.
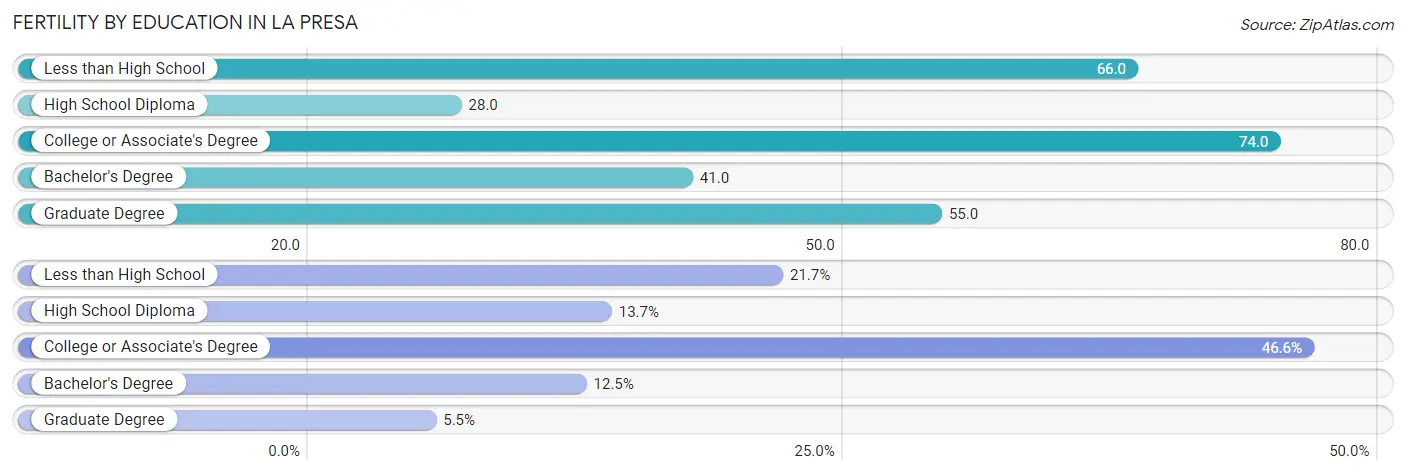
| Educational Attainment | Women with Births | Births / 1,000 Women |
| Less than High School | 111 (21.7%) | 66.0 |
| High School Diploma | 70 (13.7%) | 28.0 |
| College or Associate's Degree | 238 (46.6%) | 74.0 |
| Bachelor's Degree | 64 (12.5%) | 41.0 |
| Graduate Degree | 28 (5.5%) | 55.0 |
| Total | 511 (100.0%) | 54.0 |
Fertility by Education by Marriage Status in La Presa
44.8% of women with births in La Presa are unmarried. Women with the educational attainment of graduate degree are most likely to be married with 100.0% of them married at childbirth, while women with the educational attainment of college or associate's degree are least likely to be married with 58.4% of them unmarried at childbirth.
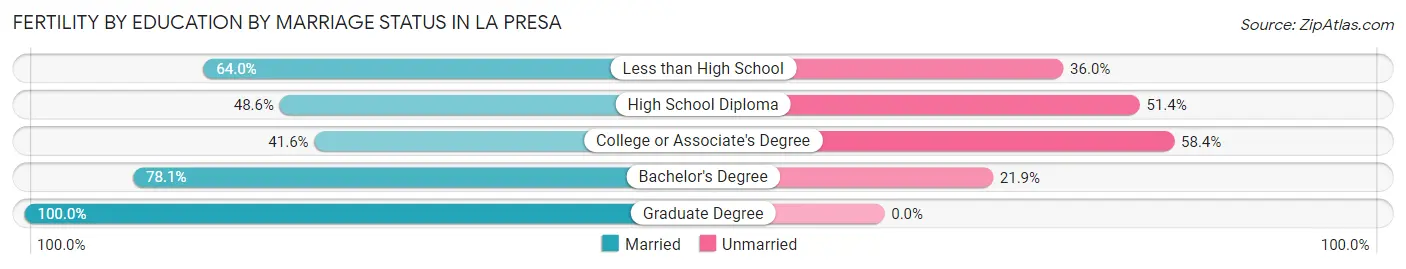
| Educational Attainment | Married | Unmarried |
| Less than High School | 71 (64.0%) | 40 (36.0%) |
| High School Diploma | 34 (48.6%) | 36 (51.4%) |
| College or Associate's Degree | 99 (41.6%) | 139 (58.4%) |
| Bachelor's Degree | 50 (78.1%) | 14 (21.9%) |
| Graduate Degree | 28 (100.0%) | 0 (0.0%) |
| Total | 282 (55.2%) | 229 (44.8%) |
Employment Characteristics in La Presa
Employment by Class of Employer in La Presa
Among the 17,124 employed individuals in La Presa, private company employees (11,206 | 65.4%), federal government employees (1,633 | 9.5%), and local government employees (1,393 | 8.1%) make up the most common classes of employment.
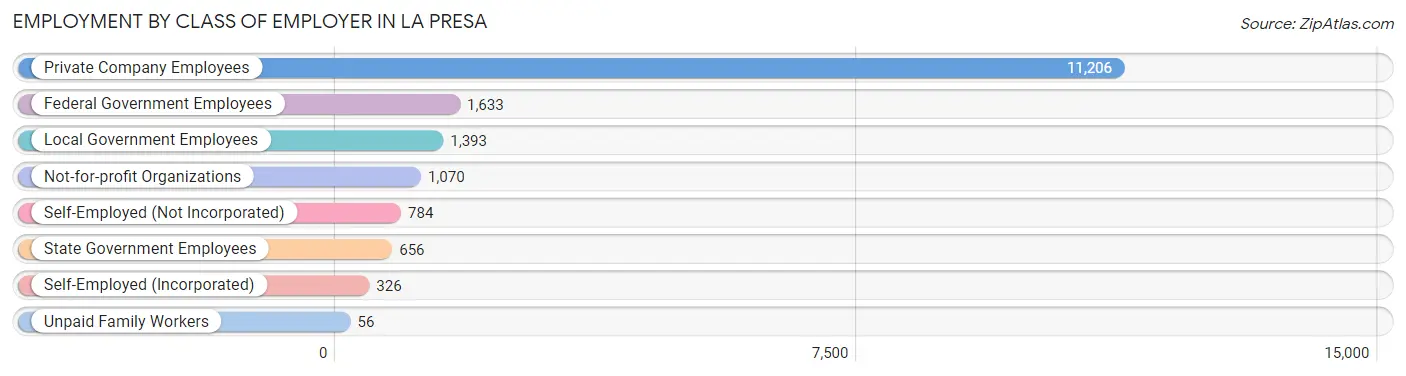
| Employer Class | # Employees | % Employees |
| Private Company Employees | 11,206 | 65.4% |
| Self-Employed (Incorporated) | 326 | 1.9% |
| Self-Employed (Not Incorporated) | 784 | 4.6% |
| Not-for-profit Organizations | 1,070 | 6.2% |
| Local Government Employees | 1,393 | 8.1% |
| State Government Employees | 656 | 3.8% |
| Federal Government Employees | 1,633 | 9.5% |
| Unpaid Family Workers | 56 | 0.3% |
| Total | 17,124 | 100.0% |
Employment Status by Age in La Presa
According to the labor force statistics for La Presa, out of the total population over 16 years of age (30,330), 63.2% or 19,169 individuals are in the labor force, with 8.7% or 1,668 of them unemployed. The age group with the highest labor force participation rate is 30 to 34 years, with 82.1% or 2,408 individuals in the labor force. Within the labor force, the 16 to 19 years age range has the highest percentage of unemployed individuals, with 31.8% or 190 of them being unemployed.
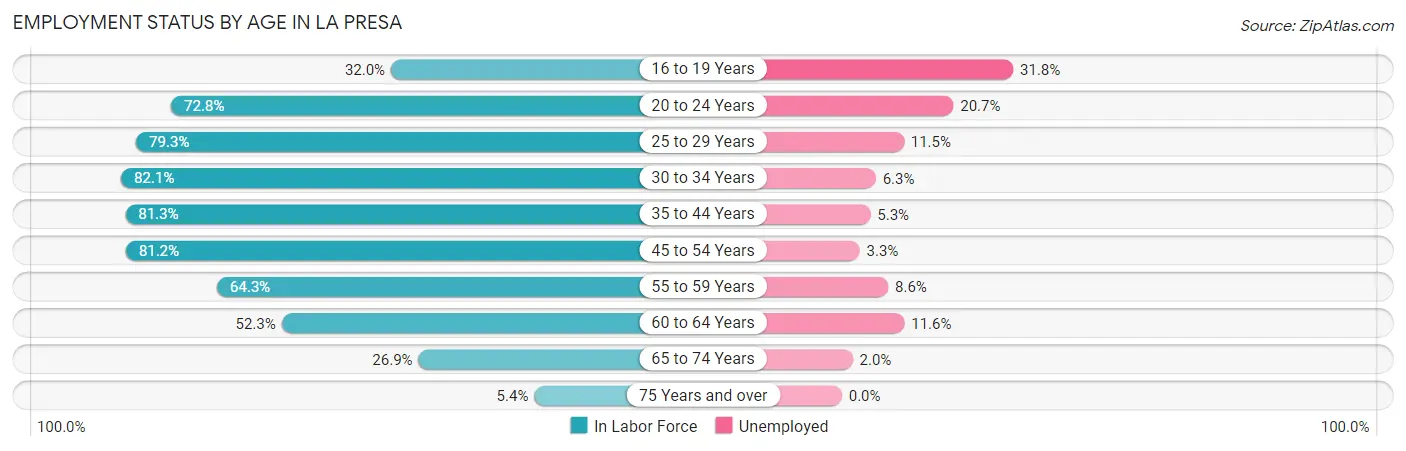
| Age Bracket | In Labor Force | Unemployed |
| 16 to 19 Years | 599 (32.0%) | 190 (31.8%) |
| 20 to 24 Years | 1,914 (72.8%) | 396 (20.7%) |
| 25 to 29 Years | 2,682 (79.3%) | 308 (11.5%) |
| 30 to 34 Years | 2,408 (82.1%) | 152 (6.3%) |
| 35 to 44 Years | 4,462 (81.3%) | 236 (5.3%) |
| 45 to 54 Years | 3,649 (81.2%) | 120 (3.3%) |
| 55 to 59 Years | 1,517 (64.3%) | 130 (8.6%) |
| 60 to 64 Years | 948 (52.3%) | 110 (11.6%) |
| 65 to 74 Years | 862 (26.9%) | 17 (2.0%) |
| 75 Years and over | 116 (5.4%) | 0 (0.0%) |
| Total | 19,169 (63.2%) | 1,668 (8.7%) |
Employment Status by Educational Attainment in La Presa
According to labor force statistics for La Presa, 76.5% of individuals (15,659) out of the total population between 25 and 64 years of age (20,469) are in the labor force, with 6.8% or 1,065 of them being unemployed. The group with the highest labor force participation rate are those with the educational attainment of bachelor's degree or higher, with 90.2% or 4,258 individuals in the labor force. Within the labor force, individuals with less than high school education have the highest percentage of unemployment, with 13.7% or 240 of them being unemployed.
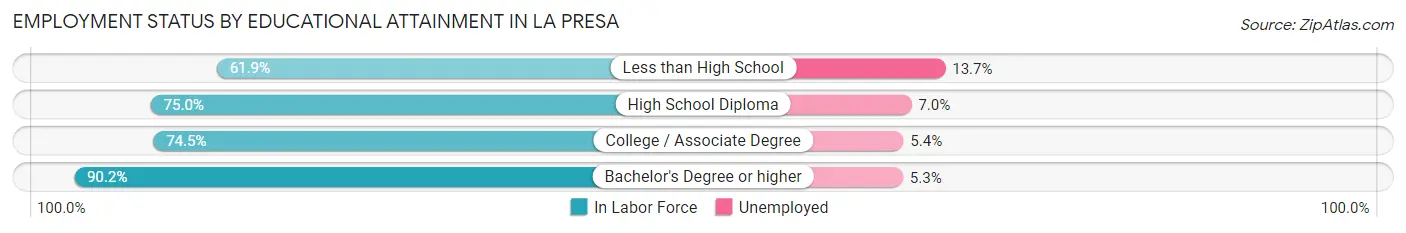
| Educational Attainment | In Labor Force | Unemployed |
| Less than High School | 1,751 (61.9%) | 388 (13.7%) |
| High School Diploma | 4,109 (75.0%) | 384 (7.0%) |
| College / Associate Degree | 5,543 (74.5%) | 402 (5.4%) |
| Bachelor's Degree or higher | 4,258 (90.2%) | 250 (5.3%) |
| Total | 15,659 (76.5%) | 1,392 (6.8%) |
Employment Occupations by Sex in La Presa
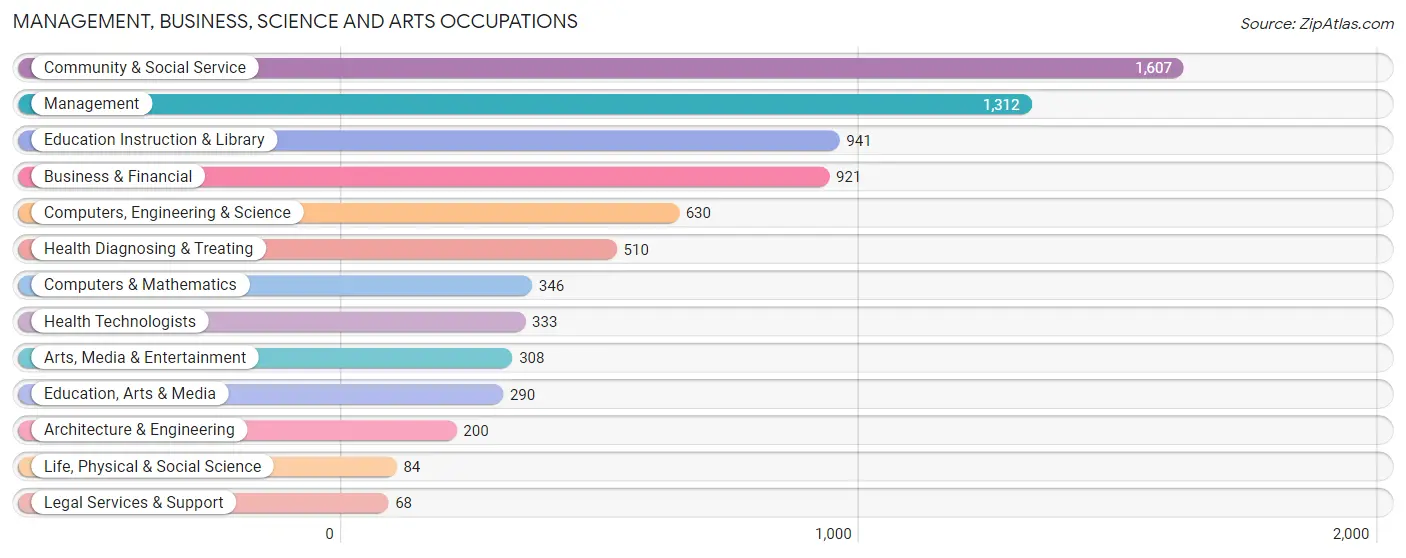
Management, Business, Science and Arts Occupations
The most common Management, Business, Science and Arts occupations in La Presa are Community & Social Service (1,607 | 9.5%), Management (1,312 | 7.8%), Education Instruction & Library (941 | 5.6%), Business & Financial (921 | 5.5%), and Computers, Engineering & Science (630 | 3.7%).
Management, Business, Science and Arts Occupations by Sex
Within the Management, Business, Science and Arts occupations in La Presa, the most male-oriented occupations are Computers & Mathematics (84.4%), Architecture & Engineering (79.5%), and Computers, Engineering & Science (75.2%), while the most female-oriented occupations are Legal Services & Support (80.9%), Health Technologists (76.3%), and Health Diagnosing & Treating (75.7%).
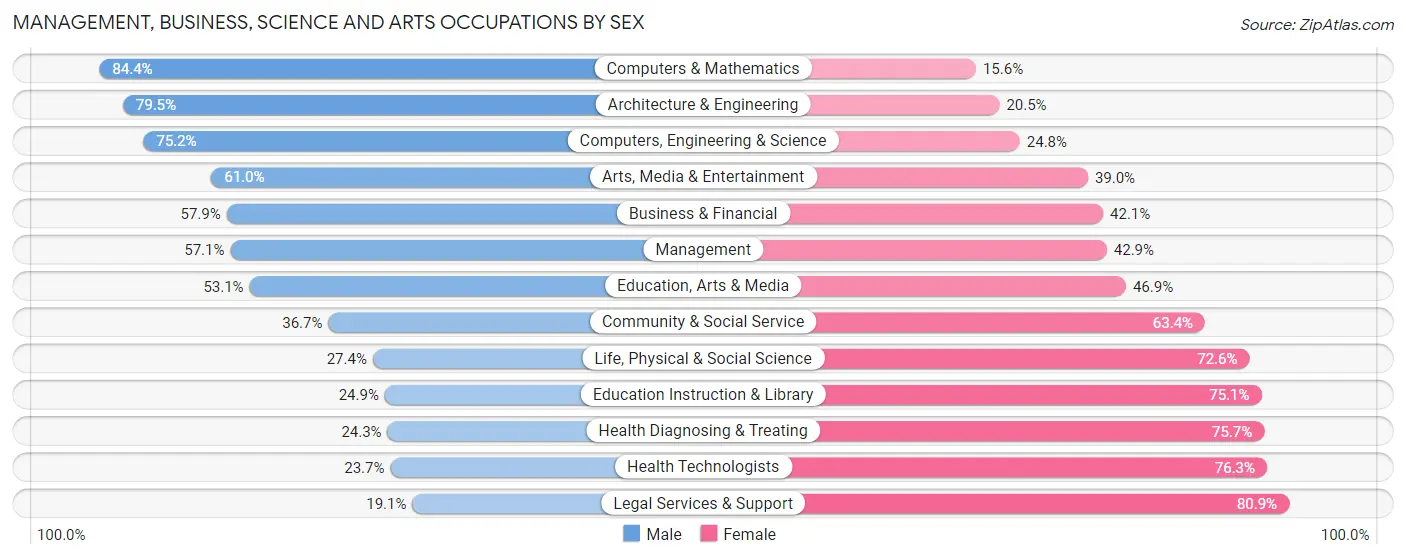
| Occupation | Male | Female |
| Management | 749 (57.1%) | 563 (42.9%) |
| Business & Financial | 533 (57.9%) | 388 (42.1%) |
| Computers, Engineering & Science | 474 (75.2%) | 156 (24.8%) |
| Computers & Mathematics | 292 (84.4%) | 54 (15.6%) |
| Architecture & Engineering | 159 (79.5%) | 41 (20.5%) |
| Life, Physical & Social Science | 23 (27.4%) | 61 (72.6%) |
| Community & Social Service | 589 (36.6%) | 1,018 (63.3%) |
| Education, Arts & Media | 154 (53.1%) | 136 (46.9%) |
| Legal Services & Support | 13 (19.1%) | 55 (80.9%) |
| Education Instruction & Library | 234 (24.9%) | 707 (75.1%) |
| Arts, Media & Entertainment | 188 (61.0%) | 120 (39.0%) |
| Health Diagnosing & Treating | 124 (24.3%) | 386 (75.7%) |
| Health Technologists | 79 (23.7%) | 254 (76.3%) |
| Total (Category) | 2,469 (49.6%) | 2,511 (50.4%) |
| Total (Overall) | 9,320 (55.2%) | 7,552 (44.8%) |
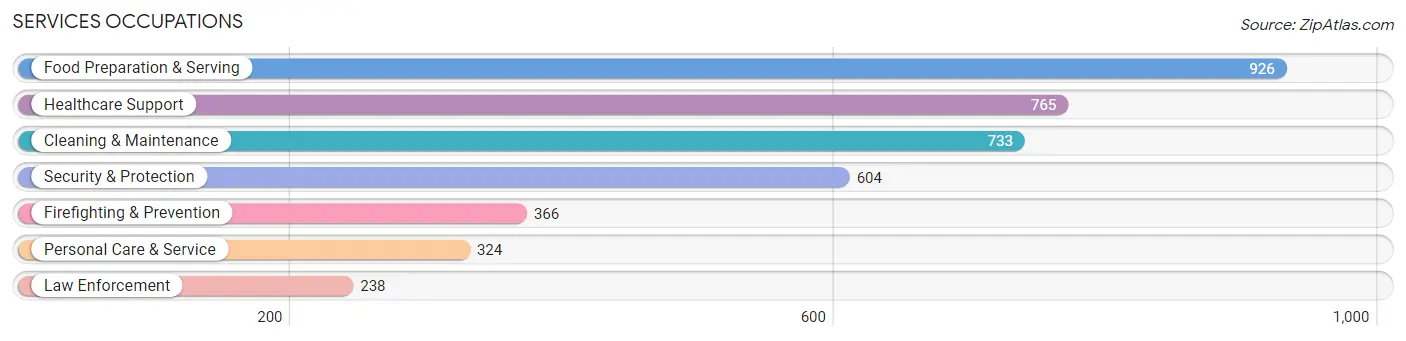
Services Occupations
The most common Services occupations in La Presa are Food Preparation & Serving (926 | 5.5%), Healthcare Support (765 | 4.5%), Cleaning & Maintenance (733 | 4.3%), Security & Protection (604 | 3.6%), and Firefighting & Prevention (366 | 2.2%).
Services Occupations by Sex
Within the Services occupations in La Presa, the most male-oriented occupations are Law Enforcement (66.8%), Food Preparation & Serving (64.7%), and Security & Protection (63.2%), while the most female-oriented occupations are Healthcare Support (82.6%), Personal Care & Service (62.4%), and Cleaning & Maintenance (47.3%).
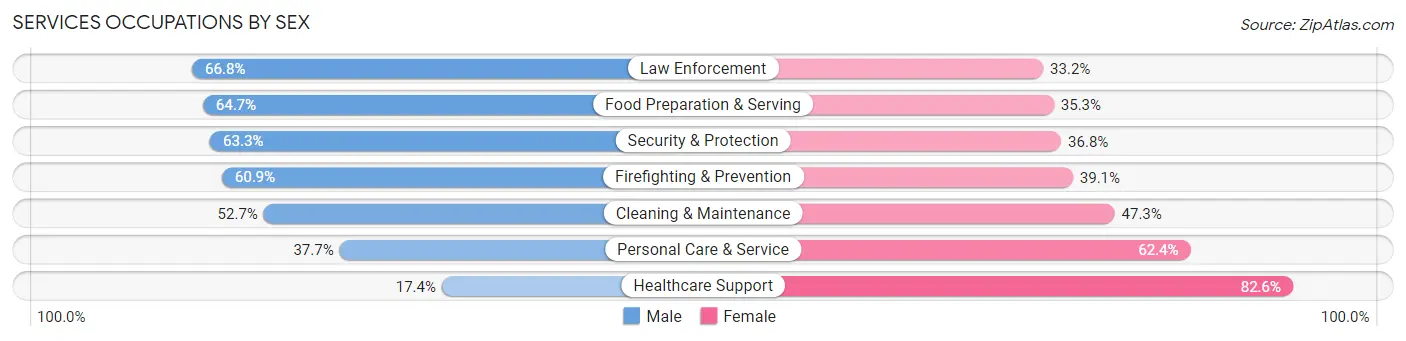
| Occupation | Male | Female |
| Healthcare Support | 133 (17.4%) | 632 (82.6%) |
| Security & Protection | 382 (63.2%) | 222 (36.7%) |
| Firefighting & Prevention | 223 (60.9%) | 143 (39.1%) |
| Law Enforcement | 159 (66.8%) | 79 (33.2%) |
| Food Preparation & Serving | 599 (64.7%) | 327 (35.3%) |
| Cleaning & Maintenance | 386 (52.7%) | 347 (47.3%) |
| Personal Care & Service | 122 (37.7%) | 202 (62.4%) |
| Total (Category) | 1,622 (48.4%) | 1,730 (51.6%) |
| Total (Overall) | 9,320 (55.2%) | 7,552 (44.8%) |
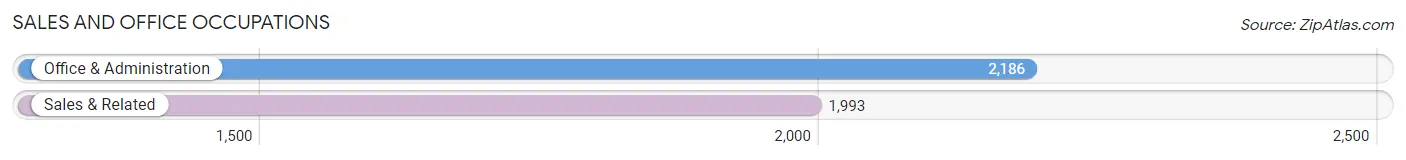
Sales and Office Occupations
The most common Sales and Office occupations in La Presa are Office & Administration (2,186 | 13.0%), and Sales & Related (1,993 | 11.8%).
Sales and Office Occupations by Sex
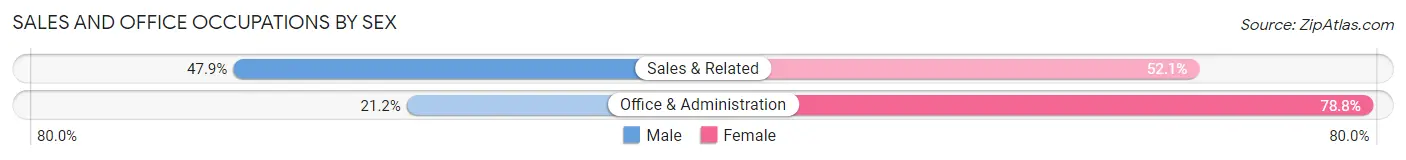
| Occupation | Male | Female |
| Sales & Related | 955 (47.9%) | 1,038 (52.1%) |
| Office & Administration | 464 (21.2%) | 1,722 (78.8%) |
| Total (Category) | 1,419 (34.0%) | 2,760 (66.0%) |
| Total (Overall) | 9,320 (55.2%) | 7,552 (44.8%) |
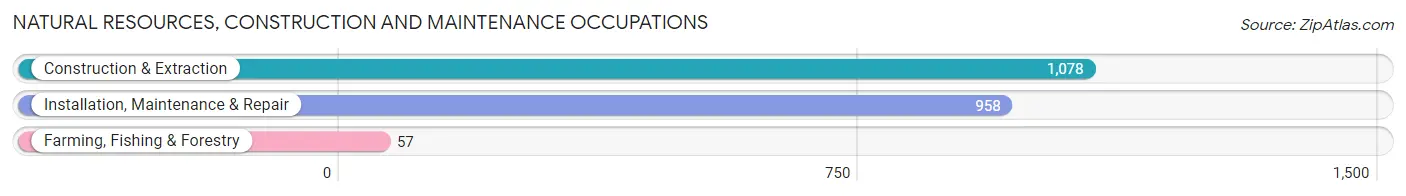
Natural Resources, Construction and Maintenance Occupations
The most common Natural Resources, Construction and Maintenance occupations in La Presa are Construction & Extraction (1,078 | 6.4%), Installation, Maintenance & Repair (958 | 5.7%), and Farming, Fishing & Forestry (57 | 0.3%).
Natural Resources, Construction and Maintenance Occupations by Sex
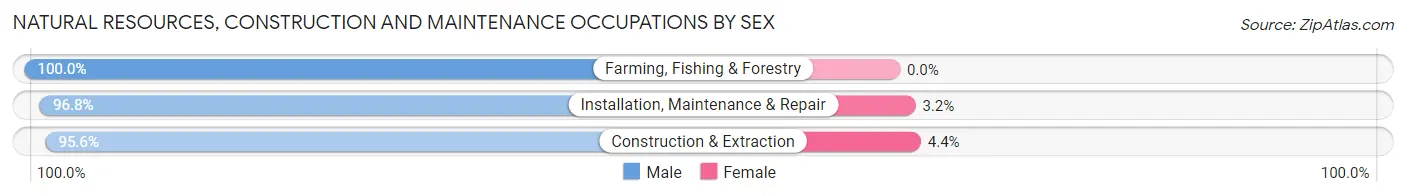
| Occupation | Male | Female |
| Farming, Fishing & Forestry | 57 (100.0%) | 0 (0.0%) |
| Construction & Extraction | 1,031 (95.6%) | 47 (4.4%) |
| Installation, Maintenance & Repair | 927 (96.8%) | 31 (3.2%) |
| Total (Category) | 2,015 (96.3%) | 78 (3.7%) |
| Total (Overall) | 9,320 (55.2%) | 7,552 (44.8%) |
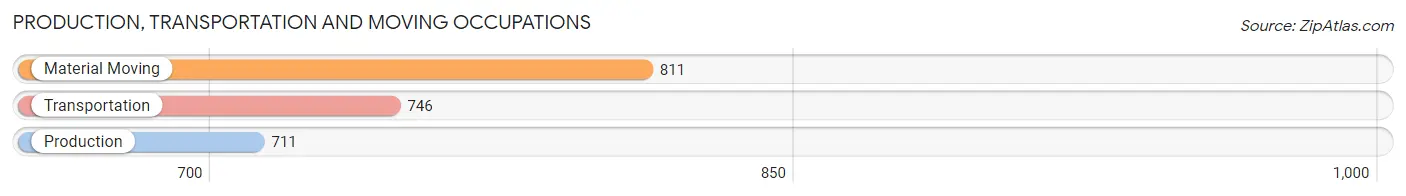
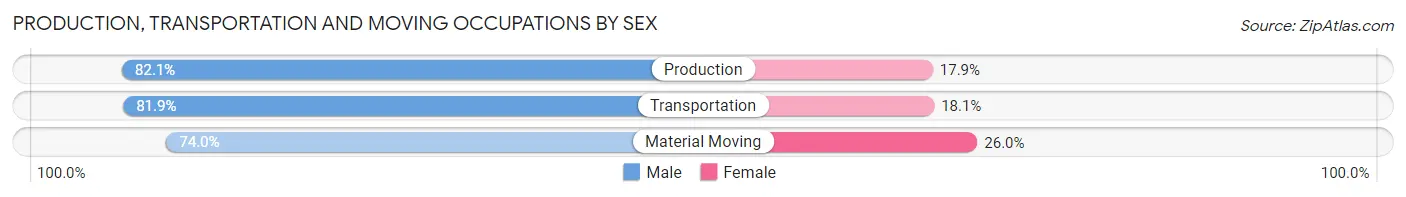
Production, Transportation and Moving Occupations
The most common Production, Transportation and Moving occupations in La Presa are Material Moving (811 | 4.8%), Transportation (746 | 4.4%), and Production (711 | 4.2%).
Production, Transportation and Moving Occupations by Sex
| Occupation | Male | Female |
| Production | 584 (82.1%) | 127 (17.9%) |
| Transportation | 611 (81.9%) | 135 (18.1%) |
| Material Moving | 600 (74.0%) | 211 (26.0%) |
| Total (Category) | 1,795 (79.1%) | 473 (20.9%) |
| Total (Overall) | 9,320 (55.2%) | 7,552 (44.8%) |
Employment Industries by Sex in La Presa
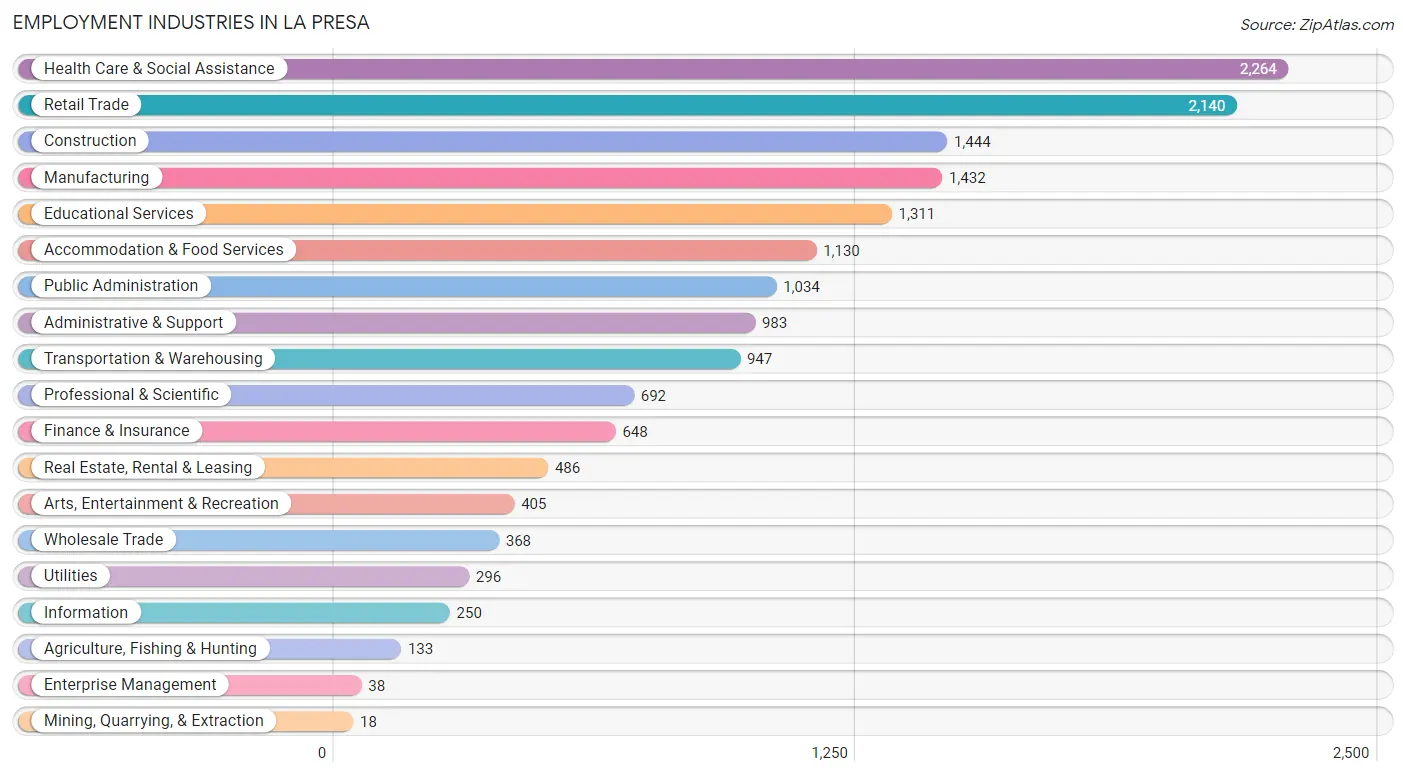
Employment Industries in La Presa
The major employment industries in La Presa include Health Care & Social Assistance (2,264 | 13.4%), Retail Trade (2,140 | 12.7%), Construction (1,444 | 8.6%), Manufacturing (1,432 | 8.5%), and Educational Services (1,311 | 7.8%).
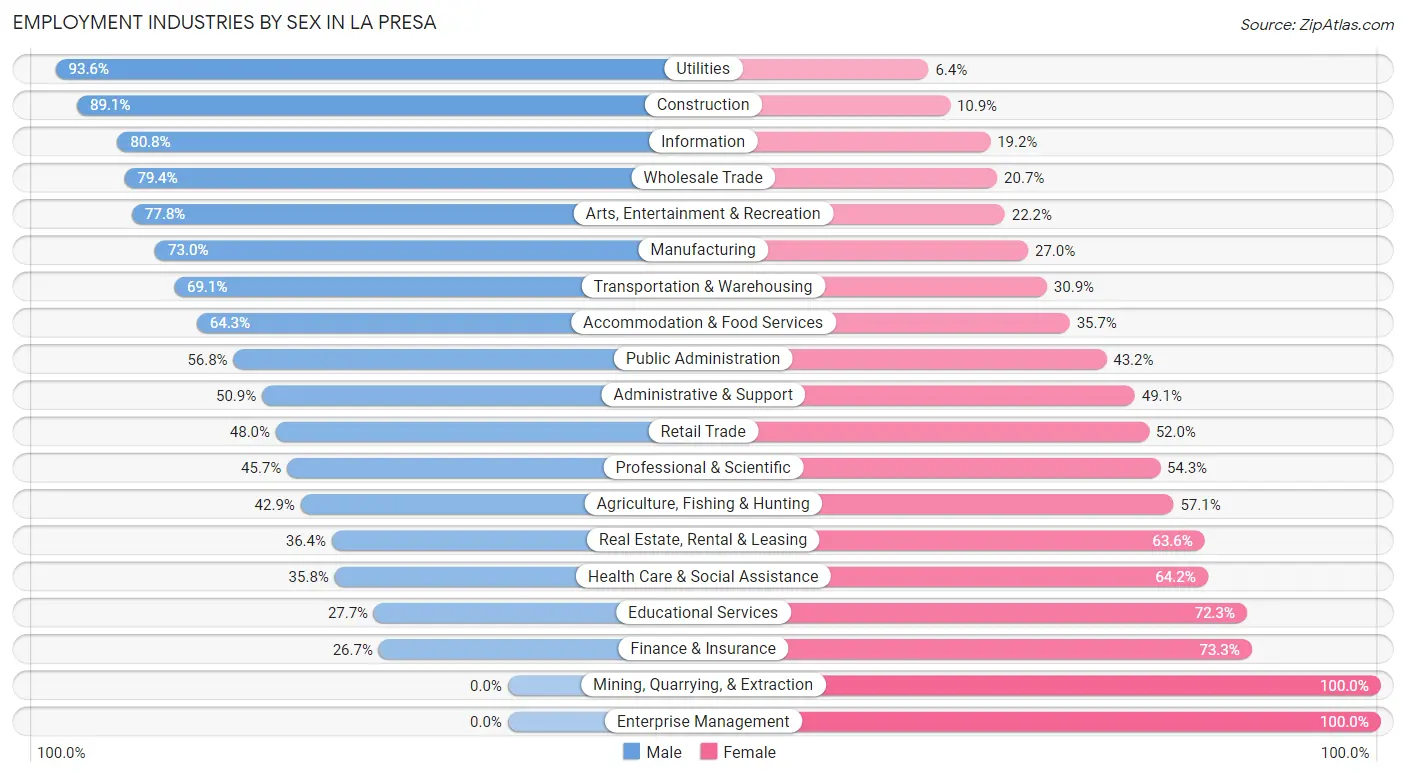
Employment Industries by Sex in La Presa
The La Presa industries that see more men than women are Utilities (93.6%), Construction (89.1%), and Information (80.8%), whereas the industries that tend to have a higher number of women are Mining, Quarrying, & Extraction (100.0%), Enterprise Management (100.0%), and Finance & Insurance (73.3%).
| Industry | Male | Female |
| Agriculture, Fishing & Hunting | 57 (42.9%) | 76 (57.1%) |
| Mining, Quarrying, & Extraction | 0 (0.0%) | 18 (100.0%) |
| Construction | 1,287 (89.1%) | 157 (10.9%) |
| Manufacturing | 1,045 (73.0%) | 387 (27.0%) |
| Wholesale Trade | 292 (79.3%) | 76 (20.6%) |
| Retail Trade | 1,027 (48.0%) | 1,113 (52.0%) |
| Transportation & Warehousing | 654 (69.1%) | 293 (30.9%) |
| Utilities | 277 (93.6%) | 19 (6.4%) |
| Information | 202 (80.8%) | 48 (19.2%) |
| Finance & Insurance | 173 (26.7%) | 475 (73.3%) |
| Real Estate, Rental & Leasing | 177 (36.4%) | 309 (63.6%) |
| Professional & Scientific | 316 (45.7%) | 376 (54.3%) |
| Enterprise Management | 0 (0.0%) | 38 (100.0%) |
| Administrative & Support | 500 (50.9%) | 483 (49.1%) |
| Educational Services | 363 (27.7%) | 948 (72.3%) |
| Health Care & Social Assistance | 811 (35.8%) | 1,453 (64.2%) |
| Arts, Entertainment & Recreation | 315 (77.8%) | 90 (22.2%) |
| Accommodation & Food Services | 727 (64.3%) | 403 (35.7%) |
| Public Administration | 587 (56.8%) | 447 (43.2%) |
| Total | 9,320 (55.2%) | 7,552 (44.8%) |
Education in La Presa
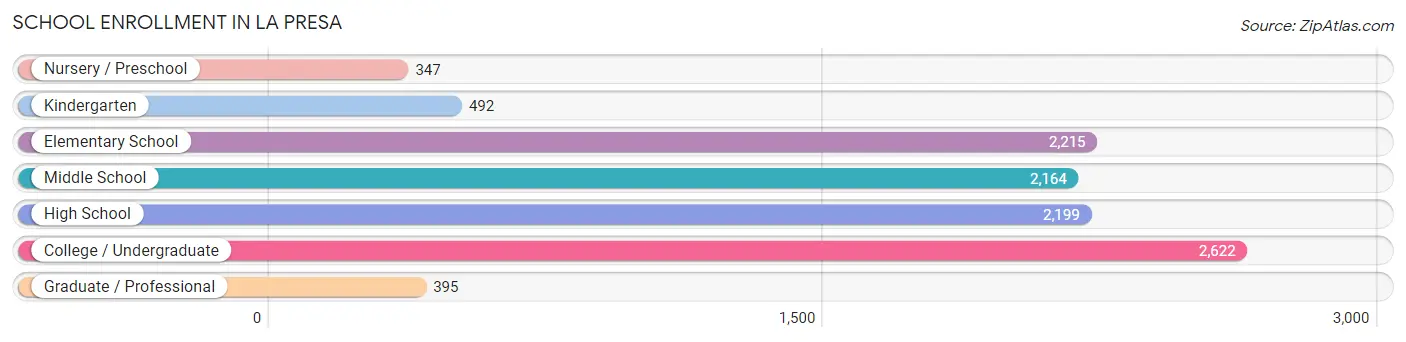
School Enrollment in La Presa
The most common levels of schooling among the 10,434 students in La Presa are college / undergraduate (2,622 | 25.1%), elementary school (2,215 | 21.2%), and high school (2,199 | 21.1%).
| School Level | # Students | % Students |
| Nursery / Preschool | 347 | 3.3% |
| Kindergarten | 492 | 4.7% |
| Elementary School | 2,215 | 21.2% |
| Middle School | 2,164 | 20.7% |
| High School | 2,199 | 21.1% |
| College / Undergraduate | 2,622 | 25.1% |
| Graduate / Professional | 395 | 3.8% |
| Total | 10,434 | 100.0% |
School Enrollment by Age by Funding Source in La Presa
Out of a total of 10,434 students who are enrolled in schools in La Presa, 1,096 (10.5%) attend a private institution, while the remaining 9,338 (89.5%) are enrolled in public schools. The age group of 25 to 34 year olds has the highest likelihood of being enrolled in private schools, with 298 (31.4% in the age bracket) enrolled. Conversely, the age group of 18 to 19 year olds has the lowest likelihood of being enrolled in a private school, with 764 (100.0% in the age bracket) attending a public institution.
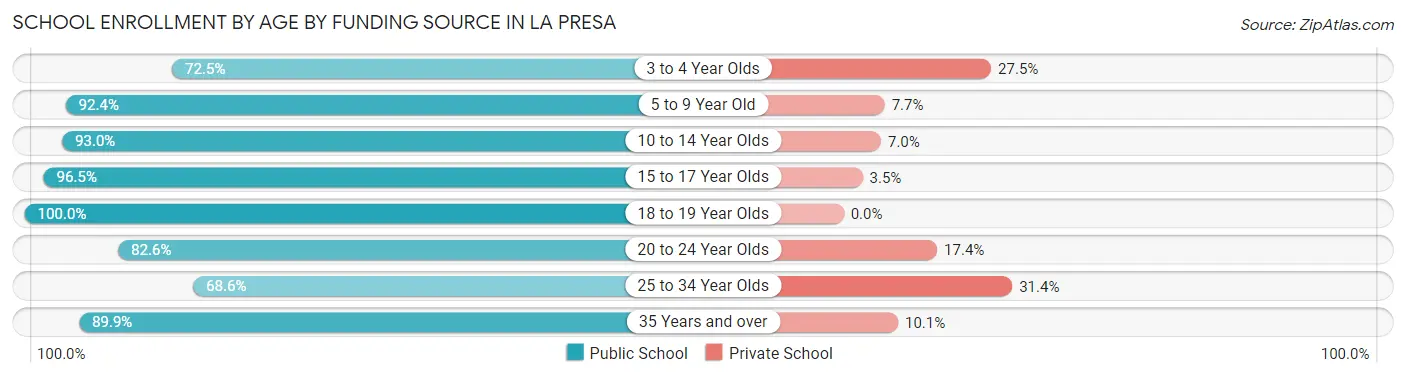
| Age Bracket | Public School | Private School |
| 3 to 4 Year Olds | 301 (72.5%) | 114 (27.5%) |
| 5 to 9 Year Old | 2,270 (92.3%) | 188 (7.6%) |
| 10 to 14 Year Olds | 2,620 (93.0%) | 196 (7.0%) |
| 15 to 17 Year Olds | 1,283 (96.5%) | 47 (3.5%) |
| 18 to 19 Year Olds | 764 (100.0%) | 0 (0.0%) |
| 20 to 24 Year Olds | 949 (82.6%) | 200 (17.4%) |
| 25 to 34 Year Olds | 651 (68.6%) | 298 (31.4%) |
| 35 Years and over | 497 (89.9%) | 56 (10.1%) |
| Total | 9,338 (89.5%) | 1,096 (10.5%) |
Educational Attainment by Field of Study in La Presa
Business (1,109 | 17.8%), science & technology (696 | 11.2%), engineering (676 | 10.8%), arts & humanities (580 | 9.3%), and education (475 | 7.6%) are the most common fields of study among 6,234 individuals in La Presa who have obtained a bachelor's degree or higher.
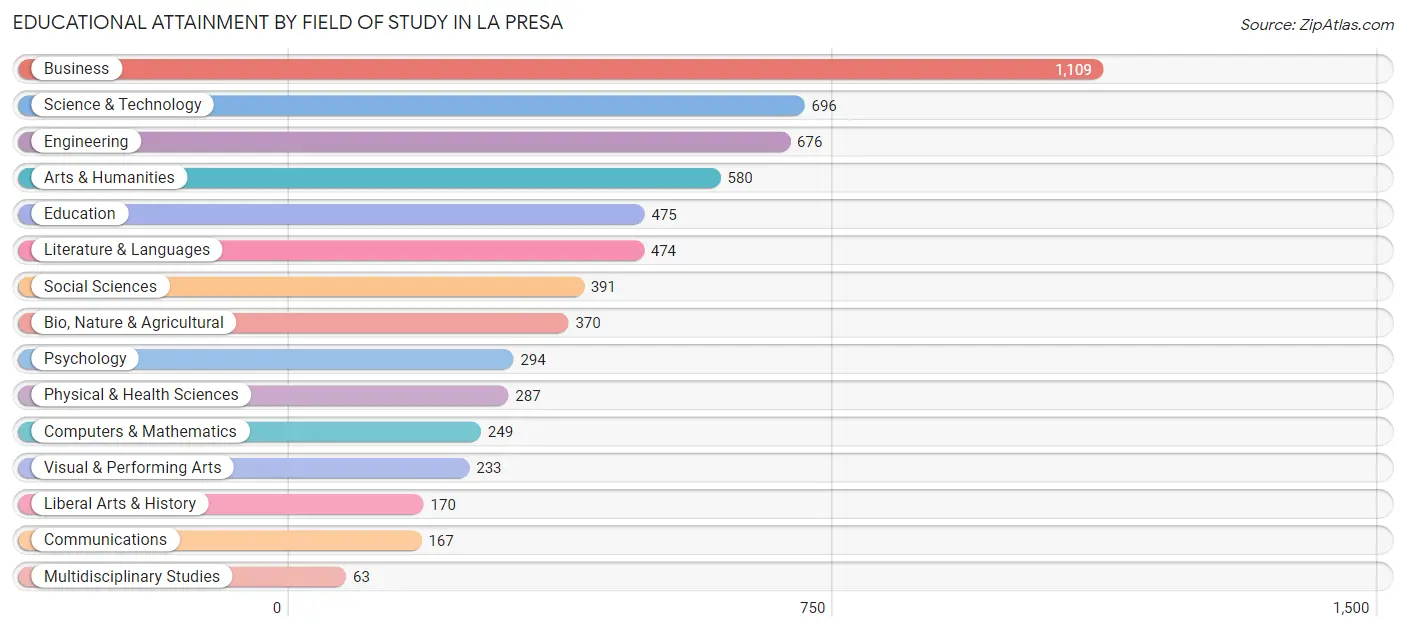
| Field of Study | # Graduates | % Graduates |
| Computers & Mathematics | 249 | 4.0% |
| Bio, Nature & Agricultural | 370 | 5.9% |
| Physical & Health Sciences | 287 | 4.6% |
| Psychology | 294 | 4.7% |
| Social Sciences | 391 | 6.3% |
| Engineering | 676 | 10.8% |
| Multidisciplinary Studies | 63 | 1.0% |
| Science & Technology | 696 | 11.2% |
| Business | 1,109 | 17.8% |
| Education | 475 | 7.6% |
| Literature & Languages | 474 | 7.6% |
| Liberal Arts & History | 170 | 2.7% |
| Visual & Performing Arts | 233 | 3.7% |
| Communications | 167 | 2.7% |
| Arts & Humanities | 580 | 9.3% |
| Total | 6,234 | 100.0% |
Transportation & Commute in La Presa
Vehicle Availability by Sex in La Presa
The most prevalent vehicle ownership categories in La Presa are males with 3 vehicles (2,964, accounting for 30.4%) and females with 3 vehicles (2,456, making up 40.5%).
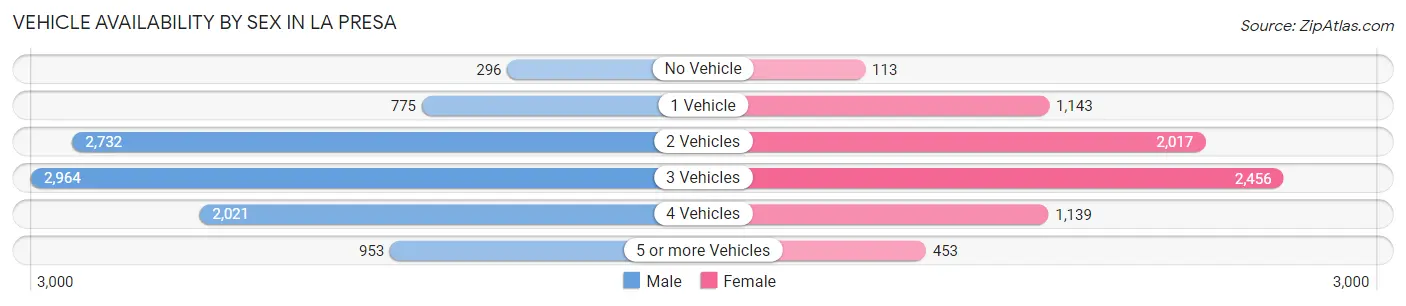
| Vehicles Available | Male | Female |
| No Vehicle | 296 (3.0%) | 113 (1.5%) |
| 1 Vehicle | 775 (8.0%) | 1,143 (15.6%) |
| 2 Vehicles | 2,732 (28.1%) | 2,017 (27.6%) |
| 3 Vehicles | 2,964 (30.4%) | 2,456 (33.6%) |
| 4 Vehicles | 2,021 (20.7%) | 1,139 (15.6%) |
| 5 or more Vehicles | 953 (9.8%) | 453 (6.2%) |
| Total | 9,741 (100.0%) | 7,321 (100.0%) |
Commute Time in La Presa
The most frequently occuring commute durations in La Presa are 20 to 24 minutes (3,145 commuters, 20.1%), 30 to 34 minutes (3,117 commuters, 20.0%), and 15 to 19 minutes (2,629 commuters, 16.8%).
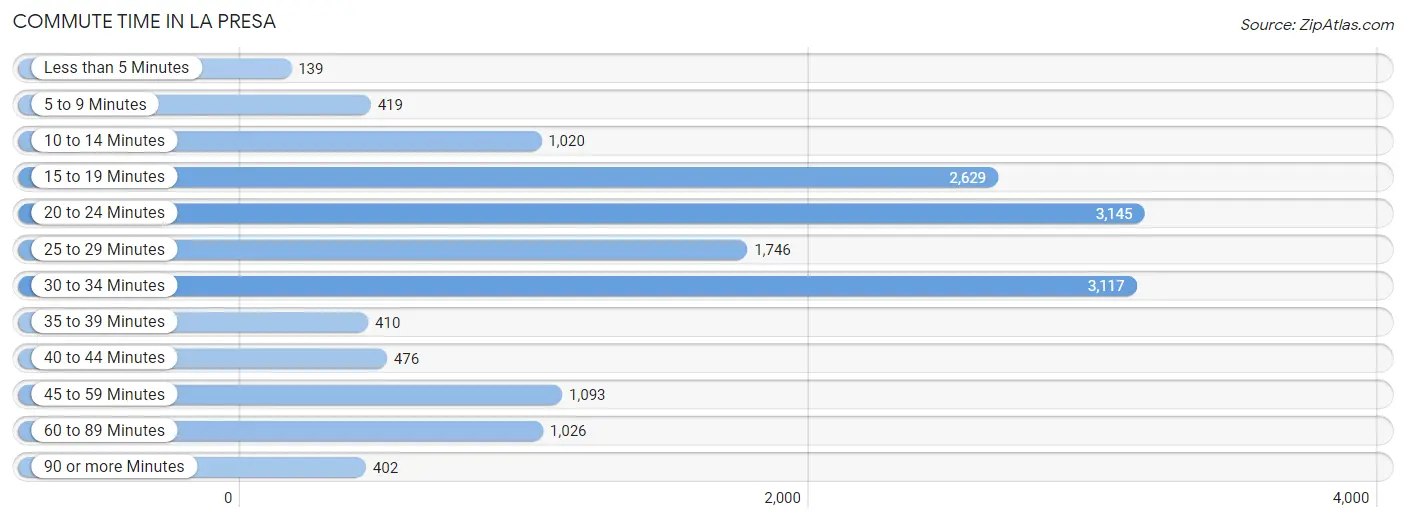
| Commute Time | # Commuters | % Commuters |
| Less than 5 Minutes | 139 | 0.9% |
| 5 to 9 Minutes | 419 | 2.7% |
| 10 to 14 Minutes | 1,020 | 6.5% |
| 15 to 19 Minutes | 2,629 | 16.8% |
| 20 to 24 Minutes | 3,145 | 20.1% |
| 25 to 29 Minutes | 1,746 | 11.2% |
| 30 to 34 Minutes | 3,117 | 20.0% |
| 35 to 39 Minutes | 410 | 2.6% |
| 40 to 44 Minutes | 476 | 3.0% |
| 45 to 59 Minutes | 1,093 | 7.0% |
| 60 to 89 Minutes | 1,026 | 6.6% |
| 90 or more Minutes | 402 | 2.6% |
Commute Time by Sex in La Presa
The most common commute times in La Presa are 20 to 24 minutes (2,013 commuters, 21.8%) for males and 30 to 34 minutes (1,344 commuters, 21.1%) for females.
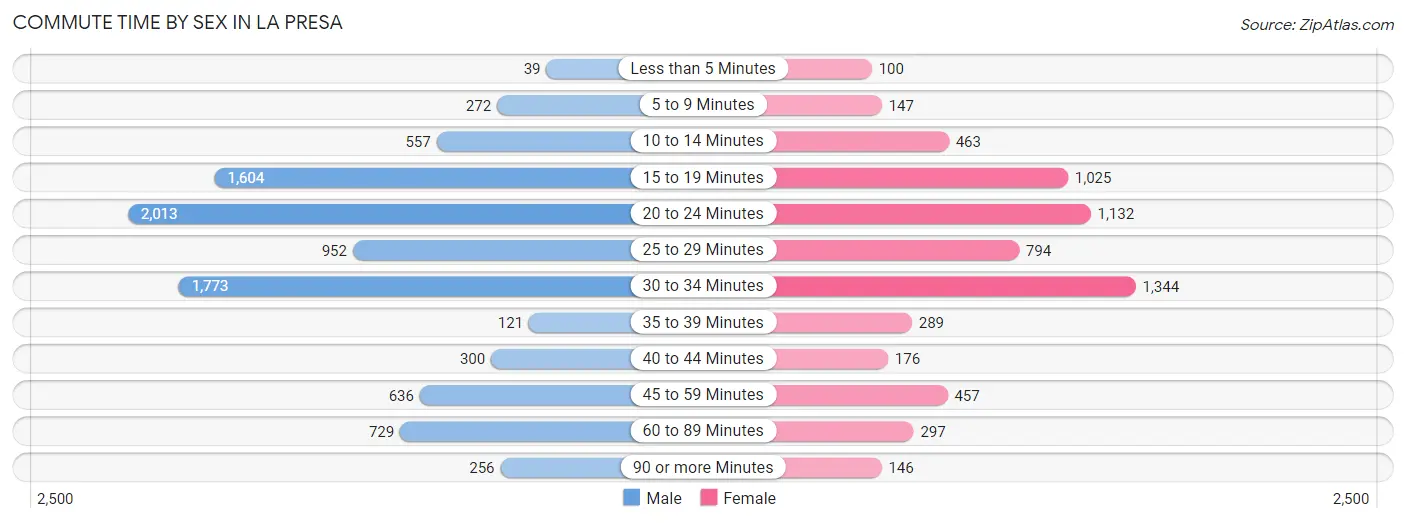
| Commute Time | Male | Female |
| Less than 5 Minutes | 39 (0.4%) | 100 (1.6%) |
| 5 to 9 Minutes | 272 (2.9%) | 147 (2.3%) |
| 10 to 14 Minutes | 557 (6.0%) | 463 (7.3%) |
| 15 to 19 Minutes | 1,604 (17.3%) | 1,025 (16.1%) |
| 20 to 24 Minutes | 2,013 (21.8%) | 1,132 (17.8%) |
| 25 to 29 Minutes | 952 (10.3%) | 794 (12.5%) |
| 30 to 34 Minutes | 1,773 (19.2%) | 1,344 (21.1%) |
| 35 to 39 Minutes | 121 (1.3%) | 289 (4.5%) |
| 40 to 44 Minutes | 300 (3.2%) | 176 (2.8%) |
| 45 to 59 Minutes | 636 (6.9%) | 457 (7.2%) |
| 60 to 89 Minutes | 729 (7.9%) | 297 (4.7%) |
| 90 or more Minutes | 256 (2.8%) | 146 (2.3%) |
Time of Departure to Work by Sex in La Presa
The most frequent times of departure to work in La Presa are 6:00 AM to 6:29 AM (1,368, 14.8%) for males and 7:00 AM to 7:29 AM (1,015, 15.9%) for females.
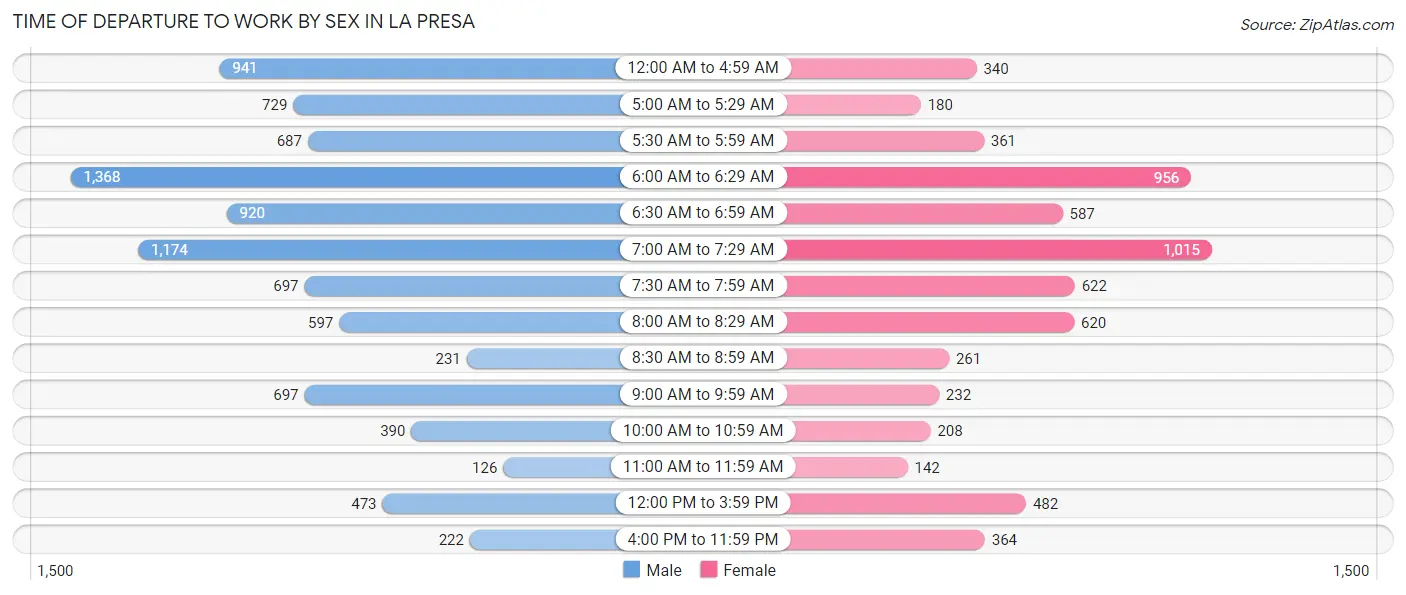
| Time of Departure | Male | Female |
| 12:00 AM to 4:59 AM | 941 (10.2%) | 340 (5.3%) |
| 5:00 AM to 5:29 AM | 729 (7.9%) | 180 (2.8%) |
| 5:30 AM to 5:59 AM | 687 (7.4%) | 361 (5.7%) |
| 6:00 AM to 6:29 AM | 1,368 (14.8%) | 956 (15.0%) |
| 6:30 AM to 6:59 AM | 920 (9.9%) | 587 (9.2%) |
| 7:00 AM to 7:29 AM | 1,174 (12.7%) | 1,015 (15.9%) |
| 7:30 AM to 7:59 AM | 697 (7.5%) | 622 (9.8%) |
| 8:00 AM to 8:29 AM | 597 (6.5%) | 620 (9.7%) |
| 8:30 AM to 8:59 AM | 231 (2.5%) | 261 (4.1%) |
| 9:00 AM to 9:59 AM | 697 (7.5%) | 232 (3.6%) |
| 10:00 AM to 10:59 AM | 390 (4.2%) | 208 (3.3%) |
| 11:00 AM to 11:59 AM | 126 (1.4%) | 142 (2.2%) |
| 12:00 PM to 3:59 PM | 473 (5.1%) | 482 (7.6%) |
| 4:00 PM to 11:59 PM | 222 (2.4%) | 364 (5.7%) |
| Total | 9,252 (100.0%) | 6,370 (100.0%) |
Housing Occupancy in La Presa
Occupancy by Ownership in La Presa
Of the total 11,330 dwellings in La Presa, owner-occupied units account for 7,605 (67.1%), while renter-occupied units make up 3,725 (32.9%).
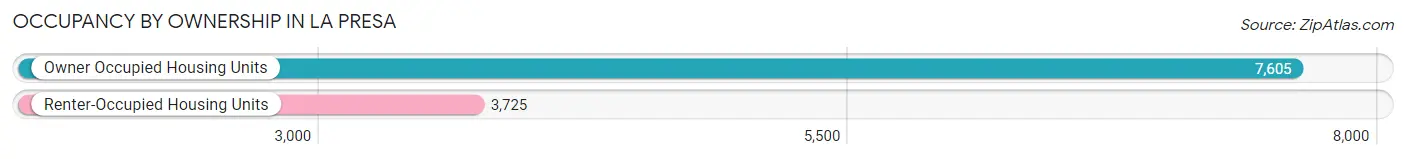
| Occupancy | # Housing Units | % Housing Units |
| Owner Occupied Housing Units | 7,605 | 67.1% |
| Renter-Occupied Housing Units | 3,725 | 32.9% |
| Total Occupied Housing Units | 11,330 | 100.0% |
Occupancy by Household Size in La Presa
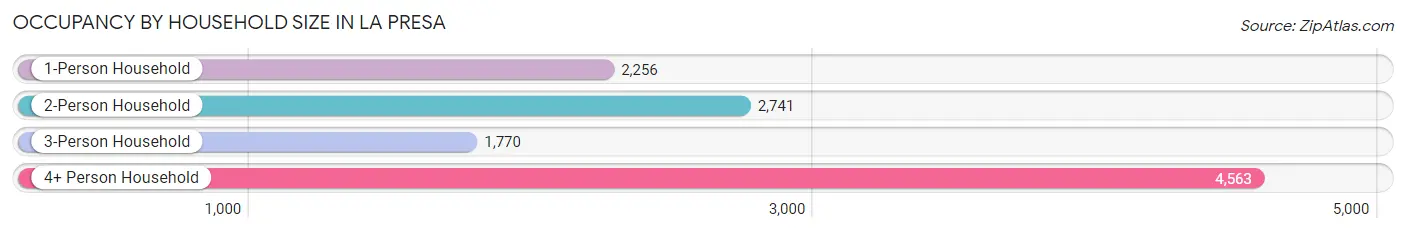
| Household Size | # Housing Units | % Housing Units |
| 1-Person Household | 2,256 | 19.9% |
| 2-Person Household | 2,741 | 24.2% |
| 3-Person Household | 1,770 | 15.6% |
| 4+ Person Household | 4,563 | 40.3% |
| Total Housing Units | 11,330 | 100.0% |
Occupancy by Ownership by Household Size in La Presa
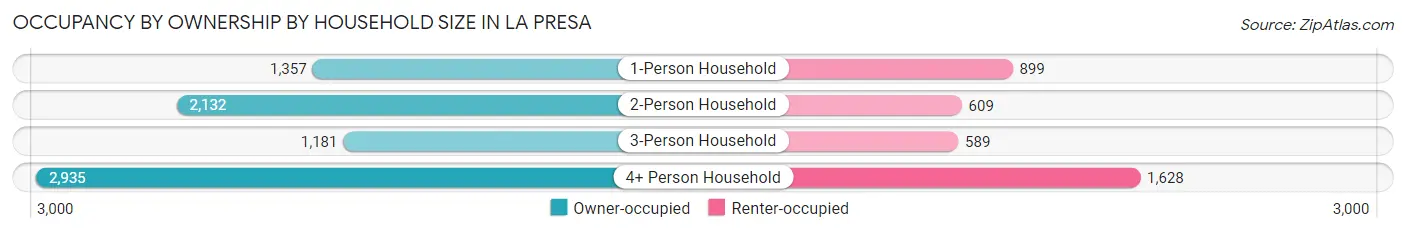
| Household Size | Owner-occupied | Renter-occupied |
| 1-Person Household | 1,357 (60.2%) | 899 (39.9%) |
| 2-Person Household | 2,132 (77.8%) | 609 (22.2%) |
| 3-Person Household | 1,181 (66.7%) | 589 (33.3%) |
| 4+ Person Household | 2,935 (64.3%) | 1,628 (35.7%) |
| Total Housing Units | 7,605 (67.1%) | 3,725 (32.9%) |
Occupancy by Educational Attainment in La Presa
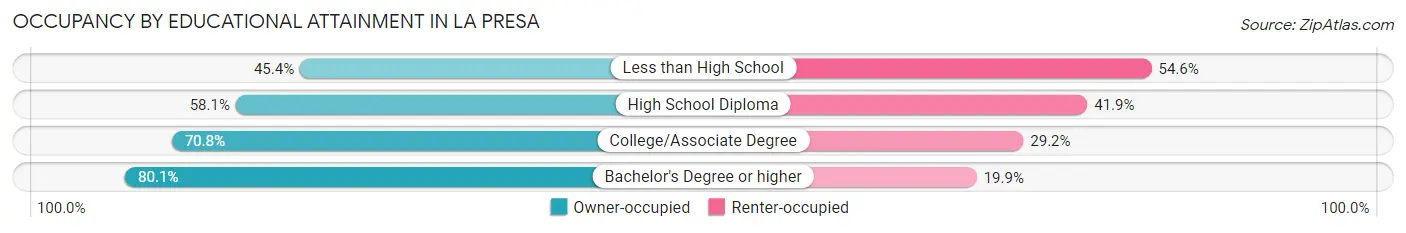
| Household Size | Owner-occupied | Renter-occupied |
| Less than High School | 627 (45.4%) | 754 (54.6%) |
| High School Diploma | 1,589 (58.1%) | 1,144 (41.9%) |
| College/Associate Degree | 2,976 (70.8%) | 1,226 (29.2%) |
| Bachelor's Degree or higher | 2,413 (80.1%) | 601 (19.9%) |
Occupancy by Age of Householder in La Presa
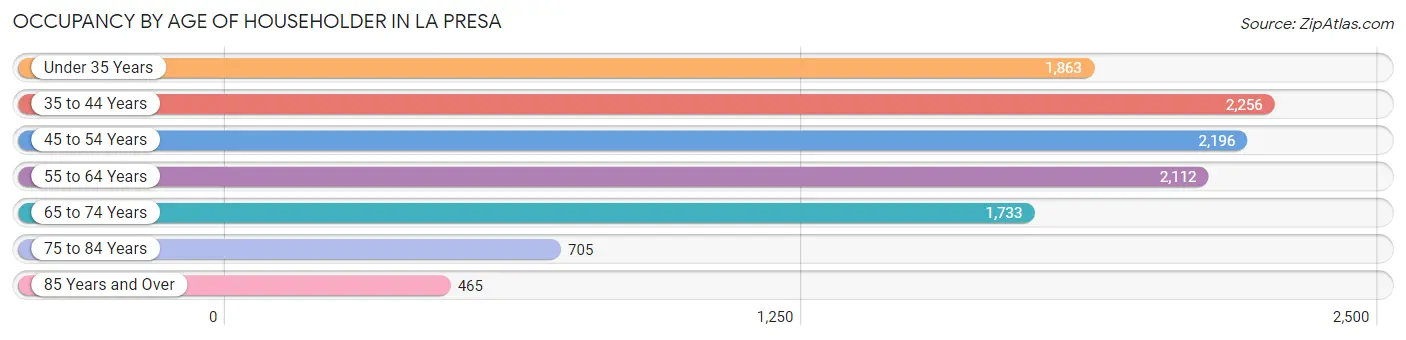
| Age Bracket | # Households | % Households |
| Under 35 Years | 1,863 | 16.4% |
| 35 to 44 Years | 2,256 | 19.9% |
| 45 to 54 Years | 2,196 | 19.4% |
| 55 to 64 Years | 2,112 | 18.6% |
| 65 to 74 Years | 1,733 | 15.3% |
| 75 to 84 Years | 705 | 6.2% |
| 85 Years and Over | 465 | 4.1% |
| Total | 11,330 | 100.0% |
Housing Finances in La Presa
Median Income by Occupancy in La Presa
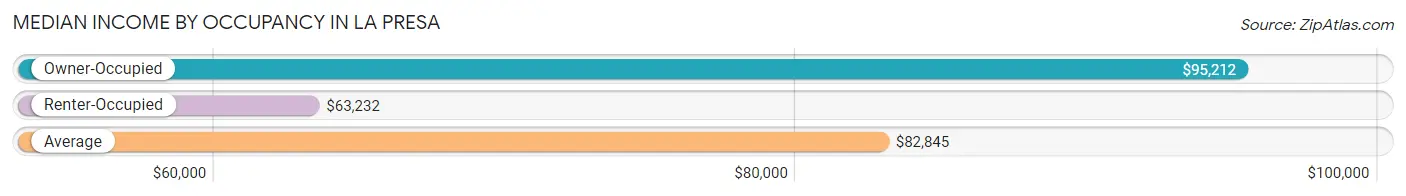
| Occupancy Type | # Households | Median Income |
| Owner-Occupied | 7,605 (67.1%) | $95,212 |
| Renter-Occupied | 3,725 (32.9%) | $63,232 |
| Average | 11,330 (100.0%) | $82,845 |
Occupancy by Householder Income Bracket in La Presa
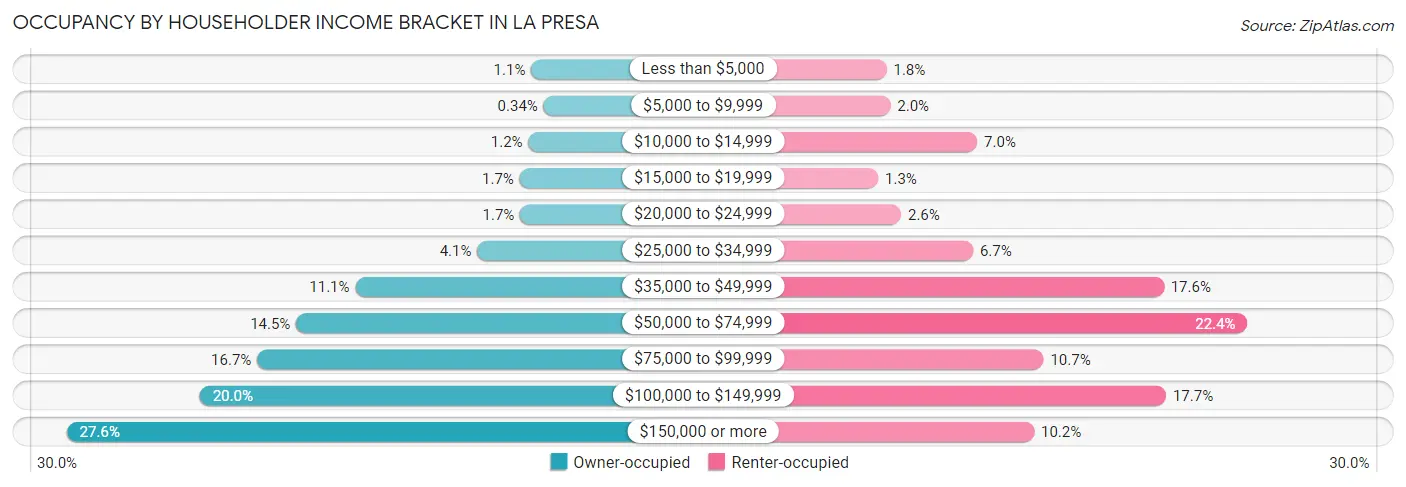
| Income Bracket | Owner-occupied | Renter-occupied |
| Less than $5,000 | 80 (1.1%) | 66 (1.8%) |
| $5,000 to $9,999 | 26 (0.3%) | 74 (2.0%) |
| $10,000 to $14,999 | 92 (1.2%) | 259 (7.0%) |
| $15,000 to $19,999 | 130 (1.7%) | 48 (1.3%) |
| $20,000 to $24,999 | 128 (1.7%) | 97 (2.6%) |
| $25,000 to $34,999 | 314 (4.1%) | 250 (6.7%) |
| $35,000 to $49,999 | 844 (11.1%) | 656 (17.6%) |
| $50,000 to $74,999 | 1,101 (14.5%) | 834 (22.4%) |
| $75,000 to $99,999 | 1,271 (16.7%) | 400 (10.7%) |
| $100,000 to $149,999 | 1,520 (20.0%) | 661 (17.7%) |
| $150,000 or more | 2,099 (27.6%) | 380 (10.2%) |
| Total | 7,605 (100.0%) | 3,725 (100.0%) |
Monthly Housing Cost Tiers in La Presa
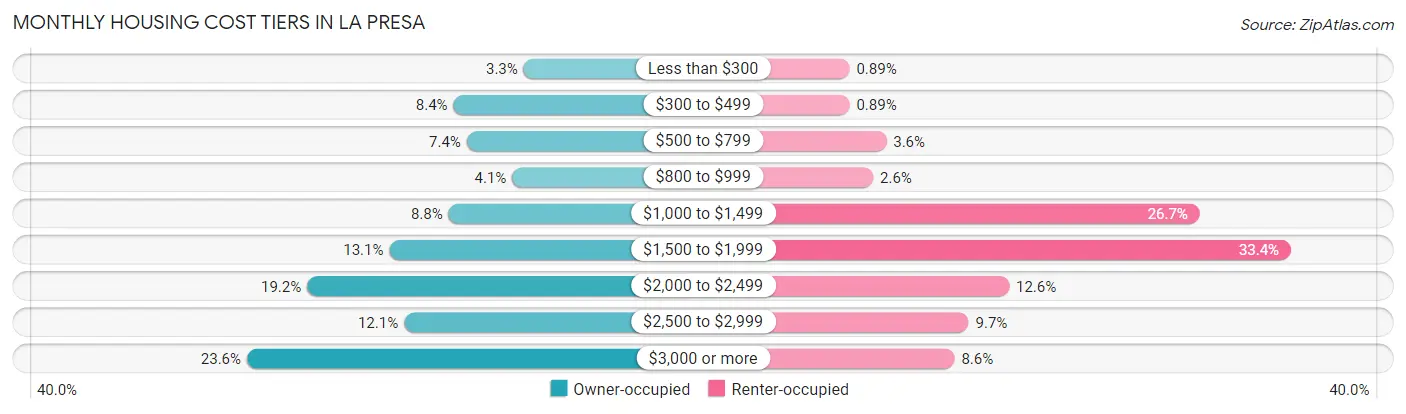
| Monthly Cost | Owner-occupied | Renter-occupied |
| Less than $300 | 247 (3.3%) | 33 (0.9%) |
| $300 to $499 | 640 (8.4%) | 33 (0.9%) |
| $500 to $799 | 566 (7.4%) | 134 (3.6%) |
| $800 to $999 | 311 (4.1%) | 98 (2.6%) |
| $1,000 to $1,499 | 668 (8.8%) | 994 (26.7%) |
| $1,500 to $1,999 | 999 (13.1%) | 1,244 (33.4%) |
| $2,000 to $2,499 | 1,460 (19.2%) | 471 (12.6%) |
| $2,500 to $2,999 | 917 (12.1%) | 360 (9.7%) |
| $3,000 or more | 1,797 (23.6%) | 321 (8.6%) |
| Total | 7,605 (100.0%) | 3,725 (100.0%) |
Physical Housing Characteristics in La Presa
Housing Structures in La Presa
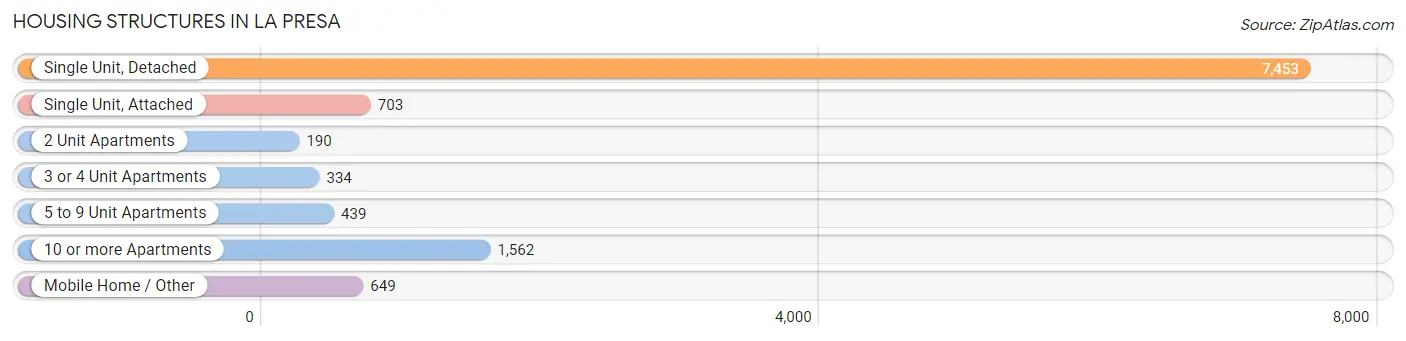
| Structure Type | # Housing Units | % Housing Units |
| Single Unit, Detached | 7,453 | 65.8% |
| Single Unit, Attached | 703 | 6.2% |
| 2 Unit Apartments | 190 | 1.7% |
| 3 or 4 Unit Apartments | 334 | 2.9% |
| 5 to 9 Unit Apartments | 439 | 3.9% |
| 10 or more Apartments | 1,562 | 13.8% |
| Mobile Home / Other | 649 | 5.7% |
| Total | 11,330 | 100.0% |
Housing Structures by Occupancy in La Presa
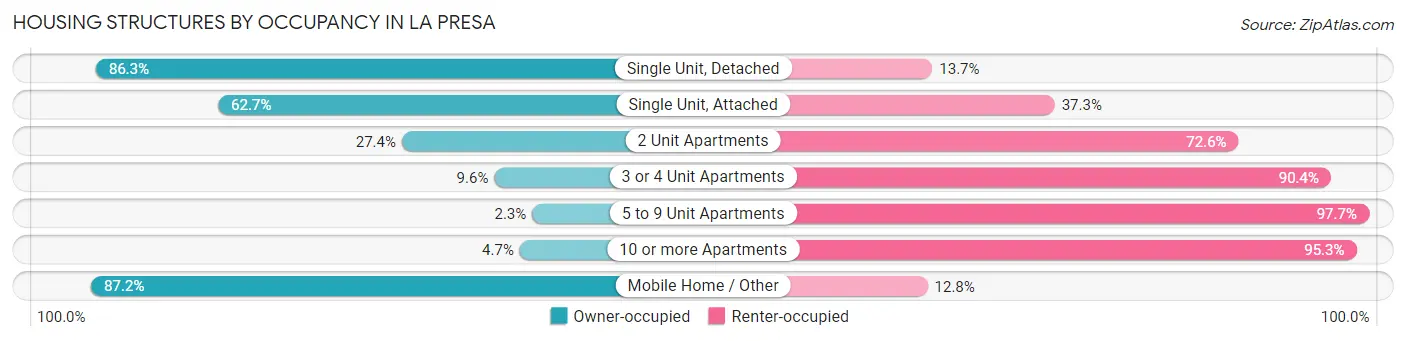
| Structure Type | Owner-occupied | Renter-occupied |
| Single Unit, Detached | 6,431 (86.3%) | 1,022 (13.7%) |
| Single Unit, Attached | 441 (62.7%) | 262 (37.3%) |
| 2 Unit Apartments | 52 (27.4%) | 138 (72.6%) |
| 3 or 4 Unit Apartments | 32 (9.6%) | 302 (90.4%) |
| 5 to 9 Unit Apartments | 10 (2.3%) | 429 (97.7%) |
| 10 or more Apartments | 73 (4.7%) | 1,489 (95.3%) |
| Mobile Home / Other | 566 (87.2%) | 83 (12.8%) |
| Total | 7,605 (67.1%) | 3,725 (32.9%) |
Housing Structures by Number of Rooms in La Presa
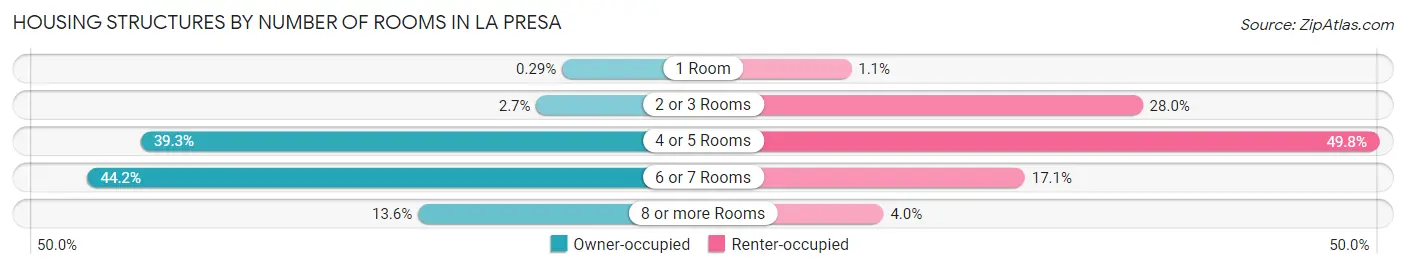
| Number of Rooms | Owner-occupied | Renter-occupied |
| 1 Room | 22 (0.3%) | 39 (1.1%) |
| 2 or 3 Rooms | 203 (2.7%) | 1,043 (28.0%) |
| 4 or 5 Rooms | 2,986 (39.3%) | 1,856 (49.8%) |
| 6 or 7 Rooms | 3,359 (44.2%) | 637 (17.1%) |
| 8 or more Rooms | 1,035 (13.6%) | 150 (4.0%) |
| Total | 7,605 (100.0%) | 3,725 (100.0%) |
Housing Structure by Heating Type in La Presa
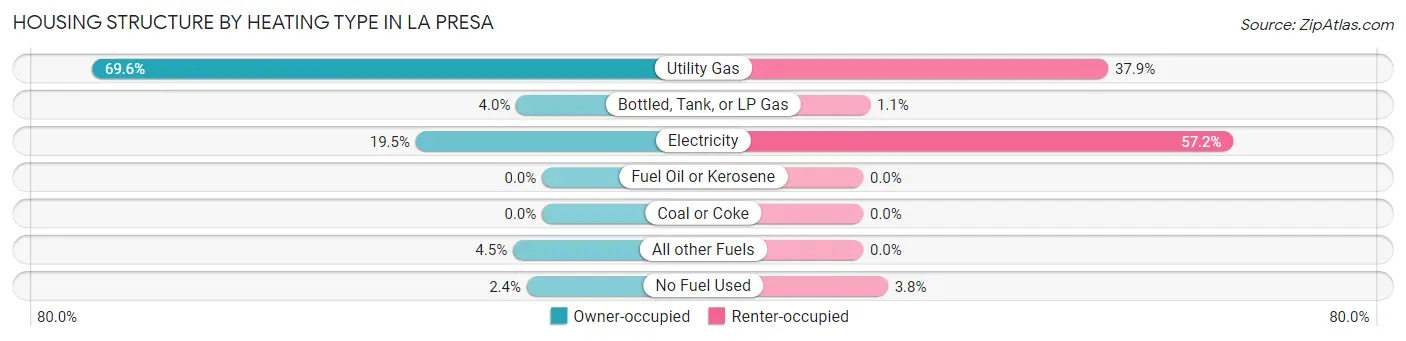
| Heating Type | Owner-occupied | Renter-occupied |
| Utility Gas | 5,294 (69.6%) | 1,411 (37.9%) |
| Bottled, Tank, or LP Gas | 304 (4.0%) | 40 (1.1%) |
| Electricity | 1,485 (19.5%) | 2,132 (57.2%) |
| Fuel Oil or Kerosene | 0 (0.0%) | 0 (0.0%) |
| Coal or Coke | 0 (0.0%) | 0 (0.0%) |
| All other Fuels | 342 (4.5%) | 0 (0.0%) |
| No Fuel Used | 180 (2.4%) | 142 (3.8%) |
| Total | 7,605 (100.0%) | 3,725 (100.0%) |
Household Vehicle Usage in La Presa
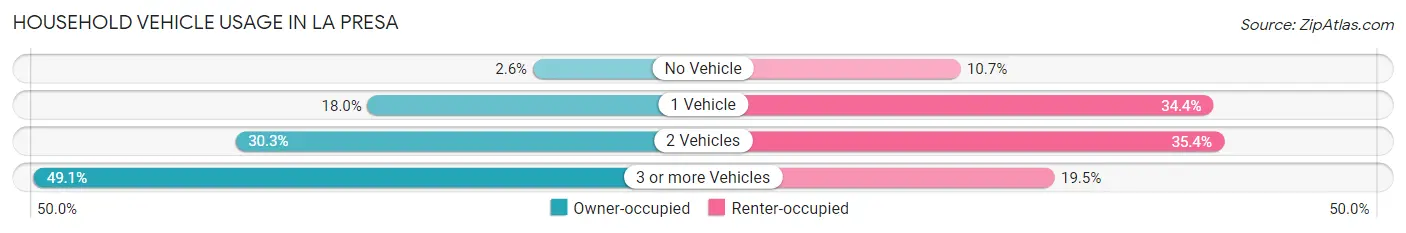
| Vehicles per Household | Owner-occupied | Renter-occupied |
| No Vehicle | 194 (2.5%) | 400 (10.7%) |
| 1 Vehicle | 1,367 (18.0%) | 1,281 (34.4%) |
| 2 Vehicles | 2,307 (30.3%) | 1,317 (35.4%) |
| 3 or more Vehicles | 3,737 (49.1%) | 727 (19.5%) |
| Total | 7,605 (100.0%) | 3,725 (100.0%) |
Real Estate & Mortgages in La Presa
Real Estate and Mortgage Overview in La Presa
| Characteristic | Without Mortgage | With Mortgage |
| Housing Units | 1,970 | 5,635 |
| Median Property Value | $486,200 | $581,600 |
| Median Household Income | $68,780 | $1,707 |
| Monthly Housing Costs | $568 | $1,797 |
| Real Estate Taxes | $2,409 | $144 |
Property Value by Mortgage Status in La Presa
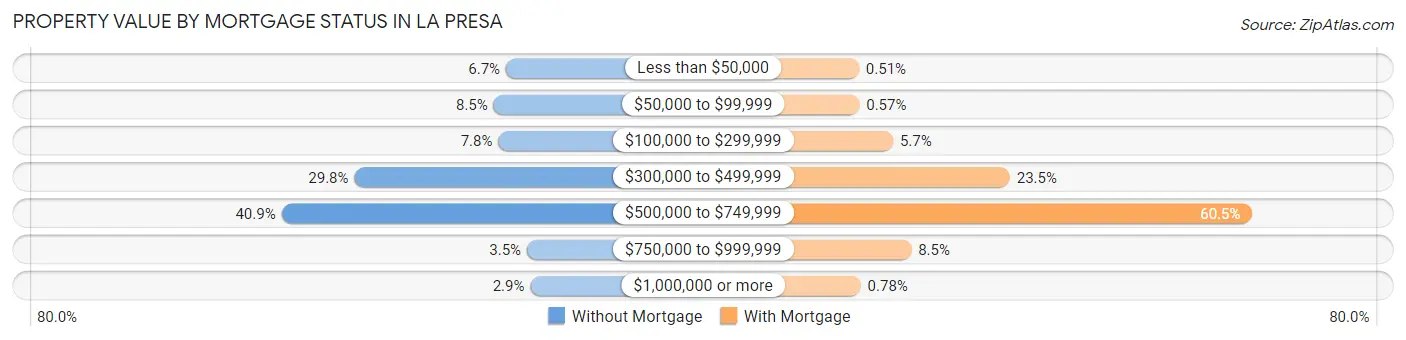
| Property Value | Without Mortgage | With Mortgage |
| Less than $50,000 | 131 (6.7%) | 29 (0.5%) |
| $50,000 to $99,999 | 168 (8.5%) | 32 (0.6%) |
| $100,000 to $299,999 | 154 (7.8%) | 321 (5.7%) |
| $300,000 to $499,999 | 586 (29.7%) | 1,324 (23.5%) |
| $500,000 to $749,999 | 805 (40.9%) | 3,407 (60.5%) |
| $750,000 to $999,999 | 68 (3.5%) | 478 (8.5%) |
| $1,000,000 or more | 58 (2.9%) | 44 (0.8%) |
| Total | 1,970 (100.0%) | 5,635 (100.0%) |
Household Income by Mortgage Status in La Presa
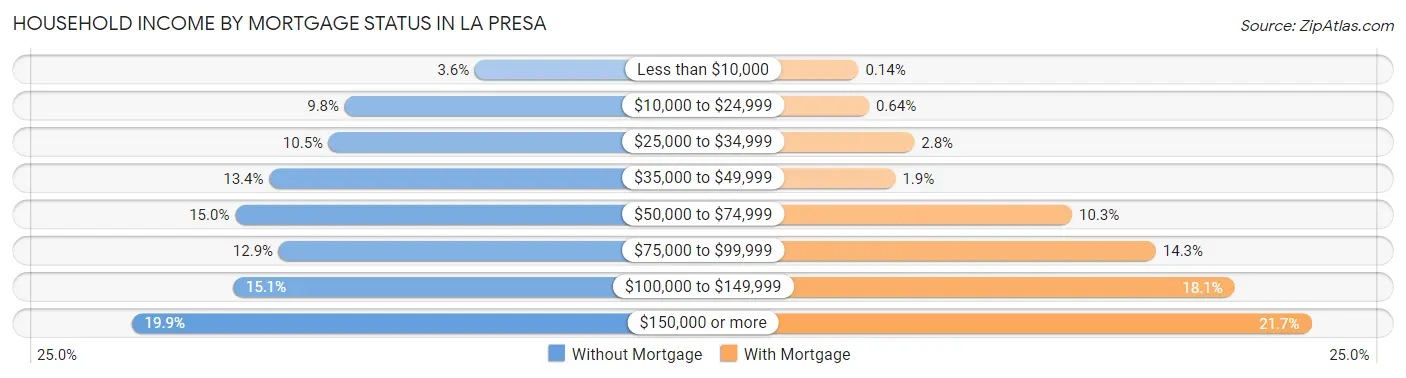
| Household Income | Without Mortgage | With Mortgage |
| Less than $10,000 | 70 (3.5%) | 8 (0.1%) |
| $10,000 to $24,999 | 192 (9.8%) | 36 (0.6%) |
| $25,000 to $34,999 | 207 (10.5%) | 158 (2.8%) |
| $35,000 to $49,999 | 263 (13.4%) | 107 (1.9%) |
| $50,000 to $74,999 | 295 (15.0%) | 581 (10.3%) |
| $75,000 to $99,999 | 254 (12.9%) | 806 (14.3%) |
| $100,000 to $149,999 | 297 (15.1%) | 1,017 (18.0%) |
| $150,000 or more | 392 (19.9%) | 1,223 (21.7%) |
| Total | 1,970 (100.0%) | 5,635 (100.0%) |
Property Value to Household Income Ratio in La Presa
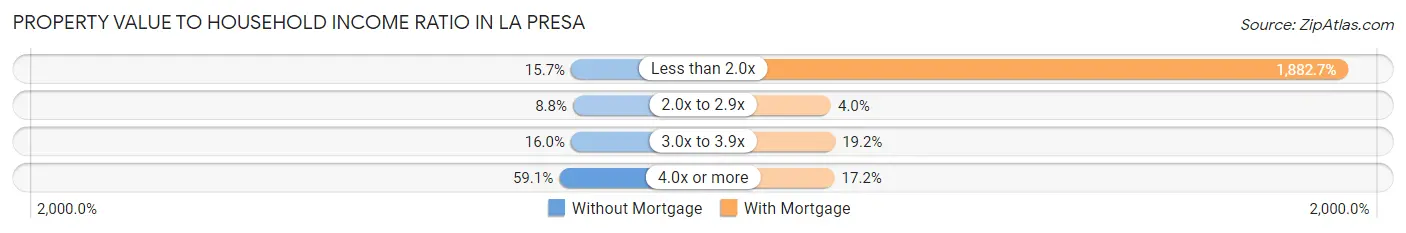
| Value-to-Income Ratio | Without Mortgage | With Mortgage |
| Less than 2.0x | 309 (15.7%) | 106,089 (1,882.7%) |
| 2.0x to 2.9x | 173 (8.8%) | 224 (4.0%) |
| 3.0x to 3.9x | 316 (16.0%) | 1,082 (19.2%) |
| 4.0x or more | 1,164 (59.1%) | 971 (17.2%) |
| Total | 1,970 (100.0%) | 5,635 (100.0%) |
Real Estate Taxes by Mortgage Status in La Presa
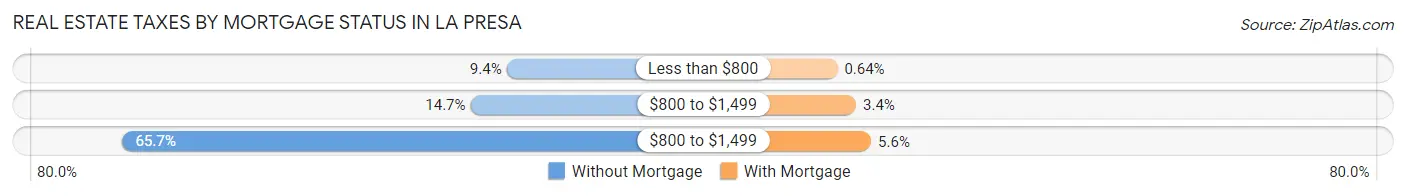
| Property Taxes | Without Mortgage | With Mortgage |
| Less than $800 | 186 (9.4%) | 36 (0.6%) |
| $800 to $1,499 | 290 (14.7%) | 190 (3.4%) |
| $800 to $1,499 | 1,294 (65.7%) | 314 (5.6%) |
| Total | 1,970 (100.0%) | 5,635 (100.0%) |
Health & Disability in La Presa
Health Insurance Coverage by Age in La Presa
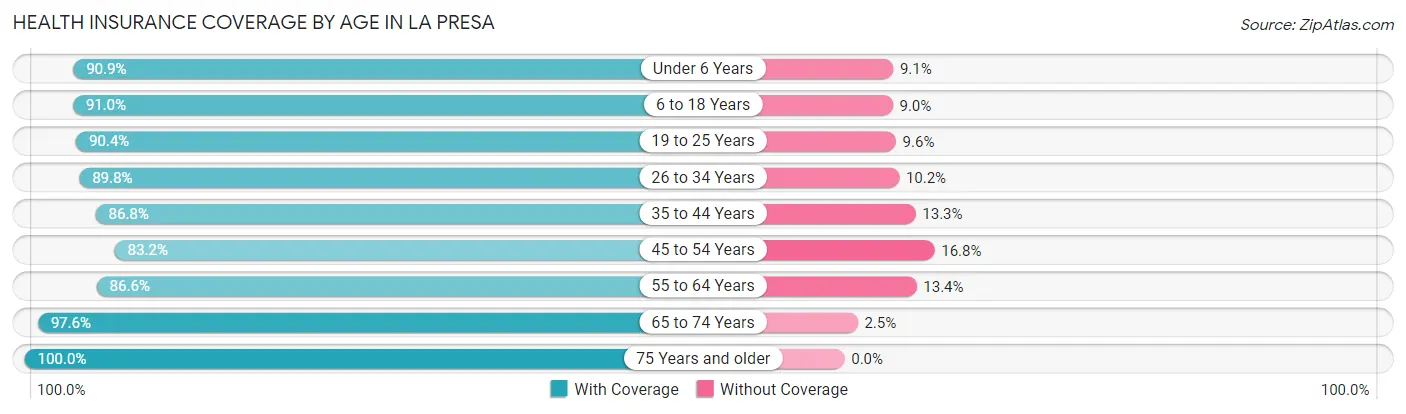
| Age Bracket | With Coverage | Without Coverage |
| Under 6 Years | 2,467 (90.9%) | 246 (9.1%) |
| 6 to 18 Years | 6,357 (91.0%) | 628 (9.0%) |
| 19 to 25 Years | 3,264 (90.4%) | 346 (9.6%) |
| 26 to 34 Years | 4,874 (89.8%) | 553 (10.2%) |
| 35 to 44 Years | 4,642 (86.8%) | 709 (13.3%) |
| 45 to 54 Years | 3,592 (83.2%) | 725 (16.8%) |
| 55 to 64 Years | 3,595 (86.6%) | 558 (13.4%) |
| 65 to 74 Years | 3,108 (97.6%) | 78 (2.5%) |
| 75 Years and older | 2,140 (100.0%) | 0 (0.0%) |
| Total | 34,039 (89.9%) | 3,843 (10.1%) |
Health Insurance Coverage by Citizenship Status in La Presa
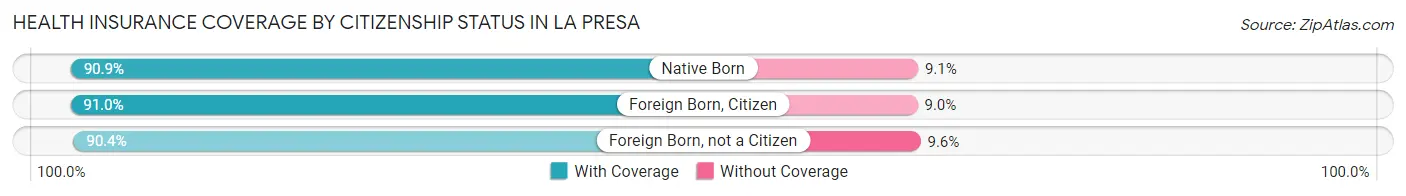
| Citizenship Status | With Coverage | Without Coverage |
| Native Born | 2,467 (90.9%) | 246 (9.1%) |
| Foreign Born, Citizen | 6,357 (91.0%) | 628 (9.0%) |
| Foreign Born, not a Citizen | 3,264 (90.4%) | 346 (9.6%) |
Health Insurance Coverage by Household Income in La Presa
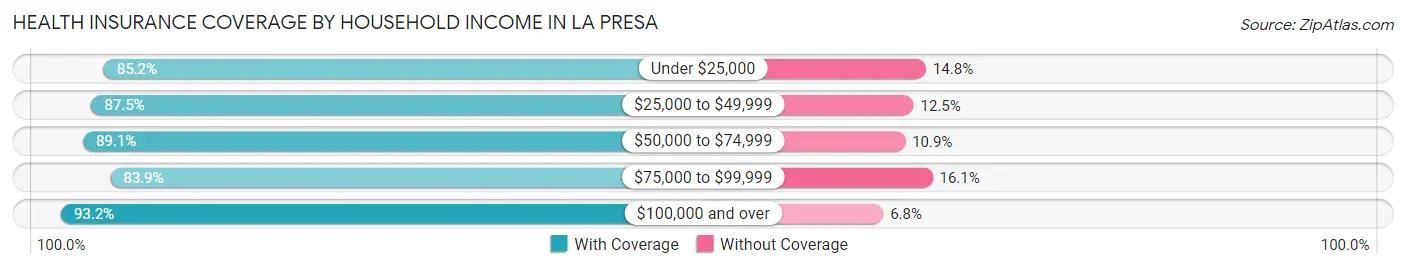
| Household Income | With Coverage | Without Coverage |
| Under $25,000 | 1,940 (85.2%) | 338 (14.8%) |
| $25,000 to $49,999 | 4,709 (87.5%) | 674 (12.5%) |
| $50,000 to $74,999 | 4,891 (89.1%) | 601 (10.9%) |
| $75,000 to $99,999 | 4,904 (83.9%) | 938 (16.1%) |
| $100,000 and over | 17,295 (93.2%) | 1,265 (6.8%) |
Public vs Private Health Insurance Coverage by Age in La Presa
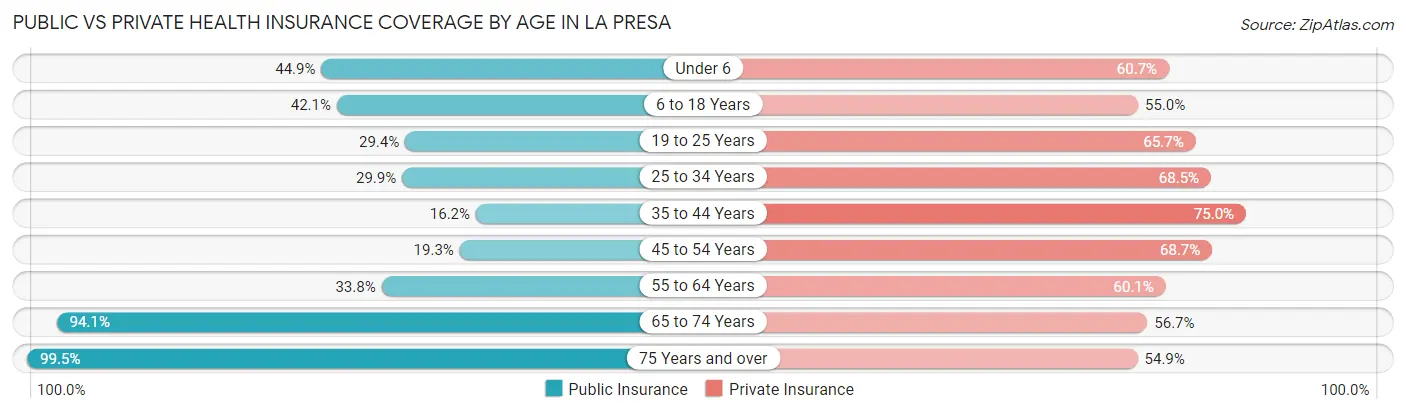
| Age Bracket | Public Insurance | Private Insurance |
| Under 6 | 1,219 (44.9%) | 1,647 (60.7%) |
| 6 to 18 Years | 2,937 (42.0%) | 3,842 (55.0%) |
| 19 to 25 Years | 1,061 (29.4%) | 2,370 (65.6%) |
| 25 to 34 Years | 1,625 (29.9%) | 3,718 (68.5%) |
| 35 to 44 Years | 869 (16.2%) | 4,014 (75.0%) |
| 45 to 54 Years | 831 (19.3%) | 2,967 (68.7%) |
| 55 to 64 Years | 1,402 (33.8%) | 2,496 (60.1%) |
| 65 to 74 Years | 2,997 (94.1%) | 1,807 (56.7%) |
| 75 Years and over | 2,130 (99.5%) | 1,175 (54.9%) |
| Total | 15,071 (39.8%) | 24,036 (63.4%) |
Disability Status by Sex by Age in La Presa
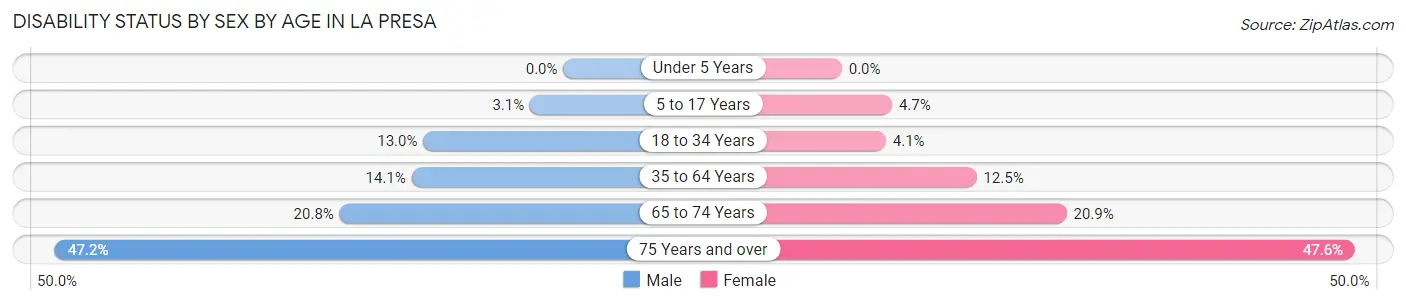
| Age Bracket | Male | Female |
| Under 5 Years | 0 (0.0%) | 0 (0.0%) |
| 5 to 17 Years | 109 (3.1%) | 150 (4.7%) |
| 18 to 34 Years | 651 (13.0%) | 187 (4.1%) |
| 35 to 64 Years | 963 (14.1%) | 873 (12.5%) |
| 65 to 74 Years | 339 (20.8%) | 324 (20.9%) |
| 75 Years and over | 416 (47.2%) | 599 (47.6%) |
Disability Class by Sex by Age in La Presa
Disability Class: Hearing Difficulty
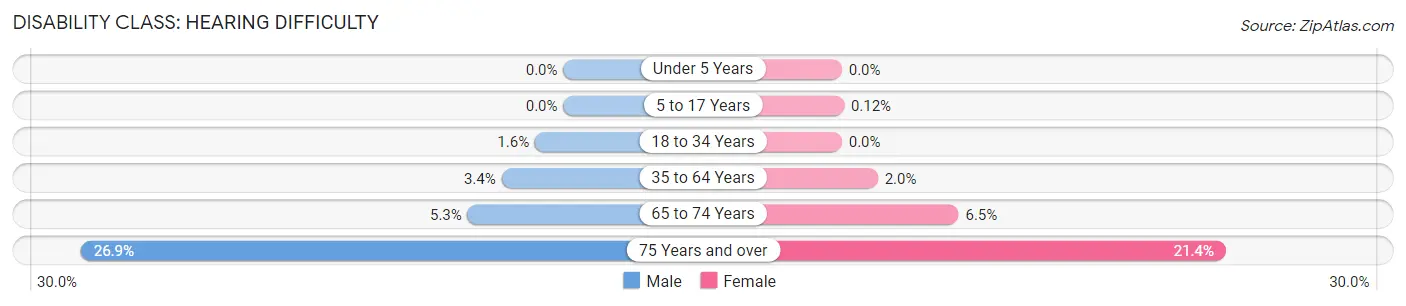
| Age Bracket | Male | Female |
| Under 5 Years | 0 (0.0%) | 0 (0.0%) |
| 5 to 17 Years | 0 (0.0%) | 4 (0.1%) |
| 18 to 34 Years | 79 (1.6%) | 0 (0.0%) |
| 35 to 64 Years | 235 (3.4%) | 140 (2.0%) |
| 65 to 74 Years | 87 (5.3%) | 101 (6.5%) |
| 75 Years and over | 237 (26.9%) | 269 (21.4%) |
Disability Class: Vision Difficulty
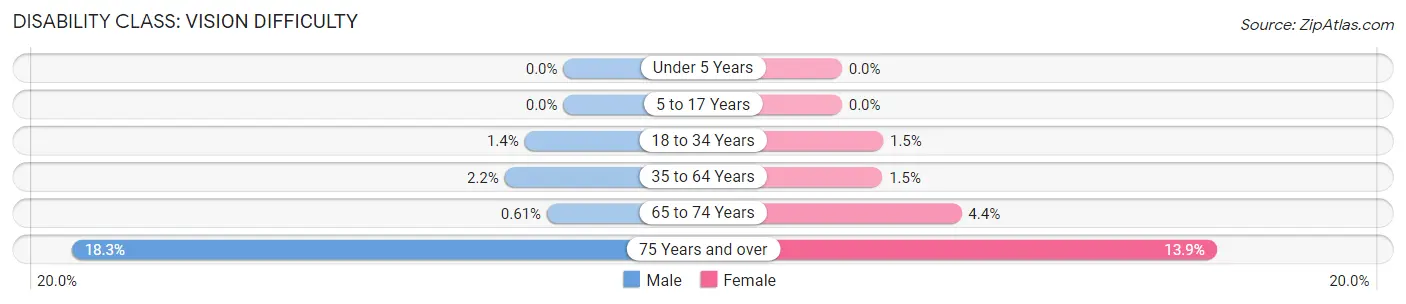
| Age Bracket | Male | Female |
| Under 5 Years | 0 (0.0%) | 0 (0.0%) |
| 5 to 17 Years | 0 (0.0%) | 0 (0.0%) |
| 18 to 34 Years | 72 (1.4%) | 70 (1.5%) |
| 35 to 64 Years | 149 (2.2%) | 105 (1.5%) |
| 65 to 74 Years | 10 (0.6%) | 69 (4.4%) |
| 75 Years and over | 161 (18.2%) | 175 (13.9%) |
Disability Class: Cognitive Difficulty
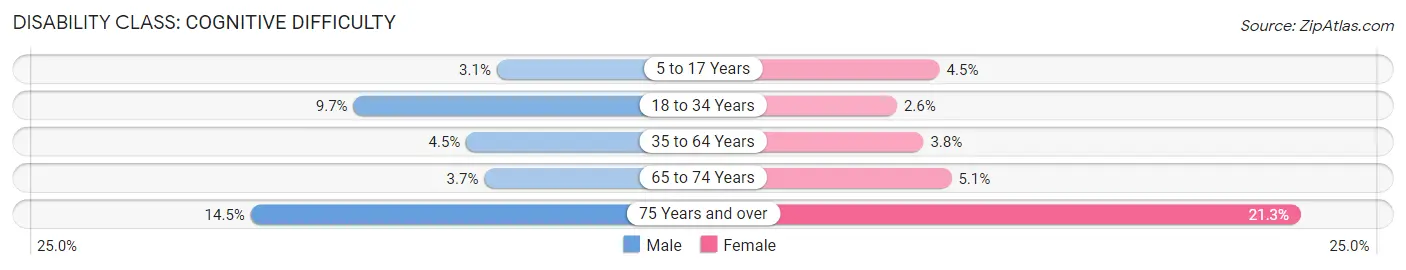
| Age Bracket | Male | Female |
| 5 to 17 Years | 109 (3.1%) | 146 (4.5%) |
| 18 to 34 Years | 488 (9.7%) | 117 (2.6%) |
| 35 to 64 Years | 308 (4.5%) | 265 (3.8%) |
| 65 to 74 Years | 60 (3.7%) | 79 (5.1%) |
| 75 Years and over | 128 (14.5%) | 268 (21.3%) |
Disability Class: Ambulatory Difficulty
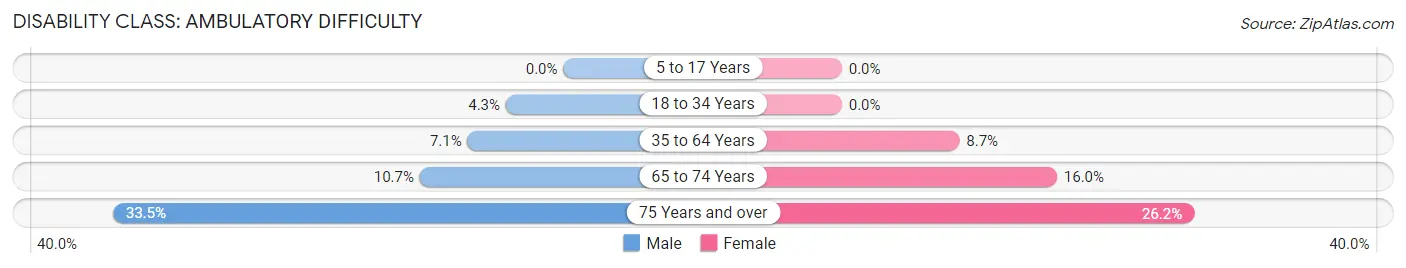
| Age Bracket | Male | Female |
| 5 to 17 Years | 0 (0.0%) | 0 (0.0%) |
| 18 to 34 Years | 214 (4.3%) | 0 (0.0%) |
| 35 to 64 Years | 486 (7.1%) | 610 (8.7%) |
| 65 to 74 Years | 174 (10.7%) | 248 (16.0%) |
| 75 Years and over | 295 (33.5%) | 329 (26.2%) |
Disability Class: Self-Care Difficulty
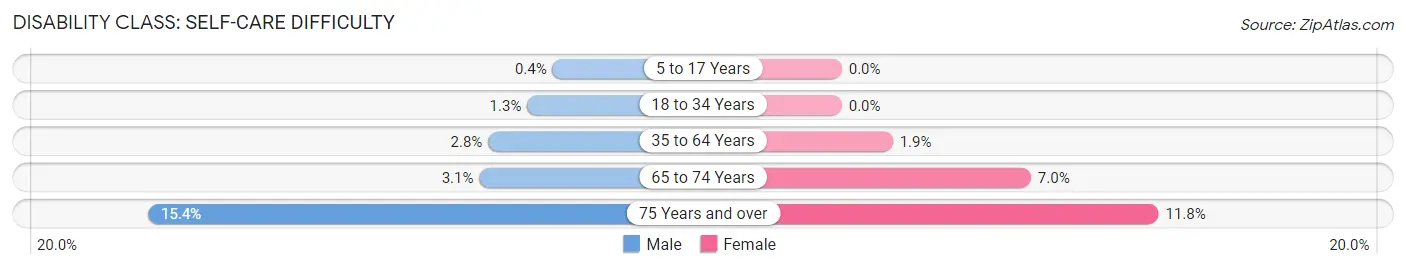
| Age Bracket | Male | Female |
| 5 to 17 Years | 14 (0.4%) | 0 (0.0%) |
| 18 to 34 Years | 67 (1.3%) | 0 (0.0%) |
| 35 to 64 Years | 191 (2.8%) | 132 (1.9%) |
| 65 to 74 Years | 51 (3.1%) | 109 (7.0%) |
| 75 Years and over | 136 (15.4%) | 148 (11.8%) |
Technology Access in La Presa
Computing Device Access in La Presa
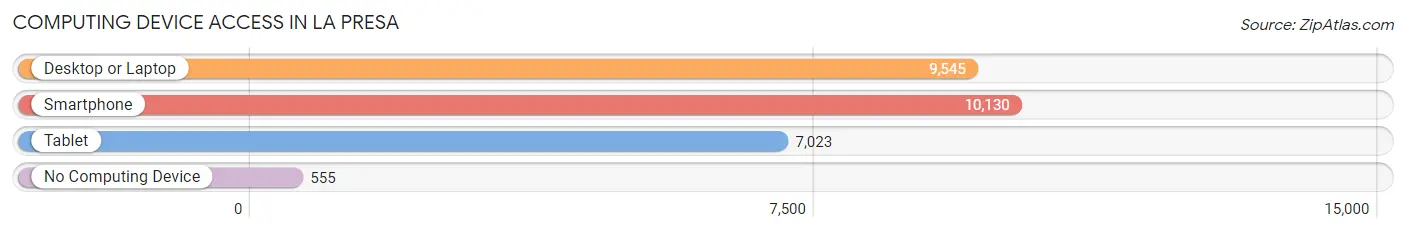
| Device Type | # Households | % Households |
| Desktop or Laptop | 9,545 | 84.3% |
| Smartphone | 10,130 | 89.4% |
| Tablet | 7,023 | 62.0% |
| No Computing Device | 555 | 4.9% |
| Total | 11,330 | 100.0% |
Internet Access in La Presa
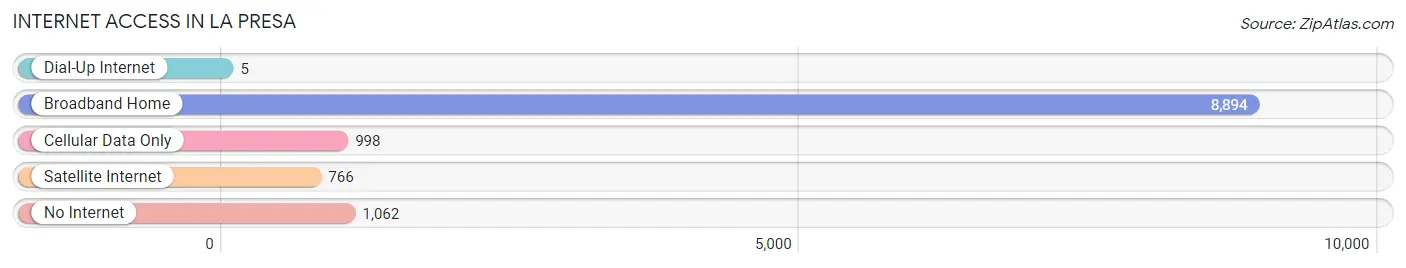
| Internet Type | # Households | % Households |
| Dial-Up Internet | 5 | 0.0% |
| Broadband Home | 8,894 | 78.5% |
| Cellular Data Only | 998 | 8.8% |
| Satellite Internet | 766 | 6.8% |
| No Internet | 1,062 | 9.4% |
| Total | 11,330 | 100.0% |
La Presa Summary
Presa, California is a small unincorporated community located in San Diego County, California. It is situated in the foothills of the Cuyamaca Mountains, approximately 25 miles east of downtown San Diego. The community is bordered by the communities of Descanso, Alpine, and Pine Valley. The population of Presa is estimated to be around 1,000 people.
History
Presa was originally inhabited by the Kumeyaay people, who were the original inhabitants of the area. The Kumeyaay were hunter-gatherers who lived in the area for thousands of years before the arrival of Europeans. The first Europeans to settle in the area were Spanish missionaries, who established a mission in the area in 1769. The mission was abandoned in 1821, and the area was later settled by ranchers and farmers.
In the late 19th century, the area was developed as a resort community, with the construction of a hotel and other amenities. The area was also used for cattle ranching and logging. In the early 20th century, the area was used for mining, and the town of Presa was established in the 1920s.
Geography
Presa is located in the foothills of the Cuyamaca Mountains, at an elevation of approximately 3,000 feet. The area is characterized by rolling hills, with oak and pine forests. The climate is mild, with temperatures ranging from the mid-50s to the mid-80s.
Economy
The economy of Presa is largely based on tourism and agriculture. The area is home to several wineries, and there are also several small businesses in the area. The area is also home to a number of small farms, which produce a variety of fruits and vegetables.
Demographics
The population of Presa is estimated to be around 1,000 people. The majority of the population is white (90%), with the remainder being Hispanic (7%) and other (3%). The median household income is $50,000, and the median home value is $250,000. The unemployment rate is 4.5%.
Conclusion
Presa, California is a small unincorporated community located in San Diego County, California. It is situated in the foothills of the Cuyamaca Mountains, approximately 25 miles east of downtown San Diego. The community is bordered by the communities of Descanso, Alpine, and Pine Valley. The population of Presa is estimated to be around 1,000 people. The economy of Presa is largely based on tourism and agriculture, and the majority of the population is white. The median household income is $50,000, and the median home value is $250,000. The unemployment rate is 4.5%.
Common Questions
What is Per Capita Income in La Presa?
Per Capita income in La Presa is $33,784.
What is the Median Family Income in La Presa?
Median Family Income in La Presa is $85,246.
What is the Median Household income in La Presa?
Median Household Income in La Presa is $82,845.
What is Income or Wage Gap in La Presa?
Income or Wage Gap in La Presa is 26.7%.
Women in La Presa earn 73.3 cents for every dollar earned by a man.
What is Family Income Deficit in La Presa?
Family Income Deficit in La Presa is $8,988.
Families that are below poverty line in La Presa earn $8,988 less on average than the poverty threshold level.
What is Inequality or Gini Index in La Presa?
Inequality or Gini Index in La Presa is 0.42.
What is the Total Population of La Presa?
Total Population of La Presa is 38,618.
What is the Total Male Population of La Presa?
Total Male Population of La Presa is 19,690.
What is the Total Female Population of La Presa?
Total Female Population of La Presa is 18,928.
What is the Ratio of Males per 100 Females in La Presa?
There are 104.03 Males per 100 Females in La Presa.
What is the Ratio of Females per 100 Males in La Presa?
There are 96.13 Females per 100 Males in La Presa.
What is the Median Population Age in La Presa?
Median Population Age in La Presa is 35.2 Years.
What is the Average Family Size in La Presa
Average Family Size in La Presa is 3.9 People.
What is the Average Household Size in La Presa
Average Household Size in La Presa is 3.4 People.
How Large is the Labor Force in La Presa?
There are 19,169 People in the Labor Forcein in La Presa.
What is the Percentage of People in the Labor Force in La Presa?
63.2% of People are in the Labor Force in La Presa.
What is the Unemployment Rate in La Presa?
Unemployment Rate in La Presa is 8.7%.