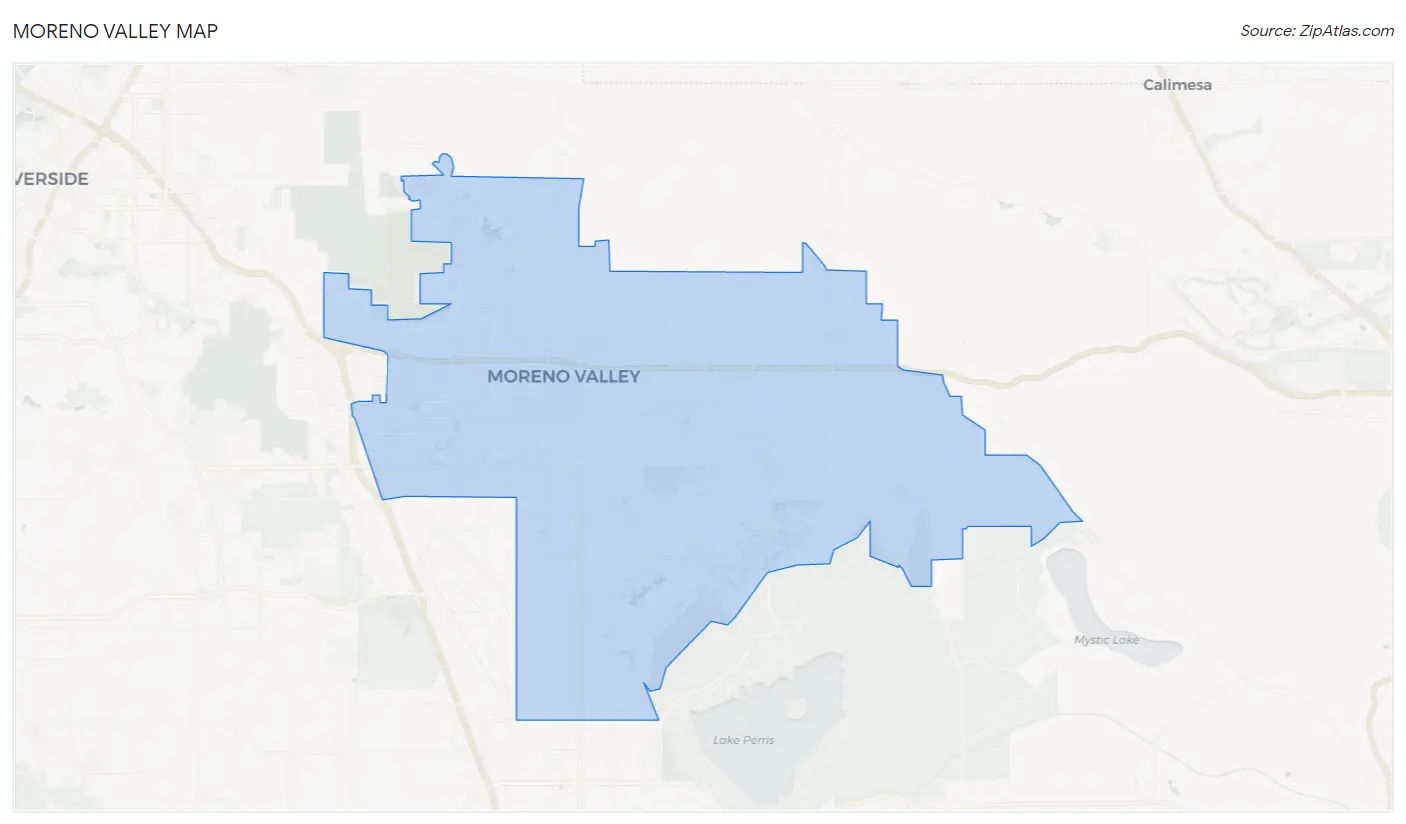
Moreno Valley, CA Map & Demographics
Moreno Valley Map
Moreno Valley Overview
$26,861
PER CAPITA INCOME
$82,697
AVG FAMILY INCOME
$82,637
AVG HOUSEHOLD INCOME
24.5%
WAGE / INCOME GAP [ % ]
75.5¢/ $1
WAGE / INCOME GAP [ $ ]
$11,257
FAMILY INCOME DEFICIT
0.39
INEQUALITY / GINI INDEX
209,578
TOTAL POPULATION
104,482
MALE POPULATION
105,096
FEMALE POPULATION
99.42
MALES / 100 FEMALES
100.59
FEMALES / 100 MALES
31.8
MEDIAN AGE
4.1
AVG FAMILY SIZE
3.9
AVG HOUSEHOLD SIZE
102,784
LABOR FORCE [ PEOPLE ]
64.6%
PERCENT IN LABOR FORCE
7.5%
UNEMPLOYMENT RATE
Moreno Valley Area Codes
Income in Moreno Valley
Income Overview in Moreno Valley
Per Capita Income in Moreno Valley is $26,861, while median incomes of families and households are $82,697 and $82,637 respectively.
| Characteristic | Number | Measure |
| Per Capita Income | 209,578 | $26,861 |
| Median Family Income | 45,425 | $82,697 |
| Mean Family Income | 45,425 | $99,010 |
| Median Household Income | 53,958 | $82,637 |
| Mean Household Income | 53,958 | $98,211 |
| Income Deficit | 45,425 | $11,257 |
| Wage / Income Gap (%) | 209,578 | 24.47% |
| Wage / Income Gap ($) | 209,578 | 75.53¢ per $1 |
| Gini / Inequality Index | 209,578 | 0.39 |
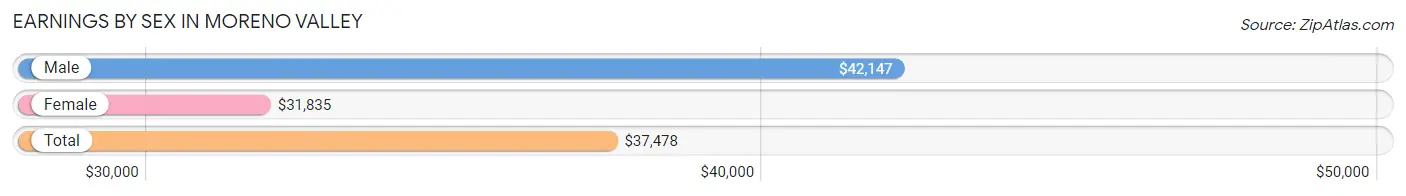
Earnings by Sex in Moreno Valley
Average Earnings in Moreno Valley are $37,478, $42,147 for men and $31,835 for women, a difference of 24.5%.
| Sex | Number | Average Earnings |
| Male | 57,141 (56.1%) | $42,147 |
| Female | 44,689 (43.9%) | $31,835 |
| Total | 101,830 (100.0%) | $37,478 |
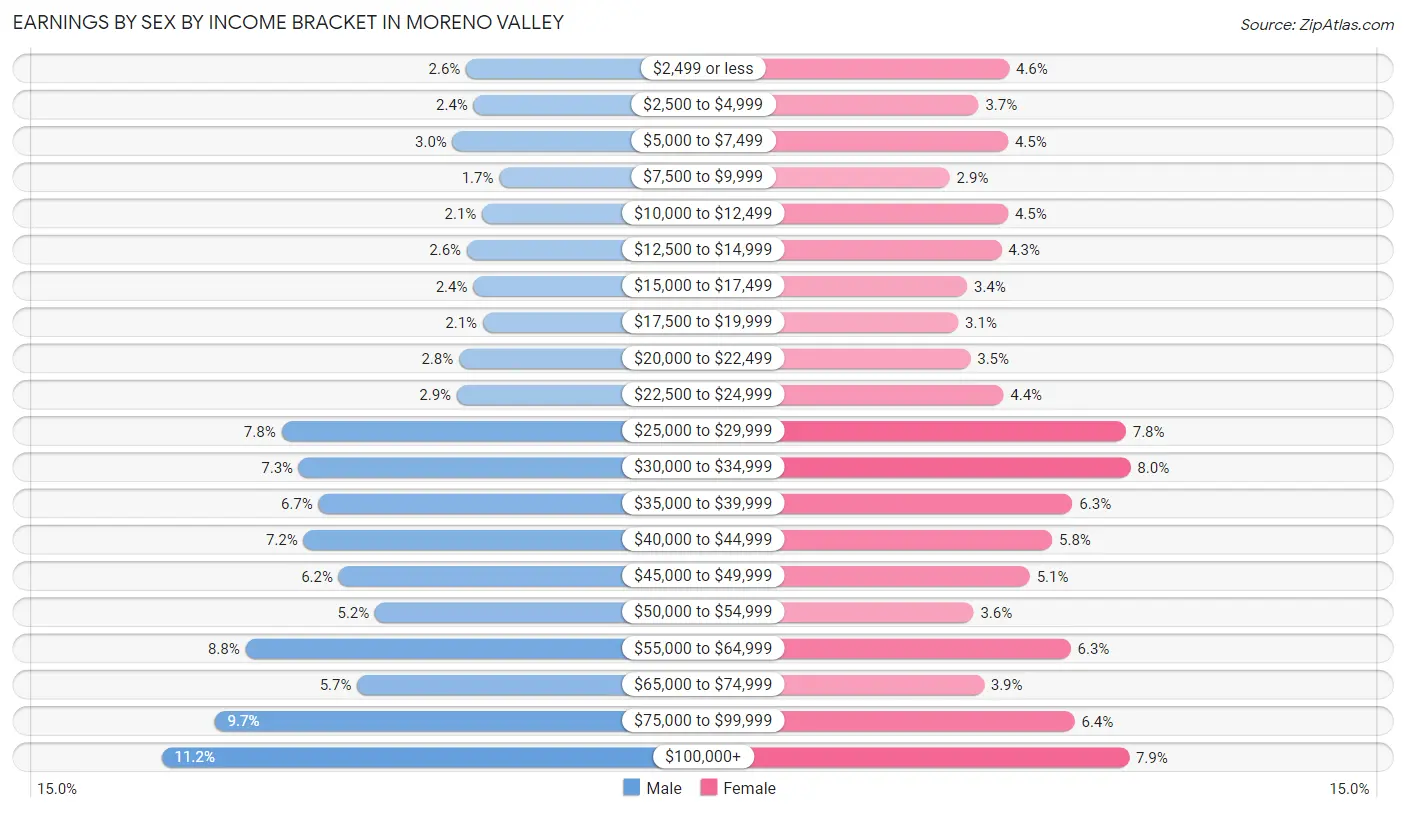
Earnings by Sex by Income Bracket in Moreno Valley
The most common earnings brackets in Moreno Valley are $100,000+ for men (6,369 | 11.2%) and $30,000 to $34,999 for women (3,561 | 8.0%).
| Income | Male | Female |
| $2,499 or less | 1,481 (2.6%) | 2,037 (4.6%) |
| $2,500 to $4,999 | 1,358 (2.4%) | 1,655 (3.7%) |
| $5,000 to $7,499 | 1,699 (3.0%) | 2,023 (4.5%) |
| $7,500 to $9,999 | 949 (1.7%) | 1,291 (2.9%) |
| $10,000 to $12,499 | 1,222 (2.1%) | 2,024 (4.5%) |
| $12,500 to $14,999 | 1,471 (2.6%) | 1,938 (4.3%) |
| $15,000 to $17,499 | 1,363 (2.4%) | 1,509 (3.4%) |
| $17,500 to $19,999 | 1,210 (2.1%) | 1,400 (3.1%) |
| $20,000 to $22,499 | 1,594 (2.8%) | 1,550 (3.5%) |
| $22,500 to $24,999 | 1,628 (2.9%) | 1,965 (4.4%) |
| $25,000 to $29,999 | 4,448 (7.8%) | 3,503 (7.8%) |
| $30,000 to $34,999 | 4,164 (7.3%) | 3,561 (8.0%) |
| $35,000 to $39,999 | 3,852 (6.7%) | 2,833 (6.3%) |
| $40,000 to $44,999 | 4,090 (7.2%) | 2,578 (5.8%) |
| $45,000 to $49,999 | 3,528 (6.2%) | 2,297 (5.1%) |
| $50,000 to $54,999 | 2,943 (5.1%) | 1,593 (3.6%) |
| $55,000 to $64,999 | 5,024 (8.8%) | 2,809 (6.3%) |
| $65,000 to $74,999 | 3,227 (5.7%) | 1,719 (3.8%) |
| $75,000 to $99,999 | 5,521 (9.7%) | 2,858 (6.4%) |
| $100,000+ | 6,369 (11.2%) | 3,546 (7.9%) |
| Total | 57,141 (100.0%) | 44,689 (100.0%) |
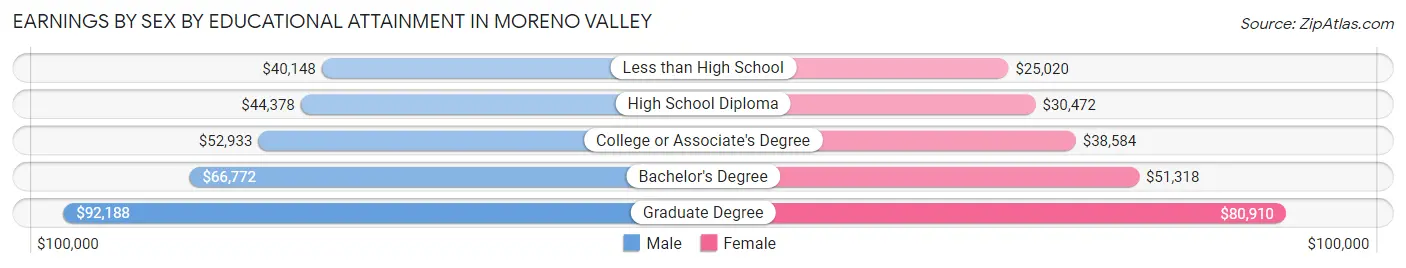
Earnings by Sex by Educational Attainment in Moreno Valley
Average earnings in Moreno Valley are $47,173 for men and $36,106 for women, a difference of 23.5%. Men with an educational attainment of graduate degree enjoy the highest average annual earnings of $92,188, while those with less than high school education earn the least with $40,148. Women with an educational attainment of graduate degree earn the most with the average annual earnings of $80,910, while those with less than high school education have the smallest earnings of $25,020.
| Educational Attainment | Male Income | Female Income |
| Less than High School | $40,148 | $25,020 |
| High School Diploma | $44,378 | $30,472 |
| College or Associate's Degree | $52,933 | $38,584 |
| Bachelor's Degree | $66,772 | $51,318 |
| Graduate Degree | $92,188 | $80,910 |
| Total | $47,173 | $36,106 |
Family Income in Moreno Valley
Family Income Brackets in Moreno Valley
According to the Moreno Valley family income data, there are 10,448 families falling into the $100,000 to $149,999 income range, which is the most common income bracket and makes up 23.0% of all families. Conversely, the $10,000 to $14,999 income bracket is the least frequent group with only 545 families (1.2%) belonging to this category.
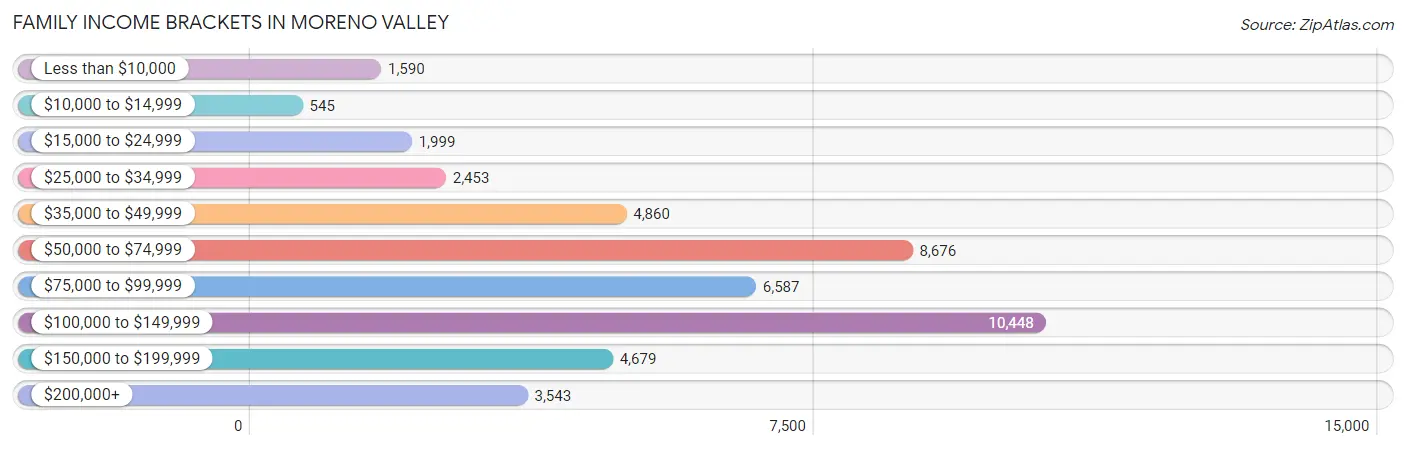
| Income Bracket | # Families | % Families |
| Less than $10,000 | 1,590 | 3.5% |
| $10,000 to $14,999 | 545 | 1.2% |
| $15,000 to $24,999 | 1,999 | 4.4% |
| $25,000 to $34,999 | 2,453 | 5.4% |
| $35,000 to $49,999 | 4,860 | 10.7% |
| $50,000 to $74,999 | 8,676 | 19.1% |
| $75,000 to $99,999 | 6,587 | 14.5% |
| $100,000 to $149,999 | 10,448 | 23.0% |
| $150,000 to $199,999 | 4,679 | 10.3% |
| $200,000+ | 3,543 | 7.8% |
Family Income by Famaliy Size in Moreno Valley
7+ person families (3,744 | 8.2%) account for the highest median family income in Moreno Valley with $112,963 per family, while 2-person families (11,972 | 26.4%) have the highest median income of $34,570 per family member.
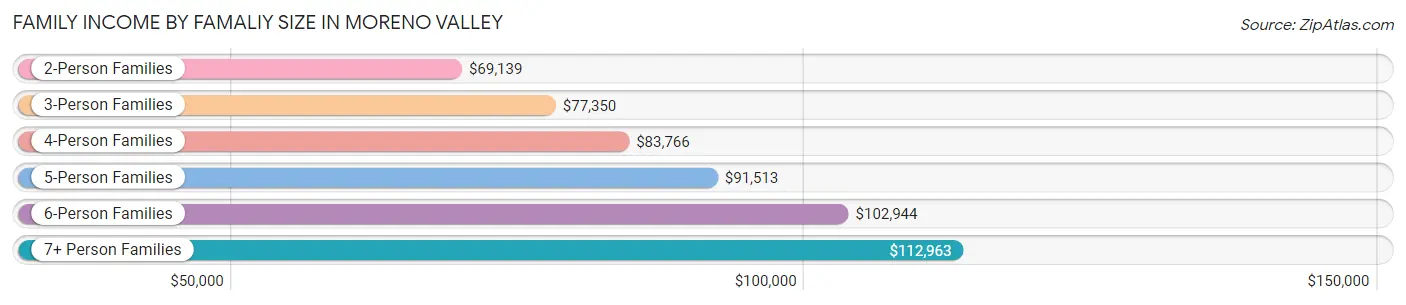
| Income Bracket | # Families | Median Income |
| 2-Person Families | 11,972 (26.4%) | $69,139 |
| 3-Person Families | 10,092 (22.2%) | $77,350 |
| 4-Person Families | 9,912 (21.8%) | $83,766 |
| 5-Person Families | 6,453 (14.2%) | $91,513 |
| 6-Person Families | 3,252 (7.2%) | $102,944 |
| 7+ Person Families | 3,744 (8.2%) | $112,963 |
| Total | 45,425 (100.0%) | $82,697 |
Family Income by Number of Earners in Moreno Valley
The median family income in Moreno Valley is $82,697, with families comprising 3+ earners (9,476) having the highest median family income of $133,898, while families with no earners (3,952) have the lowest median family income of $36,263, accounting for 20.9% and 8.7% of families, respectively.
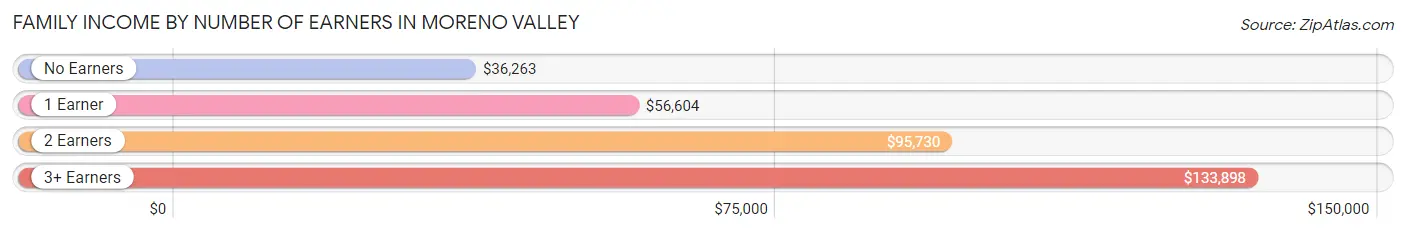
| Number of Earners | # Families | Median Income |
| No Earners | 3,952 (8.7%) | $36,263 |
| 1 Earner | 16,205 (35.7%) | $56,604 |
| 2 Earners | 15,792 (34.8%) | $95,730 |
| 3+ Earners | 9,476 (20.9%) | $133,898 |
| Total | 45,425 (100.0%) | $82,697 |
Household Income in Moreno Valley
Household Income Brackets in Moreno Valley
With 12,141 households falling in the category, the $100,000 to $149,999 income range is the most frequent in Moreno Valley, accounting for 22.5% of all households. In contrast, only 1,133 households (2.1%) fall into the $10,000 to $14,999 income bracket, making it the least populous group.
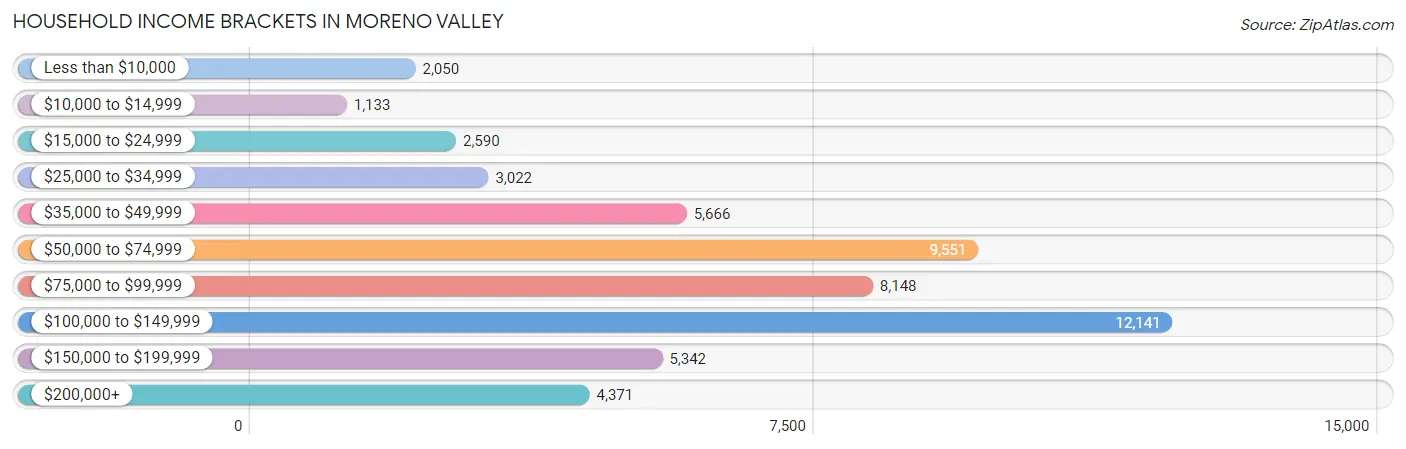
| Income Bracket | # Households | % Households |
| Less than $10,000 | 2,050 | 3.8% |
| $10,000 to $14,999 | 1,133 | 2.1% |
| $15,000 to $24,999 | 2,590 | 4.8% |
| $25,000 to $34,999 | 3,022 | 5.6% |
| $35,000 to $49,999 | 5,666 | 10.5% |
| $50,000 to $74,999 | 9,551 | 17.7% |
| $75,000 to $99,999 | 8,148 | 15.1% |
| $100,000 to $149,999 | 12,141 | 22.5% |
| $150,000 to $199,999 | 5,342 | 9.9% |
| $200,000+ | 4,371 | 8.1% |
Household Income by Householder Age in Moreno Valley
The median household income in Moreno Valley is $82,637, with the highest median household income of $95,144 found in the 45 to 64 years age bracket for the primary householder. A total of 23,080 households (42.8%) fall into this category. Meanwhile, the 15 to 24 years age bracket for the primary householder has the lowest median household income of $51,071, with 1,142 households (2.1%) in this group.
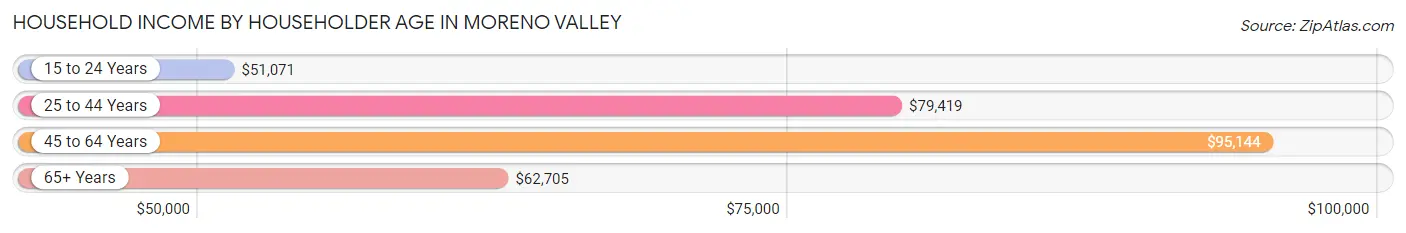
| Income Bracket | # Households | Median Income |
| 15 to 24 Years | 1,142 (2.1%) | $51,071 |
| 25 to 44 Years | 20,473 (37.9%) | $79,419 |
| 45 to 64 Years | 23,080 (42.8%) | $95,144 |
| 65+ Years | 9,263 (17.2%) | $62,705 |
| Total | 53,958 (100.0%) | $82,637 |
Poverty in Moreno Valley
Income Below Poverty by Sex and Age in Moreno Valley
With 11.7% poverty level for males and 14.1% for females among the residents of Moreno Valley, 5 year old males and 12 to 14 year old females are the most vulnerable to poverty, with 418 males (22.7%) and 1,353 females (22.3%) in their respective age groups living below the poverty level.
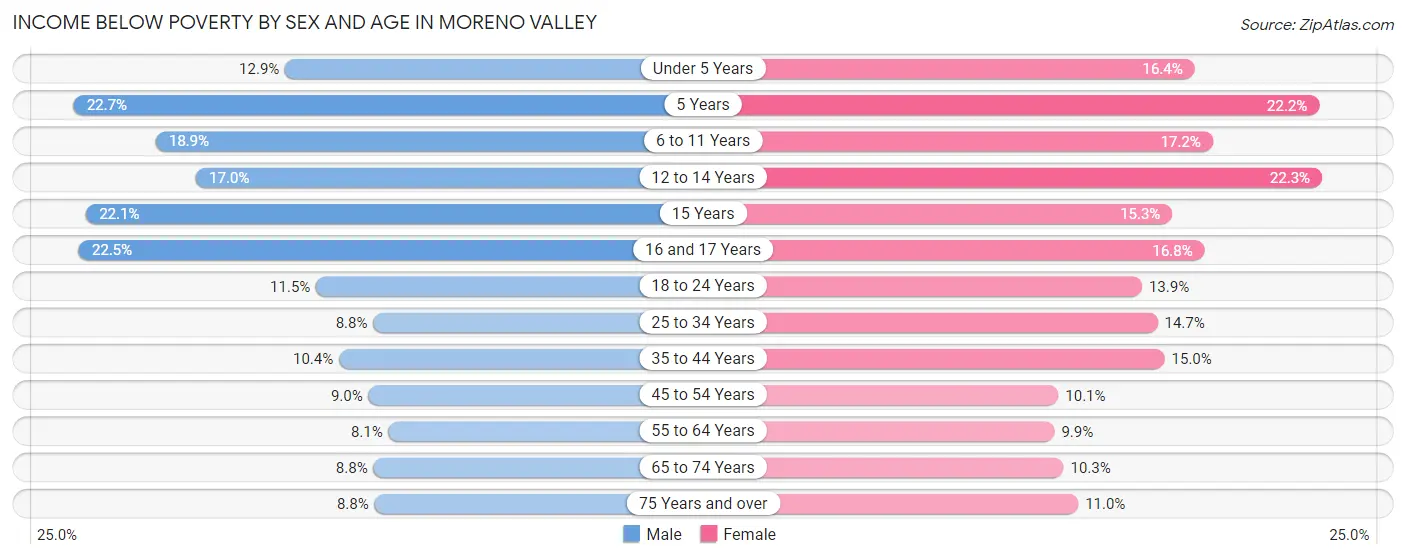
| Age Bracket | Male | Female |
| Under 5 Years | 893 (12.9%) | 1,012 (16.4%) |
| 5 Years | 418 (22.7%) | 352 (22.2%) |
| 6 to 11 Years | 1,747 (18.9%) | 1,536 (17.2%) |
| 12 to 14 Years | 858 (17.0%) | 1,353 (22.3%) |
| 15 Years | 325 (22.1%) | 293 (15.3%) |
| 16 and 17 Years | 696 (22.5%) | 505 (16.8%) |
| 18 to 24 Years | 1,481 (11.5%) | 1,566 (13.9%) |
| 25 to 34 Years | 1,589 (8.8%) | 2,379 (14.6%) |
| 35 to 44 Years | 1,430 (10.4%) | 2,125 (15.0%) |
| 45 to 54 Years | 1,135 (9.0%) | 1,309 (10.1%) |
| 55 to 64 Years | 845 (8.1%) | 1,088 (9.9%) |
| 65 to 74 Years | 536 (8.8%) | 754 (10.3%) |
| 75 Years and over | 212 (8.8%) | 406 (11.0%) |
| Total | 12,165 (11.7%) | 14,678 (14.1%) |
Income Above Poverty by Sex and Age in Moreno Valley
According to the poverty statistics in Moreno Valley, males aged 55 to 64 years and females aged 55 to 64 years are the age groups that are most secure financially, with 91.9% of males and 90.1% of females in these age groups living above the poverty line.
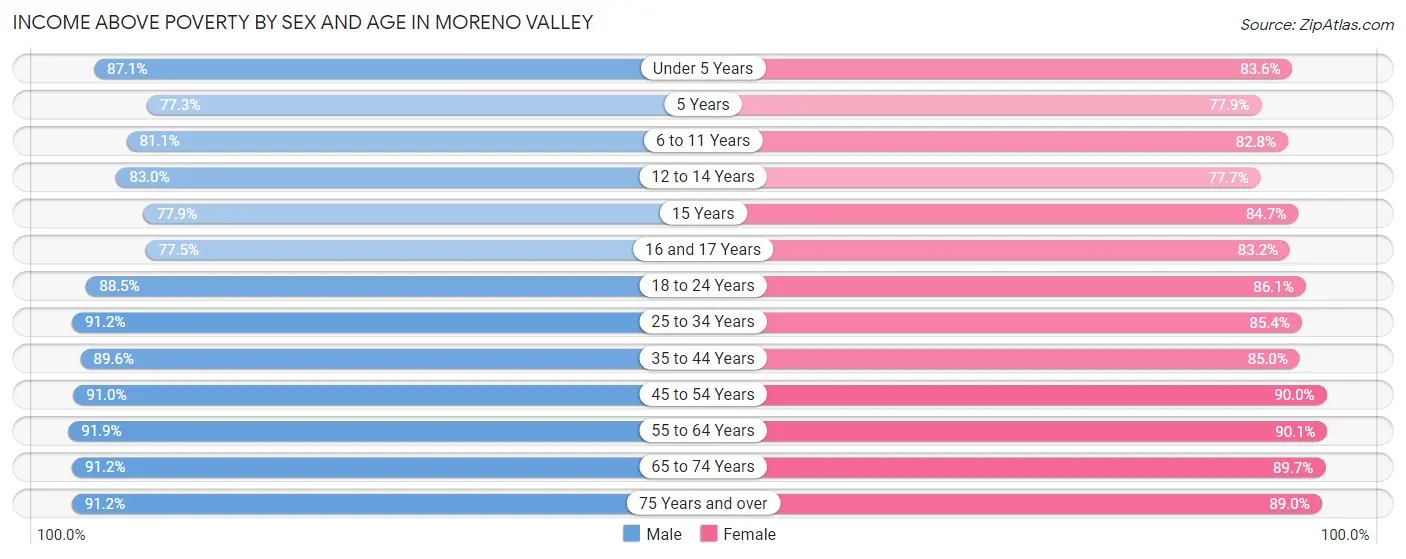
| Age Bracket | Male | Female |
| Under 5 Years | 6,026 (87.1%) | 5,169 (83.6%) |
| 5 Years | 1,422 (77.3%) | 1,237 (77.8%) |
| 6 to 11 Years | 7,493 (81.1%) | 7,390 (82.8%) |
| 12 to 14 Years | 4,177 (83.0%) | 4,721 (77.7%) |
| 15 Years | 1,143 (77.9%) | 1,618 (84.7%) |
| 16 and 17 Years | 2,400 (77.5%) | 2,495 (83.2%) |
| 18 to 24 Years | 11,433 (88.5%) | 9,674 (86.1%) |
| 25 to 34 Years | 16,430 (91.2%) | 13,858 (85.4%) |
| 35 to 44 Years | 12,310 (89.6%) | 12,064 (85.0%) |
| 45 to 54 Years | 11,426 (91.0%) | 11,721 (89.9%) |
| 55 to 64 Years | 9,570 (91.9%) | 9,940 (90.1%) |
| 65 to 74 Years | 5,545 (91.2%) | 6,574 (89.7%) |
| 75 Years and over | 2,208 (91.2%) | 3,295 (89.0%) |
| Total | 91,583 (88.3%) | 89,756 (86.0%) |
Income Below Poverty Among Married-Couple Families in Moreno Valley
The poverty statistics for married-couple families in Moreno Valley show that 5.9% or 1,721 of the total 29,354 families live below the poverty line. Families with 3 or 4 children have the highest poverty rate of 14.3%, comprising of 623 families. On the other hand, families with no children have the lowest poverty rate of 3.2%, which includes 423 families.
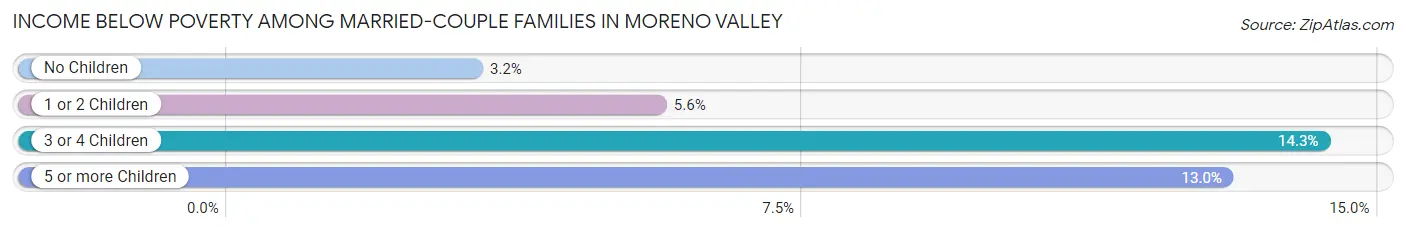
| Children | Above Poverty | Below Poverty |
| No Children | 12,803 (96.8%) | 423 (3.2%) |
| 1 or 2 Children | 10,891 (94.4%) | 646 (5.6%) |
| 3 or 4 Children | 3,745 (85.7%) | 623 (14.3%) |
| 5 or more Children | 194 (87.0%) | 29 (13.0%) |
| Total | 27,633 (94.1%) | 1,721 (5.9%) |
Income Below Poverty Among Single-Parent Households in Moreno Valley
According to the poverty data in Moreno Valley, 10.5% or 509 single-father households and 23.0% or 2,583 single-mother households are living below the poverty line. Among single-father households, those with 1 or 2 children have the highest poverty rate, with 302 households (14.5%) experiencing poverty. Likewise, among single-mother households, those with 5 or more children have the highest poverty rate, with 137 households (86.7%) falling below the poverty line.
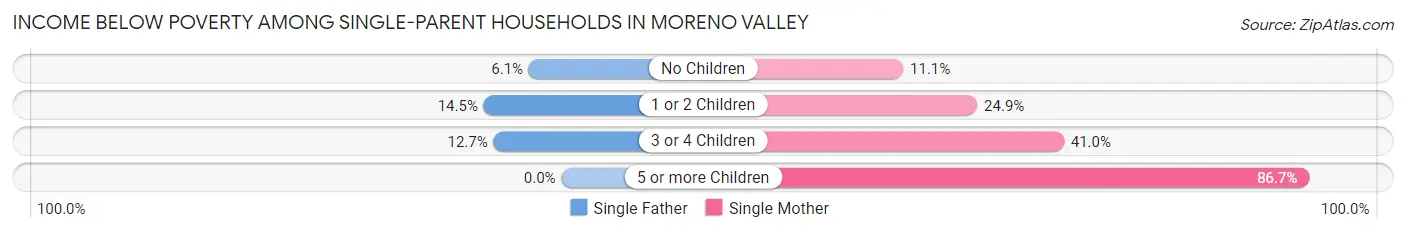
| Children | Single Father | Single Mother |
| No Children | 129 (6.1%) | 466 (11.1%) |
| 1 or 2 Children | 302 (14.5%) | 1,276 (24.9%) |
| 3 or 4 Children | 78 (12.7%) | 704 (41.0%) |
| 5 or more Children | 0 (0.0%) | 137 (86.7%) |
| Total | 509 (10.5%) | 2,583 (23.0%) |
Income Below Poverty Among Married-Couple vs Single-Parent Households in Moreno Valley
The poverty data for Moreno Valley shows that 1,721 of the married-couple family households (5.9%) and 3,092 of the single-parent households (19.2%) are living below the poverty level. Within the married-couple family households, those with 3 or 4 children have the highest poverty rate, with 623 households (14.3%) falling below the poverty line. Among the single-parent households, those with 5 or more children have the highest poverty rate, with 137 household (75.3%) living below poverty.
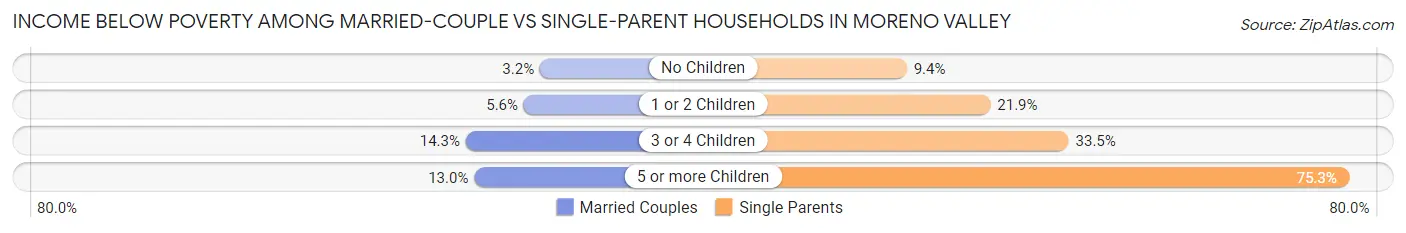
| Children | Married-Couple Families | Single-Parent Households |
| No Children | 423 (3.2%) | 595 (9.4%) |
| 1 or 2 Children | 646 (5.6%) | 1,578 (21.9%) |
| 3 or 4 Children | 623 (14.3%) | 782 (33.5%) |
| 5 or more Children | 29 (13.0%) | 137 (75.3%) |
| Total | 1,721 (5.9%) | 3,092 (19.2%) |
Race in Moreno Valley
The most populous races in Moreno Valley are Hispanic or Latino (126,369 | 60.3%), Some other Race (80,306 | 38.3%), and White / Caucasian (53,760 | 25.7%).
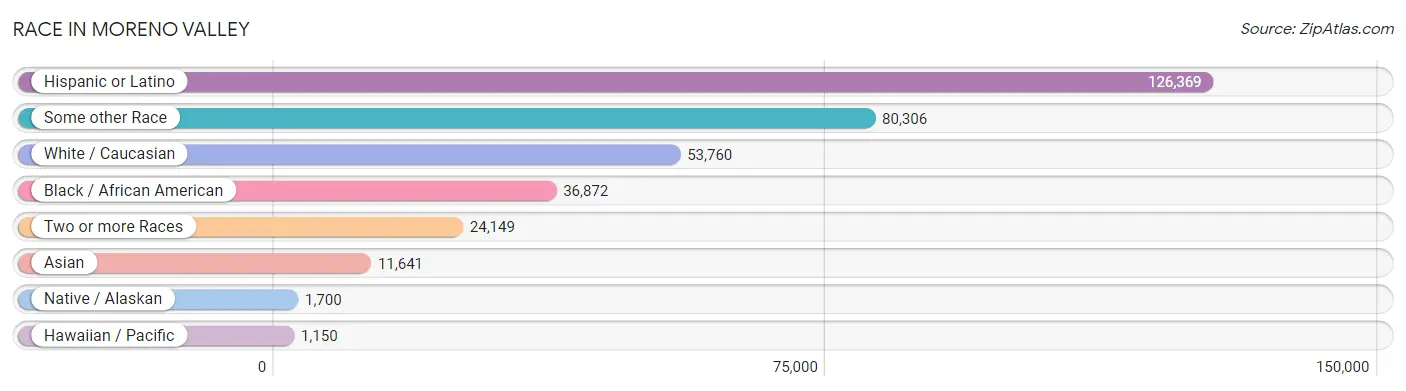
| Race | # Population | % Population |
| Asian | 11,641 | 5.6% |
| Black / African American | 36,872 | 17.6% |
| Hawaiian / Pacific | 1,150 | 0.5% |
| Hispanic or Latino | 126,369 | 60.3% |
| Native / Alaskan | 1,700 | 0.8% |
| White / Caucasian | 53,760 | 25.7% |
| Two or more Races | 24,149 | 11.5% |
| Some other Race | 80,306 | 38.3% |
| Total | 209,578 | 100.0% |
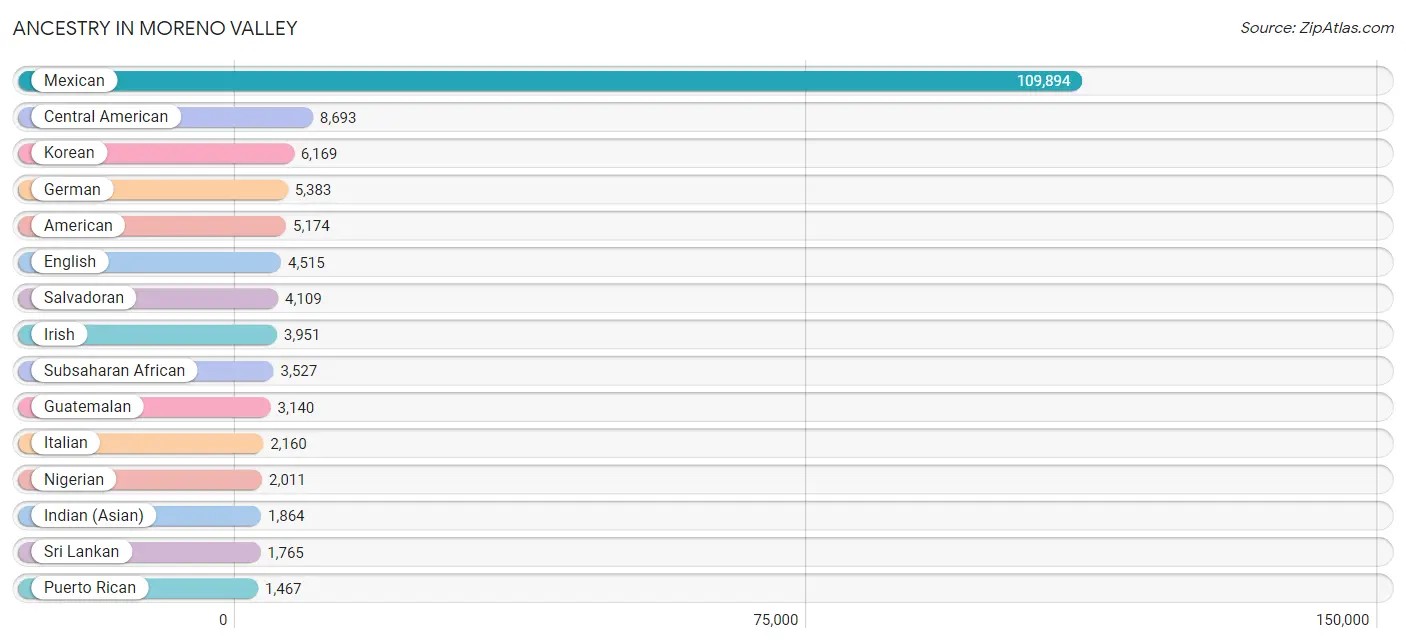
Ancestry in Moreno Valley
The most populous ancestries reported in Moreno Valley are Mexican (109,894 | 52.4%), Central American (8,693 | 4.2%), Korean (6,169 | 2.9%), German (5,383 | 2.6%), and American (5,174 | 2.5%), together accounting for 64.6% of all Moreno Valley residents.
| Ancestry | # Population | % Population |
| Afghan | 83 | 0.0% |
| African | 1,314 | 0.6% |
| American | 5,174 | 2.5% |
| Apache | 268 | 0.1% |
| Arab | 1,249 | 0.6% |
| Argentinean | 116 | 0.1% |
| Armenian | 94 | 0.0% |
| Australian | 11 | 0.0% |
| Austrian | 48 | 0.0% |
| Bahamian | 7 | 0.0% |
| Bangladeshi | 233 | 0.1% |
| Basque | 16 | 0.0% |
| Belgian | 13 | 0.0% |
| Belizean | 87 | 0.0% |
| Bermudan | 28 | 0.0% |
| Bhutanese | 1,062 | 0.5% |
| Blackfeet | 203 | 0.1% |
| Brazilian | 83 | 0.0% |
| British | 335 | 0.2% |
| Burmese | 588 | 0.3% |
| Canadian | 51 | 0.0% |
| Central American | 8,693 | 4.2% |
| Central American Indian | 502 | 0.2% |
| Cherokee | 415 | 0.2% |
| Cheyenne | 44 | 0.0% |
| Chickasaw | 1 | 0.0% |
| Chippewa | 93 | 0.0% |
| Choctaw | 25 | 0.0% |
| Colombian | 381 | 0.2% |
| Comanche | 26 | 0.0% |
| Costa Rican | 41 | 0.0% |
| Creek | 55 | 0.0% |
| Croatian | 23 | 0.0% |
| Cuban | 941 | 0.4% |
| Czech | 119 | 0.1% |
| Czechoslovakian | 30 | 0.0% |
| Danish | 212 | 0.1% |
| Dominican | 95 | 0.1% |
| Dutch | 506 | 0.2% |
| Eastern European | 58 | 0.0% |
| Ecuadorian | 177 | 0.1% |
| Egyptian | 376 | 0.2% |
| English | 4,515 | 2.1% |
| Estonian | 7 | 0.0% |
| Ethiopian | 18 | 0.0% |
| European | 1,169 | 0.6% |
| Filipino | 167 | 0.1% |
| Finnish | 80 | 0.0% |
| French | 1,243 | 0.6% |
| French Canadian | 180 | 0.1% |
| German | 5,383 | 2.6% |
| German Russian | 7 | 0.0% |
| Ghanaian | 90 | 0.0% |
| Greek | 55 | 0.0% |
| Guamanian / Chamorro | 434 | 0.2% |
| Guatemalan | 3,140 | 1.5% |
| Haitian | 38 | 0.0% |
| Honduran | 366 | 0.2% |
| Hungarian | 181 | 0.1% |
| Indian (Asian) | 1,864 | 0.9% |
| Indonesian | 8 | 0.0% |
| Iranian | 48 | 0.0% |
| Iraqi | 107 | 0.1% |
| Irish | 3,951 | 1.9% |
| Iroquois | 11 | 0.0% |
| Italian | 2,160 | 1.0% |
| Jamaican | 154 | 0.1% |
| Japanese | 365 | 0.2% |
| Kenyan | 59 | 0.0% |
| Korean | 6,169 | 2.9% |
| Laotian | 46 | 0.0% |
| Latvian | 21 | 0.0% |
| Lebanese | 41 | 0.0% |
| Lithuanian | 32 | 0.0% |
| Lumbee | 11 | 0.0% |
| Malaysian | 257 | 0.1% |
| Maltese | 5 | 0.0% |
| Mexican | 109,894 | 52.4% |
| Mexican American Indian | 1,055 | 0.5% |
| Mongolian | 7 | 0.0% |
| Native Hawaiian | 349 | 0.2% |
| Navajo | 265 | 0.1% |
| Nicaraguan | 663 | 0.3% |
| Nigerian | 2,011 | 1.0% |
| Northern European | 45 | 0.0% |
| Norwegian | 417 | 0.2% |
| Osage | 6 | 0.0% |
| Paiute | 28 | 0.0% |
| Pakistani | 271 | 0.1% |
| Palestinian | 190 | 0.1% |
| Panamanian | 374 | 0.2% |
| Paraguayan | 28 | 0.0% |
| Peruvian | 608 | 0.3% |
| Polish | 571 | 0.3% |
| Portuguese | 173 | 0.1% |
| Potawatomi | 7 | 0.0% |
| Pueblo | 28 | 0.0% |
| Puerto Rican | 1,467 | 0.7% |
| Romanian | 95 | 0.1% |
| Russian | 149 | 0.1% |
| Salvadoran | 4,109 | 2.0% |
| Samoan | 483 | 0.2% |
| Scandinavian | 439 | 0.2% |
| Scotch-Irish | 362 | 0.2% |
| Scottish | 742 | 0.4% |
| Sierra Leonean | 9 | 0.0% |
| Sioux | 6 | 0.0% |
| Slavic | 11 | 0.0% |
| Slovak | 23 | 0.0% |
| Slovene | 39 | 0.0% |
| South African | 7 | 0.0% |
| South American | 1,329 | 0.6% |
| Spaniard | 822 | 0.4% |
| Spanish | 580 | 0.3% |
| Spanish American | 23 | 0.0% |
| Spanish American Indian | 143 | 0.1% |
| Sri Lankan | 1,765 | 0.8% |
| Subsaharan African | 3,527 | 1.7% |
| Sudanese | 25 | 0.0% |
| Swedish | 604 | 0.3% |
| Swiss | 81 | 0.0% |
| Syrian | 124 | 0.1% |
| Thai | 1,233 | 0.6% |
| Tongan | 136 | 0.1% |
| Trinidadian and Tobagonian | 6 | 0.0% |
| Turkish | 51 | 0.0% |
| Ugandan | 14 | 0.0% |
| Ukrainian | 96 | 0.1% |
| Venezuelan | 19 | 0.0% |
| Welsh | 266 | 0.1% |
| West Indian | 204 | 0.1% |
| Yaqui | 14 | 0.0% |
| Yugoslavian | 18 | 0.0% | View All 133 Rows |
Immigrants in Moreno Valley
The most numerous immigrant groups reported in Moreno Valley came from Latin America (40,607 | 19.4%), Central America (39,406 | 18.8%), Mexico (34,177 | 16.3%), Asia (8,027 | 3.8%), and South Eastern Asia (4,512 | 2.1%), together accounting for 60.5% of all Moreno Valley residents.
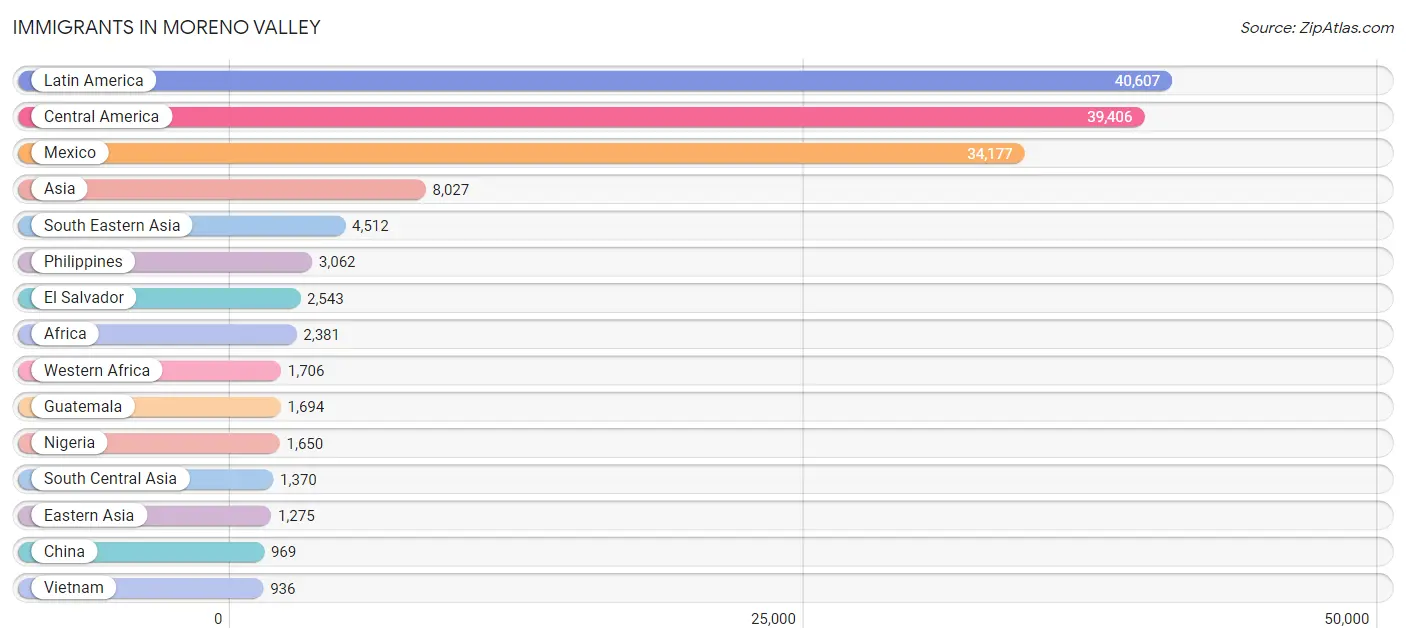
| Immigration Origin | # Population | % Population |
| Afghanistan | 70 | 0.0% |
| Africa | 2,381 | 1.1% |
| Argentina | 56 | 0.0% |
| Armenia | 32 | 0.0% |
| Asia | 8,027 | 3.8% |
| Australia | 40 | 0.0% |
| Austria | 8 | 0.0% |
| Bangladesh | 186 | 0.1% |
| Belize | 92 | 0.0% |
| Brazil | 70 | 0.0% |
| Bulgaria | 45 | 0.0% |
| Cambodia | 140 | 0.1% |
| Canada | 183 | 0.1% |
| Caribbean | 404 | 0.2% |
| Central America | 39,406 | 18.8% |
| China | 969 | 0.5% |
| Colombia | 92 | 0.0% |
| Congo | 4 | 0.0% |
| Costa Rica | 54 | 0.0% |
| Cuba | 249 | 0.1% |
| Czechoslovakia | 13 | 0.0% |
| Dominican Republic | 23 | 0.0% |
| Eastern Africa | 233 | 0.1% |
| Eastern Asia | 1,275 | 0.6% |
| Eastern Europe | 257 | 0.1% |
| Ecuador | 70 | 0.0% |
| Egypt | 355 | 0.2% |
| El Salvador | 2,543 | 1.2% |
| England | 40 | 0.0% |
| Ethiopia | 18 | 0.0% |
| Europe | 625 | 0.3% |
| Fiji | 259 | 0.1% |
| France | 11 | 0.0% |
| Germany | 130 | 0.1% |
| Ghana | 30 | 0.0% |
| Guatemala | 1,694 | 0.8% |
| Guyana | 4 | 0.0% |
| Haiti | 10 | 0.0% |
| Honduras | 251 | 0.1% |
| Hong Kong | 47 | 0.0% |
| Hungary | 28 | 0.0% |
| India | 512 | 0.2% |
| Indonesia | 44 | 0.0% |
| Iran | 80 | 0.0% |
| Iraq | 225 | 0.1% |
| Israel | 8 | 0.0% |
| Italy | 46 | 0.0% |
| Jamaica | 57 | 0.0% |
| Japan | 45 | 0.0% |
| Jordan | 140 | 0.1% |
| Kazakhstan | 7 | 0.0% |
| Kenya | 136 | 0.1% |
| Korea | 261 | 0.1% |
| Kuwait | 53 | 0.0% |
| Laos | 82 | 0.0% |
| Latin America | 40,607 | 19.4% |
| Lebanon | 128 | 0.1% |
| Malaysia | 9 | 0.0% |
| Mexico | 34,177 | 16.3% |
| Middle Africa | 4 | 0.0% |
| Morocco | 5 | 0.0% |
| Nepal | 50 | 0.0% |
| Netherlands | 9 | 0.0% |
| Nicaragua | 442 | 0.2% |
| Nigeria | 1,650 | 0.8% |
| Northern Africa | 376 | 0.2% |
| Northern Europe | 127 | 0.1% |
| Oceania | 314 | 0.2% |
| Pakistan | 374 | 0.2% |
| Panama | 153 | 0.1% |
| Peru | 438 | 0.2% |
| Philippines | 3,062 | 1.5% |
| Poland | 68 | 0.0% |
| Romania | 86 | 0.0% |
| Russia | 9 | 0.0% |
| Scotland | 28 | 0.0% |
| Serbia | 2 | 0.0% |
| Sierra Leone | 16 | 0.0% |
| South America | 797 | 0.4% |
| South Central Asia | 1,370 | 0.6% |
| South Eastern Asia | 4,512 | 2.1% |
| Southern Europe | 83 | 0.0% |
| Spain | 37 | 0.0% |
| Sri Lanka | 91 | 0.0% |
| Sweden | 23 | 0.0% |
| Syria | 168 | 0.1% |
| Taiwan | 176 | 0.1% |
| Thailand | 212 | 0.1% |
| Trinidad and Tobago | 36 | 0.0% |
| Turkey | 36 | 0.0% |
| Uganda | 60 | 0.0% |
| Vietnam | 936 | 0.4% |
| Western Africa | 1,706 | 0.8% |
| Western Asia | 807 | 0.4% |
| Western Europe | 158 | 0.1% | View All 95 Rows |
Sex and Age in Moreno Valley
Sex and Age in Moreno Valley
The most populous age groups in Moreno Valley are 20 to 24 Years (9,583 | 9.2%) for men and 10 to 14 Years (9,491 | 9.0%) for women.
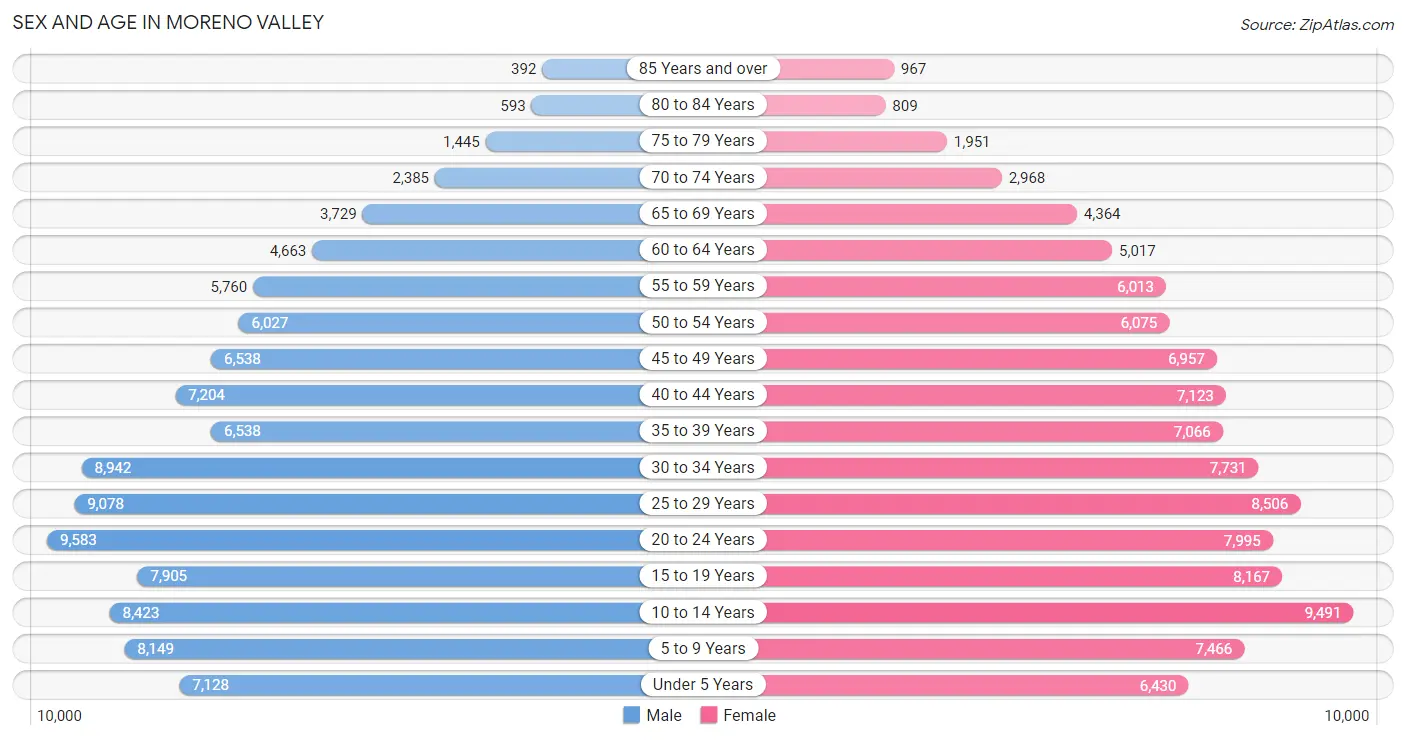
| Age Bracket | Male | Female |
| Under 5 Years | 7,128 (6.8%) | 6,430 (6.1%) |
| 5 to 9 Years | 8,149 (7.8%) | 7,466 (7.1%) |
| 10 to 14 Years | 8,423 (8.1%) | 9,491 (9.0%) |
| 15 to 19 Years | 7,905 (7.6%) | 8,167 (7.8%) |
| 20 to 24 Years | 9,583 (9.2%) | 7,995 (7.6%) |
| 25 to 29 Years | 9,078 (8.7%) | 8,506 (8.1%) |
| 30 to 34 Years | 8,942 (8.6%) | 7,731 (7.4%) |
| 35 to 39 Years | 6,538 (6.3%) | 7,066 (6.7%) |
| 40 to 44 Years | 7,204 (6.9%) | 7,123 (6.8%) |
| 45 to 49 Years | 6,538 (6.3%) | 6,957 (6.6%) |
| 50 to 54 Years | 6,027 (5.8%) | 6,075 (5.8%) |
| 55 to 59 Years | 5,760 (5.5%) | 6,013 (5.7%) |
| 60 to 64 Years | 4,663 (4.5%) | 5,017 (4.8%) |
| 65 to 69 Years | 3,729 (3.6%) | 4,364 (4.2%) |
| 70 to 74 Years | 2,385 (2.3%) | 2,968 (2.8%) |
| 75 to 79 Years | 1,445 (1.4%) | 1,951 (1.9%) |
| 80 to 84 Years | 593 (0.6%) | 809 (0.8%) |
| 85 Years and over | 392 (0.4%) | 967 (0.9%) |
| Total | 104,482 (100.0%) | 105,096 (100.0%) |
Families and Households in Moreno Valley
Median Family Size in Moreno Valley
The median family size in Moreno Valley is 4.12 persons per family, with married-couple families (29,354 | 64.6%) accounting for the largest median family size of 4.31 persons per family. On the other hand, single male/father families (4,855 | 10.7%) represent the smallest median family size with 3.44 persons per family.
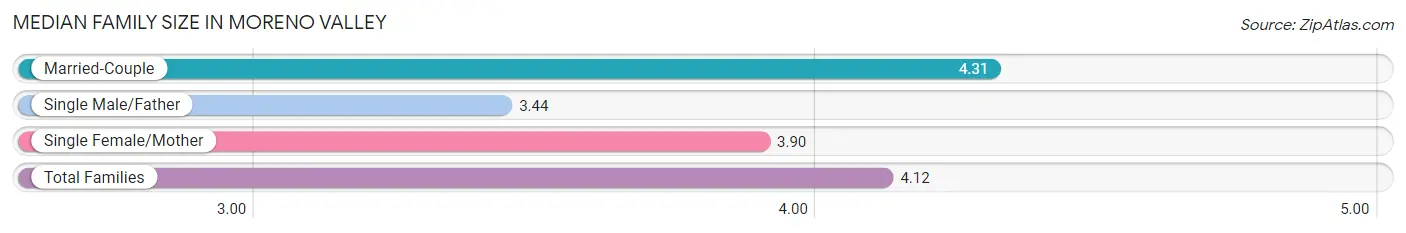
| Family Type | # Families | Family Size |
| Married-Couple | 29,354 (64.6%) | 4.31 |
| Single Male/Father | 4,855 (10.7%) | 3.44 |
| Single Female/Mother | 11,216 (24.7%) | 3.90 |
| Total Families | 45,425 (100.0%) | 4.12 |
Median Household Size in Moreno Valley
The median household size in Moreno Valley is 3.87 persons per household, with married-couple households (29,354 | 54.4%) accounting for the largest median household size of 4.38 persons per household. non-family households (8,533 | 15.8%) represent the smallest median household size with 1.56 persons per household.
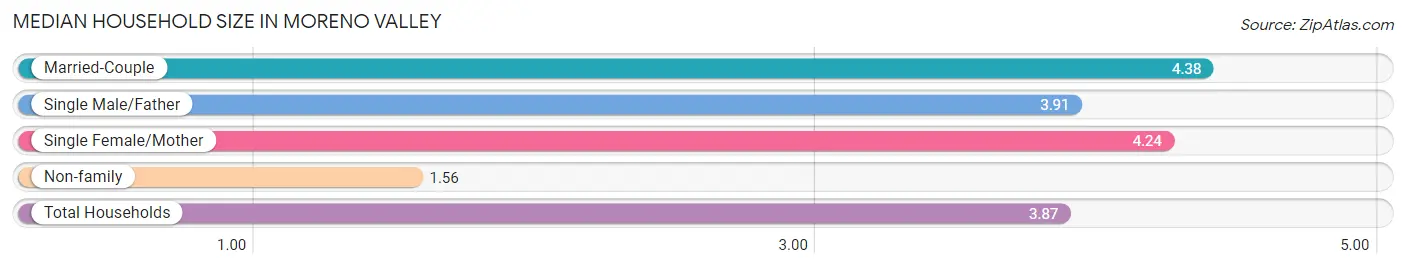
| Household Type | # Households | Household Size |
| Married-Couple | 29,354 (54.4%) | 4.38 |
| Single Male/Father | 4,855 (9.0%) | 3.91 |
| Single Female/Mother | 11,216 (20.8%) | 4.24 |
| Non-family | 8,533 (15.8%) | 1.56 |
| Total Households | 53,958 (100.0%) | 3.87 |
Household Size by Marriage Status in Moreno Valley
Out of a total of 53,958 households in Moreno Valley, 45,425 (84.2%) are family households, while 8,533 (15.8%) are nonfamily households. The most numerous type of family households are 2-person households, comprising 10,573, and the most common type of nonfamily households are 1-person households, comprising 5,968.
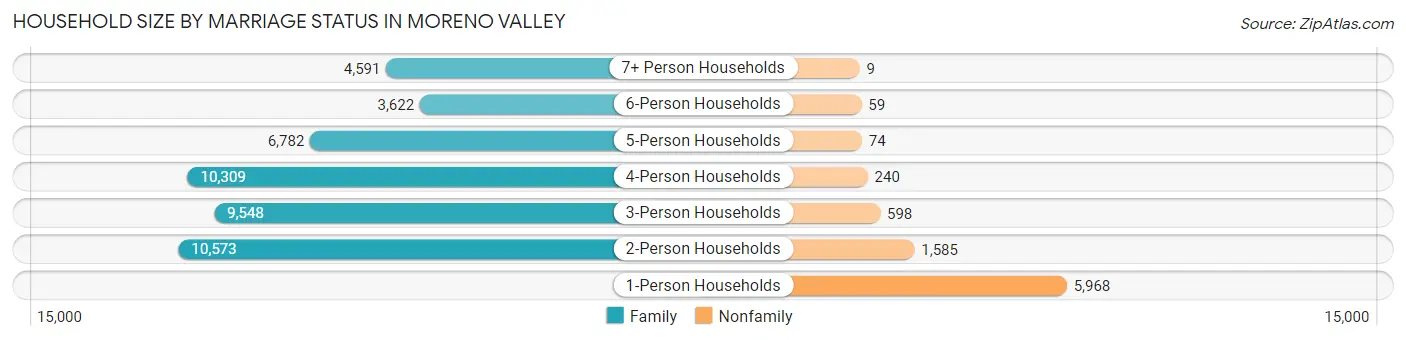
| Household Size | Family Households | Nonfamily Households |
| 1-Person Households | - | 5,968 (11.1%) |
| 2-Person Households | 10,573 (19.6%) | 1,585 (2.9%) |
| 3-Person Households | 9,548 (17.7%) | 598 (1.1%) |
| 4-Person Households | 10,309 (19.1%) | 240 (0.4%) |
| 5-Person Households | 6,782 (12.6%) | 74 (0.1%) |
| 6-Person Households | 3,622 (6.7%) | 59 (0.1%) |
| 7+ Person Households | 4,591 (8.5%) | 9 (0.0%) |
| Total | 45,425 (84.2%) | 8,533 (15.8%) |
Female Fertility in Moreno Valley
Fertility by Age in Moreno Valley
Average fertility rate in Moreno Valley is 52.0 births per 1,000 women. Women in the age bracket of 20 to 34 years have the highest fertility rate with 76.0 births per 1,000 women. Women in the age bracket of 20 to 34 years acount for 64.0% of all women with births.
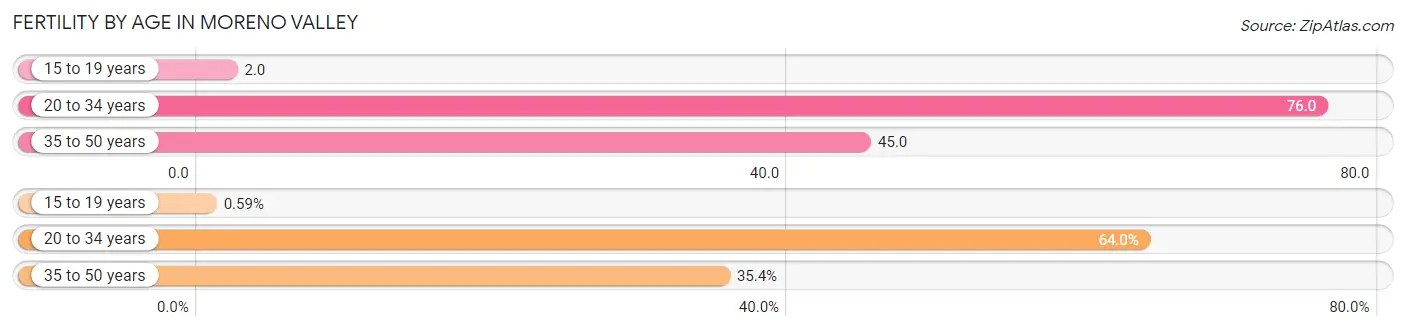
| Age Bracket | Women with Births | Births / 1,000 Women |
| 15 to 19 years | 17 (0.6%) | 2.0 |
| 20 to 34 years | 1,837 (64.0%) | 76.0 |
| 35 to 50 years | 1,017 (35.4%) | 45.0 |
| Total | 2,871 (100.0%) | 52.0 |
Fertility by Age by Marriage Status in Moreno Valley
66.0% of women with births (2,871) in Moreno Valley are married. The highest percentage of unmarried women with births falls into 15 to 19 years age bracket with 100.0% of them unmarried at the time of birth, while the lowest percentage of unmarried women with births belong to 35 to 50 years age bracket with 26.5% of them unmarried.
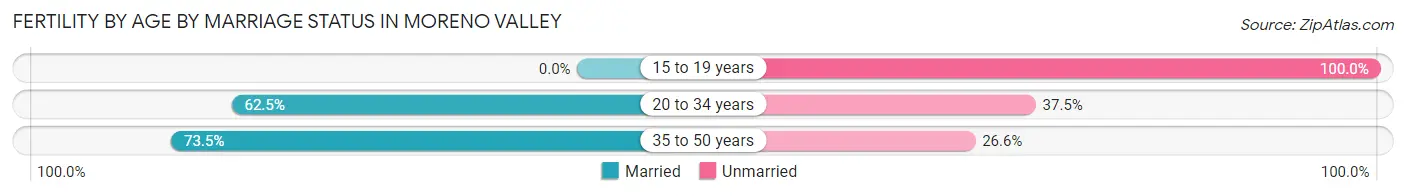
| Age Bracket | Married | Unmarried |
| 15 to 19 years | 0 (0.0%) | 17 (100.0%) |
| 20 to 34 years | 1,148 (62.5%) | 689 (37.5%) |
| 35 to 50 years | 747 (73.5%) | 270 (26.6%) |
| Total | 1,895 (66.0%) | 976 (34.0%) |
Fertility by Education in Moreno Valley
Average fertility rate in Moreno Valley is 52.0 births per 1,000 women. Women with the education attainment of graduate degree have the highest fertility rate of 96.0 births per 1,000 women, while women with the education attainment of less than high school have the lowest fertility at 12.0 births per 1,000 women. Women with the education attainment of high school diploma represent 37.0% of all women with births.
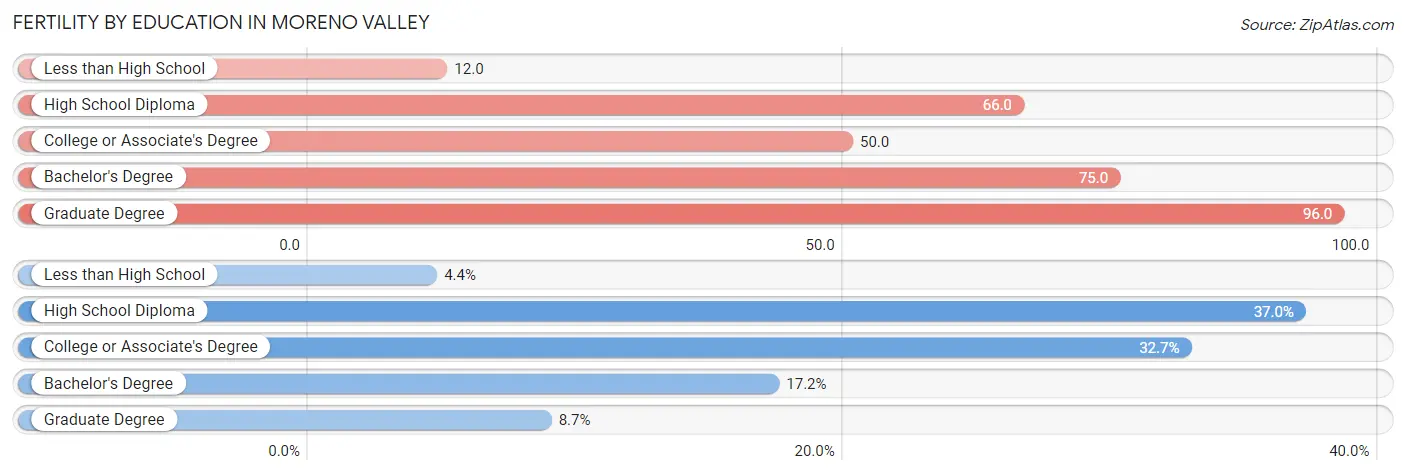
| Educational Attainment | Women with Births | Births / 1,000 Women |
| Less than High School | 127 (4.4%) | 12.0 |
| High School Diploma | 1,061 (37.0%) | 66.0 |
| College or Associate's Degree | 938 (32.7%) | 50.0 |
| Bachelor's Degree | 495 (17.2%) | 75.0 |
| Graduate Degree | 250 (8.7%) | 96.0 |
| Total | 2,871 (100.0%) | 52.0 |
Fertility by Education by Marriage Status in Moreno Valley
34.0% of women with births in Moreno Valley are unmarried. Women with the educational attainment of graduate degree are most likely to be married with 97.2% of them married at childbirth, while women with the educational attainment of college or associate's degree are least likely to be married with 48.0% of them unmarried at childbirth.
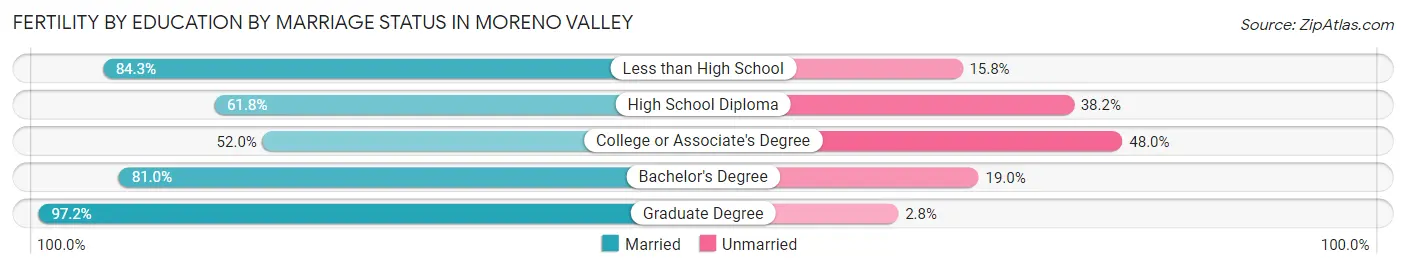
| Educational Attainment | Married | Unmarried |
| Less than High School | 107 (84.3%) | 20 (15.8%) |
| High School Diploma | 656 (61.8%) | 405 (38.2%) |
| College or Associate's Degree | 488 (52.0%) | 450 (48.0%) |
| Bachelor's Degree | 401 (81.0%) | 94 (19.0%) |
| Graduate Degree | 243 (97.2%) | 7 (2.8%) |
| Total | 1,895 (66.0%) | 976 (34.0%) |
Employment Characteristics in Moreno Valley
Employment by Class of Employer in Moreno Valley
Among the 91,657 employed individuals in Moreno Valley, private company employees (66,849 | 72.9%), local government employees (8,768 | 9.6%), and self-employed (not incorporated) (4,439 | 4.8%) make up the most common classes of employment.
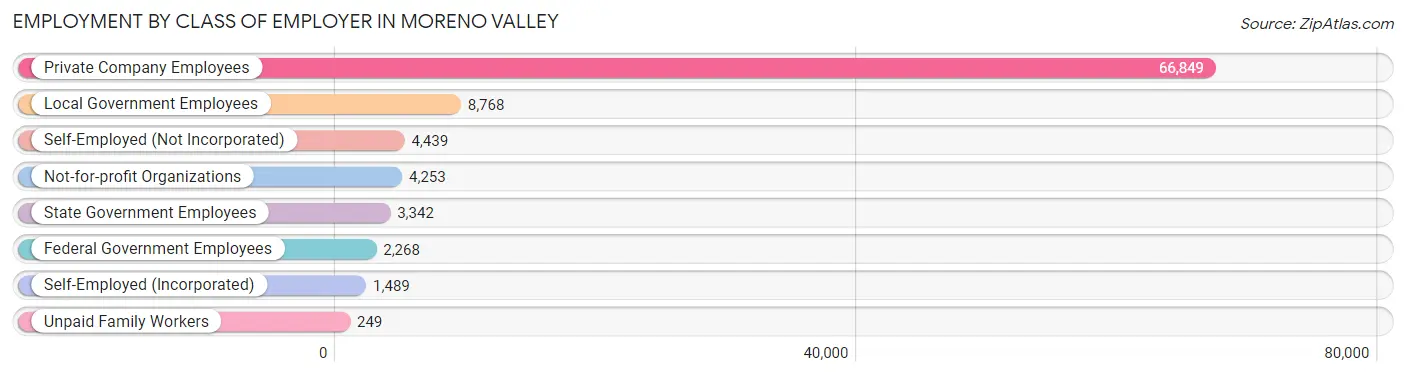
| Employer Class | # Employees | % Employees |
| Private Company Employees | 66,849 | 72.9% |
| Self-Employed (Incorporated) | 1,489 | 1.6% |
| Self-Employed (Not Incorporated) | 4,439 | 4.8% |
| Not-for-profit Organizations | 4,253 | 4.6% |
| Local Government Employees | 8,768 | 9.6% |
| State Government Employees | 3,342 | 3.6% |
| Federal Government Employees | 2,268 | 2.5% |
| Unpaid Family Workers | 249 | 0.3% |
| Total | 91,657 | 100.0% |
Employment Status by Age in Moreno Valley
According to the labor force statistics for Moreno Valley, out of the total population over 16 years of age (159,108), 64.6% or 102,784 individuals are in the labor force, with 7.5% or 7,709 of them unemployed. The age group with the highest labor force participation rate is 25 to 29 years, with 80.9% or 14,225 individuals in the labor force. Within the labor force, the 16 to 19 years age range has the highest percentage of unemployed individuals, with 20.3% or 770 of them being unemployed.
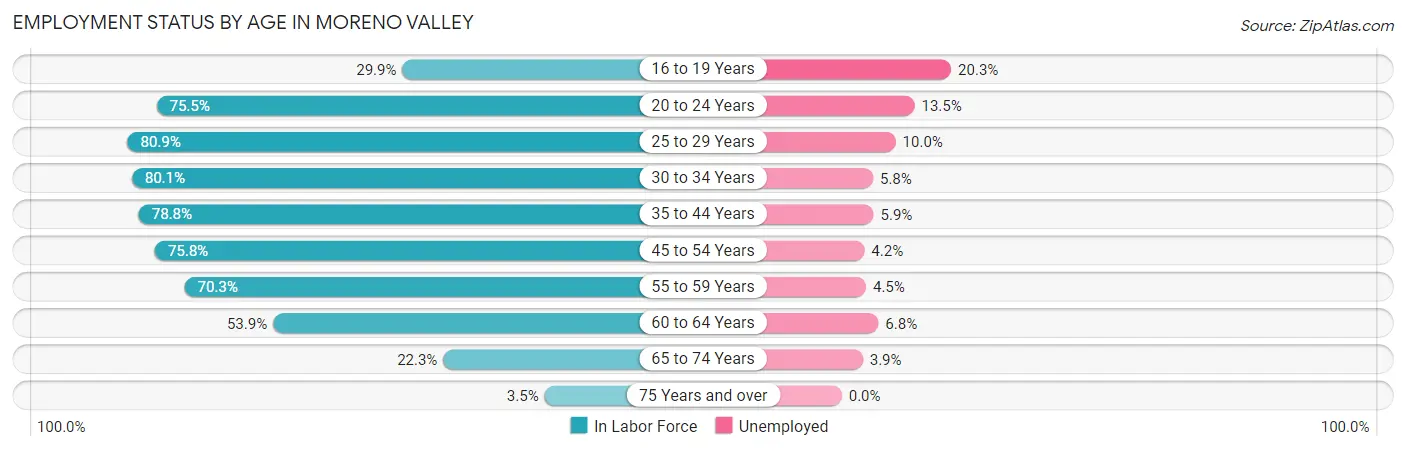
| Age Bracket | In Labor Force | Unemployed |
| 16 to 19 Years | 3,794 (29.9%) | 770 (20.3%) |
| 20 to 24 Years | 13,271 (75.5%) | 1,792 (13.5%) |
| 25 to 29 Years | 14,225 (80.9%) | 1,422 (10.0%) |
| 30 to 34 Years | 13,355 (80.1%) | 775 (5.8%) |
| 35 to 44 Years | 22,010 (78.8%) | 1,299 (5.9%) |
| 45 to 54 Years | 19,403 (75.8%) | 815 (4.2%) |
| 55 to 59 Years | 8,276 (70.3%) | 372 (4.5%) |
| 60 to 64 Years | 5,218 (53.9%) | 355 (6.8%) |
| 65 to 74 Years | 2,998 (22.3%) | 117 (3.9%) |
| 75 Years and over | 215 (3.5%) | 0 (0.0%) |
| Total | 102,784 (64.6%) | 7,709 (7.5%) |
Employment Status by Educational Attainment in Moreno Valley
According to labor force statistics for Moreno Valley, 75.5% of individuals (82,475) out of the total population between 25 and 64 years of age (109,238) are in the labor force, with 6.1% or 5,031 of them being unemployed. The group with the highest labor force participation rate are those with the educational attainment of bachelor's degree or higher, with 82.8% or 15,271 individuals in the labor force. Within the labor force, individuals with less than high school education have the highest percentage of unemployment, with 8.0% or 1,121 of them being unemployed.
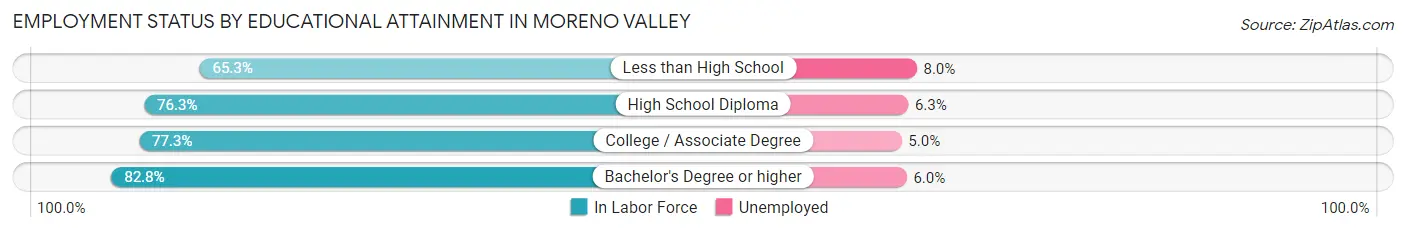
| Educational Attainment | In Labor Force | Unemployed |
| Less than High School | 14,012 (65.3%) | 1,717 (8.0%) |
| High School Diploma | 26,063 (76.3%) | 2,152 (6.3%) |
| College / Associate Degree | 27,193 (77.3%) | 1,759 (5.0%) |
| Bachelor's Degree or higher | 15,271 (82.8%) | 1,107 (6.0%) |
| Total | 82,475 (75.5%) | 6,664 (6.1%) |
Employment Occupations by Sex in Moreno Valley
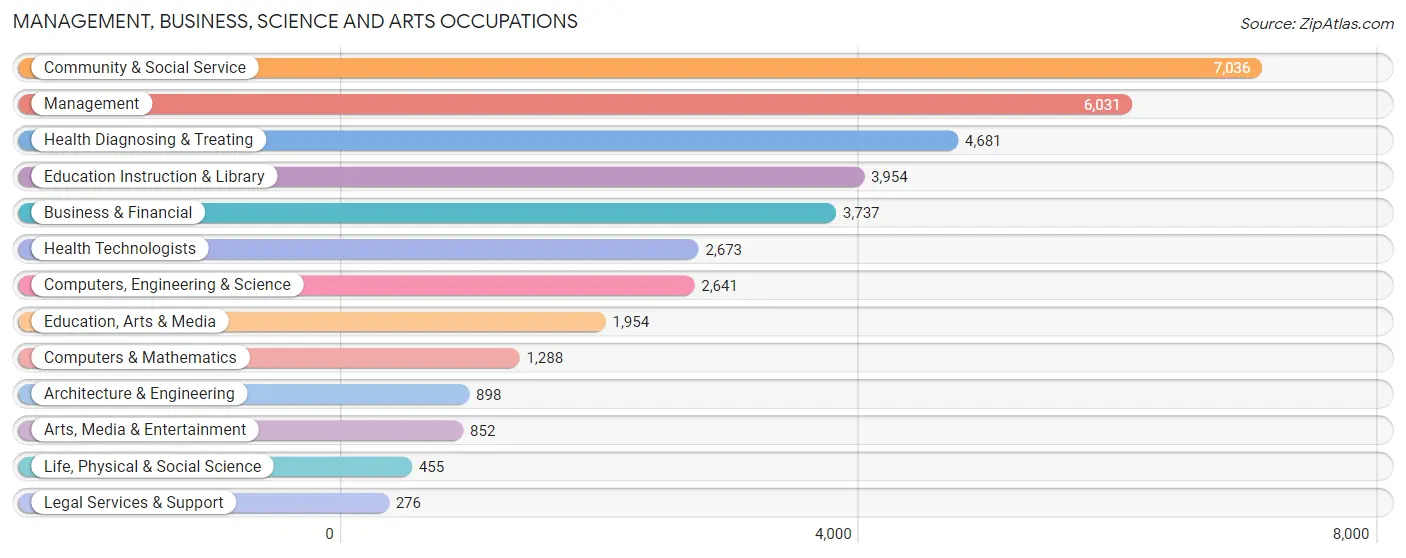
Management, Business, Science and Arts Occupations
The most common Management, Business, Science and Arts occupations in Moreno Valley are Community & Social Service (7,036 | 7.4%), Management (6,031 | 6.4%), Health Diagnosing & Treating (4,681 | 4.9%), Education Instruction & Library (3,954 | 4.2%), and Business & Financial (3,737 | 3.9%).
Management, Business, Science and Arts Occupations by Sex
Within the Management, Business, Science and Arts occupations in Moreno Valley, the most male-oriented occupations are Architecture & Engineering (81.2%), Computers, Engineering & Science (73.7%), and Computers & Mathematics (71.0%), while the most female-oriented occupations are Legal Services & Support (92.4%), Health Diagnosing & Treating (78.3%), and Health Technologists (75.9%).
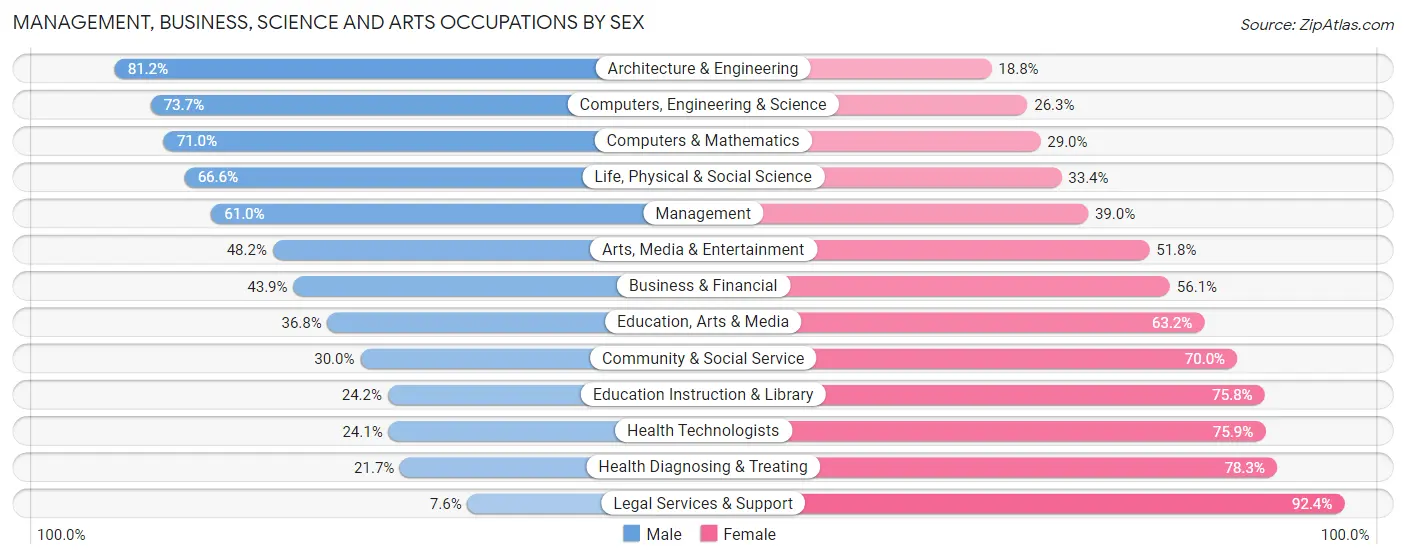
| Occupation | Male | Female |
| Management | 3,681 (61.0%) | 2,350 (39.0%) |
| Business & Financial | 1,642 (43.9%) | 2,095 (56.1%) |
| Computers, Engineering & Science | 1,946 (73.7%) | 695 (26.3%) |
| Computers & Mathematics | 914 (71.0%) | 374 (29.0%) |
| Architecture & Engineering | 729 (81.2%) | 169 (18.8%) |
| Life, Physical & Social Science | 303 (66.6%) | 152 (33.4%) |
| Community & Social Service | 2,109 (30.0%) | 4,927 (70.0%) |
| Education, Arts & Media | 719 (36.8%) | 1,235 (63.2%) |
| Legal Services & Support | 21 (7.6%) | 255 (92.4%) |
| Education Instruction & Library | 958 (24.2%) | 2,996 (75.8%) |
| Arts, Media & Entertainment | 411 (48.2%) | 441 (51.8%) |
| Health Diagnosing & Treating | 1,014 (21.7%) | 3,667 (78.3%) |
| Health Technologists | 644 (24.1%) | 2,029 (75.9%) |
| Total (Category) | 10,392 (43.1%) | 13,734 (56.9%) |
| Total (Overall) | 53,652 (56.6%) | 41,094 (43.4%) |
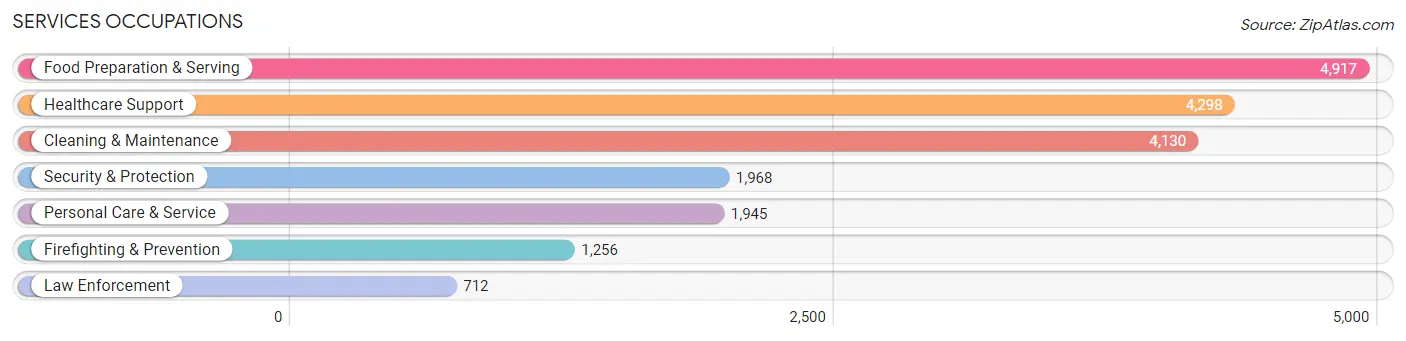
Services Occupations
The most common Services occupations in Moreno Valley are Food Preparation & Serving (4,917 | 5.2%), Healthcare Support (4,298 | 4.5%), Cleaning & Maintenance (4,130 | 4.4%), Security & Protection (1,968 | 2.1%), and Personal Care & Service (1,945 | 2.1%).
Services Occupations by Sex
Within the Services occupations in Moreno Valley, the most male-oriented occupations are Firefighting & Prevention (75.5%), Security & Protection (72.3%), and Cleaning & Maintenance (71.7%), while the most female-oriented occupations are Healthcare Support (84.9%), Personal Care & Service (72.2%), and Food Preparation & Serving (49.3%).
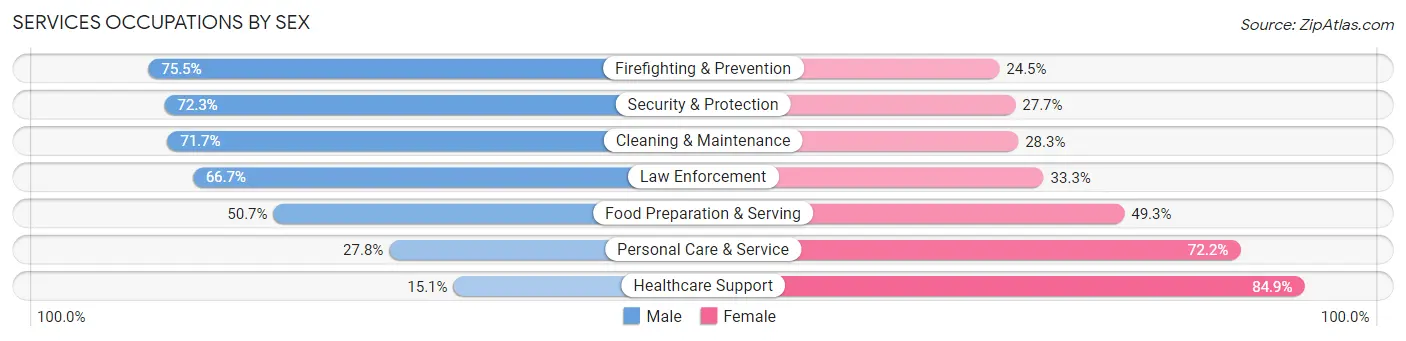
| Occupation | Male | Female |
| Healthcare Support | 649 (15.1%) | 3,649 (84.9%) |
| Security & Protection | 1,423 (72.3%) | 545 (27.7%) |
| Firefighting & Prevention | 948 (75.5%) | 308 (24.5%) |
| Law Enforcement | 475 (66.7%) | 237 (33.3%) |
| Food Preparation & Serving | 2,495 (50.7%) | 2,422 (49.3%) |
| Cleaning & Maintenance | 2,963 (71.7%) | 1,167 (28.3%) |
| Personal Care & Service | 541 (27.8%) | 1,404 (72.2%) |
| Total (Category) | 8,071 (46.8%) | 9,187 (53.2%) |
| Total (Overall) | 53,652 (56.6%) | 41,094 (43.4%) |
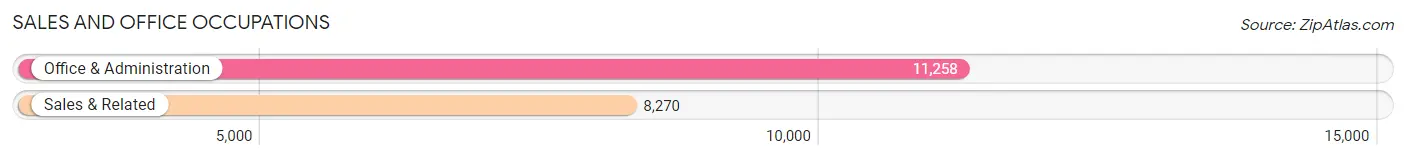
Sales and Office Occupations
The most common Sales and Office occupations in Moreno Valley are Office & Administration (11,258 | 11.9%), and Sales & Related (8,270 | 8.7%).
Sales and Office Occupations by Sex
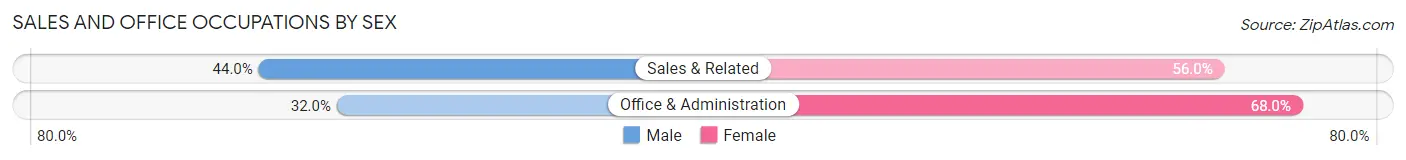
| Occupation | Male | Female |
| Sales & Related | 3,639 (44.0%) | 4,631 (56.0%) |
| Office & Administration | 3,599 (32.0%) | 7,659 (68.0%) |
| Total (Category) | 7,238 (37.1%) | 12,290 (62.9%) |
| Total (Overall) | 53,652 (56.6%) | 41,094 (43.4%) |
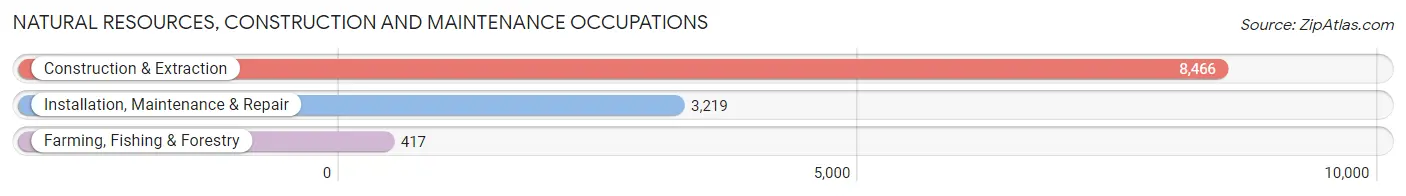
Natural Resources, Construction and Maintenance Occupations
The most common Natural Resources, Construction and Maintenance occupations in Moreno Valley are Construction & Extraction (8,466 | 8.9%), Installation, Maintenance & Repair (3,219 | 3.4%), and Farming, Fishing & Forestry (417 | 0.4%).
Natural Resources, Construction and Maintenance Occupations by Sex
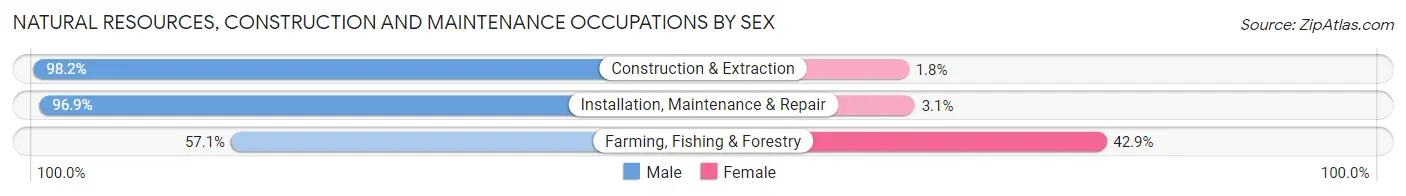
| Occupation | Male | Female |
| Farming, Fishing & Forestry | 238 (57.1%) | 179 (42.9%) |
| Construction & Extraction | 8,311 (98.2%) | 155 (1.8%) |
| Installation, Maintenance & Repair | 3,120 (96.9%) | 99 (3.1%) |
| Total (Category) | 11,669 (96.4%) | 433 (3.6%) |
| Total (Overall) | 53,652 (56.6%) | 41,094 (43.4%) |
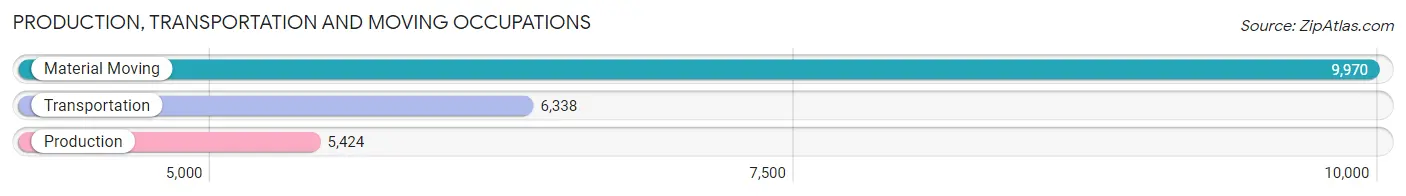
Production, Transportation and Moving Occupations
The most common Production, Transportation and Moving occupations in Moreno Valley are Material Moving (9,970 | 10.5%), Transportation (6,338 | 6.7%), and Production (5,424 | 5.7%).
Production, Transportation and Moving Occupations by Sex
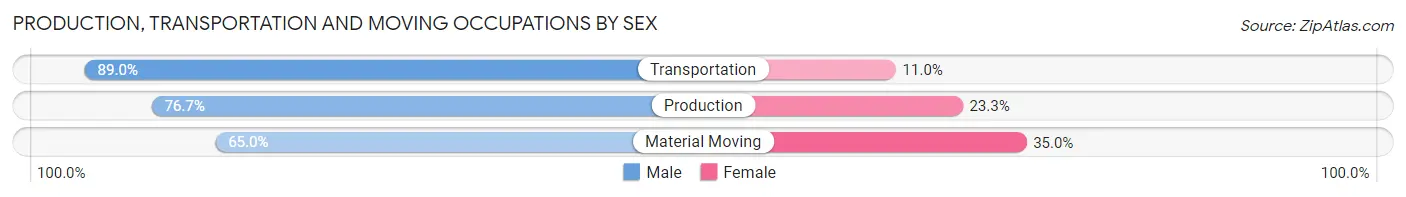
| Occupation | Male | Female |
| Production | 4,161 (76.7%) | 1,263 (23.3%) |
| Transportation | 5,639 (89.0%) | 699 (11.0%) |
| Material Moving | 6,482 (65.0%) | 3,488 (35.0%) |
| Total (Category) | 16,282 (74.9%) | 5,450 (25.1%) |
| Total (Overall) | 53,652 (56.6%) | 41,094 (43.4%) |
Employment Industries by Sex in Moreno Valley
Employment Industries in Moreno Valley
The major employment industries in Moreno Valley include Retail Trade (13,667 | 14.4%), Transportation & Warehousing (12,356 | 13.0%), Health Care & Social Assistance (11,785 | 12.4%), Construction (9,732 | 10.3%), and Educational Services (6,727 | 7.1%).
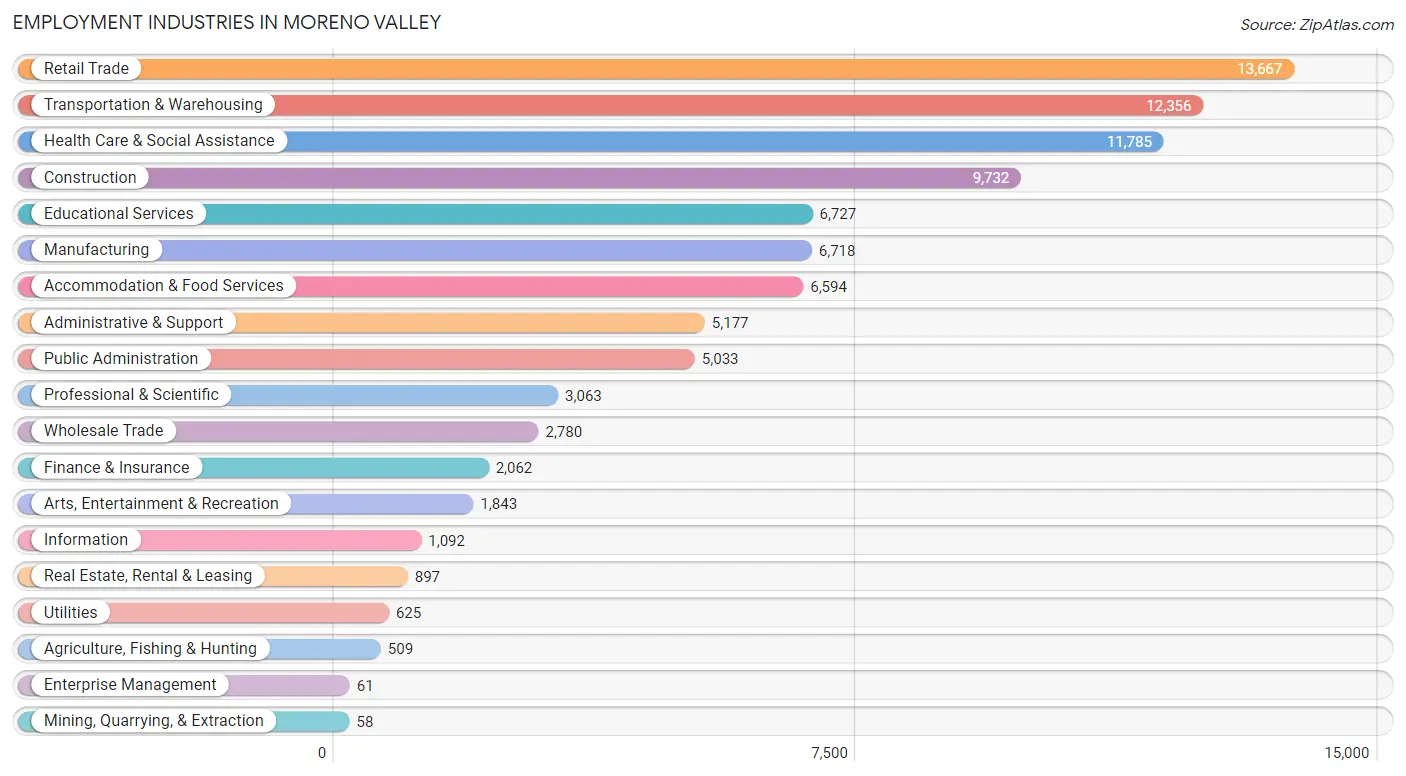
Employment Industries by Sex in Moreno Valley
The Moreno Valley industries that see more men than women are Mining, Quarrying, & Extraction (100.0%), Construction (94.0%), and Utilities (82.7%), whereas the industries that tend to have a higher number of women are Health Care & Social Assistance (79.5%), Educational Services (68.6%), and Public Administration (61.1%).
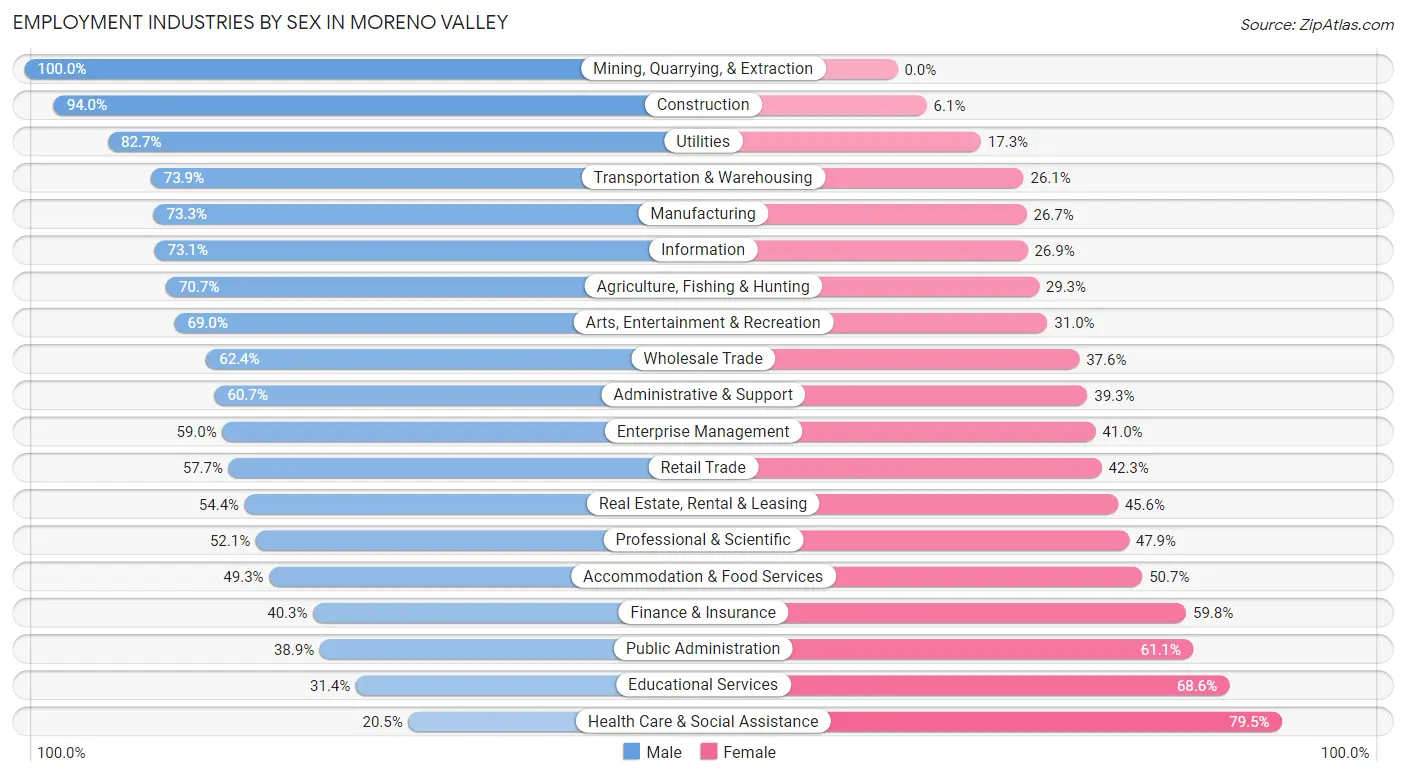
| Industry | Male | Female |
| Agriculture, Fishing & Hunting | 360 (70.7%) | 149 (29.3%) |
| Mining, Quarrying, & Extraction | 58 (100.0%) | 0 (0.0%) |
| Construction | 9,143 (94.0%) | 589 (6.0%) |
| Manufacturing | 4,923 (73.3%) | 1,795 (26.7%) |
| Wholesale Trade | 1,734 (62.4%) | 1,046 (37.6%) |
| Retail Trade | 7,892 (57.7%) | 5,775 (42.3%) |
| Transportation & Warehousing | 9,129 (73.9%) | 3,227 (26.1%) |
| Utilities | 517 (82.7%) | 108 (17.3%) |
| Information | 798 (73.1%) | 294 (26.9%) |
| Finance & Insurance | 830 (40.3%) | 1,232 (59.8%) |
| Real Estate, Rental & Leasing | 488 (54.4%) | 409 (45.6%) |
| Professional & Scientific | 1,596 (52.1%) | 1,467 (47.9%) |
| Enterprise Management | 36 (59.0%) | 25 (41.0%) |
| Administrative & Support | 3,142 (60.7%) | 2,035 (39.3%) |
| Educational Services | 2,111 (31.4%) | 4,616 (68.6%) |
| Health Care & Social Assistance | 2,420 (20.5%) | 9,365 (79.5%) |
| Arts, Entertainment & Recreation | 1,271 (69.0%) | 572 (31.0%) |
| Accommodation & Food Services | 3,253 (49.3%) | 3,341 (50.7%) |
| Public Administration | 1,956 (38.9%) | 3,077 (61.1%) |
| Total | 53,652 (56.6%) | 41,094 (43.4%) |
Education in Moreno Valley
School Enrollment in Moreno Valley
The most common levels of schooling among the 59,904 students in Moreno Valley are middle school (14,080 | 23.5%), high school (13,357 | 22.3%), and college / undergraduate (13,313 | 22.2%).
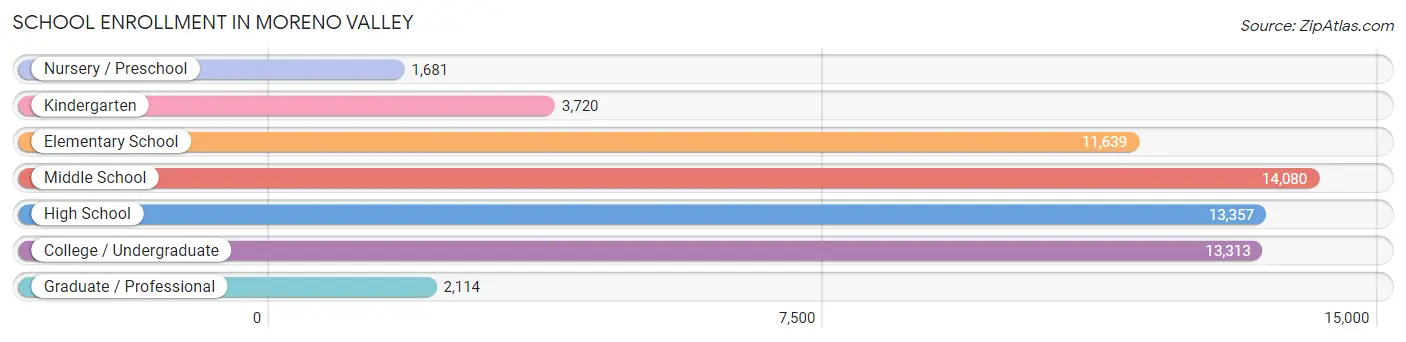
| School Level | # Students | % Students |
| Nursery / Preschool | 1,681 | 2.8% |
| Kindergarten | 3,720 | 6.2% |
| Elementary School | 11,639 | 19.4% |
| Middle School | 14,080 | 23.5% |
| High School | 13,357 | 22.3% |
| College / Undergraduate | 13,313 | 22.2% |
| Graduate / Professional | 2,114 | 3.5% |
| Total | 59,904 | 100.0% |
School Enrollment by Age by Funding Source in Moreno Valley
Out of a total of 59,904 students who are enrolled in schools in Moreno Valley, 5,092 (8.5%) attend a private institution, while the remaining 54,812 (91.5%) are enrolled in public schools. The age group of 35 years and over has the highest likelihood of being enrolled in private schools, with 750 (28.8% in the age bracket) enrolled. Conversely, the age group of 15 to 17 year olds has the lowest likelihood of being enrolled in a private school, with 8,932 (95.6% in the age bracket) attending a public institution.
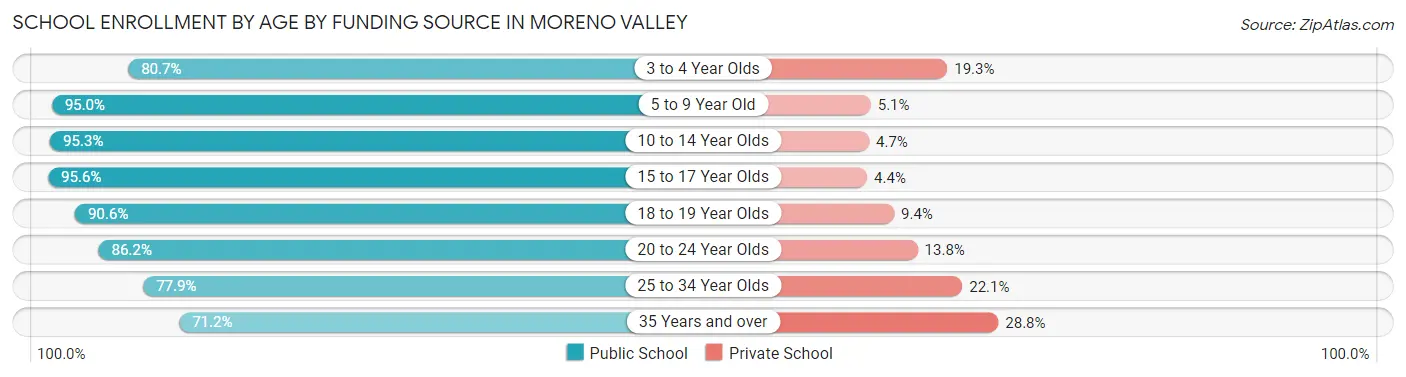
| Age Bracket | Public School | Private School |
| 3 to 4 Year Olds | 991 (80.7%) | 237 (19.3%) |
| 5 to 9 Year Old | 13,866 (95.0%) | 737 (5.1%) |
| 10 to 14 Year Olds | 16,746 (95.3%) | 832 (4.7%) |
| 15 to 17 Year Olds | 8,932 (95.6%) | 409 (4.4%) |
| 18 to 19 Year Olds | 3,678 (90.6%) | 381 (9.4%) |
| 20 to 24 Year Olds | 5,656 (86.2%) | 904 (13.8%) |
| 25 to 34 Year Olds | 3,063 (77.9%) | 869 (22.1%) |
| 35 Years and over | 1,853 (71.2%) | 750 (28.8%) |
| Total | 54,812 (91.5%) | 5,092 (8.5%) |
Educational Attainment by Field of Study in Moreno Valley
Business (5,156 | 22.4%), science & technology (2,662 | 11.5%), social sciences (1,956 | 8.5%), education (1,927 | 8.4%), and arts & humanities (1,815 | 7.9%) are the most common fields of study among 23,061 individuals in Moreno Valley who have obtained a bachelor's degree or higher.
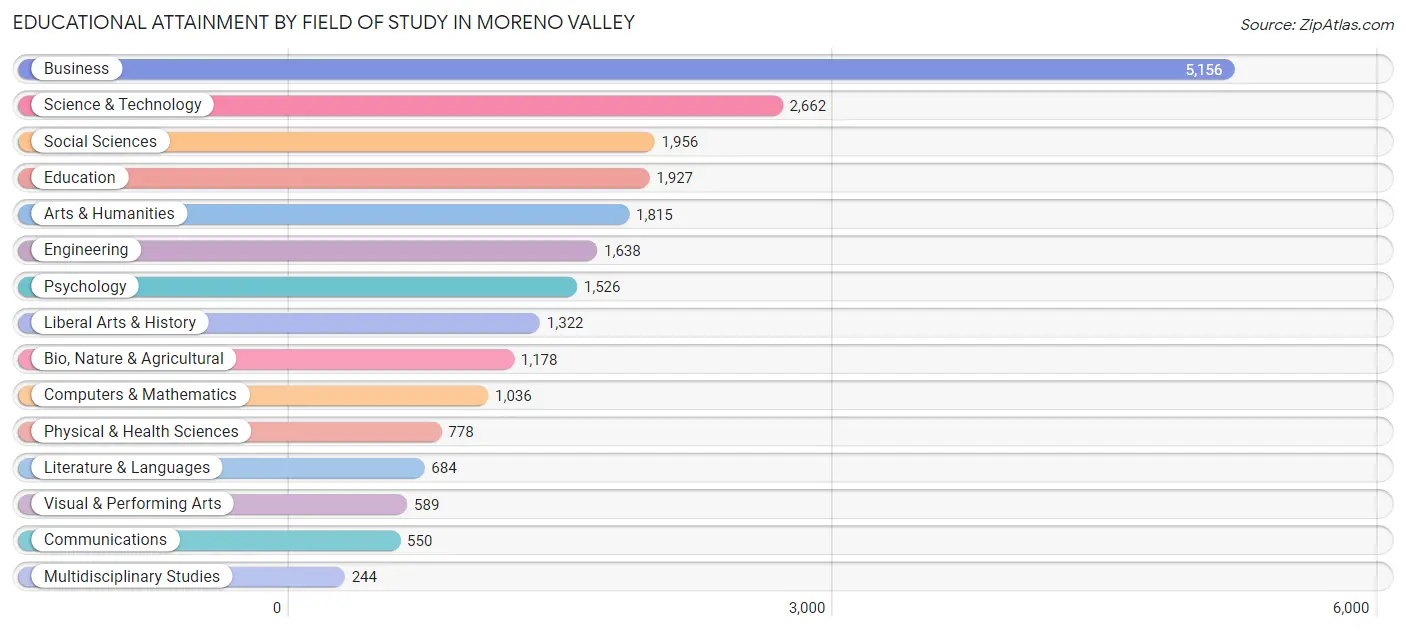
| Field of Study | # Graduates | % Graduates |
| Computers & Mathematics | 1,036 | 4.5% |
| Bio, Nature & Agricultural | 1,178 | 5.1% |
| Physical & Health Sciences | 778 | 3.4% |
| Psychology | 1,526 | 6.6% |
| Social Sciences | 1,956 | 8.5% |
| Engineering | 1,638 | 7.1% |
| Multidisciplinary Studies | 244 | 1.1% |
| Science & Technology | 2,662 | 11.5% |
| Business | 5,156 | 22.4% |
| Education | 1,927 | 8.4% |
| Literature & Languages | 684 | 3.0% |
| Liberal Arts & History | 1,322 | 5.7% |
| Visual & Performing Arts | 589 | 2.5% |
| Communications | 550 | 2.4% |
| Arts & Humanities | 1,815 | 7.9% |
| Total | 23,061 | 100.0% |
Transportation & Commute in Moreno Valley
Vehicle Availability by Sex in Moreno Valley
The most prevalent vehicle ownership categories in Moreno Valley are males with 3 vehicles (14,828, accounting for 28.6%) and females with 3 vehicles (10,229, making up 37.4%).
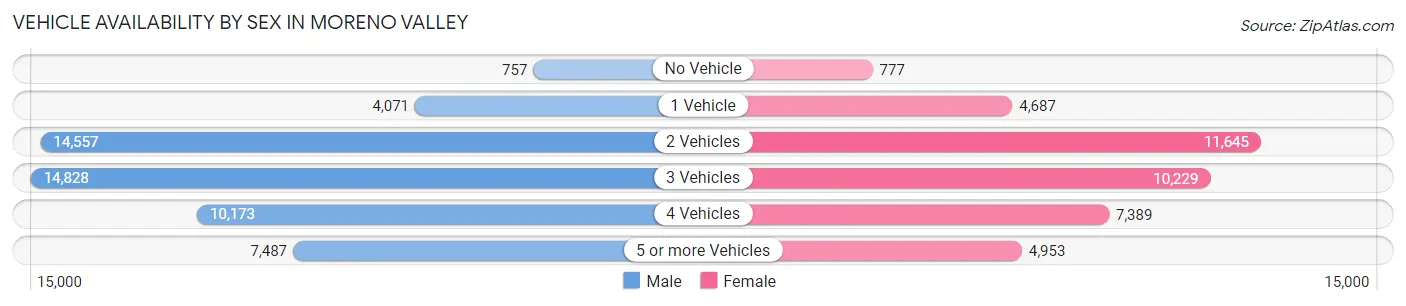
| Vehicles Available | Male | Female |
| No Vehicle | 757 (1.5%) | 777 (2.0%) |
| 1 Vehicle | 4,071 (7.9%) | 4,687 (11.8%) |
| 2 Vehicles | 14,557 (28.1%) | 11,645 (29.3%) |
| 3 Vehicles | 14,828 (28.6%) | 10,229 (25.8%) |
| 4 Vehicles | 10,173 (19.6%) | 7,389 (18.6%) |
| 5 or more Vehicles | 7,487 (14.4%) | 4,953 (12.5%) |
| Total | 51,873 (100.0%) | 39,680 (100.0%) |
Commute Time in Moreno Valley
The most frequently occuring commute durations in Moreno Valley are 30 to 34 minutes (14,166 commuters, 16.4%), 15 to 19 minutes (11,138 commuters, 12.9%), and 10 to 14 minutes (9,707 commuters, 11.3%).
| Commute Time | # Commuters | % Commuters |
| Less than 5 Minutes | 1,014 | 1.2% |
| 5 to 9 Minutes | 4,352 | 5.0% |
| 10 to 14 Minutes | 9,707 | 11.3% |
| 15 to 19 Minutes | 11,138 | 12.9% |
| 20 to 24 Minutes | 8,943 | 10.4% |
| 25 to 29 Minutes | 4,277 | 5.0% |
| 30 to 34 Minutes | 14,166 | 16.4% |
| 35 to 39 Minutes | 3,108 | 3.6% |
| 40 to 44 Minutes | 4,109 | 4.8% |
| 45 to 59 Minutes | 9,032 | 10.5% |
| 60 to 89 Minutes | 9,491 | 11.0% |
| 90 or more Minutes | 6,934 | 8.0% |
Commute Time by Sex in Moreno Valley
The most common commute times in Moreno Valley are 30 to 34 minutes (8,491 commuters, 17.2%) for males and 15 to 19 minutes (5,975 commuters, 16.2%) for females.
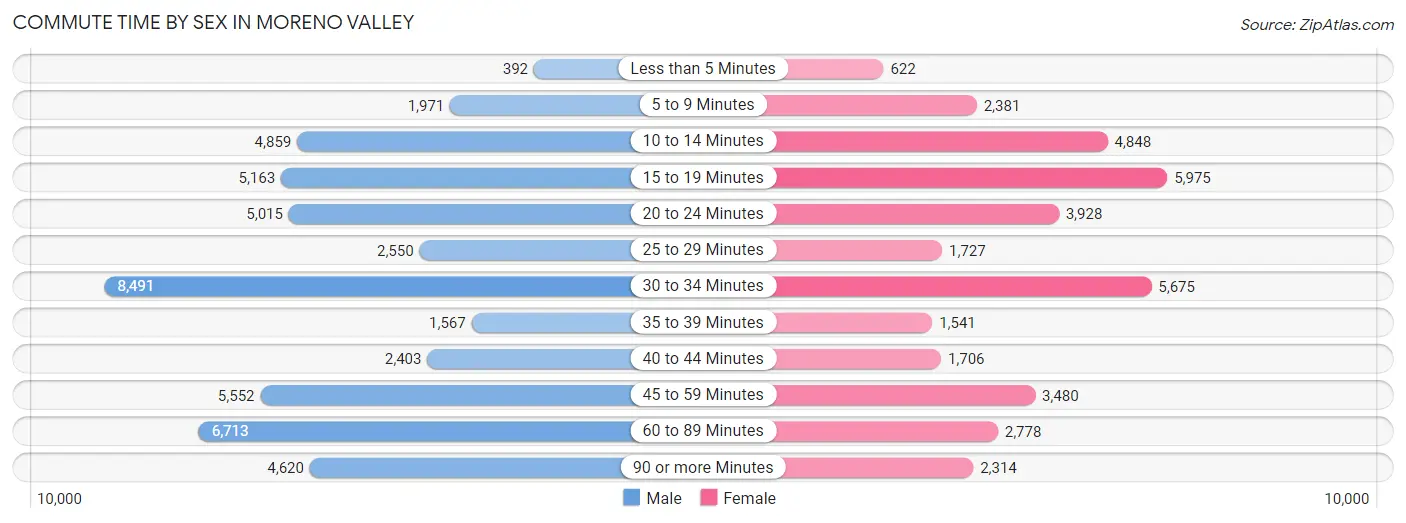
| Commute Time | Male | Female |
| Less than 5 Minutes | 392 (0.8%) | 622 (1.7%) |
| 5 to 9 Minutes | 1,971 (4.0%) | 2,381 (6.4%) |
| 10 to 14 Minutes | 4,859 (9.9%) | 4,848 (13.1%) |
| 15 to 19 Minutes | 5,163 (10.5%) | 5,975 (16.2%) |
| 20 to 24 Minutes | 5,015 (10.2%) | 3,928 (10.6%) |
| 25 to 29 Minutes | 2,550 (5.2%) | 1,727 (4.7%) |
| 30 to 34 Minutes | 8,491 (17.2%) | 5,675 (15.3%) |
| 35 to 39 Minutes | 1,567 (3.2%) | 1,541 (4.2%) |
| 40 to 44 Minutes | 2,403 (4.9%) | 1,706 (4.6%) |
| 45 to 59 Minutes | 5,552 (11.3%) | 3,480 (9.4%) |
| 60 to 89 Minutes | 6,713 (13.6%) | 2,778 (7.5%) |
| 90 or more Minutes | 4,620 (9.4%) | 2,314 (6.3%) |
Time of Departure to Work by Sex in Moreno Valley
The most frequent times of departure to work in Moreno Valley are 12:00 AM to 4:59 AM (10,488, 21.3%) for males and 7:00 AM to 7:29 AM (6,069, 16.4%) for females.
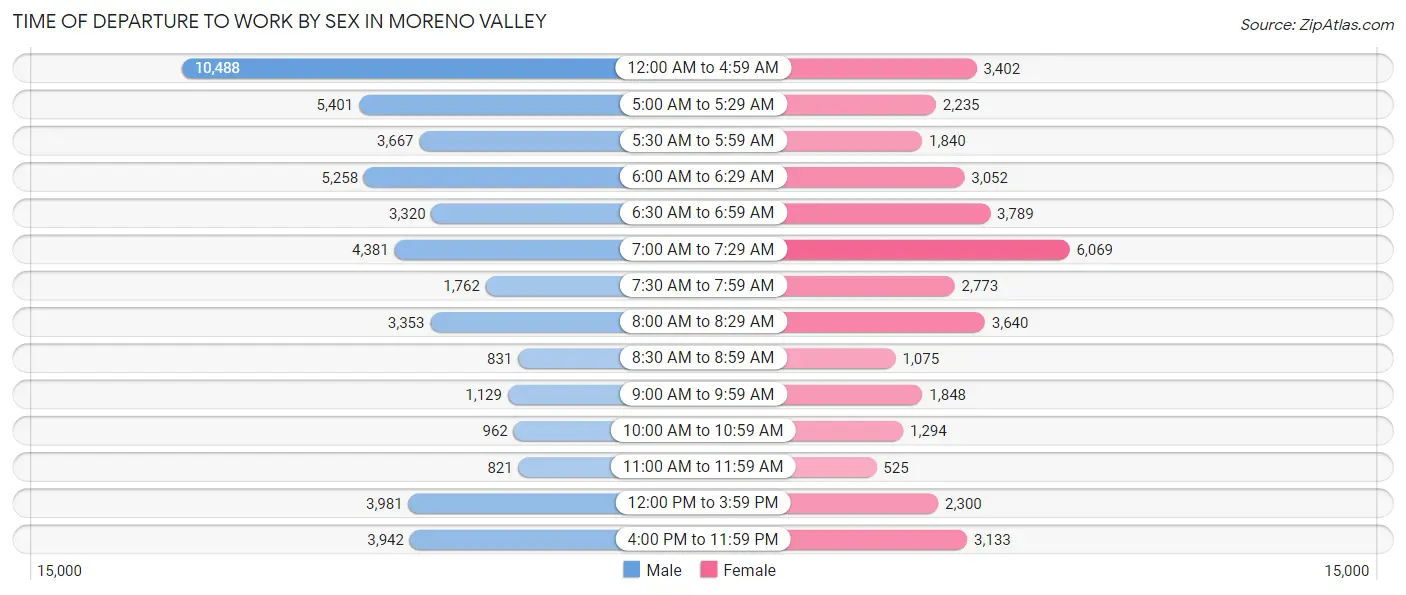
| Time of Departure | Male | Female |
| 12:00 AM to 4:59 AM | 10,488 (21.3%) | 3,402 (9.2%) |
| 5:00 AM to 5:29 AM | 5,401 (11.0%) | 2,235 (6.0%) |
| 5:30 AM to 5:59 AM | 3,667 (7.4%) | 1,840 (5.0%) |
| 6:00 AM to 6:29 AM | 5,258 (10.7%) | 3,052 (8.3%) |
| 6:30 AM to 6:59 AM | 3,320 (6.7%) | 3,789 (10.2%) |
| 7:00 AM to 7:29 AM | 4,381 (8.9%) | 6,069 (16.4%) |
| 7:30 AM to 7:59 AM | 1,762 (3.6%) | 2,773 (7.5%) |
| 8:00 AM to 8:29 AM | 3,353 (6.8%) | 3,640 (9.8%) |
| 8:30 AM to 8:59 AM | 831 (1.7%) | 1,075 (2.9%) |
| 9:00 AM to 9:59 AM | 1,129 (2.3%) | 1,848 (5.0%) |
| 10:00 AM to 10:59 AM | 962 (1.9%) | 1,294 (3.5%) |
| 11:00 AM to 11:59 AM | 821 (1.7%) | 525 (1.4%) |
| 12:00 PM to 3:59 PM | 3,981 (8.1%) | 2,300 (6.2%) |
| 4:00 PM to 11:59 PM | 3,942 (8.0%) | 3,133 (8.5%) |
| Total | 49,296 (100.0%) | 36,975 (100.0%) |
Housing Occupancy in Moreno Valley
Occupancy by Ownership in Moreno Valley
Of the total 53,958 dwellings in Moreno Valley, owner-occupied units account for 34,010 (63.0%), while renter-occupied units make up 19,948 (37.0%).
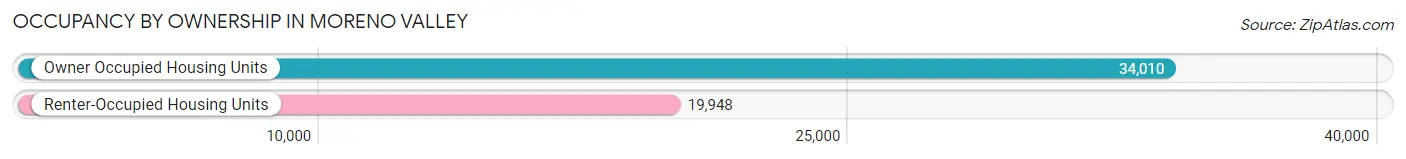
| Occupancy | # Housing Units | % Housing Units |
| Owner Occupied Housing Units | 34,010 | 63.0% |
| Renter-Occupied Housing Units | 19,948 | 37.0% |
| Total Occupied Housing Units | 53,958 | 100.0% |
Occupancy by Household Size in Moreno Valley
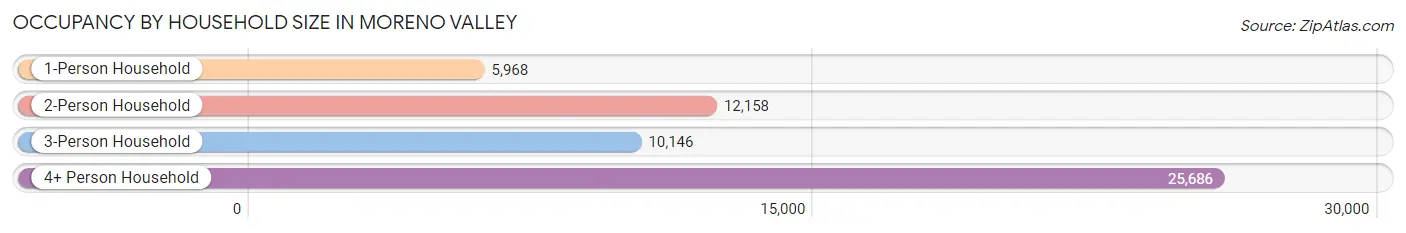
| Household Size | # Housing Units | % Housing Units |
| 1-Person Household | 5,968 | 11.1% |
| 2-Person Household | 12,158 | 22.5% |
| 3-Person Household | 10,146 | 18.8% |
| 4+ Person Household | 25,686 | 47.6% |
| Total Housing Units | 53,958 | 100.0% |
Occupancy by Ownership by Household Size in Moreno Valley
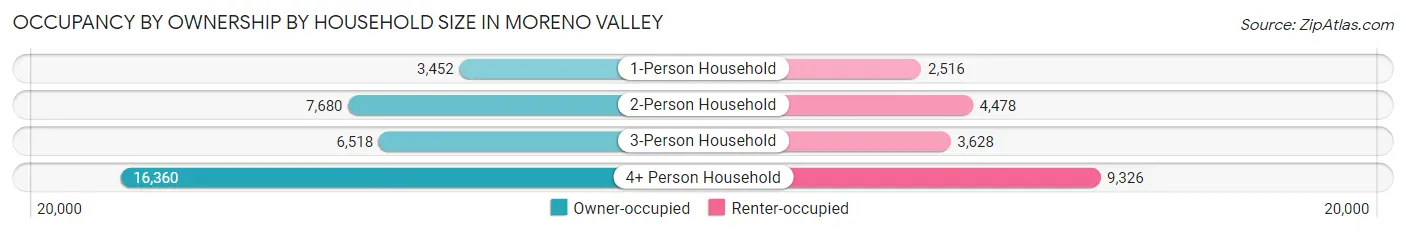
| Household Size | Owner-occupied | Renter-occupied |
| 1-Person Household | 3,452 (57.8%) | 2,516 (42.2%) |
| 2-Person Household | 7,680 (63.2%) | 4,478 (36.8%) |
| 3-Person Household | 6,518 (64.2%) | 3,628 (35.8%) |
| 4+ Person Household | 16,360 (63.7%) | 9,326 (36.3%) |
| Total Housing Units | 34,010 (63.0%) | 19,948 (37.0%) |
Occupancy by Educational Attainment in Moreno Valley
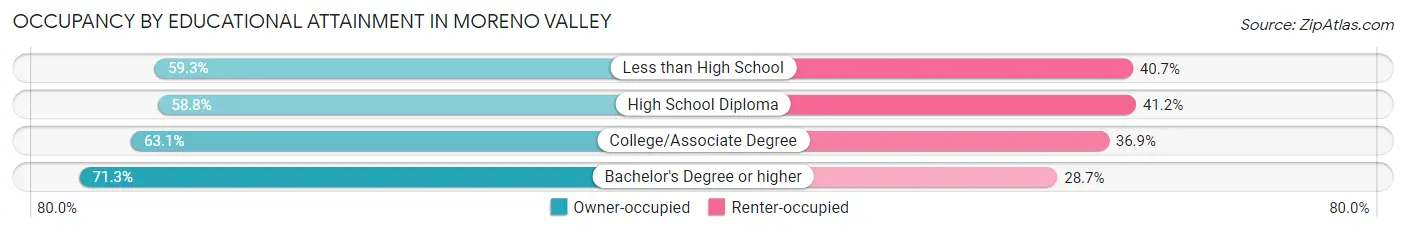
| Household Size | Owner-occupied | Renter-occupied |
| Less than High School | 5,560 (59.3%) | 3,817 (40.7%) |
| High School Diploma | 8,059 (58.8%) | 5,651 (41.2%) |
| College/Associate Degree | 12,437 (63.1%) | 7,273 (36.9%) |
| Bachelor's Degree or higher | 7,954 (71.3%) | 3,207 (28.7%) |
Occupancy by Age of Householder in Moreno Valley
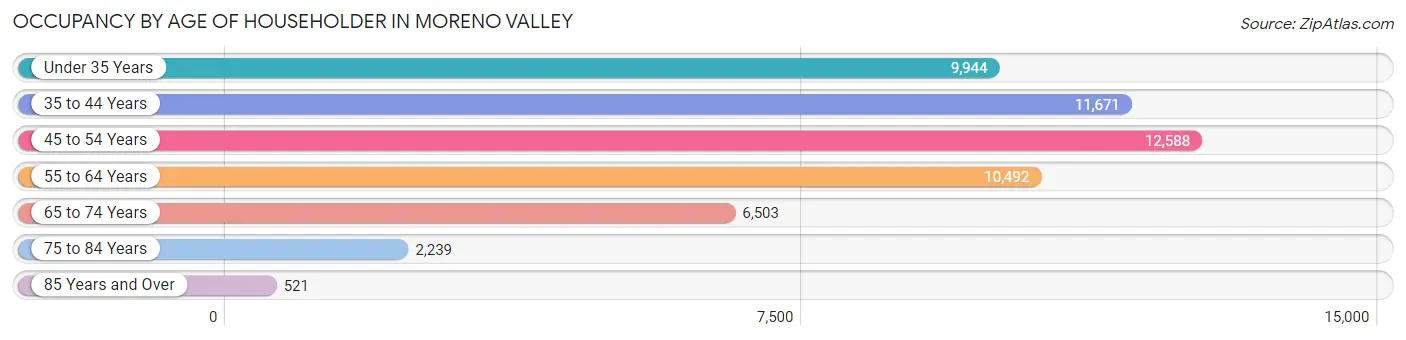
| Age Bracket | # Households | % Households |
| Under 35 Years | 9,944 | 18.4% |
| 35 to 44 Years | 11,671 | 21.6% |
| 45 to 54 Years | 12,588 | 23.3% |
| 55 to 64 Years | 10,492 | 19.4% |
| 65 to 74 Years | 6,503 | 12.0% |
| 75 to 84 Years | 2,239 | 4.2% |
| 85 Years and Over | 521 | 1.0% |
| Total | 53,958 | 100.0% |
Housing Finances in Moreno Valley
Median Income by Occupancy in Moreno Valley
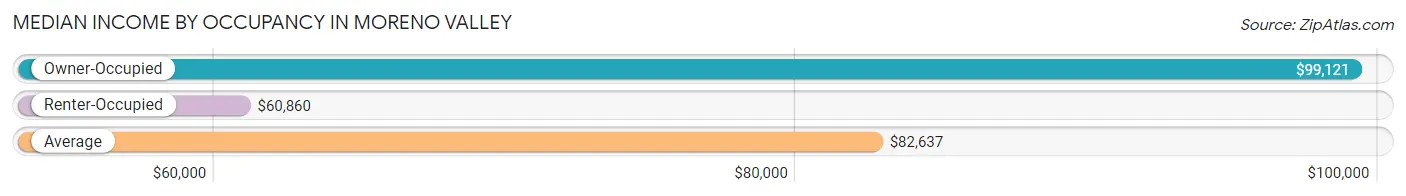
| Occupancy Type | # Households | Median Income |
| Owner-Occupied | 34,010 (63.0%) | $99,121 |
| Renter-Occupied | 19,948 (37.0%) | $60,860 |
| Average | 53,958 (100.0%) | $82,637 |
Occupancy by Householder Income Bracket in Moreno Valley
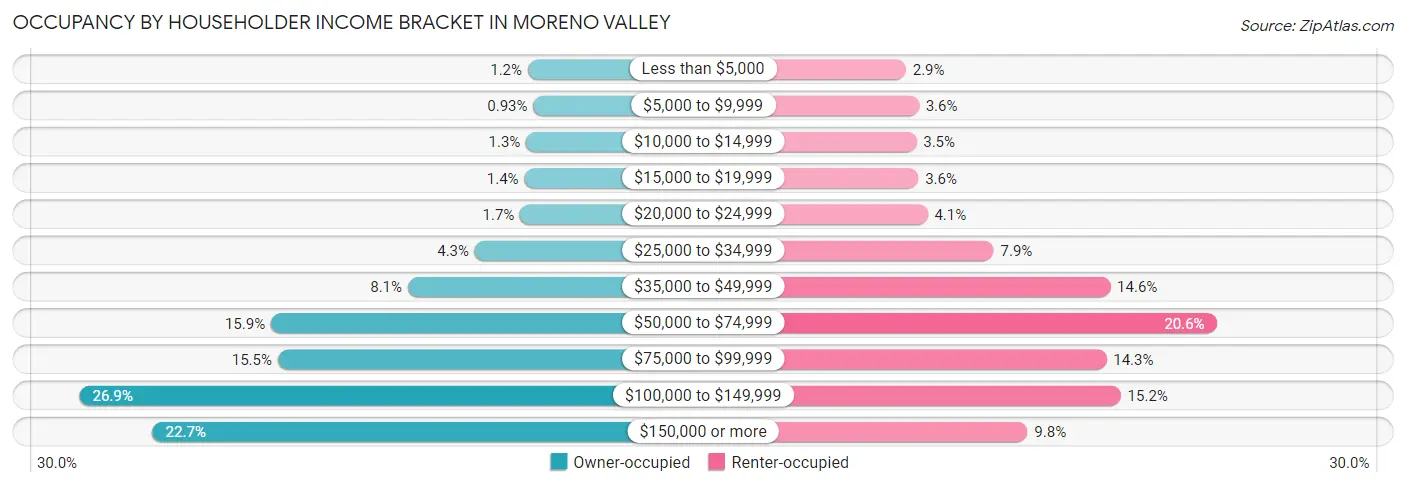
| Income Bracket | Owner-occupied | Renter-occupied |
| Less than $5,000 | 421 (1.2%) | 572 (2.9%) |
| $5,000 to $9,999 | 317 (0.9%) | 720 (3.6%) |
| $10,000 to $14,999 | 456 (1.3%) | 693 (3.5%) |
| $15,000 to $19,999 | 490 (1.4%) | 715 (3.6%) |
| $20,000 to $24,999 | 571 (1.7%) | 819 (4.1%) |
| $25,000 to $34,999 | 1,453 (4.3%) | 1,574 (7.9%) |
| $35,000 to $49,999 | 2,755 (8.1%) | 2,902 (14.5%) |
| $50,000 to $74,999 | 5,414 (15.9%) | 4,114 (20.6%) |
| $75,000 to $99,999 | 5,283 (15.5%) | 2,858 (14.3%) |
| $100,000 to $149,999 | 9,136 (26.9%) | 3,022 (15.1%) |
| $150,000 or more | 7,714 (22.7%) | 1,959 (9.8%) |
| Total | 34,010 (100.0%) | 19,948 (100.0%) |
Monthly Housing Cost Tiers in Moreno Valley
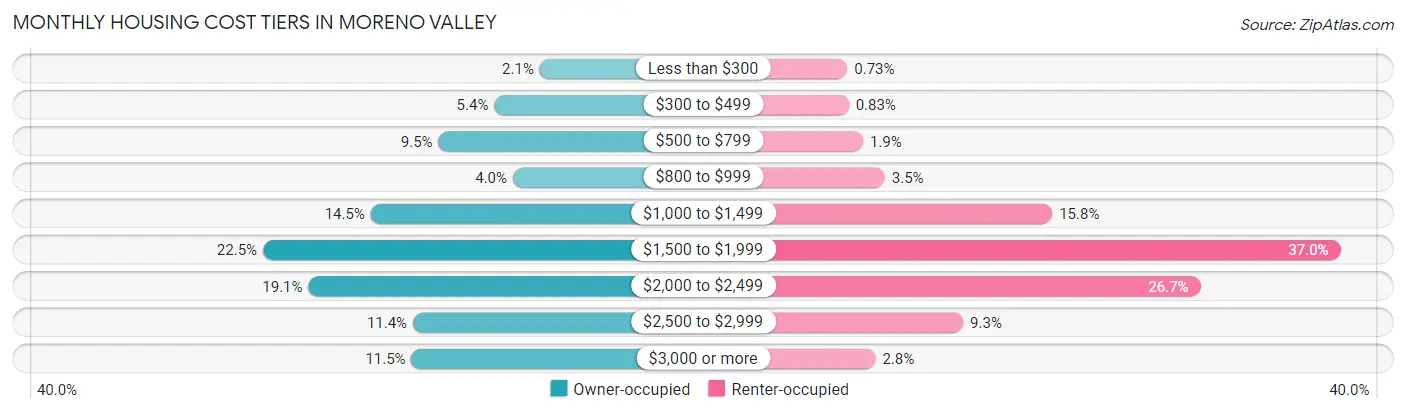
| Monthly Cost | Owner-occupied | Renter-occupied |
| Less than $300 | 700 (2.1%) | 145 (0.7%) |
| $300 to $499 | 1,840 (5.4%) | 165 (0.8%) |
| $500 to $799 | 3,238 (9.5%) | 375 (1.9%) |
| $800 to $999 | 1,373 (4.0%) | 696 (3.5%) |
| $1,000 to $1,499 | 4,934 (14.5%) | 3,155 (15.8%) |
| $1,500 to $1,999 | 7,636 (22.5%) | 7,388 (37.0%) |
| $2,000 to $2,499 | 6,497 (19.1%) | 5,332 (26.7%) |
| $2,500 to $2,999 | 3,876 (11.4%) | 1,847 (9.3%) |
| $3,000 or more | 3,916 (11.5%) | 558 (2.8%) |
| Total | 34,010 (100.0%) | 19,948 (100.0%) |
Physical Housing Characteristics in Moreno Valley
Housing Structures in Moreno Valley
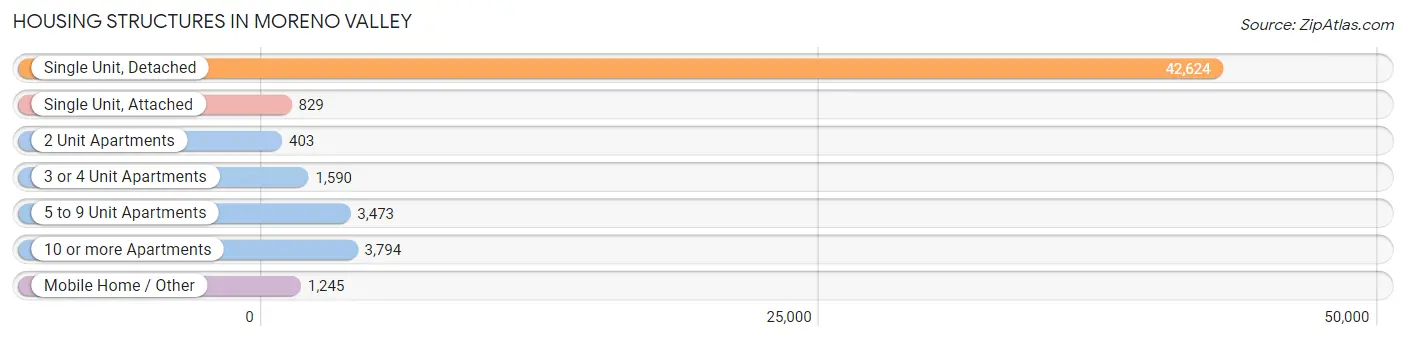
| Structure Type | # Housing Units | % Housing Units |
| Single Unit, Detached | 42,624 | 79.0% |
| Single Unit, Attached | 829 | 1.5% |
| 2 Unit Apartments | 403 | 0.7% |
| 3 or 4 Unit Apartments | 1,590 | 2.9% |
| 5 to 9 Unit Apartments | 3,473 | 6.4% |
| 10 or more Apartments | 3,794 | 7.0% |
| Mobile Home / Other | 1,245 | 2.3% |
| Total | 53,958 | 100.0% |
Housing Structures by Occupancy in Moreno Valley
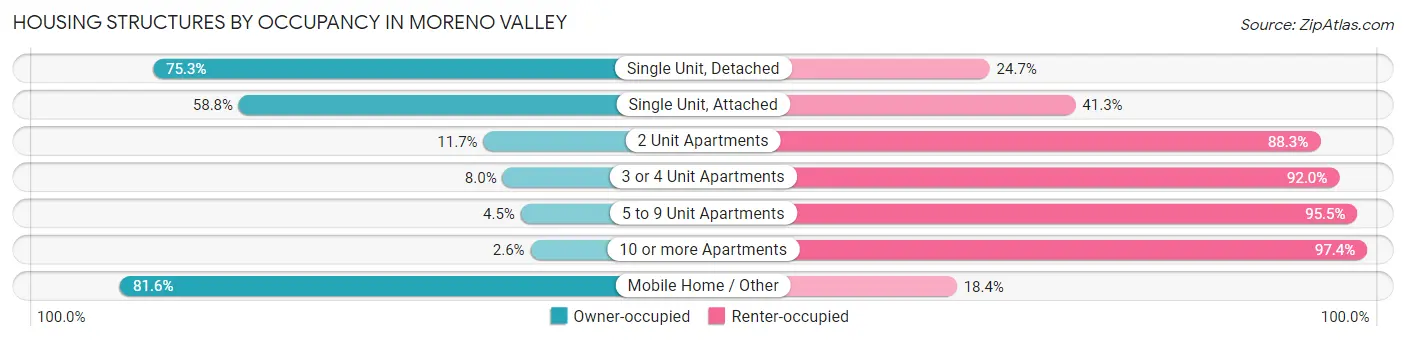
| Structure Type | Owner-occupied | Renter-occupied |
| Single Unit, Detached | 32,078 (75.3%) | 10,546 (24.7%) |
| Single Unit, Attached | 487 (58.8%) | 342 (41.2%) |
| 2 Unit Apartments | 47 (11.7%) | 356 (88.3%) |
| 3 or 4 Unit Apartments | 127 (8.0%) | 1,463 (92.0%) |
| 5 to 9 Unit Apartments | 156 (4.5%) | 3,317 (95.5%) |
| 10 or more Apartments | 99 (2.6%) | 3,695 (97.4%) |
| Mobile Home / Other | 1,016 (81.6%) | 229 (18.4%) |
| Total | 34,010 (63.0%) | 19,948 (37.0%) |
Housing Structures by Number of Rooms in Moreno Valley
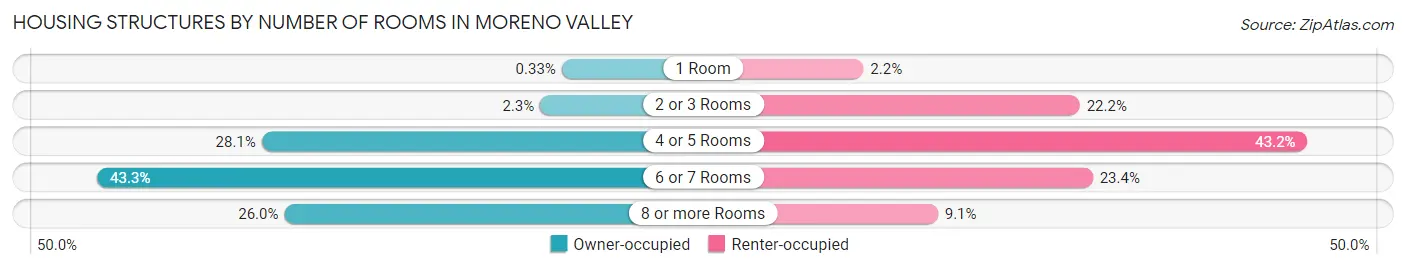
| Number of Rooms | Owner-occupied | Renter-occupied |
| 1 Room | 111 (0.3%) | 432 (2.2%) |
| 2 or 3 Rooms | 791 (2.3%) | 4,425 (22.2%) |
| 4 or 5 Rooms | 9,549 (28.1%) | 8,623 (43.2%) |
| 6 or 7 Rooms | 14,722 (43.3%) | 4,663 (23.4%) |
| 8 or more Rooms | 8,837 (26.0%) | 1,805 (9.0%) |
| Total | 34,010 (100.0%) | 19,948 (100.0%) |
Housing Structure by Heating Type in Moreno Valley
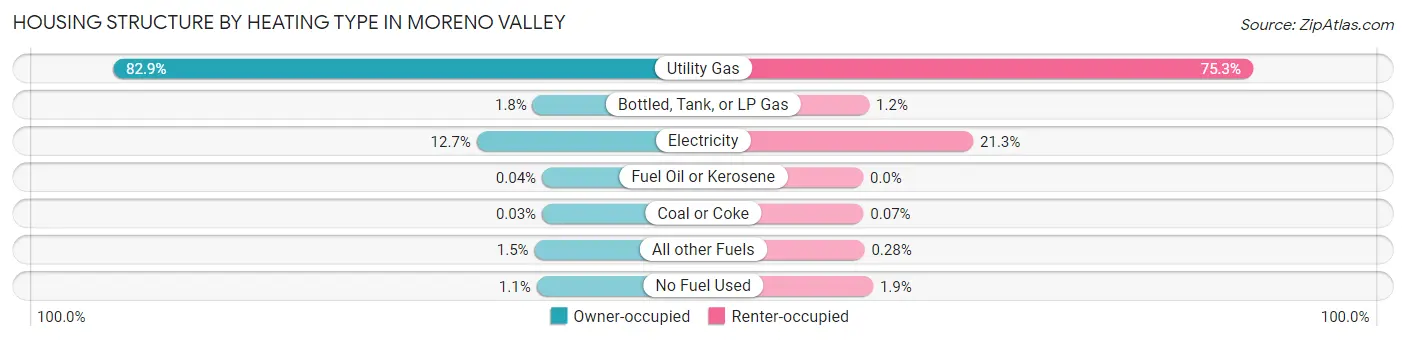
| Heating Type | Owner-occupied | Renter-occupied |
| Utility Gas | 28,191 (82.9%) | 15,020 (75.3%) |
| Bottled, Tank, or LP Gas | 623 (1.8%) | 235 (1.2%) |
| Electricity | 4,301 (12.7%) | 4,243 (21.3%) |
| Fuel Oil or Kerosene | 13 (0.0%) | 0 (0.0%) |
| Coal or Coke | 11 (0.0%) | 13 (0.1%) |
| All other Fuels | 502 (1.5%) | 55 (0.3%) |
| No Fuel Used | 369 (1.1%) | 382 (1.9%) |
| Total | 34,010 (100.0%) | 19,948 (100.0%) |
Household Vehicle Usage in Moreno Valley
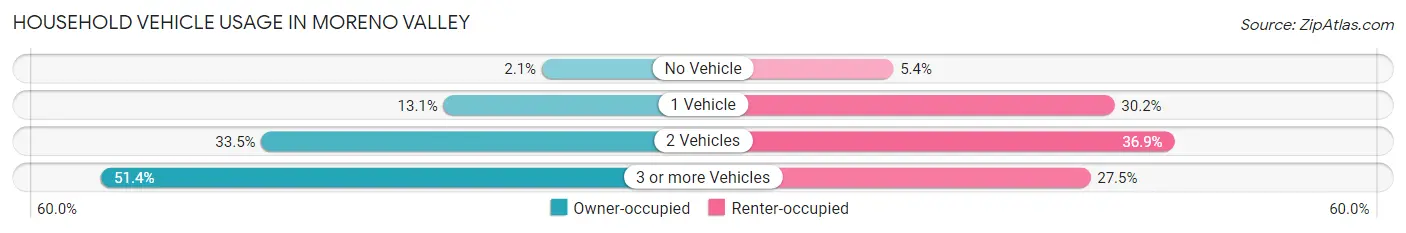
| Vehicles per Household | Owner-occupied | Renter-occupied |
| No Vehicle | 696 (2.1%) | 1,080 (5.4%) |
| 1 Vehicle | 4,442 (13.1%) | 6,022 (30.2%) |
| 2 Vehicles | 11,384 (33.5%) | 7,362 (36.9%) |
| 3 or more Vehicles | 17,488 (51.4%) | 5,484 (27.5%) |
| Total | 34,010 (100.0%) | 19,948 (100.0%) |
Real Estate & Mortgages in Moreno Valley
Real Estate and Mortgage Overview in Moreno Valley
| Characteristic | Without Mortgage | With Mortgage |
| Housing Units | 6,800 | 27,210 |
| Median Property Value | $386,800 | $428,200 |
| Median Household Income | $76,951 | $6,707 |
| Monthly Housing Costs | $609 | $3,870 |
| Real Estate Taxes | $2,546 | $715 |
Property Value by Mortgage Status in Moreno Valley
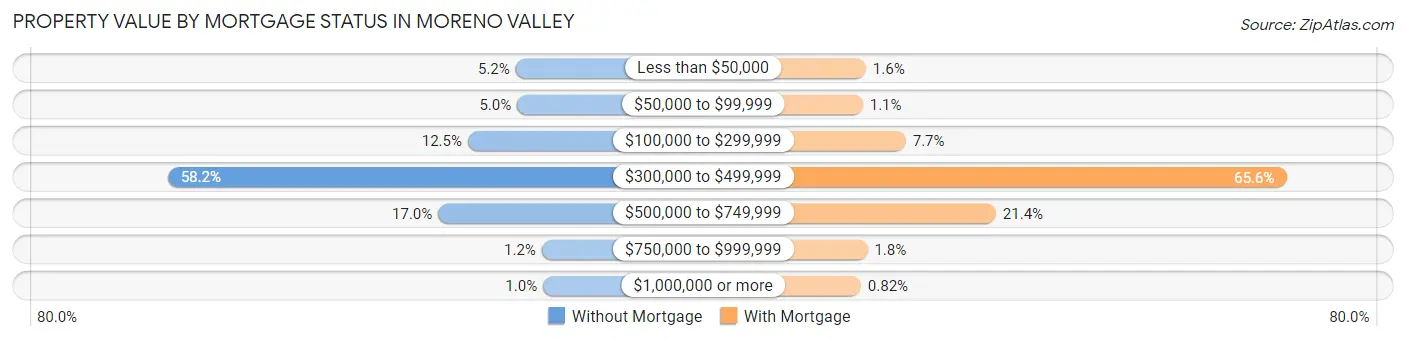
| Property Value | Without Mortgage | With Mortgage |
| Less than $50,000 | 352 (5.2%) | 429 (1.6%) |
| $50,000 to $99,999 | 337 (5.0%) | 300 (1.1%) |
| $100,000 to $299,999 | 848 (12.5%) | 2,084 (7.7%) |
| $300,000 to $499,999 | 3,957 (58.2%) | 17,861 (65.6%) |
| $500,000 to $749,999 | 1,155 (17.0%) | 5,820 (21.4%) |
| $750,000 to $999,999 | 82 (1.2%) | 494 (1.8%) |
| $1,000,000 or more | 69 (1.0%) | 222 (0.8%) |
| Total | 6,800 (100.0%) | 27,210 (100.0%) |
Household Income by Mortgage Status in Moreno Valley
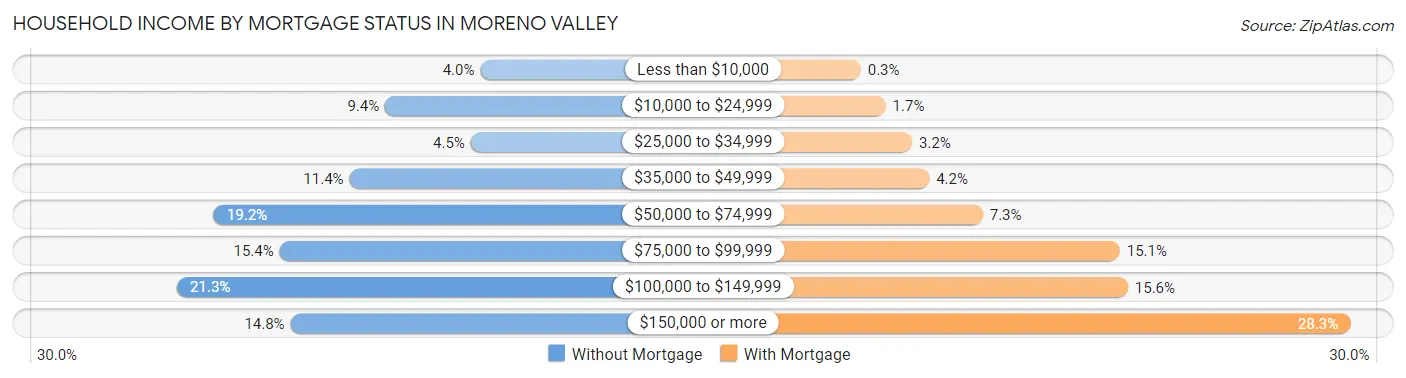
| Household Income | Without Mortgage | With Mortgage |
| Less than $10,000 | 269 (4.0%) | 82 (0.3%) |
| $10,000 to $24,999 | 639 (9.4%) | 469 (1.7%) |
| $25,000 to $34,999 | 307 (4.5%) | 878 (3.2%) |
| $35,000 to $49,999 | 778 (11.4%) | 1,146 (4.2%) |
| $50,000 to $74,999 | 1,304 (19.2%) | 1,977 (7.3%) |
| $75,000 to $99,999 | 1,049 (15.4%) | 4,110 (15.1%) |
| $100,000 to $149,999 | 1,447 (21.3%) | 4,234 (15.6%) |
| $150,000 or more | 1,007 (14.8%) | 7,689 (28.3%) |
| Total | 6,800 (100.0%) | 27,210 (100.0%) |
Property Value to Household Income Ratio in Moreno Valley
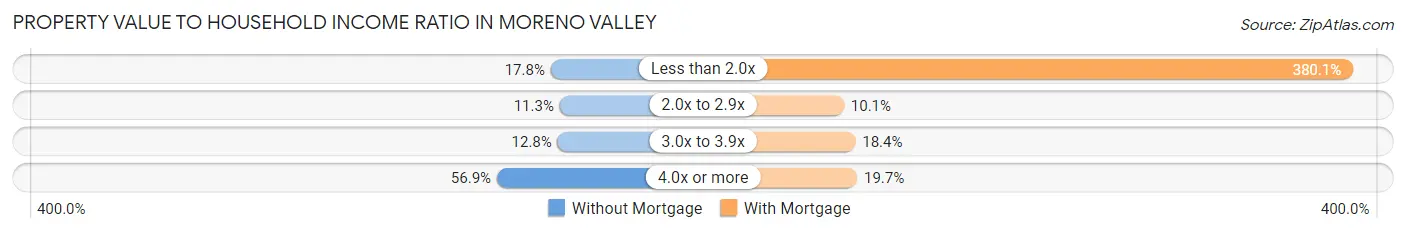
| Value-to-Income Ratio | Without Mortgage | With Mortgage |
| Less than 2.0x | 1,209 (17.8%) | 103,427 (380.1%) |
| 2.0x to 2.9x | 766 (11.3%) | 2,751 (10.1%) |
| 3.0x to 3.9x | 871 (12.8%) | 5,016 (18.4%) |
| 4.0x or more | 3,869 (56.9%) | 5,357 (19.7%) |
| Total | 6,800 (100.0%) | 27,210 (100.0%) |
Real Estate Taxes by Mortgage Status in Moreno Valley
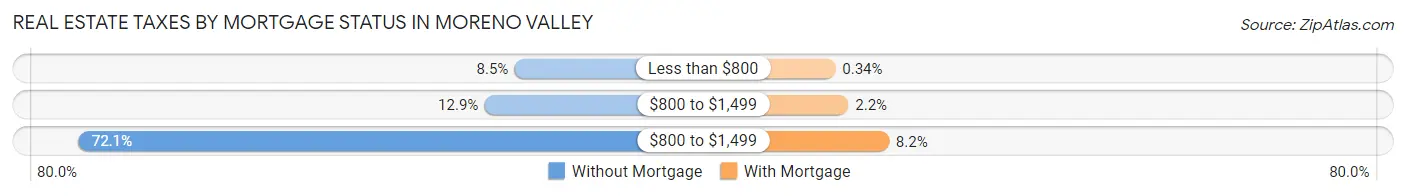
| Property Taxes | Without Mortgage | With Mortgage |
| Less than $800 | 575 (8.5%) | 93 (0.3%) |
| $800 to $1,499 | 874 (12.9%) | 609 (2.2%) |
| $800 to $1,499 | 4,901 (72.1%) | 2,220 (8.2%) |
| Total | 6,800 (100.0%) | 27,210 (100.0%) |
Health & Disability in Moreno Valley
Health Insurance Coverage by Age in Moreno Valley
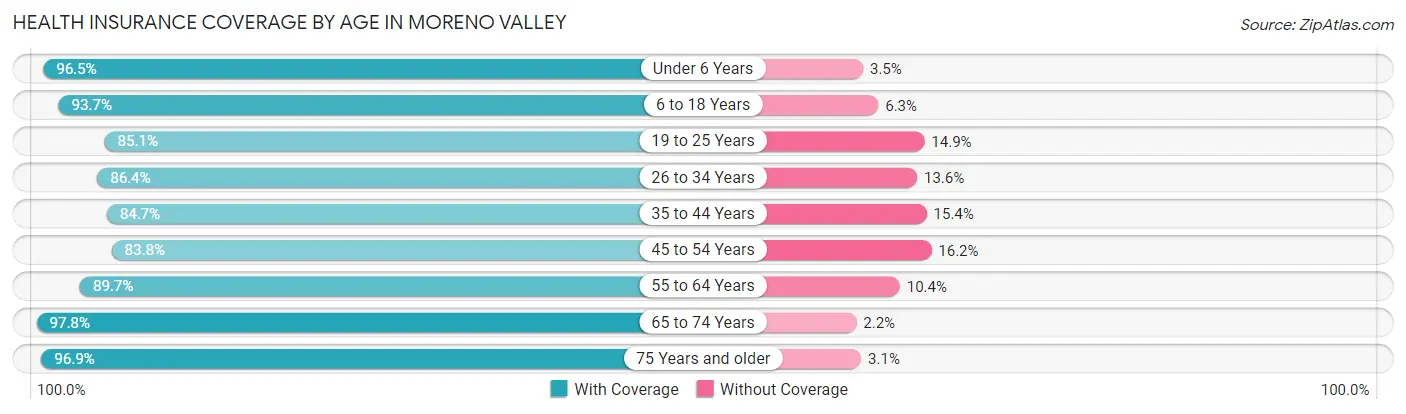
| Age Bracket | With Coverage | Without Coverage |
| Under 6 Years | 16,440 (96.5%) | 595 (3.5%) |
| 6 to 18 Years | 40,068 (93.7%) | 2,713 (6.3%) |
| 19 to 25 Years | 20,419 (85.1%) | 3,586 (14.9%) |
| 26 to 34 Years | 26,687 (86.4%) | 4,185 (13.6%) |
| 35 to 44 Years | 23,609 (84.7%) | 4,281 (15.3%) |
| 45 to 54 Years | 21,436 (83.8%) | 4,155 (16.2%) |
| 55 to 64 Years | 19,223 (89.6%) | 2,220 (10.3%) |
| 65 to 74 Years | 13,108 (97.8%) | 301 (2.2%) |
| 75 Years and older | 5,929 (96.9%) | 192 (3.1%) |
| Total | 186,919 (89.4%) | 22,228 (10.6%) |
Health Insurance Coverage by Citizenship Status in Moreno Valley
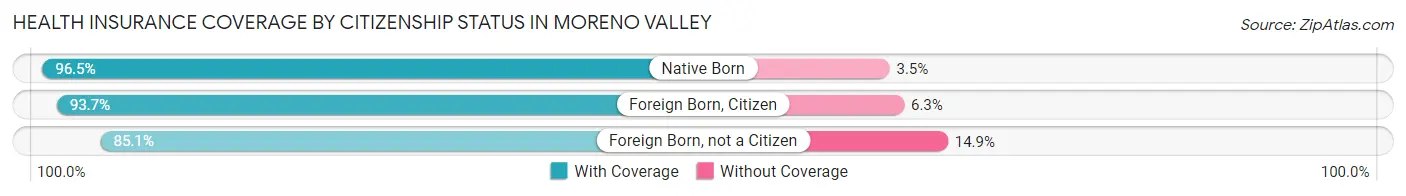
| Citizenship Status | With Coverage | Without Coverage |
| Native Born | 16,440 (96.5%) | 595 (3.5%) |
| Foreign Born, Citizen | 40,068 (93.7%) | 2,713 (6.3%) |
| Foreign Born, not a Citizen | 20,419 (85.1%) | 3,586 (14.9%) |
Health Insurance Coverage by Household Income in Moreno Valley
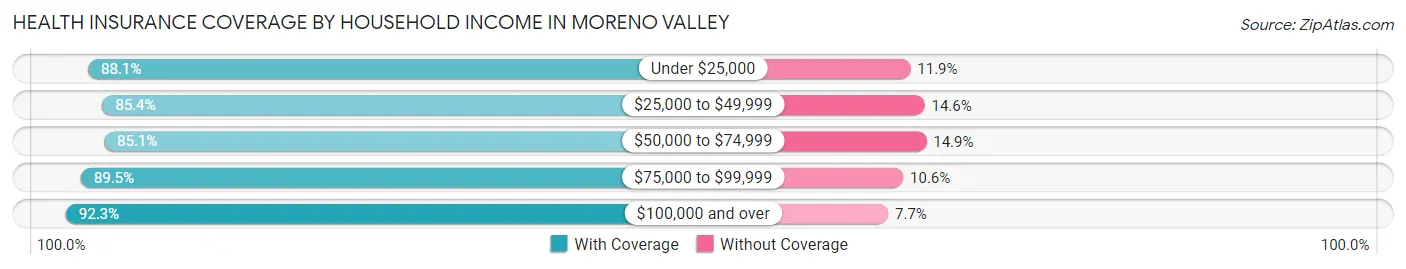
| Household Income | With Coverage | Without Coverage |
| Under $25,000 | 13,055 (88.1%) | 1,765 (11.9%) |
| $25,000 to $49,999 | 24,553 (85.4%) | 4,188 (14.6%) |
| $50,000 to $74,999 | 30,700 (85.1%) | 5,376 (14.9%) |
| $75,000 to $99,999 | 29,138 (89.4%) | 3,436 (10.5%) |
| $100,000 and over | 88,658 (92.3%) | 7,442 (7.7%) |
Public vs Private Health Insurance Coverage by Age in Moreno Valley
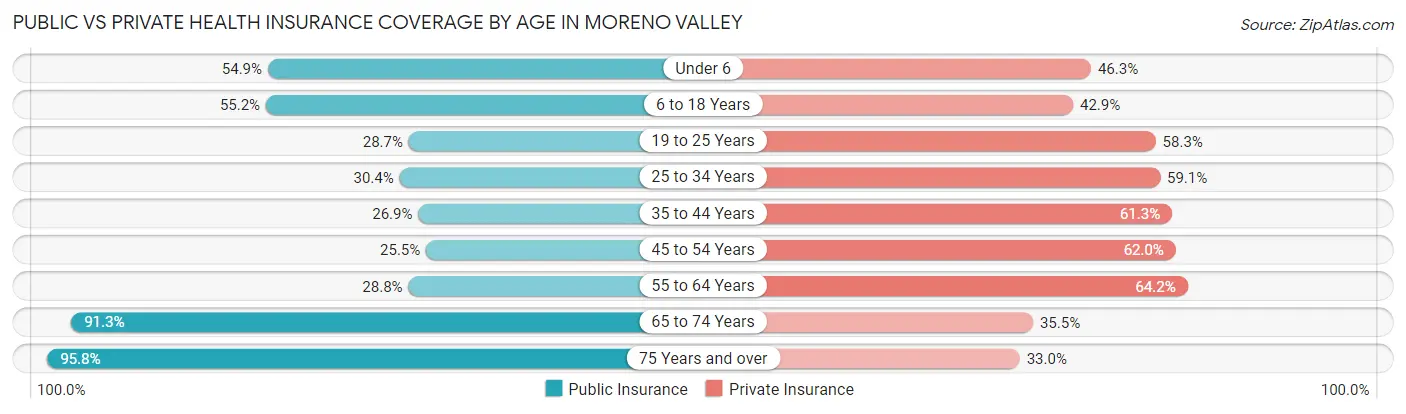
| Age Bracket | Public Insurance | Private Insurance |
| Under 6 | 9,343 (54.8%) | 7,879 (46.3%) |
| 6 to 18 Years | 23,617 (55.2%) | 18,368 (42.9%) |
| 19 to 25 Years | 6,888 (28.7%) | 13,985 (58.3%) |
| 25 to 34 Years | 9,384 (30.4%) | 18,237 (59.1%) |
| 35 to 44 Years | 7,508 (26.9%) | 17,094 (61.3%) |
| 45 to 54 Years | 6,517 (25.5%) | 15,858 (62.0%) |
| 55 to 64 Years | 6,166 (28.8%) | 13,760 (64.2%) |
| 65 to 74 Years | 12,248 (91.3%) | 4,759 (35.5%) |
| 75 Years and over | 5,863 (95.8%) | 2,022 (33.0%) |
| Total | 87,534 (41.8%) | 111,962 (53.5%) |
Disability Status by Sex by Age in Moreno Valley
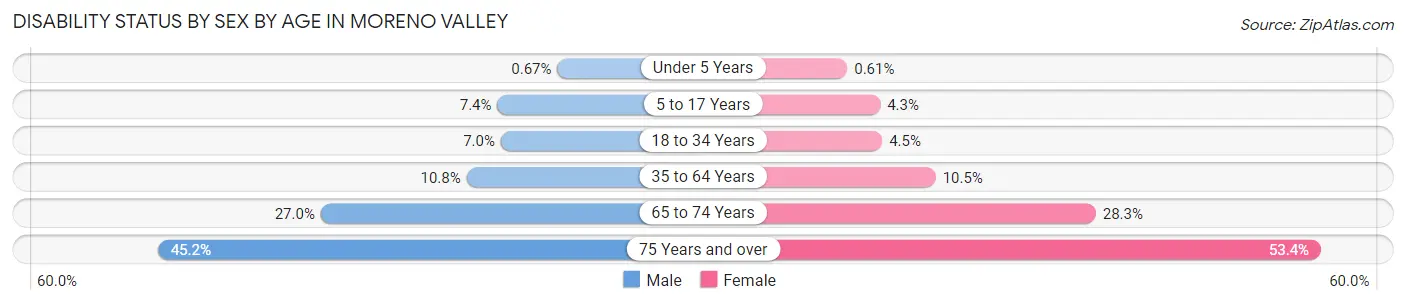
| Age Bracket | Male | Female |
| Under 5 Years | 48 (0.7%) | 39 (0.6%) |
| 5 to 17 Years | 1,554 (7.3%) | 936 (4.3%) |
| 18 to 34 Years | 2,143 (7.0%) | 1,234 (4.5%) |
| 35 to 64 Years | 3,956 (10.8%) | 3,999 (10.5%) |
| 65 to 74 Years | 1,643 (27.0%) | 2,073 (28.3%) |
| 75 Years and over | 1,093 (45.2%) | 1,975 (53.4%) |
Disability Class by Sex by Age in Moreno Valley
Disability Class: Hearing Difficulty
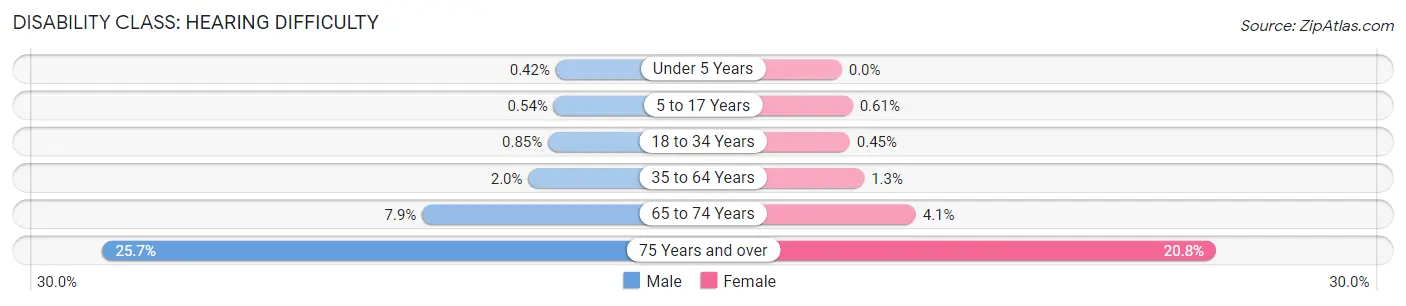
| Age Bracket | Male | Female |
| Under 5 Years | 30 (0.4%) | 0 (0.0%) |
| 5 to 17 Years | 114 (0.5%) | 133 (0.6%) |
| 18 to 34 Years | 262 (0.9%) | 122 (0.4%) |
| 35 to 64 Years | 715 (1.9%) | 478 (1.3%) |
| 65 to 74 Years | 478 (7.9%) | 302 (4.1%) |
| 75 Years and over | 621 (25.7%) | 771 (20.8%) |
Disability Class: Vision Difficulty
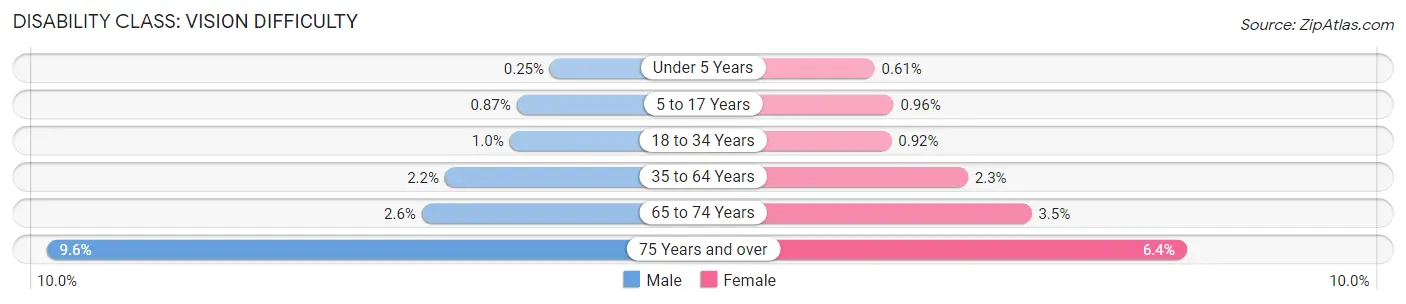
| Age Bracket | Male | Female |
| Under 5 Years | 18 (0.3%) | 39 (0.6%) |
| 5 to 17 Years | 184 (0.9%) | 211 (1.0%) |
| 18 to 34 Years | 308 (1.0%) | 252 (0.9%) |
| 35 to 64 Years | 806 (2.2%) | 895 (2.3%) |
| 65 to 74 Years | 160 (2.6%) | 258 (3.5%) |
| 75 Years and over | 232 (9.6%) | 237 (6.4%) |
Disability Class: Cognitive Difficulty
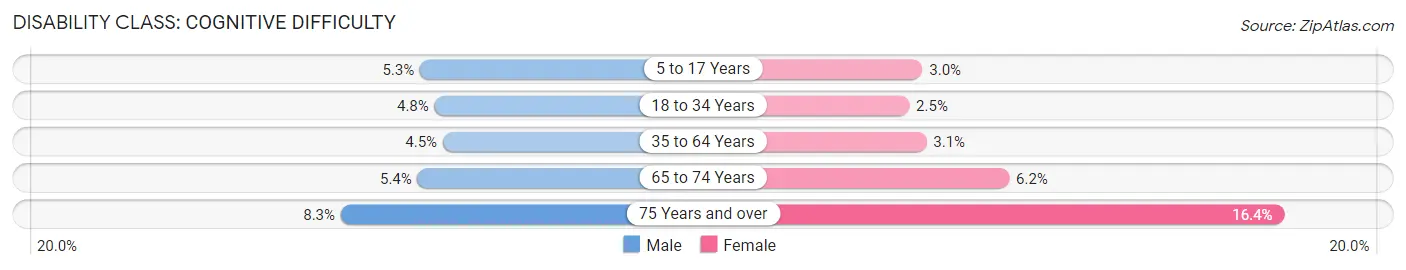
| Age Bracket | Male | Female |
| 5 to 17 Years | 1,125 (5.3%) | 653 (3.0%) |
| 18 to 34 Years | 1,469 (4.8%) | 686 (2.5%) |
| 35 to 64 Years | 1,639 (4.5%) | 1,200 (3.1%) |
| 65 to 74 Years | 329 (5.4%) | 455 (6.2%) |
| 75 Years and over | 200 (8.3%) | 608 (16.4%) |
Disability Class: Ambulatory Difficulty
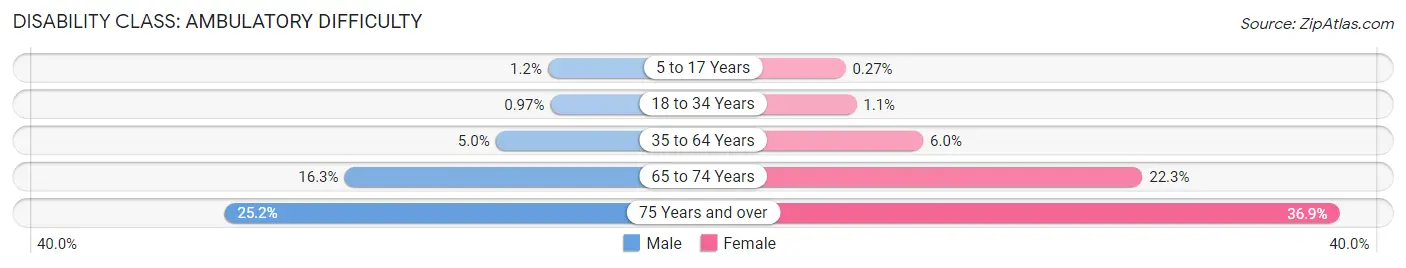
| Age Bracket | Male | Female |
| 5 to 17 Years | 246 (1.2%) | 58 (0.3%) |
| 18 to 34 Years | 299 (1.0%) | 297 (1.1%) |
| 35 to 64 Years | 1,850 (5.0%) | 2,307 (6.0%) |
| 65 to 74 Years | 989 (16.3%) | 1,635 (22.3%) |
| 75 Years and over | 609 (25.2%) | 1,367 (36.9%) |
Disability Class: Self-Care Difficulty
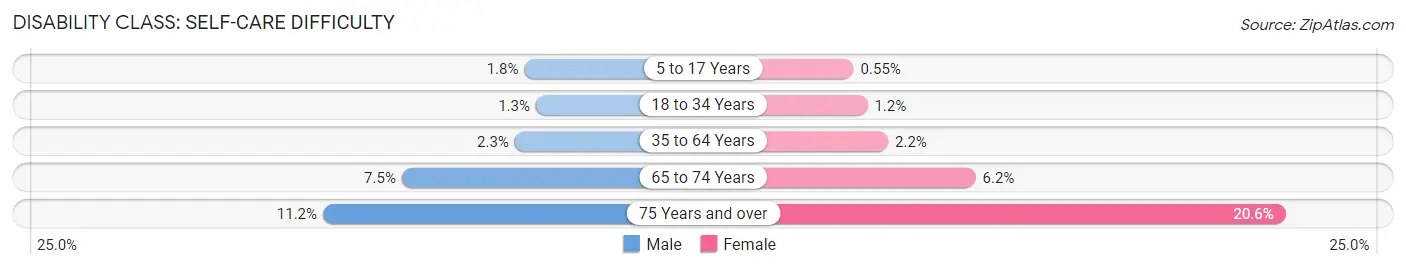
| Age Bracket | Male | Female |
| 5 to 17 Years | 382 (1.8%) | 120 (0.5%) |
| 18 to 34 Years | 394 (1.3%) | 325 (1.2%) |
| 35 to 64 Years | 831 (2.3%) | 820 (2.1%) |
| 65 to 74 Years | 456 (7.5%) | 455 (6.2%) |
| 75 Years and over | 270 (11.2%) | 762 (20.6%) |
Technology Access in Moreno Valley
Computing Device Access in Moreno Valley
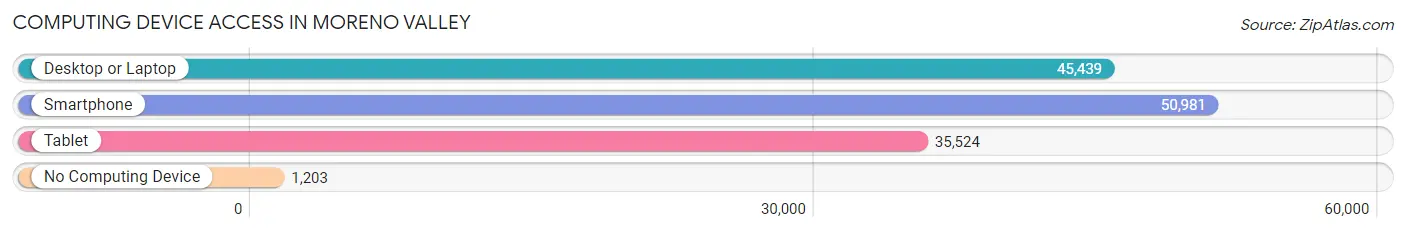
| Device Type | # Households | % Households |
| Desktop or Laptop | 45,439 | 84.2% |
| Smartphone | 50,981 | 94.5% |
| Tablet | 35,524 | 65.8% |
| No Computing Device | 1,203 | 2.2% |
| Total | 53,958 | 100.0% |
Internet Access in Moreno Valley
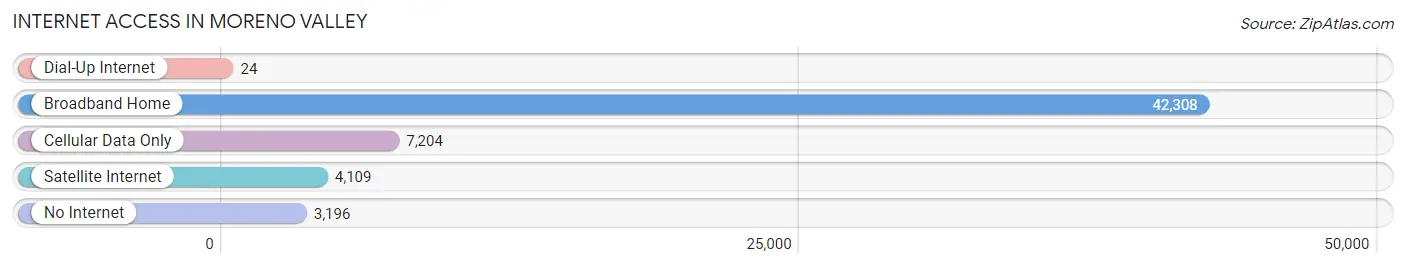
| Internet Type | # Households | % Households |
| Dial-Up Internet | 24 | 0.0% |
| Broadband Home | 42,308 | 78.4% |
| Cellular Data Only | 7,204 | 13.4% |
| Satellite Internet | 4,109 | 7.6% |
| No Internet | 3,196 | 5.9% |
| Total | 53,958 | 100.0% |
Moreno Valley Summary
Moreno Valley is a city located in Riverside County, California, United States. It is situated in the Inland Empire region of Southern California, approximately 8 miles east of Riverside, and is part of the Greater Los Angeles Area. As of the 2010 census, the city had a population of 193,365, making it the second-largest city in Riverside County by population, and the third-largest in the Inland Empire region.
Geography
Moreno Valley is located in the Inland Empire region of Southern California, approximately 8 miles east of Riverside. It is situated in the Moreno Valley Valley, which is part of the San Jacinto Valley. The city is bordered by the San Bernardino Mountains to the north, the San Jacinto Mountains to the south, and the San Gorgonio Pass to the east. The city is located at an elevation of 1,890 feet above sea level.
The city covers an area of approximately 50 square miles, with a population density of 3,845 people per square mile. The city is divided into several distinct neighborhoods, including the Eastside, Westside, Northside, and Southside.
Climate
Moreno Valley has a Mediterranean climate, with hot, dry summers and mild, wet winters. The average high temperature in the summer is around 95°F, while the average low temperature in the winter is around 45°F. The city receives an average of 14 inches of precipitation per year.
Demographics
As of the 2010 census, the city had a population of 193,365, making it the second-largest city in Riverside County by population, and the third-largest in the Inland Empire region. The population is composed of a diverse mix of ethnicities, with the largest groups being Hispanic (53.3%), White (30.2%), African American (9.2%), and Asian (3.7%). The median household income is $60,845, and the median age is 33.
Economy
Moreno Valley is home to a variety of businesses and industries, including retail, manufacturing, healthcare, and education. The city is home to several major employers, including the University of California, Riverside Medical Center, and the Moreno Valley Mall. The city also has a thriving small business sector, with many local businesses providing goods and services to the community.
The city is served by two major highways, Interstate 215 and State Route 60, as well as several public transportation options, including the Riverside Transit Agency and the Moreno Valley Transit Authority.
Conclusion
Moreno Valley is a vibrant city located in Riverside County, California. It is situated in the Inland Empire region of Southern California, and is part of the Greater Los Angeles Area. The city has a diverse population, with the largest groups being Hispanic, White, African American, and Asian. The city is home to a variety of businesses and industries, and is served by two major highways and several public transportation options.
Common Questions
What is Per Capita Income in Moreno Valley?
Per Capita income in Moreno Valley is $26,861.
What is the Median Family Income in Moreno Valley?
Median Family Income in Moreno Valley is $82,697.
What is the Median Household income in Moreno Valley?
Median Household Income in Moreno Valley is $82,637.
What is Income or Wage Gap in Moreno Valley?
Income or Wage Gap in Moreno Valley is 24.5%.
Women in Moreno Valley earn 75.5 cents for every dollar earned by a man.
What is Family Income Deficit in Moreno Valley?
Family Income Deficit in Moreno Valley is $11,257.
Families that are below poverty line in Moreno Valley earn $11,257 less on average than the poverty threshold level.
What is Inequality or Gini Index in Moreno Valley?
Inequality or Gini Index in Moreno Valley is 0.39.
What is the Total Population of Moreno Valley?
Total Population of Moreno Valley is 209,578.
What is the Total Male Population of Moreno Valley?
Total Male Population of Moreno Valley is 104,482.
What is the Total Female Population of Moreno Valley?
Total Female Population of Moreno Valley is 105,096.
What is the Ratio of Males per 100 Females in Moreno Valley?
There are 99.42 Males per 100 Females in Moreno Valley.
What is the Ratio of Females per 100 Males in Moreno Valley?
There are 100.59 Females per 100 Males in Moreno Valley.
What is the Median Population Age in Moreno Valley?
Median Population Age in Moreno Valley is 31.8 Years.
What is the Average Family Size in Moreno Valley
Average Family Size in Moreno Valley is 4.1 People.
What is the Average Household Size in Moreno Valley
Average Household Size in Moreno Valley is 3.9 People.
How Large is the Labor Force in Moreno Valley?
There are 102,784 People in the Labor Forcein in Moreno Valley.
What is the Percentage of People in the Labor Force in Moreno Valley?
64.6% of People are in the Labor Force in Moreno Valley.
What is the Unemployment Rate in Moreno Valley?
Unemployment Rate in Moreno Valley is 7.5%.