La Riviera, CA Map & Demographics
La Riviera Map
La Riviera Overview
$40,881
PER CAPITA INCOME
$94,167
AVG FAMILY INCOME
$85,744
AVG HOUSEHOLD INCOME
11.1%
WAGE / INCOME GAP [ % ]
88.9¢/ $1
WAGE / INCOME GAP [ $ ]
0.38
INEQUALITY / GINI INDEX
11,652
TOTAL POPULATION
5,403
MALE POPULATION
6,249
FEMALE POPULATION
86.46
MALES / 100 FEMALES
115.66
FEMALES / 100 MALES
33.6
MEDIAN AGE
3.0
AVG FAMILY SIZE
2.6
AVG HOUSEHOLD SIZE
6,640
LABOR FORCE [ PEOPLE ]
70.2%
PERCENT IN LABOR FORCE
3.3%
UNEMPLOYMENT RATE
Income in La Riviera
Income Overview in La Riviera
Per Capita Income in La Riviera is $40,881, while median incomes of families and households are $94,167 and $85,744 respectively.
| Characteristic | Number | Measure |
| Per Capita Income | 11,652 | $40,881 |
| Median Family Income | 2,686 | $94,167 |
| Mean Family Income | 2,686 | $111,827 |
| Median Household Income | 4,520 | $85,744 |
| Mean Household Income | 4,520 | $102,546 |
| Income Deficit | 2,686 | $0 |
| Wage / Income Gap (%) | 11,652 | 11.11% |
| Wage / Income Gap ($) | 11,652 | 88.89¢ per $1 |
| Gini / Inequality Index | 11,652 | 0.38 |
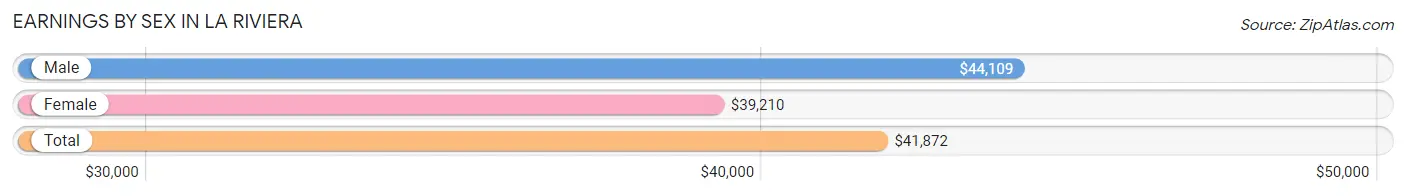
Earnings by Sex in La Riviera
Average Earnings in La Riviera are $41,872, $44,109 for men and $39,210 for women, a difference of 11.1%.
| Sex | Number | Average Earnings |
| Male | 3,600 (52.6%) | $44,109 |
| Female | 3,241 (47.4%) | $39,210 |
| Total | 6,841 (100.0%) | $41,872 |
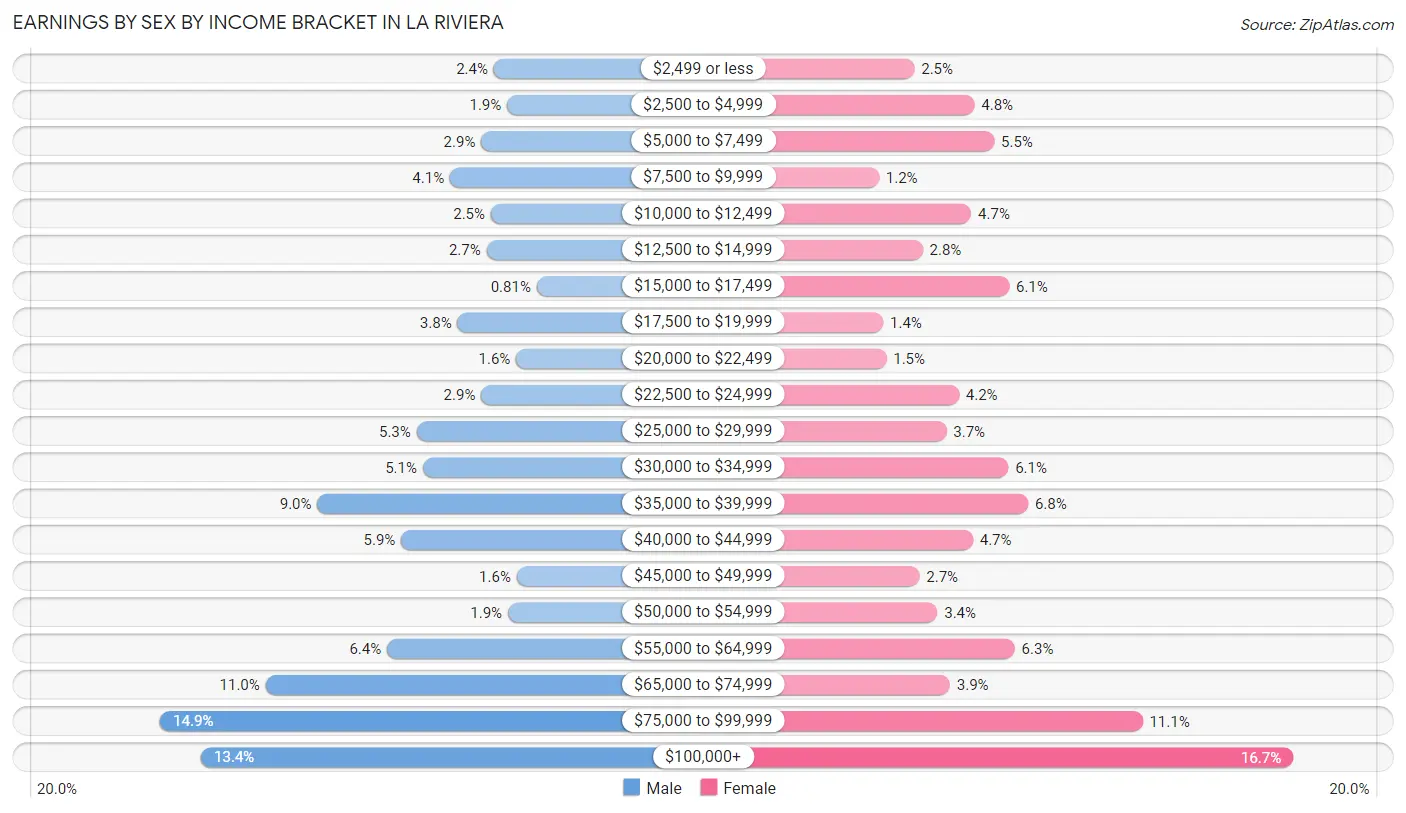
Earnings by Sex by Income Bracket in La Riviera
The most common earnings brackets in La Riviera are $75,000 to $99,999 for men (537 | 14.9%) and $100,000+ for women (542 | 16.7%).
| Income | Male | Female |
| $2,499 or less | 87 (2.4%) | 82 (2.5%) |
| $2,500 to $4,999 | 69 (1.9%) | 155 (4.8%) |
| $5,000 to $7,499 | 104 (2.9%) | 179 (5.5%) |
| $7,500 to $9,999 | 146 (4.1%) | 39 (1.2%) |
| $10,000 to $12,499 | 91 (2.5%) | 151 (4.7%) |
| $12,500 to $14,999 | 97 (2.7%) | 92 (2.8%) |
| $15,000 to $17,499 | 29 (0.8%) | 197 (6.1%) |
| $17,500 to $19,999 | 136 (3.8%) | 44 (1.4%) |
| $20,000 to $22,499 | 57 (1.6%) | 48 (1.5%) |
| $22,500 to $24,999 | 104 (2.9%) | 136 (4.2%) |
| $25,000 to $29,999 | 191 (5.3%) | 121 (3.7%) |
| $30,000 to $34,999 | 183 (5.1%) | 196 (6.0%) |
| $35,000 to $39,999 | 325 (9.0%) | 220 (6.8%) |
| $40,000 to $44,999 | 212 (5.9%) | 153 (4.7%) |
| $45,000 to $49,999 | 56 (1.6%) | 88 (2.7%) |
| $50,000 to $54,999 | 68 (1.9%) | 110 (3.4%) |
| $55,000 to $64,999 | 231 (6.4%) | 204 (6.3%) |
| $65,000 to $74,999 | 395 (11.0%) | 125 (3.9%) |
| $75,000 to $99,999 | 537 (14.9%) | 359 (11.1%) |
| $100,000+ | 482 (13.4%) | 542 (16.7%) |
| Total | 3,600 (100.0%) | 3,241 (100.0%) |
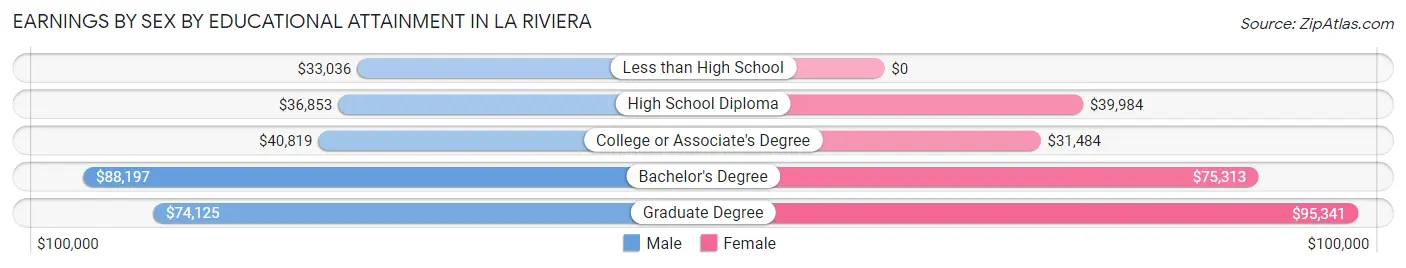
Earnings by Sex by Educational Attainment in La Riviera
Average earnings in La Riviera are $50,846 for men and $53,665 for women, a difference of 5.2%. Men with an educational attainment of bachelor's degree enjoy the highest average annual earnings of $88,197, while those with less than high school education earn the least with $33,036. Women with an educational attainment of graduate degree earn the most with the average annual earnings of $95,341, while those with college or associate's degree education have the smallest earnings of $31,484.
| Educational Attainment | Male Income | Female Income |
| Less than High School | $33,036 | $0 |
| High School Diploma | $36,853 | $39,984 |
| College or Associate's Degree | $40,819 | $31,484 |
| Bachelor's Degree | $88,197 | $75,313 |
| Graduate Degree | $74,125 | $95,341 |
| Total | $50,846 | $53,665 |
Family Income in La Riviera
Family Income Brackets in La Riviera
According to the La Riviera family income data, there are 551 families falling into the $100,000 to $149,999 income range, which is the most common income bracket and makes up 20.5% of all families. Conversely, the $10,000 to $14,999 income bracket is the least frequent group with only 27 families (1.0%) belonging to this category.
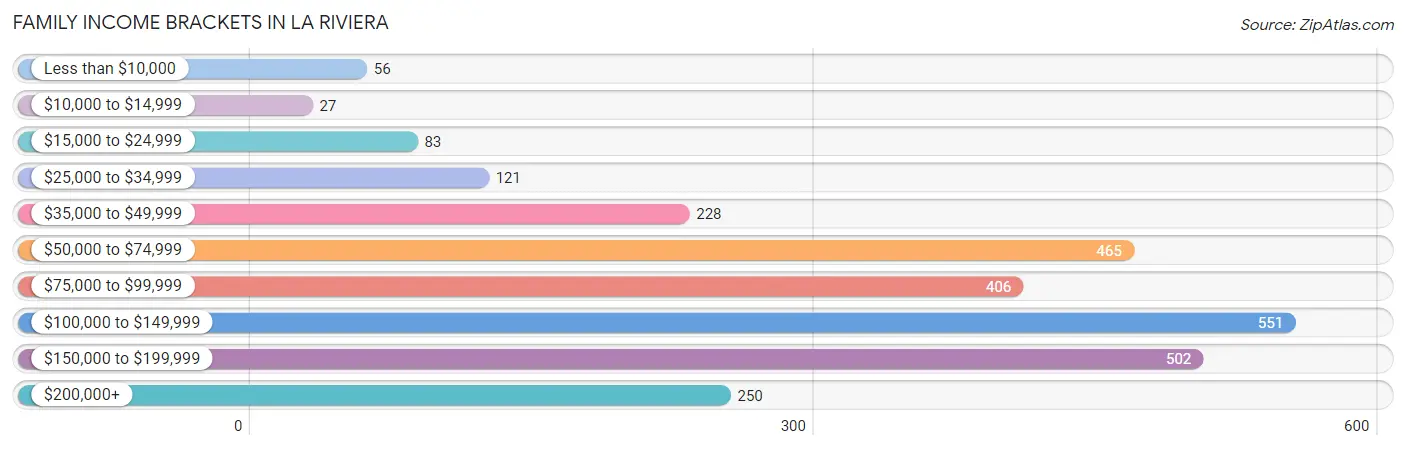
| Income Bracket | # Families | % Families |
| Less than $10,000 | 56 | 2.1% |
| $10,000 to $14,999 | 27 | 1.0% |
| $15,000 to $24,999 | 83 | 3.1% |
| $25,000 to $34,999 | 121 | 4.5% |
| $35,000 to $49,999 | 228 | 8.5% |
| $50,000 to $74,999 | 465 | 17.3% |
| $75,000 to $99,999 | 406 | 15.1% |
| $100,000 to $149,999 | 551 | 20.5% |
| $150,000 to $199,999 | 502 | 18.7% |
| $200,000+ | 250 | 9.3% |
Family Income by Famaliy Size in La Riviera
4-person families (428 | 15.9%) account for the highest median family income in La Riviera with $162,577 per family, while 2-person families (1,350 | 50.3%) have the highest median income of $44,554 per family member.
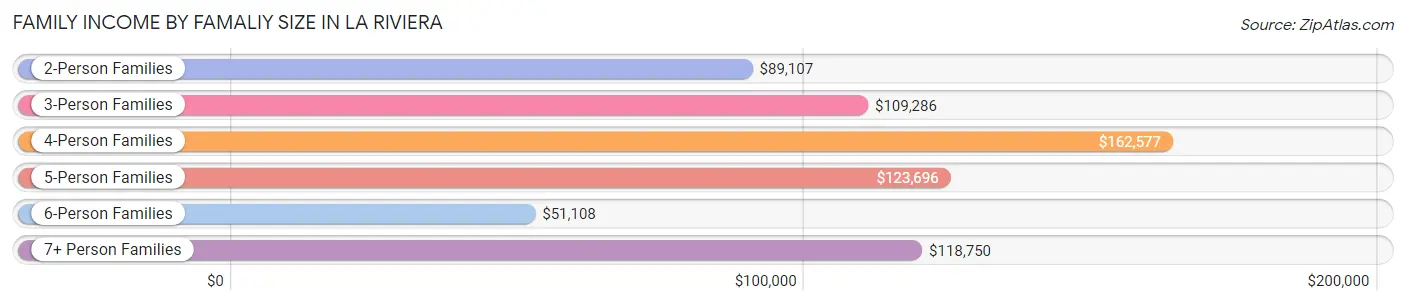
| Income Bracket | # Families | Median Income |
| 2-Person Families | 1,350 (50.3%) | $89,107 |
| 3-Person Families | 634 (23.6%) | $109,286 |
| 4-Person Families | 428 (15.9%) | $162,577 |
| 5-Person Families | 108 (4.0%) | $123,696 |
| 6-Person Families | 140 (5.2%) | $51,108 |
| 7+ Person Families | 26 (1.0%) | $118,750 |
| Total | 2,686 (100.0%) | $94,167 |
Family Income by Number of Earners in La Riviera
The median family income in La Riviera is $94,167, with families comprising 3+ earners (255) having the highest median family income of $190,469, while families with no earners (382) have the lowest median family income of $55,500, accounting for 9.5% and 14.2% of families, respectively.
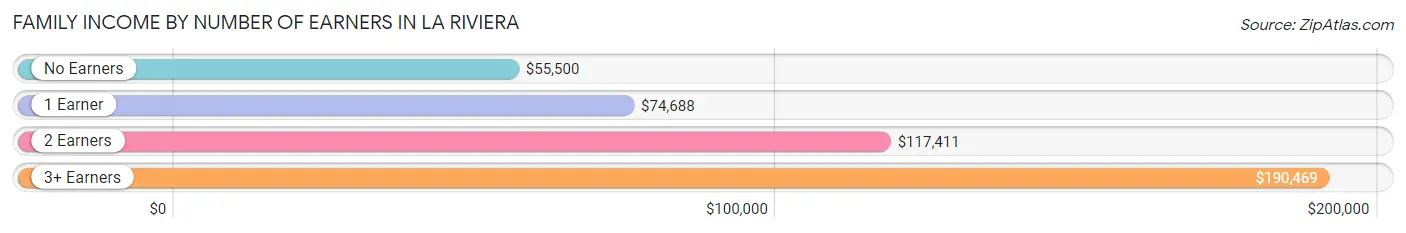
| Number of Earners | # Families | Median Income |
| No Earners | 382 (14.2%) | $55,500 |
| 1 Earner | 848 (31.6%) | $74,688 |
| 2 Earners | 1,201 (44.7%) | $117,411 |
| 3+ Earners | 255 (9.5%) | $190,469 |
| Total | 2,686 (100.0%) | $94,167 |
Household Income in La Riviera
Household Income Brackets in La Riviera
With 904 households falling in the category, the $100,000 to $149,999 income range is the most frequent in La Riviera, accounting for 20.0% of all households. In contrast, only 90 households (2.0%) fall into the $10,000 to $14,999 income bracket, making it the least populous group.
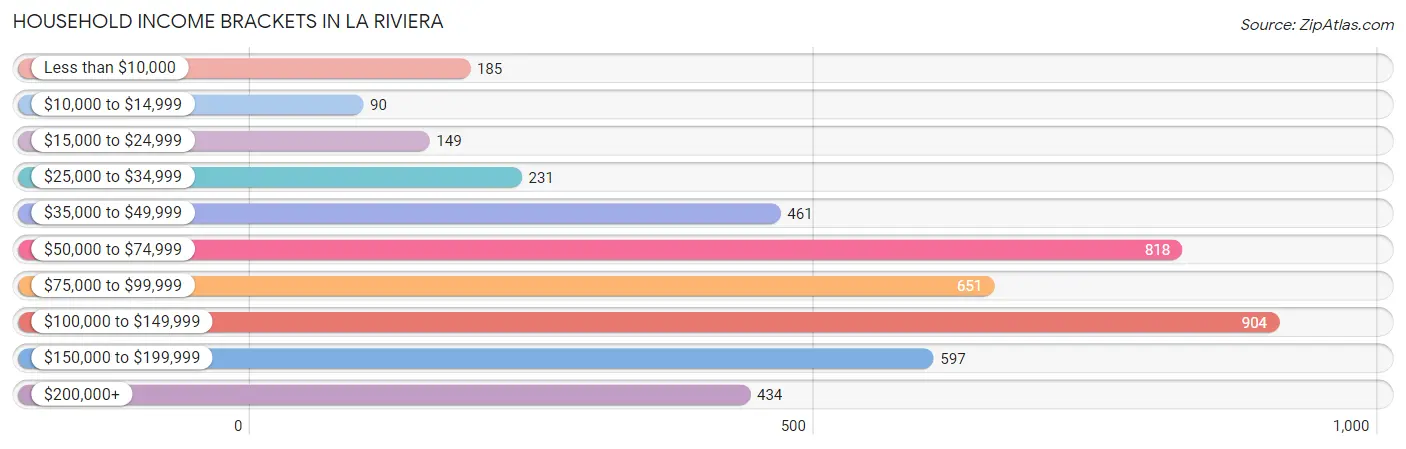
| Income Bracket | # Households | % Households |
| Less than $10,000 | 185 | 4.1% |
| $10,000 to $14,999 | 90 | 2.0% |
| $15,000 to $24,999 | 149 | 3.3% |
| $25,000 to $34,999 | 231 | 5.1% |
| $35,000 to $49,999 | 461 | 10.2% |
| $50,000 to $74,999 | 818 | 18.1% |
| $75,000 to $99,999 | 651 | 14.4% |
| $100,000 to $149,999 | 904 | 20.0% |
| $150,000 to $199,999 | 597 | 13.2% |
| $200,000+ | 434 | 9.6% |
Household Income by Householder Age in La Riviera
The median household income in La Riviera is $85,744, with the highest median household income of $103,841 found in the 45 to 64 years age bracket for the primary householder. A total of 1,504 households (33.3%) fall into this category. Meanwhile, the 65+ years age bracket for the primary householder has the lowest median household income of $68,194, with 887 households (19.6%) in this group.
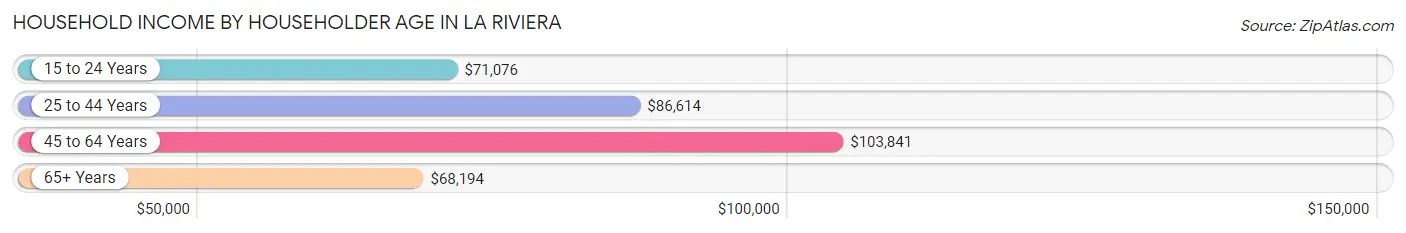
| Income Bracket | # Households | Median Income |
| 15 to 24 Years | 282 (6.2%) | $71,076 |
| 25 to 44 Years | 1,847 (40.9%) | $86,614 |
| 45 to 64 Years | 1,504 (33.3%) | $103,841 |
| 65+ Years | 887 (19.6%) | $68,194 |
| Total | 4,520 (100.0%) | $85,744 |
Poverty in La Riviera
Income Below Poverty by Sex and Age in La Riviera
With 12.2% poverty level for males and 12.4% for females among the residents of La Riviera, 12 to 14 year old males and 18 to 24 year old females are the most vulnerable to poverty, with 8 males (47.1%) and 319 females (37.7%) in their respective age groups living below the poverty level.
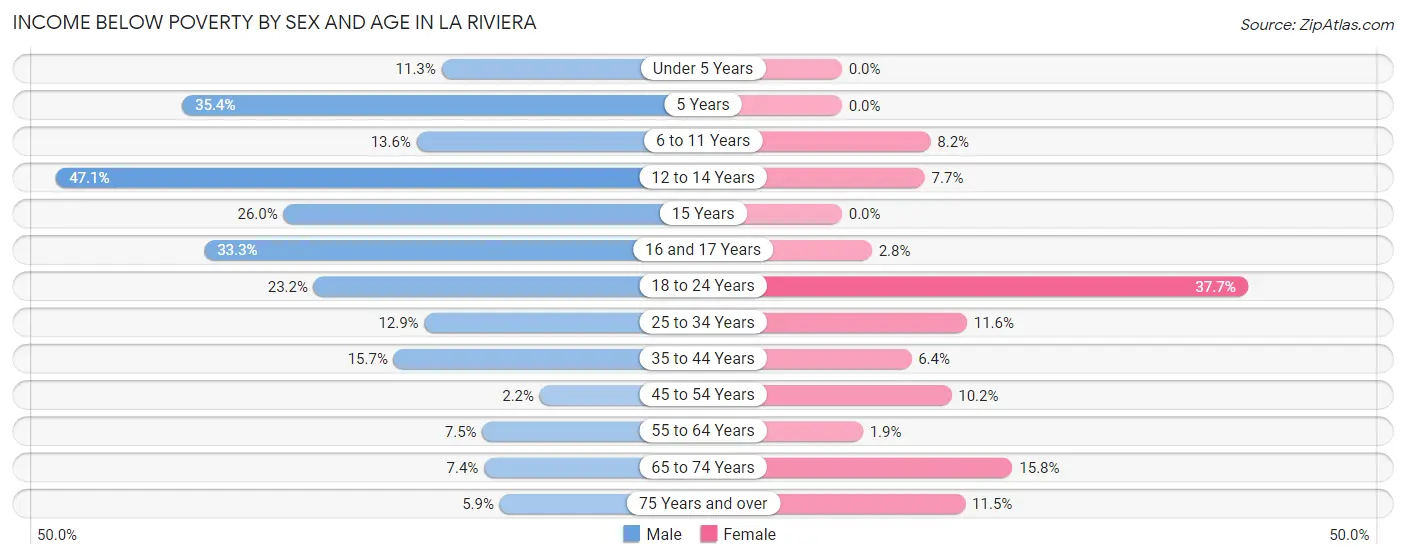
| Age Bracket | Male | Female |
| Under 5 Years | 26 (11.3%) | 0 (0.0%) |
| 5 Years | 23 (35.4%) | 0 (0.0%) |
| 6 to 11 Years | 55 (13.6%) | 56 (8.2%) |
| 12 to 14 Years | 8 (47.1%) | 21 (7.7%) |
| 15 Years | 20 (26.0%) | 0 (0.0%) |
| 16 and 17 Years | 16 (33.3%) | 4 (2.8%) |
| 18 to 24 Years | 88 (23.2%) | 319 (37.7%) |
| 25 to 34 Years | 173 (12.9%) | 132 (11.6%) |
| 35 to 44 Years | 155 (15.7%) | 42 (6.4%) |
| 45 to 54 Years | 15 (2.2%) | 65 (10.2%) |
| 55 to 64 Years | 47 (7.5%) | 10 (1.9%) |
| 65 to 74 Years | 15 (7.3%) | 69 (15.8%) |
| 75 Years and over | 19 (5.9%) | 56 (11.5%) |
| Total | 660 (12.2%) | 774 (12.4%) |
Income Above Poverty by Sex and Age in La Riviera
According to the poverty statistics in La Riviera, males aged 45 to 54 years and females aged under 5 years are the age groups that are most secure financially, with 97.8% of males and 100.0% of females in these age groups living above the poverty line.
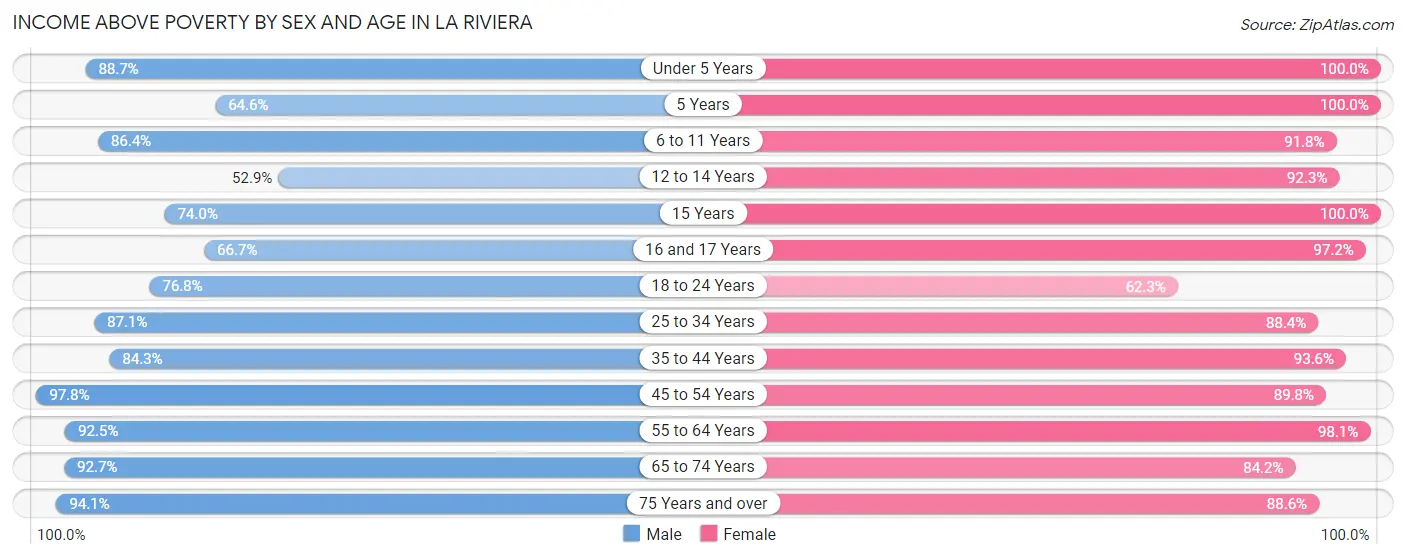
| Age Bracket | Male | Female |
| Under 5 Years | 204 (88.7%) | 332 (100.0%) |
| 5 Years | 42 (64.6%) | 19 (100.0%) |
| 6 to 11 Years | 349 (86.4%) | 625 (91.8%) |
| 12 to 14 Years | 9 (52.9%) | 252 (92.3%) |
| 15 Years | 57 (74.0%) | 78 (100.0%) |
| 16 and 17 Years | 32 (66.7%) | 140 (97.2%) |
| 18 to 24 Years | 292 (76.8%) | 528 (62.3%) |
| 25 to 34 Years | 1,169 (87.1%) | 1,006 (88.4%) |
| 35 to 44 Years | 830 (84.3%) | 610 (93.6%) |
| 45 to 54 Years | 673 (97.8%) | 575 (89.8%) |
| 55 to 64 Years | 579 (92.5%) | 505 (98.1%) |
| 65 to 74 Years | 189 (92.6%) | 367 (84.2%) |
| 75 Years and over | 303 (94.1%) | 433 (88.5%) |
| Total | 4,728 (87.7%) | 5,470 (87.6%) |
Income Below Poverty Among Married-Couple Families in La Riviera
The poverty statistics for married-couple families in La Riviera show that 4.3% or 78 of the total 1,836 families live below the poverty line. Families with 3 or 4 children have the highest poverty rate of 14.0%, comprising of 27 families. On the other hand, families with no children have the lowest poverty rate of 1.5%, which includes 15 families.
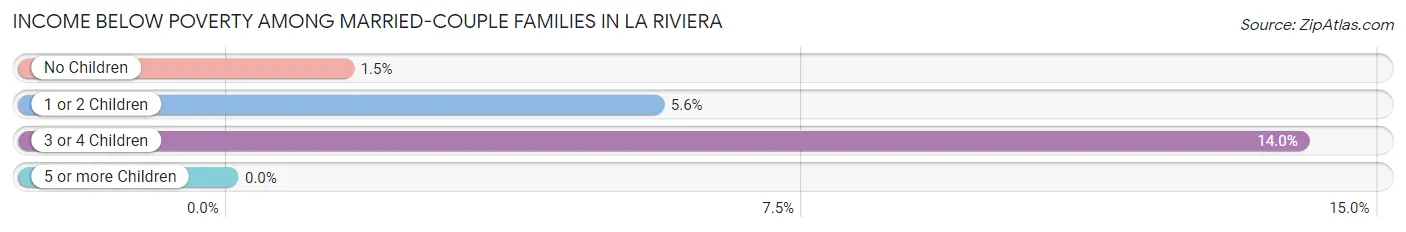
| Children | Above Poverty | Below Poverty |
| No Children | 980 (98.5%) | 15 (1.5%) |
| 1 or 2 Children | 612 (94.4%) | 36 (5.6%) |
| 3 or 4 Children | 166 (86.0%) | 27 (14.0%) |
| 5 or more Children | 0 (0.0%) | 0 (0.0%) |
| Total | 1,758 (95.8%) | 78 (4.3%) |
Income Below Poverty Among Single-Parent Households in La Riviera
According to the poverty data in La Riviera, 2.7% or 10 single-father households and 9.5% or 46 single-mother households are living below the poverty line. Among single-father households, those with no children have the highest poverty rate, with 10 households (5.6%) experiencing poverty. Likewise, among single-mother households, those with 5 or more children have the highest poverty rate, with 6 households (100.0%) falling below the poverty line.
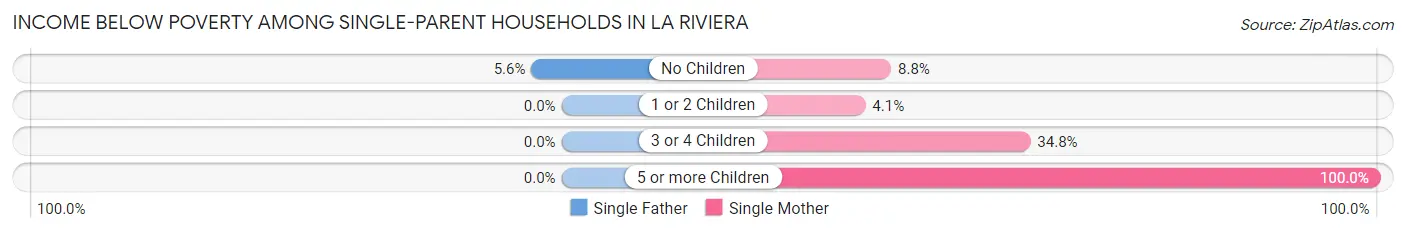
| Children | Single Father | Single Mother |
| No Children | 10 (5.6%) | 25 (8.8%) |
| 1 or 2 Children | 0 (0.0%) | 7 (4.1%) |
| 3 or 4 Children | 0 (0.0%) | 8 (34.8%) |
| 5 or more Children | 0 (0.0%) | 6 (100.0%) |
| Total | 10 (2.7%) | 46 (9.5%) |
Income Below Poverty Among Married-Couple vs Single-Parent Households in La Riviera
The poverty data for La Riviera shows that 78 of the married-couple family households (4.3%) and 56 of the single-parent households (6.6%) are living below the poverty level. Within the married-couple family households, those with 3 or 4 children have the highest poverty rate, with 27 households (14.0%) falling below the poverty line. Among the single-parent households, those with 5 or more children have the highest poverty rate, with 6 household (100.0%) living below poverty.
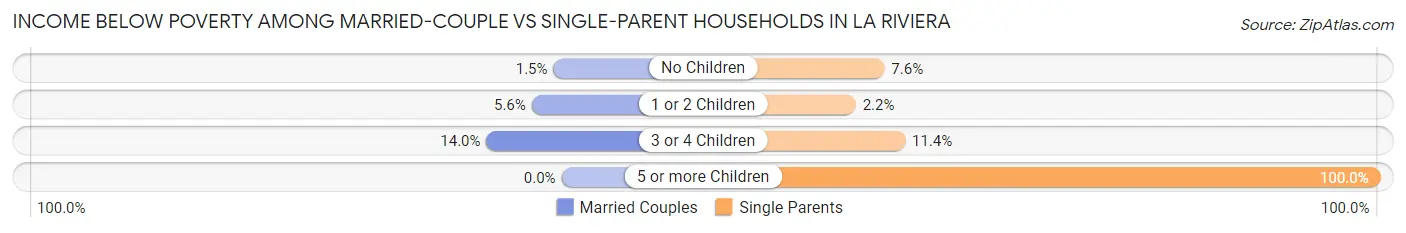
| Children | Married-Couple Families | Single-Parent Households |
| No Children | 15 (1.5%) | 35 (7.6%) |
| 1 or 2 Children | 36 (5.6%) | 7 (2.2%) |
| 3 or 4 Children | 27 (14.0%) | 8 (11.4%) |
| 5 or more Children | 0 (0.0%) | 6 (100.0%) |
| Total | 78 (4.3%) | 56 (6.6%) |
Race in La Riviera
The most populous races in La Riviera are White / Caucasian (6,753 | 58.0%), Hispanic or Latino (2,820 | 24.2%), and Black / African American (1,311 | 11.3%).
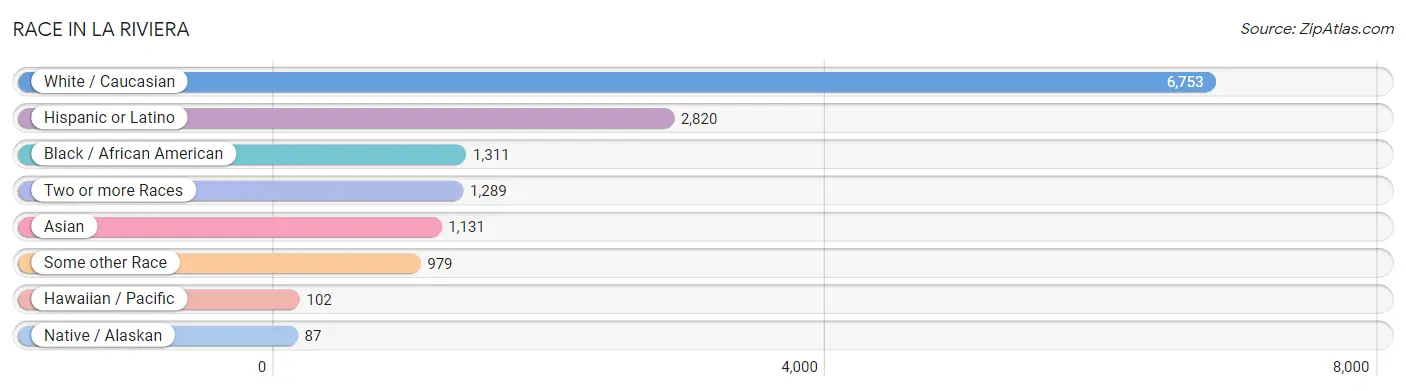
| Race | # Population | % Population |
| Asian | 1,131 | 9.7% |
| Black / African American | 1,311 | 11.3% |
| Hawaiian / Pacific | 102 | 0.9% |
| Hispanic or Latino | 2,820 | 24.2% |
| Native / Alaskan | 87 | 0.7% |
| White / Caucasian | 6,753 | 58.0% |
| Two or more Races | 1,289 | 11.1% |
| Some other Race | 979 | 8.4% |
| Total | 11,652 | 100.0% |
Ancestry in La Riviera
The most populous ancestries reported in La Riviera are Mexican (2,143 | 18.4%), German (1,412 | 12.1%), Irish (1,355 | 11.6%), English (1,024 | 8.8%), and Italian (872 | 7.5%), together accounting for 58.4% of all La Riviera residents.
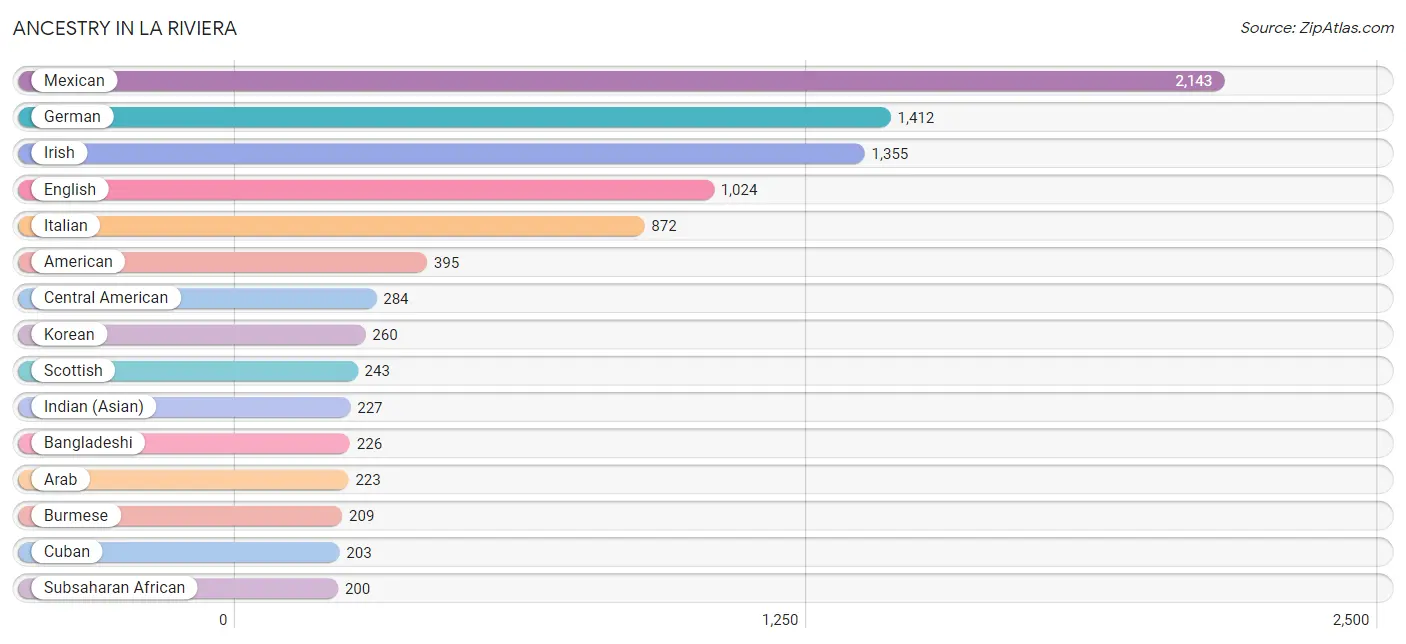
| Ancestry | # Population | % Population |
| Afghan | 92 | 0.8% |
| African | 51 | 0.4% |
| American | 395 | 3.4% |
| Apache | 4 | 0.0% |
| Arab | 223 | 1.9% |
| Assyrian / Chaldean / Syriac | 9 | 0.1% |
| Austrian | 14 | 0.1% |
| Bangladeshi | 226 | 1.9% |
| Belgian | 57 | 0.5% |
| Bhutanese | 131 | 1.1% |
| Blackfeet | 14 | 0.1% |
| British | 79 | 0.7% |
| Burmese | 209 | 1.8% |
| Cajun | 9 | 0.1% |
| Central American | 284 | 2.4% |
| Cherokee | 15 | 0.1% |
| Croatian | 22 | 0.2% |
| Cuban | 203 | 1.7% |
| Czech | 11 | 0.1% |
| Czechoslovakian | 10 | 0.1% |
| Danish | 35 | 0.3% |
| Dutch | 70 | 0.6% |
| Eastern European | 7 | 0.1% |
| English | 1,024 | 8.8% |
| Ethiopian | 23 | 0.2% |
| European | 193 | 1.7% |
| Filipino | 38 | 0.3% |
| Finnish | 26 | 0.2% |
| French | 133 | 1.1% |
| French Canadian | 7 | 0.1% |
| German | 1,412 | 12.1% |
| Greek | 25 | 0.2% |
| Guamanian / Chamorro | 69 | 0.6% |
| Guatemalan | 164 | 1.4% |
| Hungarian | 77 | 0.7% |
| Indian (Asian) | 227 | 1.9% |
| Iranian | 33 | 0.3% |
| Irish | 1,355 | 11.6% |
| Iroquois | 4 | 0.0% |
| Italian | 872 | 7.5% |
| Japanese | 20 | 0.2% |
| Jordanian | 23 | 0.2% |
| Korean | 260 | 2.2% |
| Lebanese | 65 | 0.6% |
| Lithuanian | 4 | 0.0% |
| Mexican | 2,143 | 18.4% |
| Mexican American Indian | 97 | 0.8% |
| Moroccan | 85 | 0.7% |
| Native Hawaiian | 59 | 0.5% |
| Navajo | 24 | 0.2% |
| Nicaraguan | 7 | 0.1% |
| Nigerian | 44 | 0.4% |
| Northern European | 56 | 0.5% |
| Norwegian | 74 | 0.6% |
| Panamanian | 8 | 0.1% |
| Polish | 171 | 1.5% |
| Portuguese | 115 | 1.0% |
| Puerto Rican | 98 | 0.8% |
| Russian | 126 | 1.1% |
| Salvadoran | 105 | 0.9% |
| Samoan | 38 | 0.3% |
| Scandinavian | 44 | 0.4% |
| Scotch-Irish | 73 | 0.6% |
| Scottish | 243 | 2.1% |
| Senegalese | 82 | 0.7% |
| Serbian | 8 | 0.1% |
| Sioux | 5 | 0.0% |
| Spaniard | 70 | 0.6% |
| Spanish | 20 | 0.2% |
| Sri Lankan | 123 | 1.1% |
| Subsaharan African | 200 | 1.7% |
| Swedish | 136 | 1.2% |
| Swiss | 34 | 0.3% |
| Thai | 118 | 1.0% |
| Ukrainian | 49 | 0.4% |
| Welsh | 57 | 0.5% |
| Yaqui | 88 | 0.8% | View All 77 Rows |
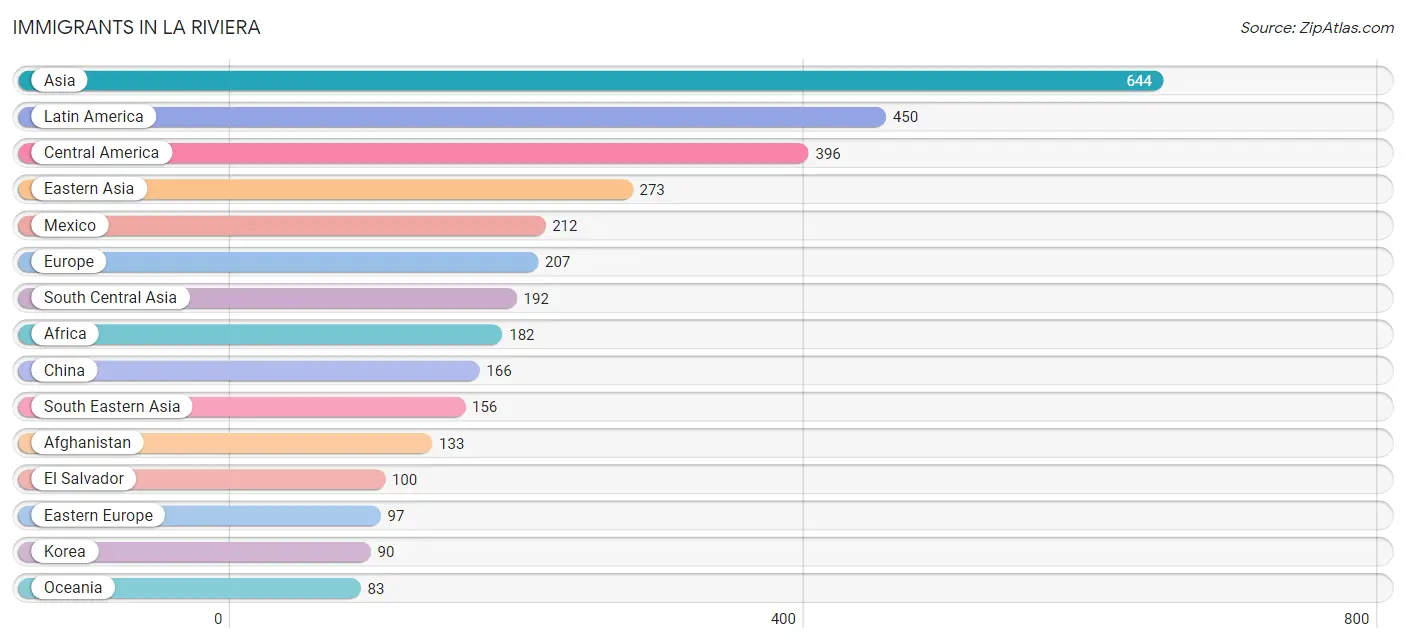
Immigrants in La Riviera
The most numerous immigrant groups reported in La Riviera came from Asia (644 | 5.5%), Latin America (450 | 3.9%), Central America (396 | 3.4%), Eastern Asia (273 | 2.3%), and Mexico (212 | 1.8%), together accounting for 17.0% of all La Riviera residents.
| Immigration Origin | # Population | % Population |
| Afghanistan | 133 | 1.1% |
| Africa | 182 | 1.6% |
| Asia | 644 | 5.5% |
| Austria | 11 | 0.1% |
| Brazil | 7 | 0.1% |
| Cameroon | 30 | 0.3% |
| Canada | 18 | 0.2% |
| Caribbean | 47 | 0.4% |
| Central America | 396 | 3.4% |
| China | 166 | 1.4% |
| Cuba | 47 | 0.4% |
| Eastern Africa | 52 | 0.4% |
| Eastern Asia | 273 | 2.3% |
| Eastern Europe | 97 | 0.8% |
| El Salvador | 100 | 0.9% |
| England | 25 | 0.2% |
| Ethiopia | 52 | 0.4% |
| Europe | 207 | 1.8% |
| Fiji | 43 | 0.4% |
| Germany | 29 | 0.3% |
| Guatemala | 76 | 0.6% |
| India | 37 | 0.3% |
| Iran | 16 | 0.1% |
| Italy | 21 | 0.2% |
| Japan | 17 | 0.2% |
| Jordan | 23 | 0.2% |
| Korea | 90 | 0.8% |
| Latin America | 450 | 3.9% |
| Malaysia | 4 | 0.0% |
| Mexico | 212 | 1.8% |
| Middle Africa | 30 | 0.3% |
| Moldova | 22 | 0.2% |
| Morocco | 42 | 0.4% |
| Nepal | 6 | 0.1% |
| Nigeria | 28 | 0.2% |
| Northern Africa | 42 | 0.4% |
| Northern Europe | 49 | 0.4% |
| Oceania | 83 | 0.7% |
| Panama | 8 | 0.1% |
| Philippines | 60 | 0.5% |
| Russia | 43 | 0.4% |
| Scotland | 7 | 0.1% |
| Senegal | 30 | 0.3% |
| Serbia | 8 | 0.1% |
| South America | 7 | 0.1% |
| South Central Asia | 192 | 1.7% |
| South Eastern Asia | 156 | 1.3% |
| Southern Europe | 21 | 0.2% |
| Taiwan | 79 | 0.7% |
| Thailand | 25 | 0.2% |
| Ukraine | 24 | 0.2% |
| Vietnam | 67 | 0.6% |
| Western Africa | 58 | 0.5% |
| Western Asia | 23 | 0.2% |
| Western Europe | 40 | 0.3% | View All 55 Rows |
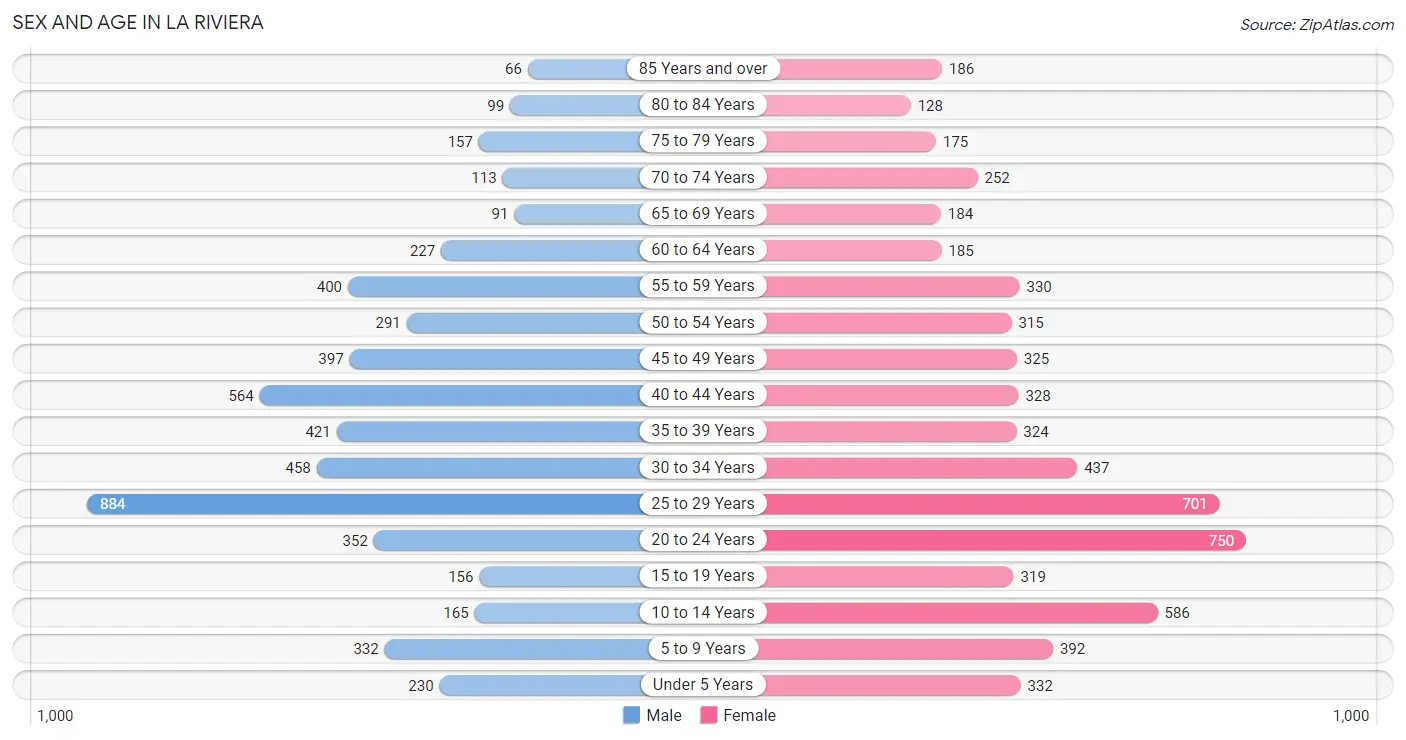
Sex and Age in La Riviera
Sex and Age in La Riviera
The most populous age groups in La Riviera are 25 to 29 Years (884 | 16.4%) for men and 20 to 24 Years (750 | 12.0%) for women.
| Age Bracket | Male | Female |
| Under 5 Years | 230 (4.3%) | 332 (5.3%) |
| 5 to 9 Years | 332 (6.1%) | 392 (6.3%) |
| 10 to 14 Years | 165 (3.0%) | 586 (9.4%) |
| 15 to 19 Years | 156 (2.9%) | 319 (5.1%) |
| 20 to 24 Years | 352 (6.5%) | 750 (12.0%) |
| 25 to 29 Years | 884 (16.4%) | 701 (11.2%) |
| 30 to 34 Years | 458 (8.5%) | 437 (7.0%) |
| 35 to 39 Years | 421 (7.8%) | 324 (5.2%) |
| 40 to 44 Years | 564 (10.4%) | 328 (5.2%) |
| 45 to 49 Years | 397 (7.3%) | 325 (5.2%) |
| 50 to 54 Years | 291 (5.4%) | 315 (5.0%) |
| 55 to 59 Years | 400 (7.4%) | 330 (5.3%) |
| 60 to 64 Years | 227 (4.2%) | 185 (3.0%) |
| 65 to 69 Years | 91 (1.7%) | 184 (2.9%) |
| 70 to 74 Years | 113 (2.1%) | 252 (4.0%) |
| 75 to 79 Years | 157 (2.9%) | 175 (2.8%) |
| 80 to 84 Years | 99 (1.8%) | 128 (2.1%) |
| 85 Years and over | 66 (1.2%) | 186 (3.0%) |
| Total | 5,403 (100.0%) | 6,249 (100.0%) |
Families and Households in La Riviera
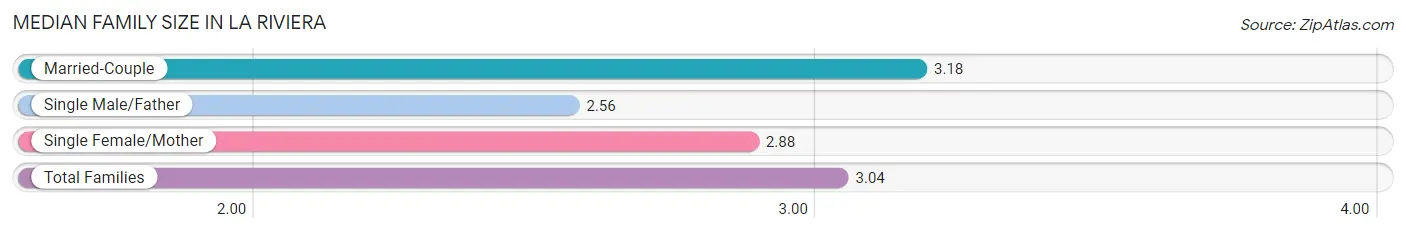
Median Family Size in La Riviera
The median family size in La Riviera is 3.04 persons per family, with married-couple families (1,836 | 68.3%) accounting for the largest median family size of 3.18 persons per family. On the other hand, single male/father families (365 | 13.6%) represent the smallest median family size with 2.56 persons per family.
| Family Type | # Families | Family Size |
| Married-Couple | 1,836 (68.3%) | 3.18 |
| Single Male/Father | 365 (13.6%) | 2.56 |
| Single Female/Mother | 485 (18.1%) | 2.88 |
| Total Families | 2,686 (100.0%) | 3.04 |
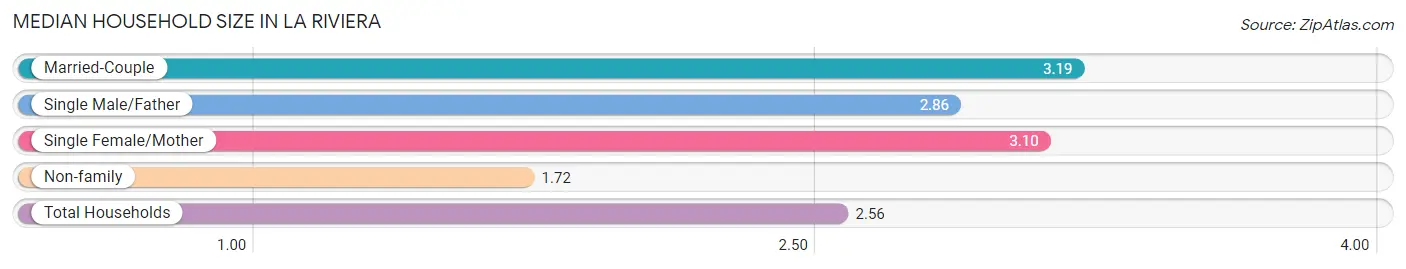
Median Household Size in La Riviera
The median household size in La Riviera is 2.56 persons per household, with married-couple households (1,836 | 40.6%) accounting for the largest median household size of 3.19 persons per household. non-family households (1,834 | 40.6%) represent the smallest median household size with 1.72 persons per household.
| Household Type | # Households | Household Size |
| Married-Couple | 1,836 (40.6%) | 3.19 |
| Single Male/Father | 365 (8.1%) | 2.86 |
| Single Female/Mother | 485 (10.7%) | 3.10 |
| Non-family | 1,834 (40.6%) | 1.72 |
| Total Households | 4,520 (100.0%) | 2.56 |
Household Size by Marriage Status in La Riviera
Out of a total of 4,520 households in La Riviera, 2,686 (59.4%) are family households, while 1,834 (40.6%) are nonfamily households. The most numerous type of family households are 2-person households, comprising 1,210, and the most common type of nonfamily households are 1-person households, comprising 1,106.
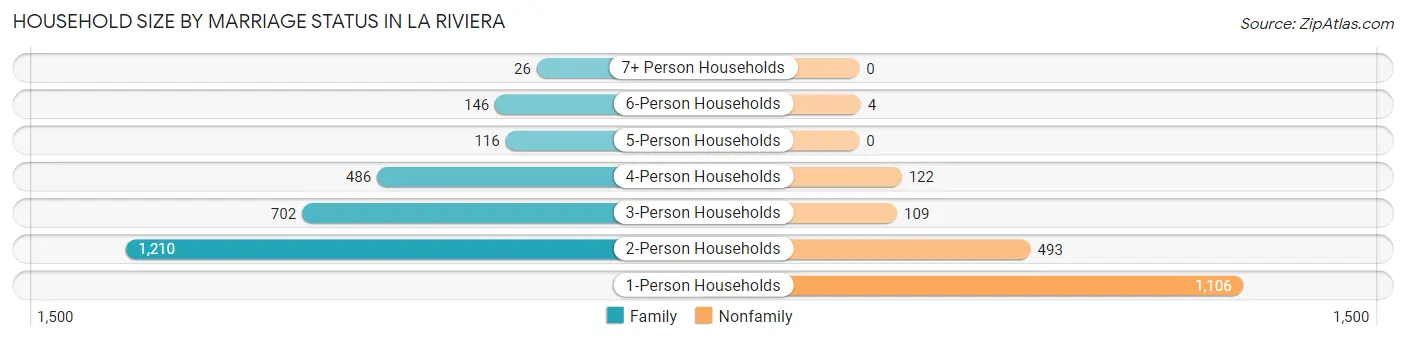
| Household Size | Family Households | Nonfamily Households |
| 1-Person Households | - | 1,106 (24.5%) |
| 2-Person Households | 1,210 (26.8%) | 493 (10.9%) |
| 3-Person Households | 702 (15.5%) | 109 (2.4%) |
| 4-Person Households | 486 (10.7%) | 122 (2.7%) |
| 5-Person Households | 116 (2.6%) | 0 (0.0%) |
| 6-Person Households | 146 (3.2%) | 4 (0.1%) |
| 7+ Person Households | 26 (0.6%) | 0 (0.0%) |
| Total | 2,686 (59.4%) | 1,834 (40.6%) |
Female Fertility in La Riviera
Fertility by Age in La Riviera
Average fertility rate in La Riviera is 33.0 births per 1,000 women. Women in the age bracket of 20 to 34 years have the highest fertility rate with 58.0 births per 1,000 women. Women in the age bracket of 20 to 34 years acount for 100.0% of all women with births.
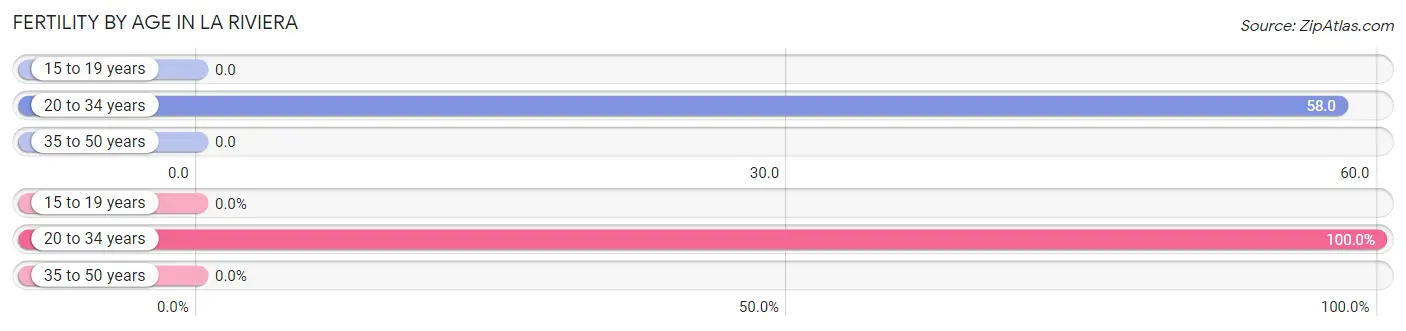
| Age Bracket | Women with Births | Births / 1,000 Women |
| 15 to 19 years | 0 (0.0%) | 0.0 |
| 20 to 34 years | 109 (100.0%) | 58.0 |
| 35 to 50 years | 0 (0.0%) | 0.0 |
| Total | 109 (100.0%) | 33.0 |
Fertility by Age by Marriage Status in La Riviera
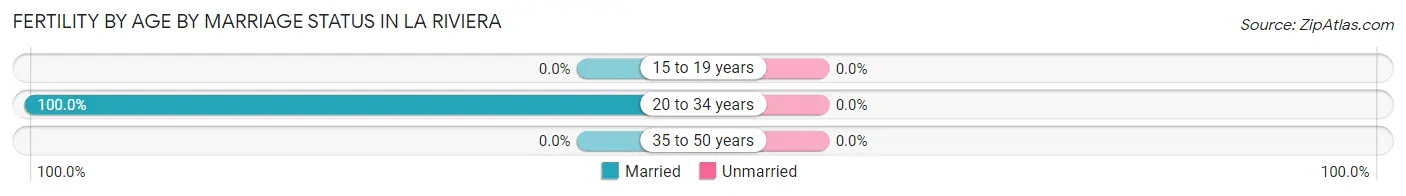
| Age Bracket | Married | Unmarried |
| 15 to 19 years | 0 (0.0%) | 0 (0.0%) |
| 20 to 34 years | 109 (100.0%) | 0 (0.0%) |
| 35 to 50 years | 0 (0.0%) | 0 (0.0%) |
| Total | 109 (100.0%) | 0 (0.0%) |
Fertility by Education in La Riviera
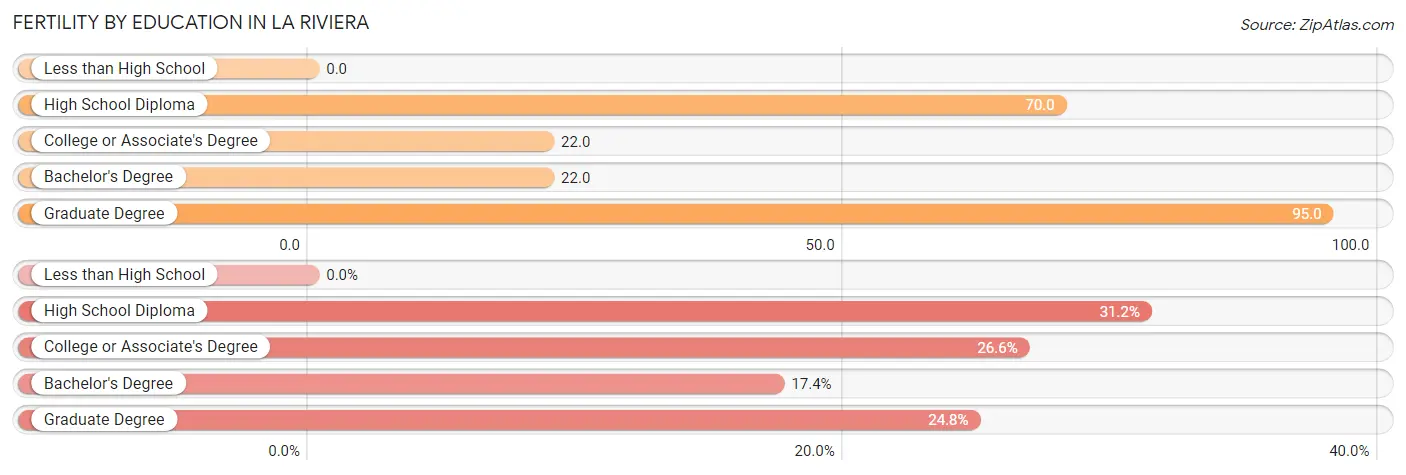
| Educational Attainment | Women with Births | Births / 1,000 Women |
| Less than High School | 0 (0.0%) | 0.0 |
| High School Diploma | 34 (31.2%) | 70.0 |
| College or Associate's Degree | 29 (26.6%) | 22.0 |
| Bachelor's Degree | 19 (17.4%) | 22.0 |
| Graduate Degree | 27 (24.8%) | 95.0 |
| Total | 109 (100.0%) | 33.0 |
Fertility by Education by Marriage Status in La Riviera
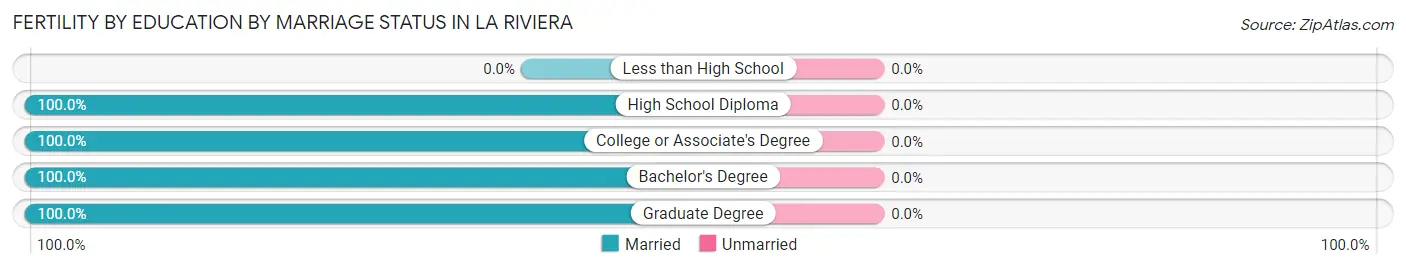
| Educational Attainment | Married | Unmarried |
| Less than High School | 0 (0.0%) | 0 (0.0%) |
| High School Diploma | 34 (100.0%) | 0 (0.0%) |
| College or Associate's Degree | 29 (100.0%) | 0 (0.0%) |
| Bachelor's Degree | 19 (100.0%) | 0 (0.0%) |
| Graduate Degree | 27 (100.0%) | 0 (0.0%) |
| Total | 109 (100.0%) | 0 (0.0%) |
Employment Characteristics in La Riviera
Employment by Class of Employer in La Riviera
Among the 6,374 employed individuals in La Riviera, private company employees (3,885 | 61.0%), state government employees (951 | 14.9%), and self-employed (not incorporated) (486 | 7.6%) make up the most common classes of employment.
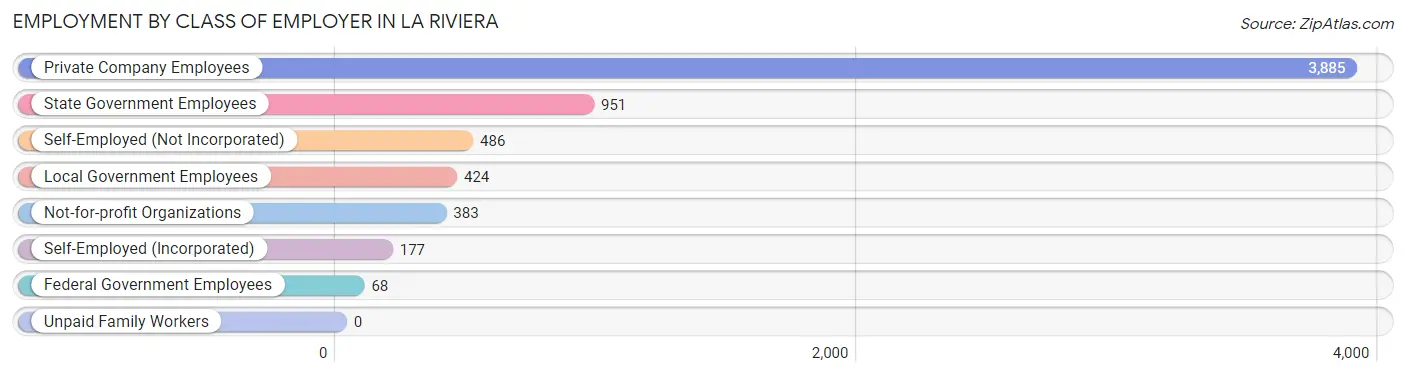
| Employer Class | # Employees | % Employees |
| Private Company Employees | 3,885 | 61.0% |
| Self-Employed (Incorporated) | 177 | 2.8% |
| Self-Employed (Not Incorporated) | 486 | 7.6% |
| Not-for-profit Organizations | 383 | 6.0% |
| Local Government Employees | 424 | 6.7% |
| State Government Employees | 951 | 14.9% |
| Federal Government Employees | 68 | 1.1% |
| Unpaid Family Workers | 0 | 0.0% |
| Total | 6,374 | 100.0% |
Employment Status by Age in La Riviera
According to the labor force statistics for La Riviera, out of the total population over 16 years of age (9,458), 70.2% or 6,640 individuals are in the labor force, with 3.3% or 219 of them unemployed. The age group with the highest labor force participation rate is 35 to 44 years, with 90.5% or 1,481 individuals in the labor force. Within the labor force, the 65 to 74 years age range has the highest percentage of unemployed individuals, with 6.8% or 9 of them being unemployed.
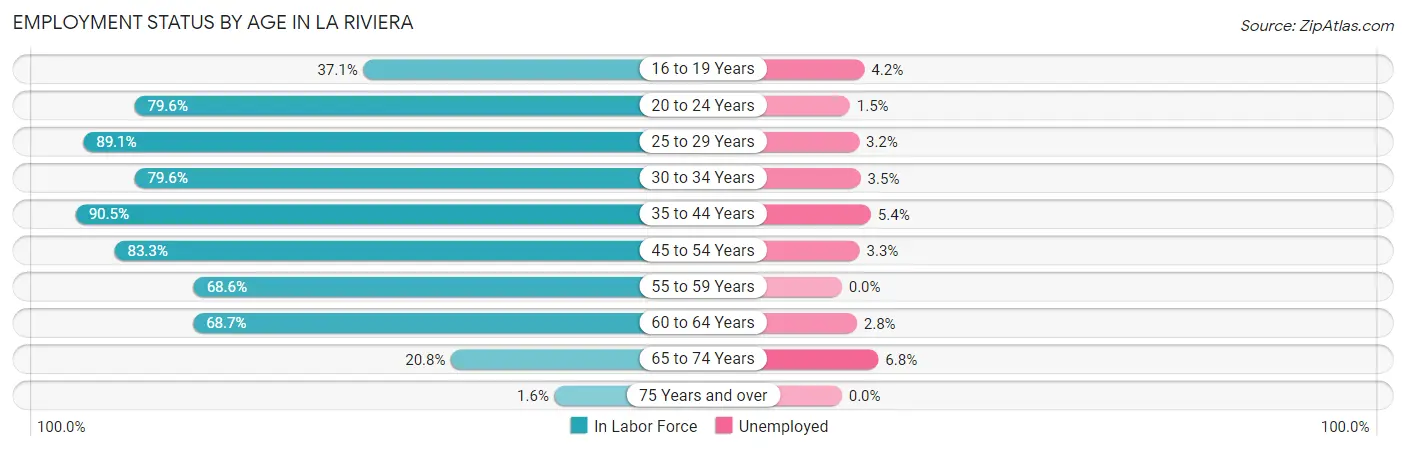
| Age Bracket | In Labor Force | Unemployed |
| 16 to 19 Years | 118 (37.1%) | 5 (4.2%) |
| 20 to 24 Years | 877 (79.6%) | 13 (1.5%) |
| 25 to 29 Years | 1,412 (89.1%) | 45 (3.2%) |
| 30 to 34 Years | 712 (79.6%) | 25 (3.5%) |
| 35 to 44 Years | 1,481 (90.5%) | 80 (5.4%) |
| 45 to 54 Years | 1,106 (83.3%) | 36 (3.3%) |
| 55 to 59 Years | 501 (68.6%) | 0 (0.0%) |
| 60 to 64 Years | 283 (68.7%) | 8 (2.8%) |
| 65 to 74 Years | 133 (20.8%) | 9 (6.8%) |
| 75 Years and over | 13 (1.6%) | 0 (0.0%) |
| Total | 6,640 (70.2%) | 219 (3.3%) |
Employment Status by Educational Attainment in La Riviera
According to labor force statistics for La Riviera, 83.5% of individuals (5,500) out of the total population between 25 and 64 years of age (6,587) are in the labor force, with 3.5% or 193 of them being unemployed. The group with the highest labor force participation rate are those with the educational attainment of bachelor's degree or higher, with 93.3% or 2,237 individuals in the labor force. Within the labor force, individuals with less than high school education have the highest percentage of unemployment, with 8.9% or 22 of them being unemployed.
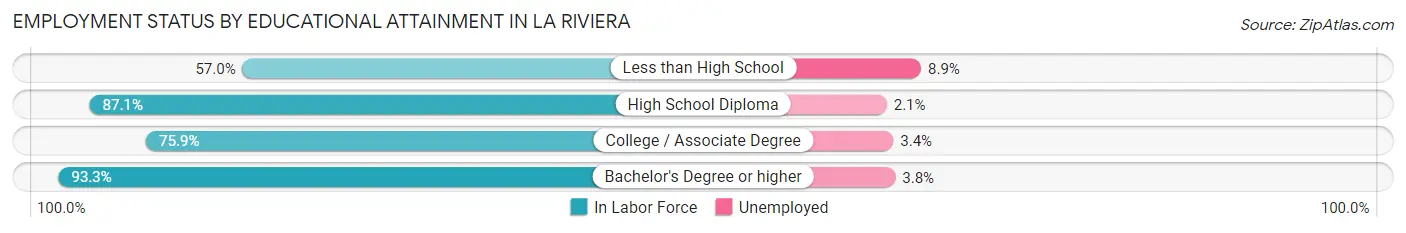
| Educational Attainment | In Labor Force | Unemployed |
| Less than High School | 247 (57.0%) | 39 (8.9%) |
| High School Diploma | 1,267 (87.1%) | 31 (2.1%) |
| College / Associate Degree | 1,746 (75.9%) | 78 (3.4%) |
| Bachelor's Degree or higher | 2,237 (93.3%) | 91 (3.8%) |
| Total | 5,500 (83.5%) | 231 (3.5%) |
Employment Occupations by Sex in La Riviera
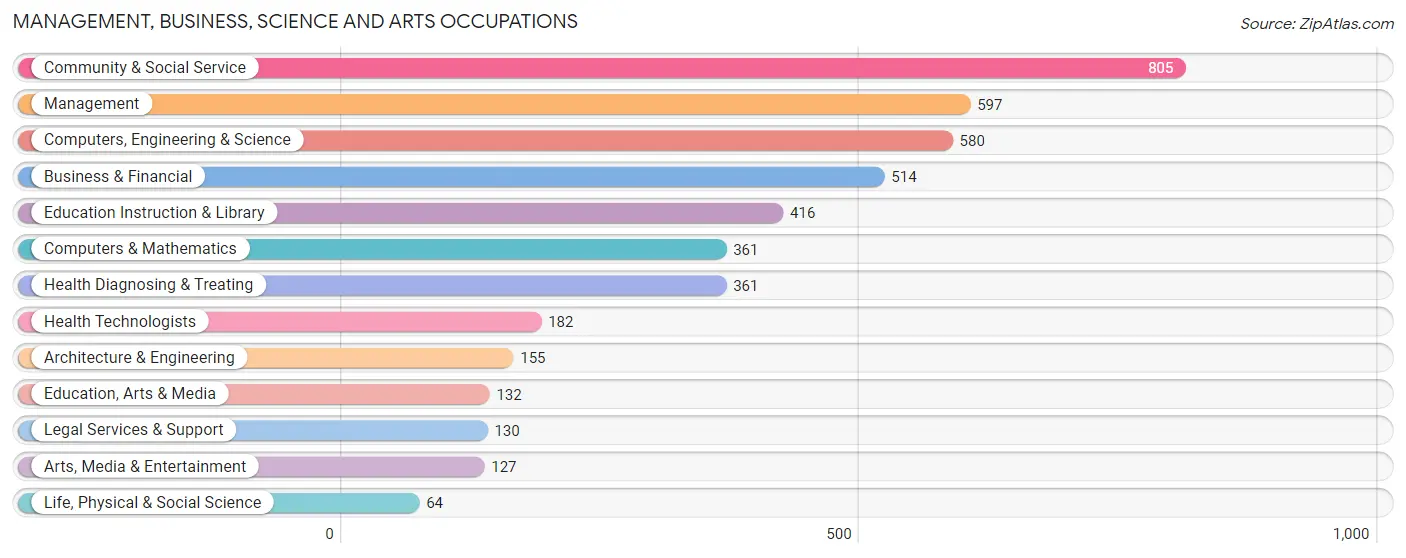
Management, Business, Science and Arts Occupations
The most common Management, Business, Science and Arts occupations in La Riviera are Community & Social Service (805 | 12.5%), Management (597 | 9.3%), Computers, Engineering & Science (580 | 9.0%), Business & Financial (514 | 8.0%), and Education Instruction & Library (416 | 6.5%).
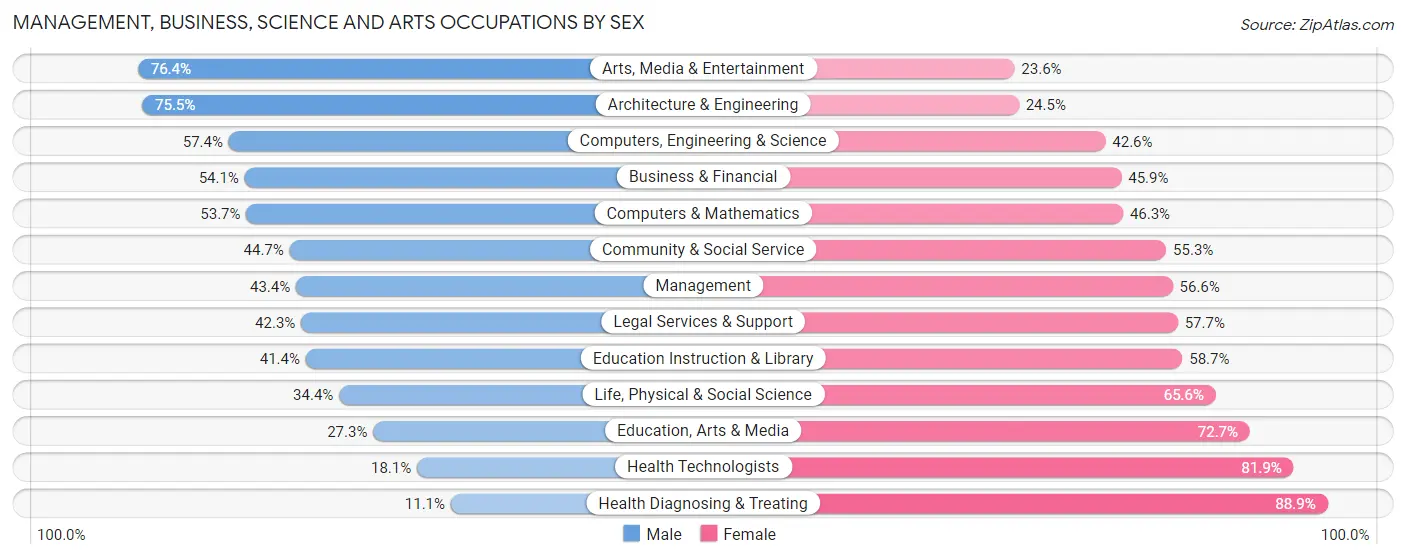
Management, Business, Science and Arts Occupations by Sex
Within the Management, Business, Science and Arts occupations in La Riviera, the most male-oriented occupations are Arts, Media & Entertainment (76.4%), Architecture & Engineering (75.5%), and Computers, Engineering & Science (57.4%), while the most female-oriented occupations are Health Diagnosing & Treating (88.9%), Health Technologists (81.9%), and Education, Arts & Media (72.7%).
| Occupation | Male | Female |
| Management | 259 (43.4%) | 338 (56.6%) |
| Business & Financial | 278 (54.1%) | 236 (45.9%) |
| Computers, Engineering & Science | 333 (57.4%) | 247 (42.6%) |
| Computers & Mathematics | 194 (53.7%) | 167 (46.3%) |
| Architecture & Engineering | 117 (75.5%) | 38 (24.5%) |
| Life, Physical & Social Science | 22 (34.4%) | 42 (65.6%) |
| Community & Social Service | 360 (44.7%) | 445 (55.3%) |
| Education, Arts & Media | 36 (27.3%) | 96 (72.7%) |
| Legal Services & Support | 55 (42.3%) | 75 (57.7%) |
| Education Instruction & Library | 172 (41.3%) | 244 (58.7%) |
| Arts, Media & Entertainment | 97 (76.4%) | 30 (23.6%) |
| Health Diagnosing & Treating | 40 (11.1%) | 321 (88.9%) |
| Health Technologists | 33 (18.1%) | 149 (81.9%) |
| Total (Category) | 1,270 (44.5%) | 1,587 (55.5%) |
| Total (Overall) | 3,389 (52.8%) | 3,028 (47.2%) |
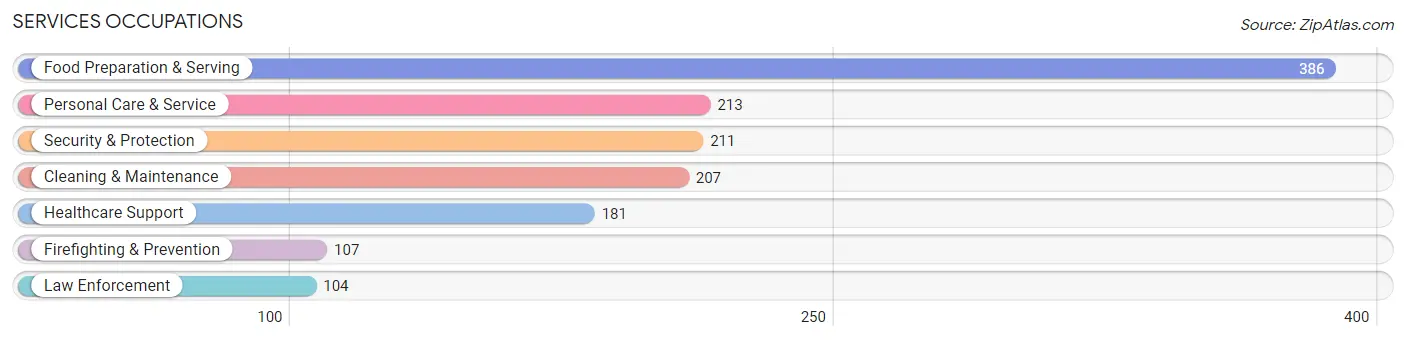
Services Occupations
The most common Services occupations in La Riviera are Food Preparation & Serving (386 | 6.0%), Personal Care & Service (213 | 3.3%), Security & Protection (211 | 3.3%), Cleaning & Maintenance (207 | 3.2%), and Healthcare Support (181 | 2.8%).
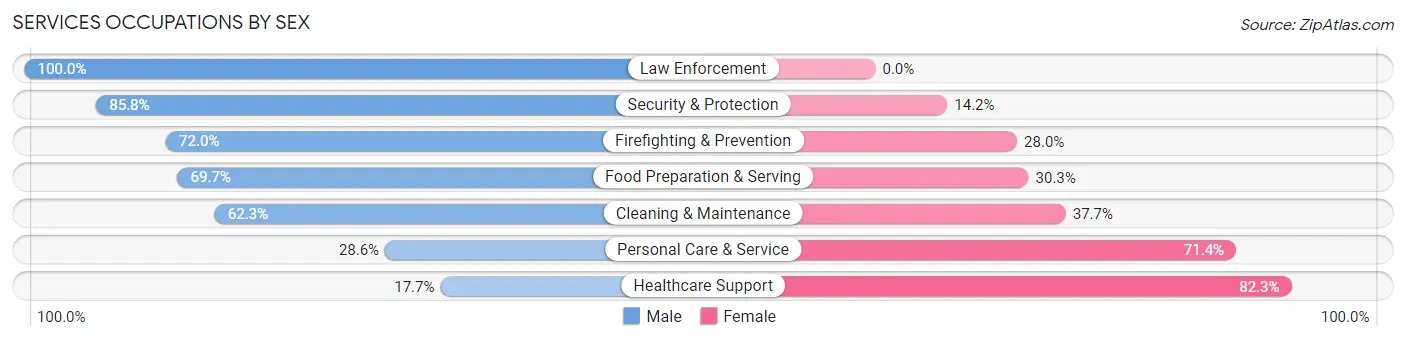
Services Occupations by Sex
Within the Services occupations in La Riviera, the most male-oriented occupations are Law Enforcement (100.0%), Security & Protection (85.8%), and Firefighting & Prevention (72.0%), while the most female-oriented occupations are Healthcare Support (82.3%), Personal Care & Service (71.4%), and Cleaning & Maintenance (37.7%).
| Occupation | Male | Female |
| Healthcare Support | 32 (17.7%) | 149 (82.3%) |
| Security & Protection | 181 (85.8%) | 30 (14.2%) |
| Firefighting & Prevention | 77 (72.0%) | 30 (28.0%) |
| Law Enforcement | 104 (100.0%) | 0 (0.0%) |
| Food Preparation & Serving | 269 (69.7%) | 117 (30.3%) |
| Cleaning & Maintenance | 129 (62.3%) | 78 (37.7%) |
| Personal Care & Service | 61 (28.6%) | 152 (71.4%) |
| Total (Category) | 672 (56.1%) | 526 (43.9%) |
| Total (Overall) | 3,389 (52.8%) | 3,028 (47.2%) |
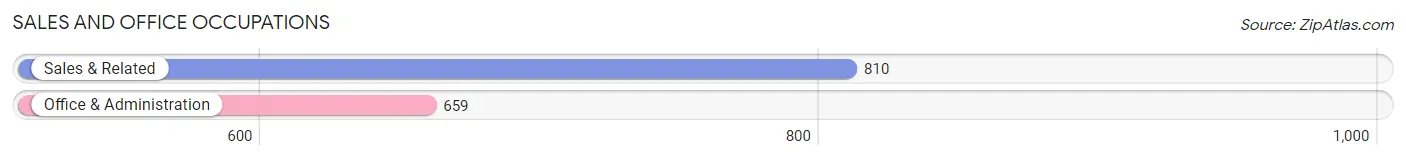
Sales and Office Occupations
The most common Sales and Office occupations in La Riviera are Sales & Related (810 | 12.6%), and Office & Administration (659 | 10.3%).
Sales and Office Occupations by Sex
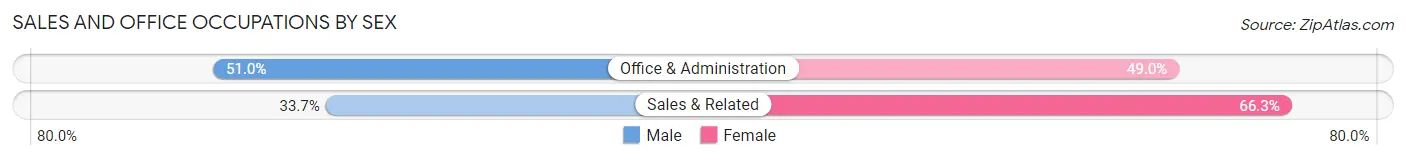
| Occupation | Male | Female |
| Sales & Related | 273 (33.7%) | 537 (66.3%) |
| Office & Administration | 336 (51.0%) | 323 (49.0%) |
| Total (Category) | 609 (41.5%) | 860 (58.5%) |
| Total (Overall) | 3,389 (52.8%) | 3,028 (47.2%) |
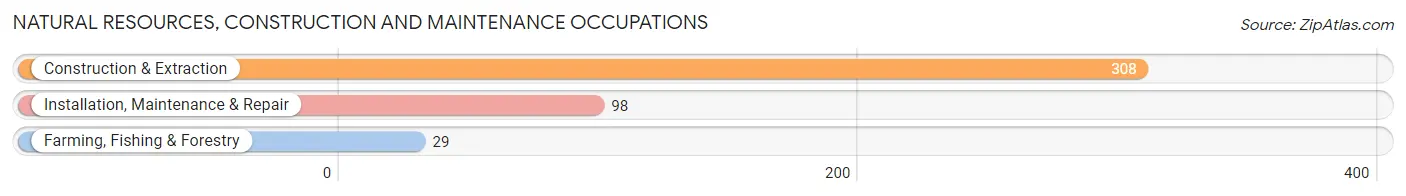
Natural Resources, Construction and Maintenance Occupations
The most common Natural Resources, Construction and Maintenance occupations in La Riviera are Construction & Extraction (308 | 4.8%), Installation, Maintenance & Repair (98 | 1.5%), and Farming, Fishing & Forestry (29 | 0.4%).
Natural Resources, Construction and Maintenance Occupations by Sex
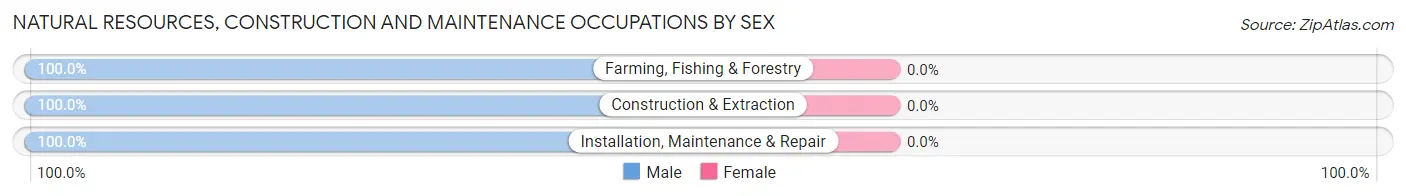
| Occupation | Male | Female |
| Farming, Fishing & Forestry | 29 (100.0%) | 0 (0.0%) |
| Construction & Extraction | 308 (100.0%) | 0 (0.0%) |
| Installation, Maintenance & Repair | 98 (100.0%) | 0 (0.0%) |
| Total (Category) | 435 (100.0%) | 0 (0.0%) |
| Total (Overall) | 3,389 (52.8%) | 3,028 (47.2%) |
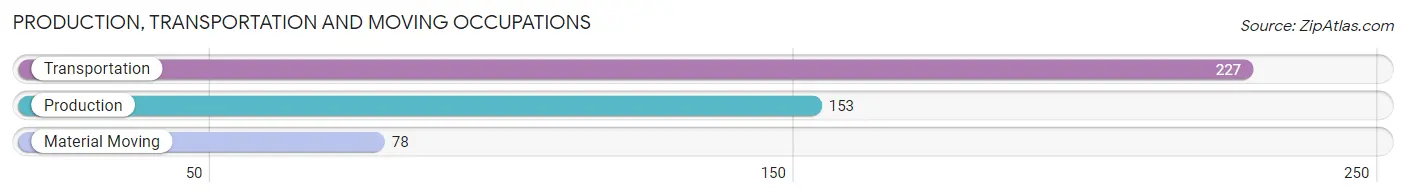
Production, Transportation and Moving Occupations
The most common Production, Transportation and Moving occupations in La Riviera are Transportation (227 | 3.5%), Production (153 | 2.4%), and Material Moving (78 | 1.2%).
Production, Transportation and Moving Occupations by Sex
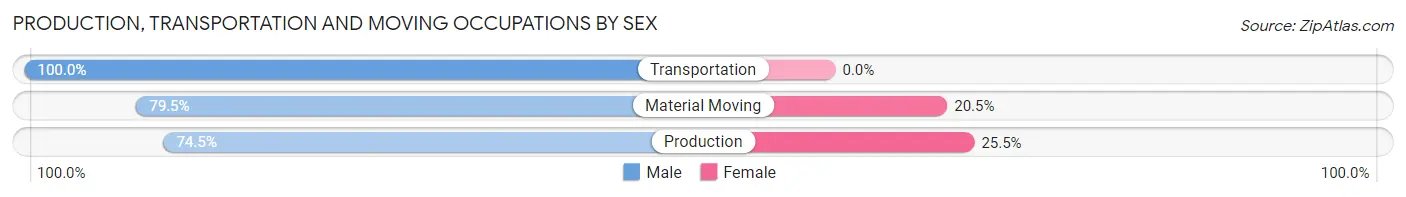
| Occupation | Male | Female |
| Production | 114 (74.5%) | 39 (25.5%) |
| Transportation | 227 (100.0%) | 0 (0.0%) |
| Material Moving | 62 (79.5%) | 16 (20.5%) |
| Total (Category) | 403 (88.0%) | 55 (12.0%) |
| Total (Overall) | 3,389 (52.8%) | 3,028 (47.2%) |
Employment Industries by Sex in La Riviera
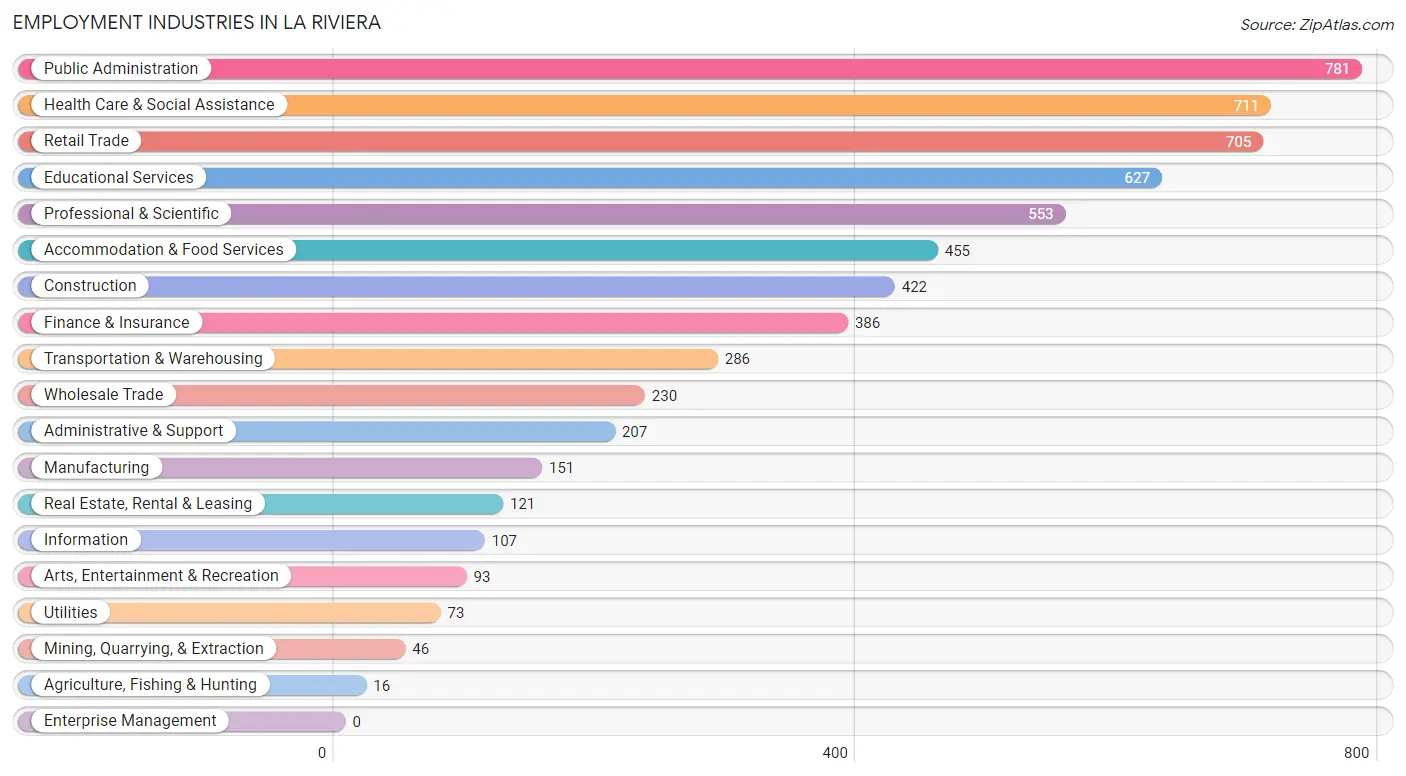
Employment Industries in La Riviera
The major employment industries in La Riviera include Public Administration (781 | 12.2%), Health Care & Social Assistance (711 | 11.1%), Retail Trade (705 | 11.0%), Educational Services (627 | 9.8%), and Professional & Scientific (553 | 8.6%).
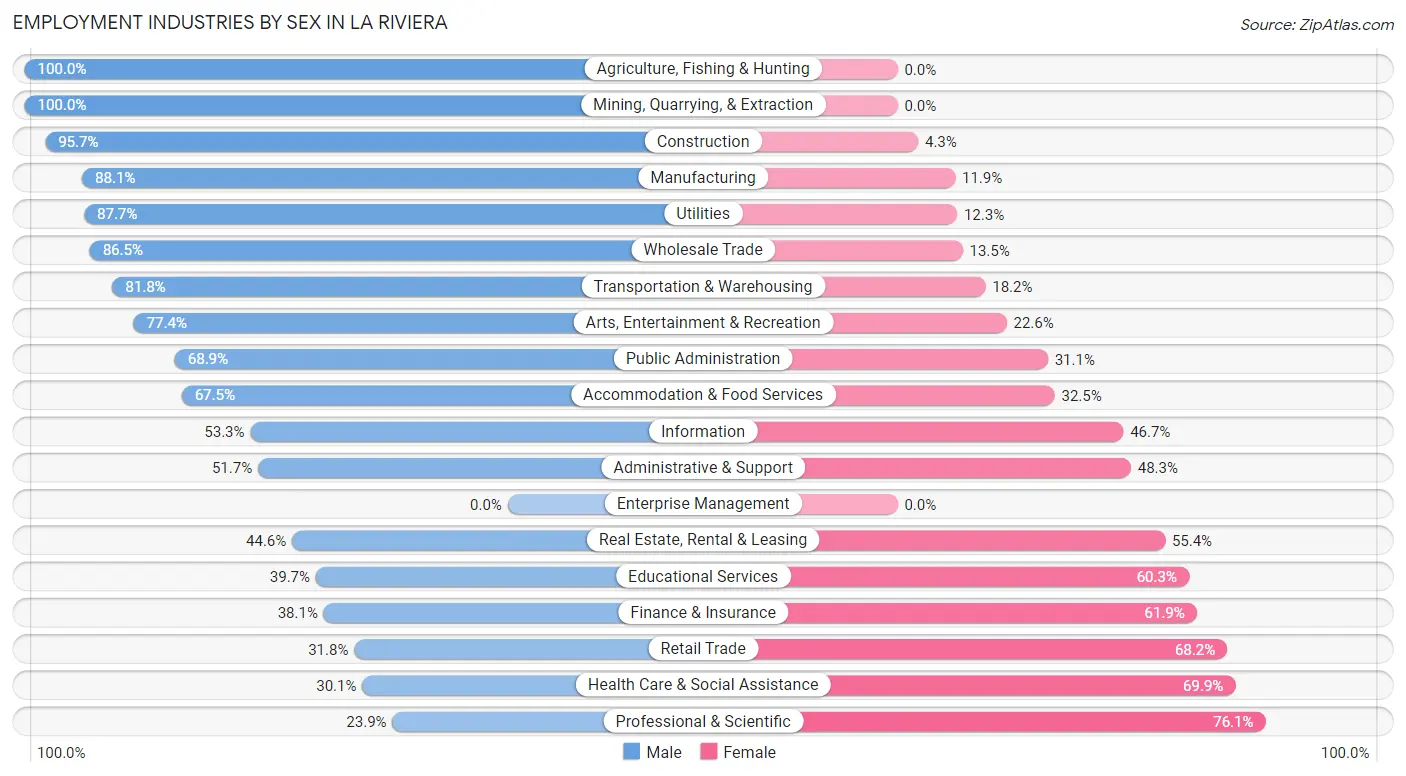
Employment Industries by Sex in La Riviera
The La Riviera industries that see more men than women are Agriculture, Fishing & Hunting (100.0%), Mining, Quarrying, & Extraction (100.0%), and Construction (95.7%), whereas the industries that tend to have a higher number of women are Professional & Scientific (76.1%), Health Care & Social Assistance (69.9%), and Retail Trade (68.2%).
| Industry | Male | Female |
| Agriculture, Fishing & Hunting | 16 (100.0%) | 0 (0.0%) |
| Mining, Quarrying, & Extraction | 46 (100.0%) | 0 (0.0%) |
| Construction | 404 (95.7%) | 18 (4.3%) |
| Manufacturing | 133 (88.1%) | 18 (11.9%) |
| Wholesale Trade | 199 (86.5%) | 31 (13.5%) |
| Retail Trade | 224 (31.8%) | 481 (68.2%) |
| Transportation & Warehousing | 234 (81.8%) | 52 (18.2%) |
| Utilities | 64 (87.7%) | 9 (12.3%) |
| Information | 57 (53.3%) | 50 (46.7%) |
| Finance & Insurance | 147 (38.1%) | 239 (61.9%) |
| Real Estate, Rental & Leasing | 54 (44.6%) | 67 (55.4%) |
| Professional & Scientific | 132 (23.9%) | 421 (76.1%) |
| Enterprise Management | 0 (0.0%) | 0 (0.0%) |
| Administrative & Support | 107 (51.7%) | 100 (48.3%) |
| Educational Services | 249 (39.7%) | 378 (60.3%) |
| Health Care & Social Assistance | 214 (30.1%) | 497 (69.9%) |
| Arts, Entertainment & Recreation | 72 (77.4%) | 21 (22.6%) |
| Accommodation & Food Services | 307 (67.5%) | 148 (32.5%) |
| Public Administration | 538 (68.9%) | 243 (31.1%) |
| Total | 3,389 (52.8%) | 3,028 (47.2%) |
Education in La Riviera
School Enrollment in La Riviera
The most common levels of schooling among the 3,314 students in La Riviera are college / undergraduate (1,130 | 34.1%), middle school (685 | 20.7%), and elementary school (584 | 17.6%).
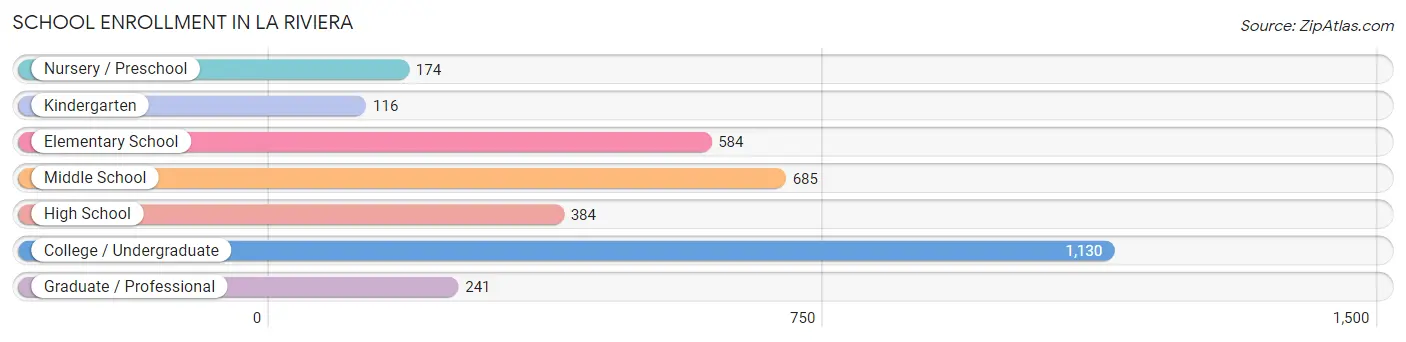
| School Level | # Students | % Students |
| Nursery / Preschool | 174 | 5.2% |
| Kindergarten | 116 | 3.5% |
| Elementary School | 584 | 17.6% |
| Middle School | 685 | 20.7% |
| High School | 384 | 11.6% |
| College / Undergraduate | 1,130 | 34.1% |
| Graduate / Professional | 241 | 7.3% |
| Total | 3,314 | 100.0% |
School Enrollment by Age by Funding Source in La Riviera
Out of a total of 3,314 students who are enrolled in schools in La Riviera, 441 (13.3%) attend a private institution, while the remaining 2,873 (86.7%) are enrolled in public schools. The age group of 3 to 4 year olds has the highest likelihood of being enrolled in private schools, with 129 (85.4% in the age bracket) enrolled. Conversely, the age group of 18 to 19 year olds has the lowest likelihood of being enrolled in a private school, with 69 (100.0% in the age bracket) attending a public institution.
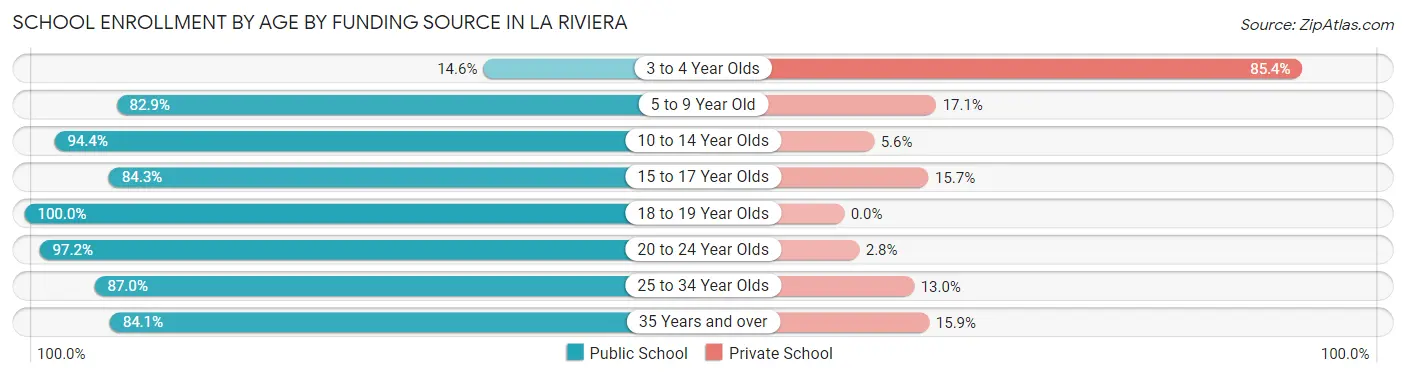
| Age Bracket | Public School | Private School |
| 3 to 4 Year Olds | 22 (14.6%) | 129 (85.4%) |
| 5 to 9 Year Old | 580 (82.9%) | 120 (17.1%) |
| 10 to 14 Year Olds | 709 (94.4%) | 42 (5.6%) |
| 15 to 17 Year Olds | 295 (84.3%) | 55 (15.7%) |
| 18 to 19 Year Olds | 69 (100.0%) | 0 (0.0%) |
| 20 to 24 Year Olds | 726 (97.2%) | 21 (2.8%) |
| 25 to 34 Year Olds | 420 (87.0%) | 63 (13.0%) |
| 35 Years and over | 53 (84.1%) | 10 (15.9%) |
| Total | 2,873 (86.7%) | 441 (13.3%) |
Educational Attainment by Field of Study in La Riviera
Business (717 | 24.5%), science & technology (272 | 9.3%), social sciences (253 | 8.6%), liberal arts & history (236 | 8.1%), and computers & mathematics (218 | 7.4%) are the most common fields of study among 2,926 individuals in La Riviera who have obtained a bachelor's degree or higher.
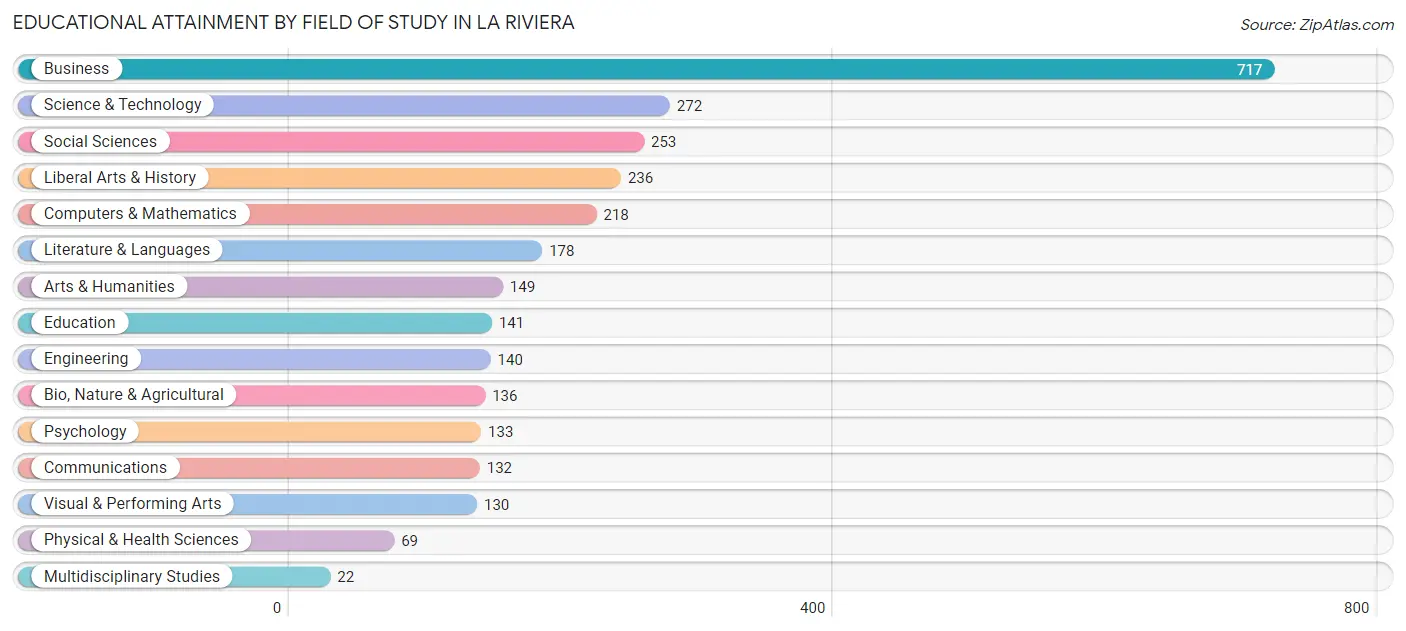
| Field of Study | # Graduates | % Graduates |
| Computers & Mathematics | 218 | 7.4% |
| Bio, Nature & Agricultural | 136 | 4.6% |
| Physical & Health Sciences | 69 | 2.4% |
| Psychology | 133 | 4.5% |
| Social Sciences | 253 | 8.6% |
| Engineering | 140 | 4.8% |
| Multidisciplinary Studies | 22 | 0.7% |
| Science & Technology | 272 | 9.3% |
| Business | 717 | 24.5% |
| Education | 141 | 4.8% |
| Literature & Languages | 178 | 6.1% |
| Liberal Arts & History | 236 | 8.1% |
| Visual & Performing Arts | 130 | 4.4% |
| Communications | 132 | 4.5% |
| Arts & Humanities | 149 | 5.1% |
| Total | 2,926 | 100.0% |
Transportation & Commute in La Riviera
Vehicle Availability by Sex in La Riviera
The most prevalent vehicle ownership categories in La Riviera are males with 2 vehicles (1,657, accounting for 49.1%) and females with 2 vehicles (1,416, making up 55.2%).
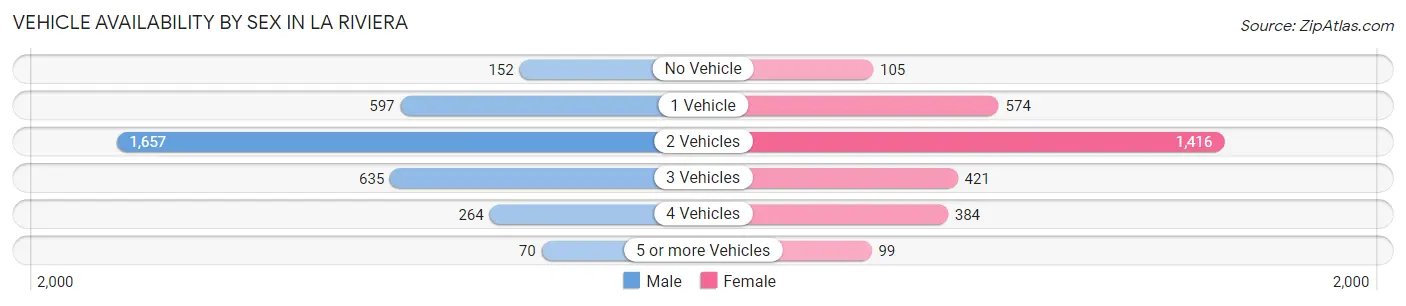
| Vehicles Available | Male | Female |
| No Vehicle | 152 (4.5%) | 105 (3.5%) |
| 1 Vehicle | 597 (17.7%) | 574 (19.1%) |
| 2 Vehicles | 1,657 (49.1%) | 1,416 (47.2%) |
| 3 Vehicles | 635 (18.8%) | 421 (14.0%) |
| 4 Vehicles | 264 (7.8%) | 384 (12.8%) |
| 5 or more Vehicles | 70 (2.1%) | 99 (3.3%) |
| Total | 3,375 (100.0%) | 2,999 (100.0%) |
Commute Time in La Riviera
The most frequently occuring commute durations in La Riviera are 20 to 24 minutes (1,256 commuters, 23.7%), 15 to 19 minutes (1,170 commuters, 22.1%), and 30 to 34 minutes (726 commuters, 13.7%).
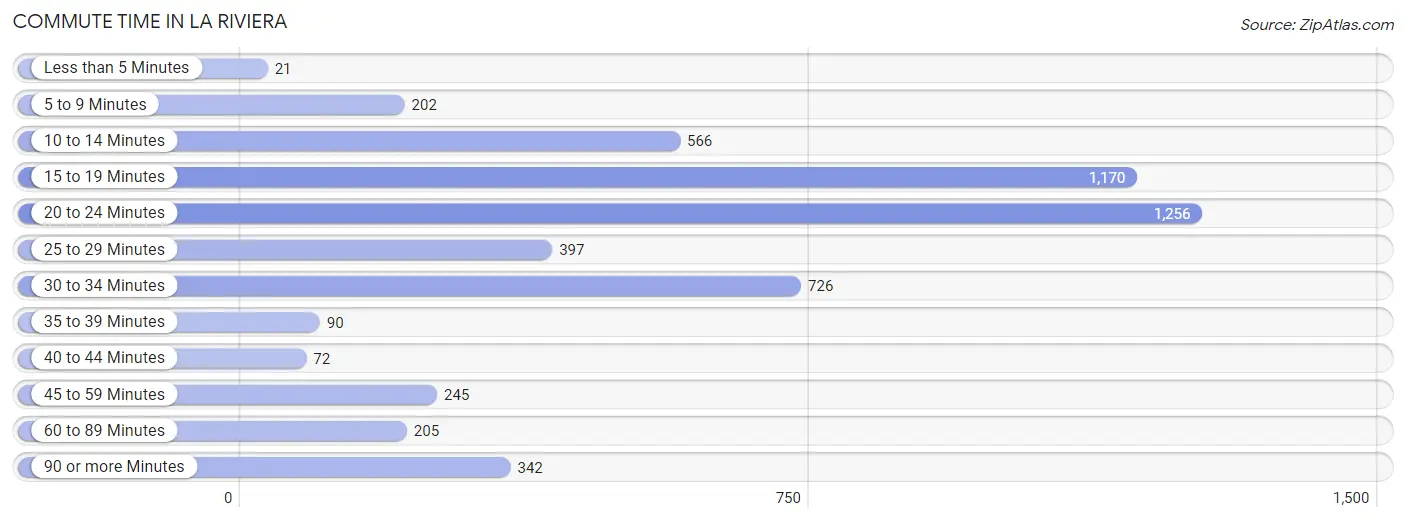
| Commute Time | # Commuters | % Commuters |
| Less than 5 Minutes | 21 | 0.4% |
| 5 to 9 Minutes | 202 | 3.8% |
| 10 to 14 Minutes | 566 | 10.7% |
| 15 to 19 Minutes | 1,170 | 22.1% |
| 20 to 24 Minutes | 1,256 | 23.7% |
| 25 to 29 Minutes | 397 | 7.5% |
| 30 to 34 Minutes | 726 | 13.7% |
| 35 to 39 Minutes | 90 | 1.7% |
| 40 to 44 Minutes | 72 | 1.4% |
| 45 to 59 Minutes | 245 | 4.6% |
| 60 to 89 Minutes | 205 | 3.9% |
| 90 or more Minutes | 342 | 6.5% |
Commute Time by Sex in La Riviera
The most common commute times in La Riviera are 20 to 24 minutes (770 commuters, 27.3%) for males and 15 to 19 minutes (683 commuters, 27.6%) for females.
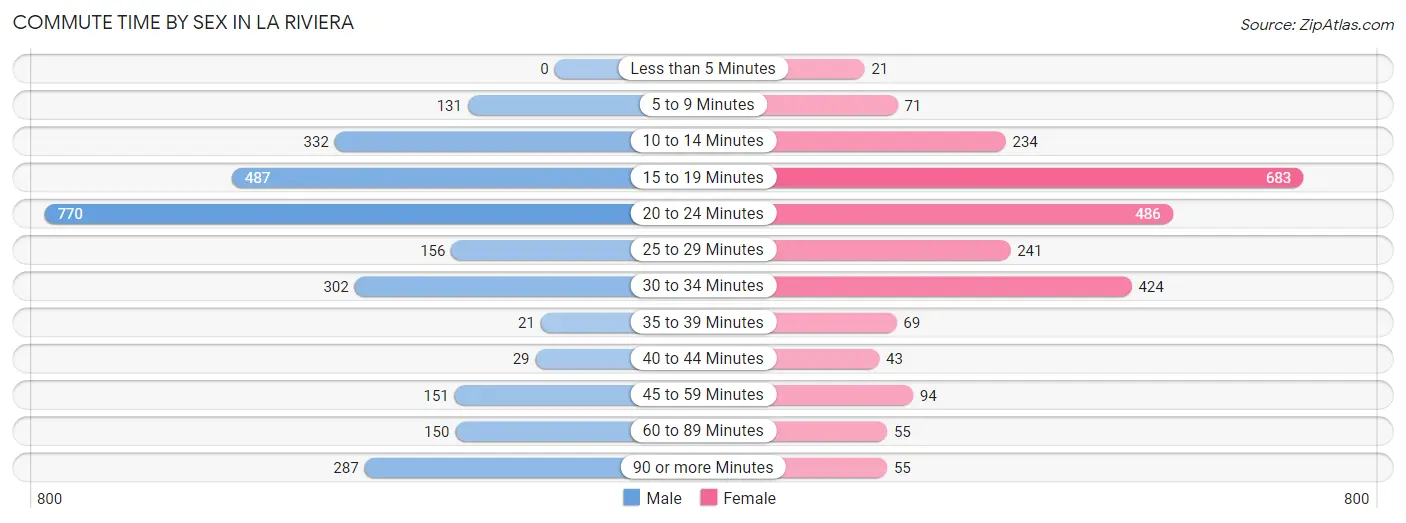
| Commute Time | Male | Female |
| Less than 5 Minutes | 0 (0.0%) | 21 (0.9%) |
| 5 to 9 Minutes | 131 (4.6%) | 71 (2.9%) |
| 10 to 14 Minutes | 332 (11.8%) | 234 (9.5%) |
| 15 to 19 Minutes | 487 (17.3%) | 683 (27.6%) |
| 20 to 24 Minutes | 770 (27.3%) | 486 (19.6%) |
| 25 to 29 Minutes | 156 (5.5%) | 241 (9.7%) |
| 30 to 34 Minutes | 302 (10.7%) | 424 (17.1%) |
| 35 to 39 Minutes | 21 (0.7%) | 69 (2.8%) |
| 40 to 44 Minutes | 29 (1.0%) | 43 (1.7%) |
| 45 to 59 Minutes | 151 (5.4%) | 94 (3.8%) |
| 60 to 89 Minutes | 150 (5.3%) | 55 (2.2%) |
| 90 or more Minutes | 287 (10.2%) | 55 (2.2%) |
Time of Departure to Work by Sex in La Riviera
The most frequent times of departure to work in La Riviera are 6:30 AM to 6:59 AM (461, 16.4%) for males and 7:00 AM to 7:29 AM (369, 14.9%) for females.
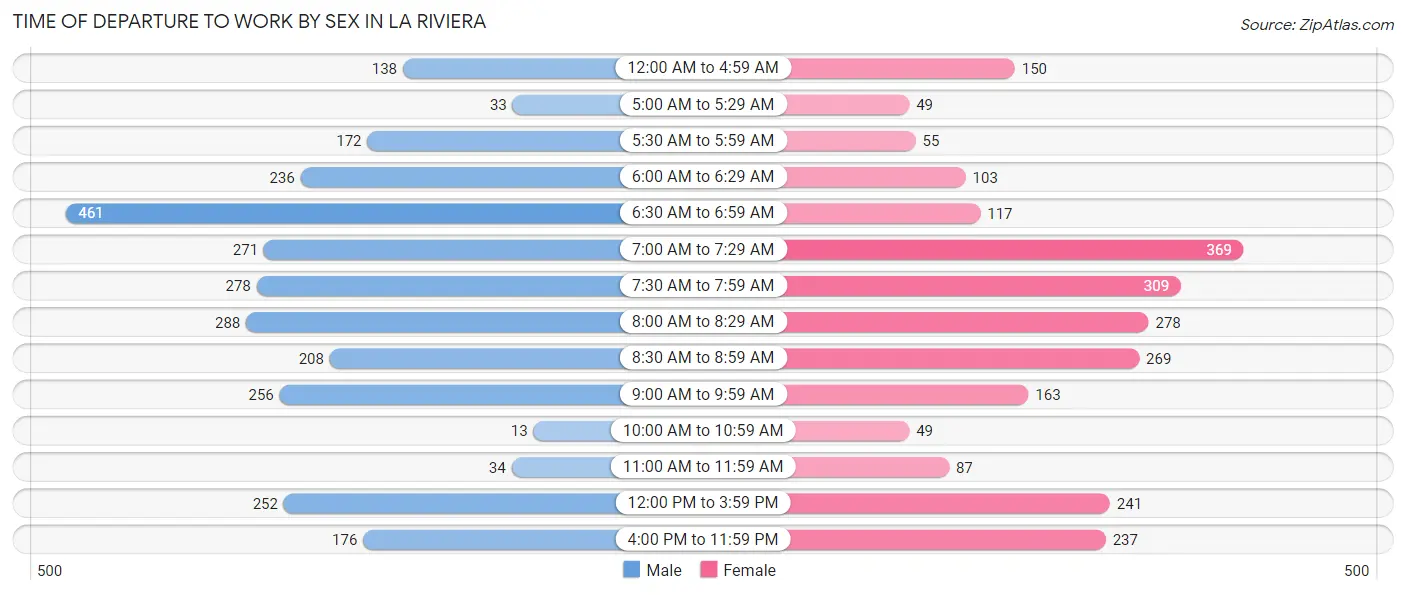
| Time of Departure | Male | Female |
| 12:00 AM to 4:59 AM | 138 (4.9%) | 150 (6.1%) |
| 5:00 AM to 5:29 AM | 33 (1.2%) | 49 (2.0%) |
| 5:30 AM to 5:59 AM | 172 (6.1%) | 55 (2.2%) |
| 6:00 AM to 6:29 AM | 236 (8.4%) | 103 (4.2%) |
| 6:30 AM to 6:59 AM | 461 (16.4%) | 117 (4.7%) |
| 7:00 AM to 7:29 AM | 271 (9.6%) | 369 (14.9%) |
| 7:30 AM to 7:59 AM | 278 (9.9%) | 309 (12.5%) |
| 8:00 AM to 8:29 AM | 288 (10.2%) | 278 (11.2%) |
| 8:30 AM to 8:59 AM | 208 (7.4%) | 269 (10.9%) |
| 9:00 AM to 9:59 AM | 256 (9.1%) | 163 (6.6%) |
| 10:00 AM to 10:59 AM | 13 (0.5%) | 49 (2.0%) |
| 11:00 AM to 11:59 AM | 34 (1.2%) | 87 (3.5%) |
| 12:00 PM to 3:59 PM | 252 (8.9%) | 241 (9.7%) |
| 4:00 PM to 11:59 PM | 176 (6.2%) | 237 (9.6%) |
| Total | 2,816 (100.0%) | 2,476 (100.0%) |
Housing Occupancy in La Riviera
Occupancy by Ownership in La Riviera
Of the total 4,520 dwellings in La Riviera, owner-occupied units account for 2,685 (59.4%), while renter-occupied units make up 1,835 (40.6%).
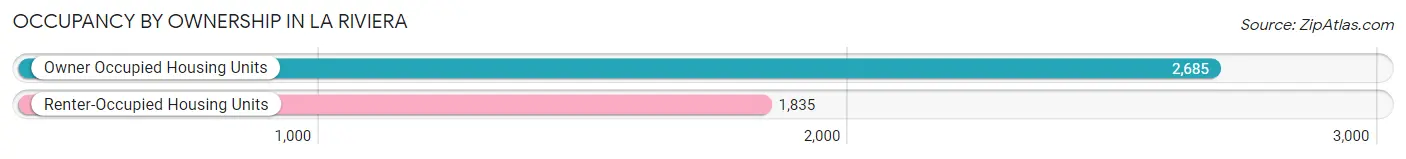
| Occupancy | # Housing Units | % Housing Units |
| Owner Occupied Housing Units | 2,685 | 59.4% |
| Renter-Occupied Housing Units | 1,835 | 40.6% |
| Total Occupied Housing Units | 4,520 | 100.0% |
Occupancy by Household Size in La Riviera
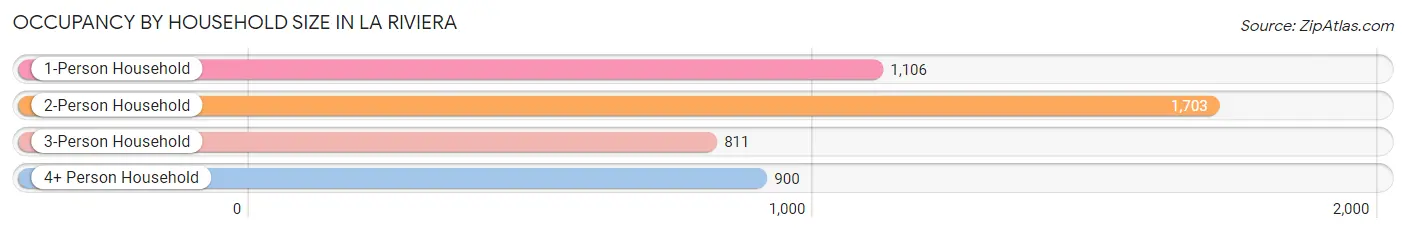
| Household Size | # Housing Units | % Housing Units |
| 1-Person Household | 1,106 | 24.5% |
| 2-Person Household | 1,703 | 37.7% |
| 3-Person Household | 811 | 17.9% |
| 4+ Person Household | 900 | 19.9% |
| Total Housing Units | 4,520 | 100.0% |
Occupancy by Ownership by Household Size in La Riviera
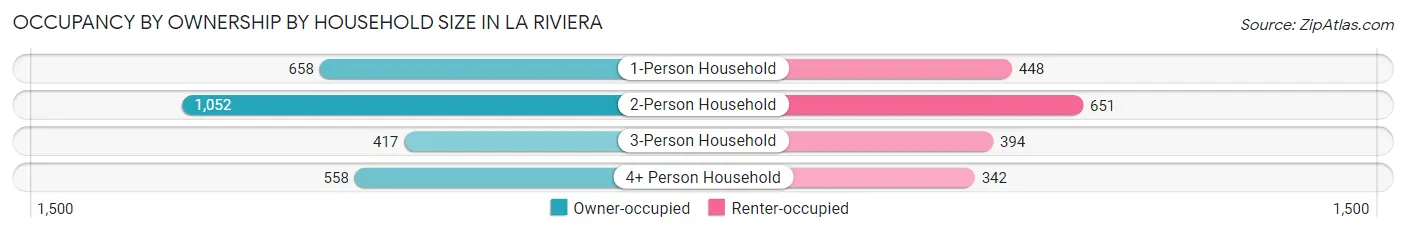
| Household Size | Owner-occupied | Renter-occupied |
| 1-Person Household | 658 (59.5%) | 448 (40.5%) |
| 2-Person Household | 1,052 (61.8%) | 651 (38.2%) |
| 3-Person Household | 417 (51.4%) | 394 (48.6%) |
| 4+ Person Household | 558 (62.0%) | 342 (38.0%) |
| Total Housing Units | 2,685 (59.4%) | 1,835 (40.6%) |
Occupancy by Educational Attainment in La Riviera
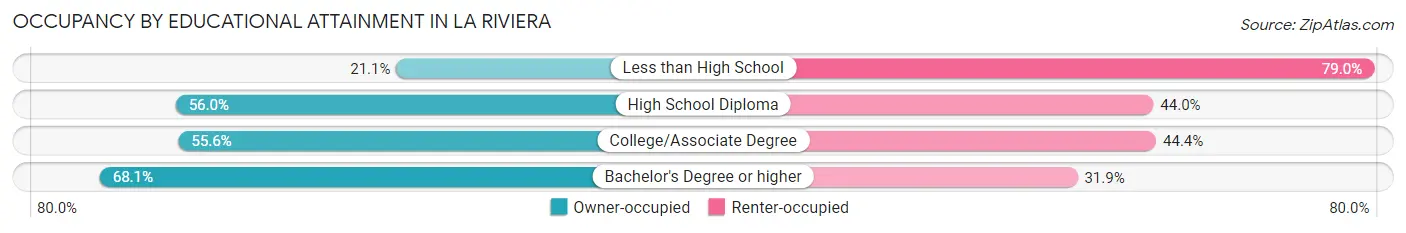
| Household Size | Owner-occupied | Renter-occupied |
| Less than High School | 36 (21.0%) | 135 (78.9%) |
| High School Diploma | 474 (56.0%) | 372 (44.0%) |
| College/Associate Degree | 934 (55.6%) | 746 (44.4%) |
| Bachelor's Degree or higher | 1,241 (68.1%) | 582 (31.9%) |
Occupancy by Age of Householder in La Riviera
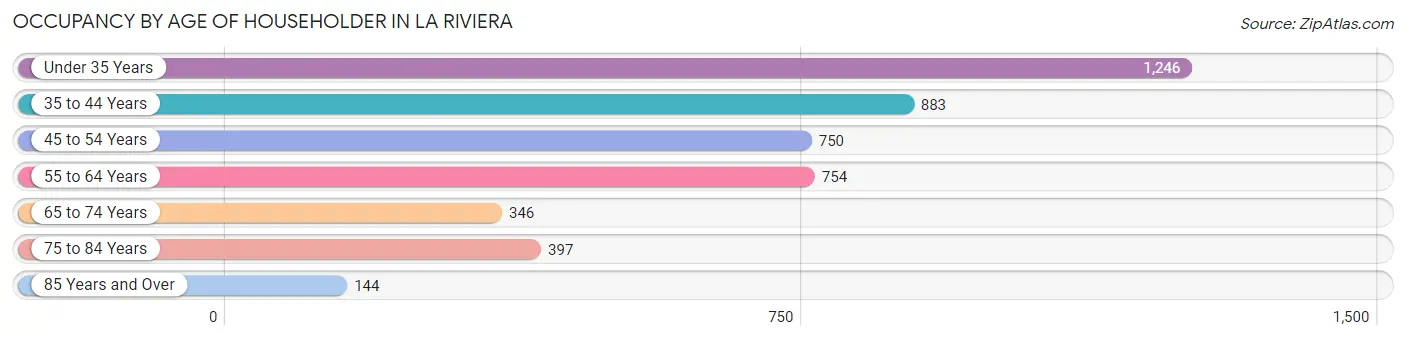
| Age Bracket | # Households | % Households |
| Under 35 Years | 1,246 | 27.6% |
| 35 to 44 Years | 883 | 19.5% |
| 45 to 54 Years | 750 | 16.6% |
| 55 to 64 Years | 754 | 16.7% |
| 65 to 74 Years | 346 | 7.6% |
| 75 to 84 Years | 397 | 8.8% |
| 85 Years and Over | 144 | 3.2% |
| Total | 4,520 | 100.0% |
Housing Finances in La Riviera
Median Income by Occupancy in La Riviera
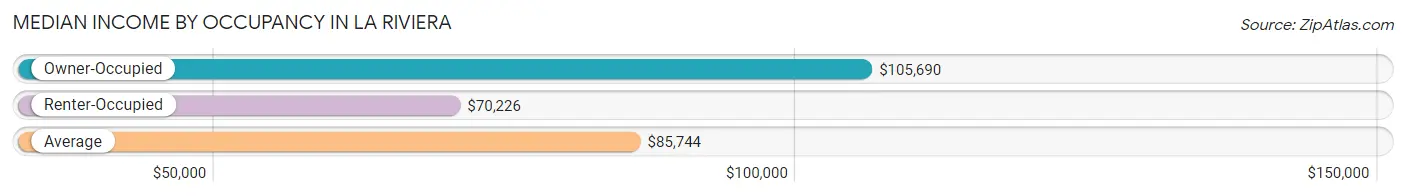
| Occupancy Type | # Households | Median Income |
| Owner-Occupied | 2,685 (59.4%) | $105,690 |
| Renter-Occupied | 1,835 (40.6%) | $70,226 |
| Average | 4,520 (100.0%) | $85,744 |
Occupancy by Householder Income Bracket in La Riviera
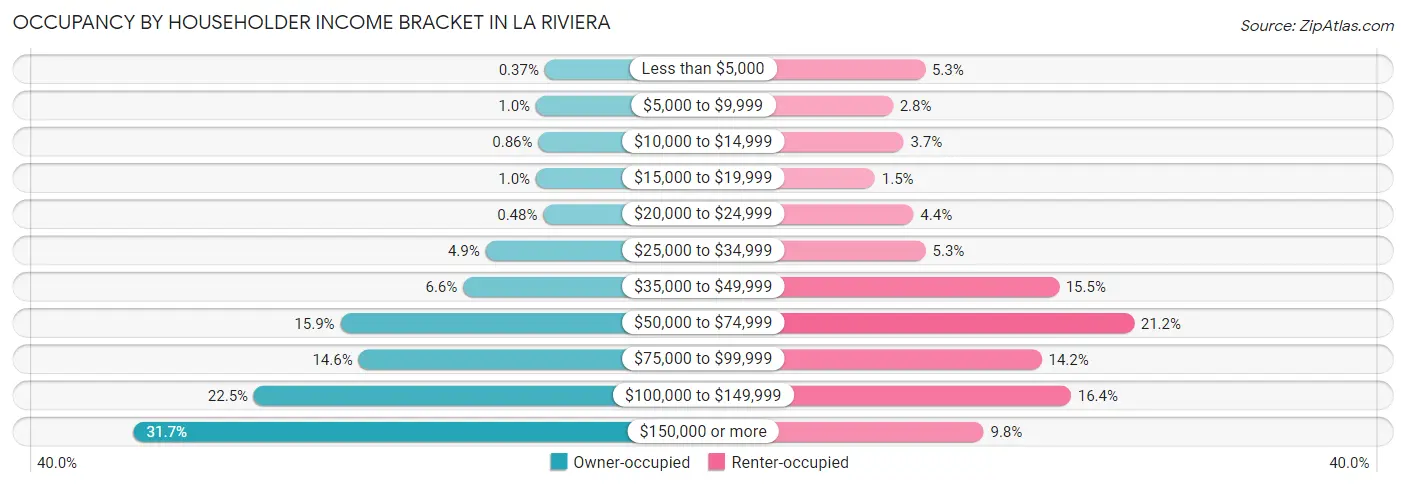
| Income Bracket | Owner-occupied | Renter-occupied |
| Less than $5,000 | 10 (0.4%) | 97 (5.3%) |
| $5,000 to $9,999 | 28 (1.0%) | 52 (2.8%) |
| $10,000 to $14,999 | 23 (0.9%) | 67 (3.6%) |
| $15,000 to $19,999 | 28 (1.0%) | 27 (1.5%) |
| $20,000 to $24,999 | 13 (0.5%) | 81 (4.4%) |
| $25,000 to $34,999 | 131 (4.9%) | 98 (5.3%) |
| $35,000 to $49,999 | 177 (6.6%) | 284 (15.5%) |
| $50,000 to $74,999 | 428 (15.9%) | 389 (21.2%) |
| $75,000 to $99,999 | 391 (14.6%) | 260 (14.2%) |
| $100,000 to $149,999 | 605 (22.5%) | 301 (16.4%) |
| $150,000 or more | 851 (31.7%) | 179 (9.8%) |
| Total | 2,685 (100.0%) | 1,835 (100.0%) |
Monthly Housing Cost Tiers in La Riviera
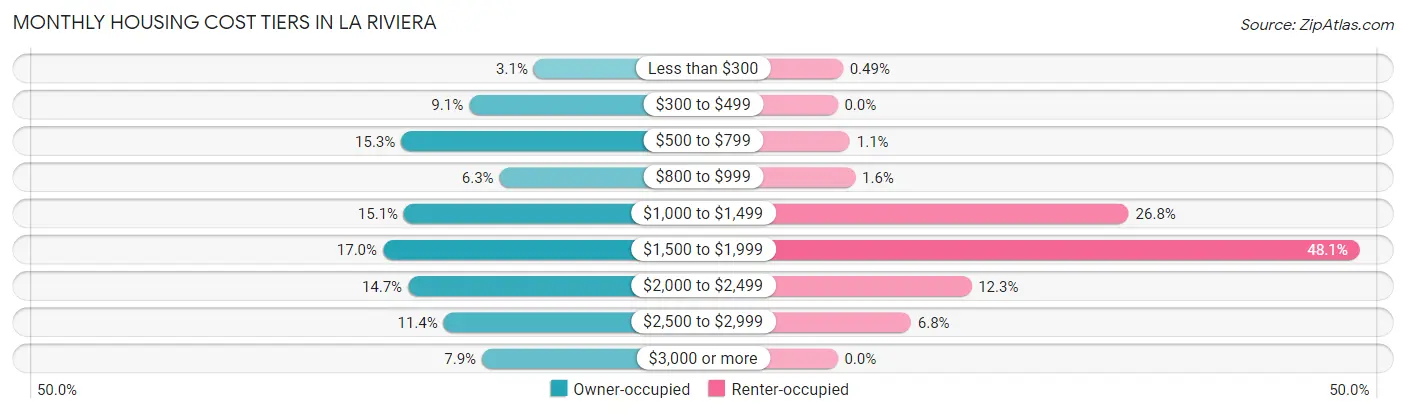
| Monthly Cost | Owner-occupied | Renter-occupied |
| Less than $300 | 84 (3.1%) | 9 (0.5%) |
| $300 to $499 | 244 (9.1%) | 0 (0.0%) |
| $500 to $799 | 412 (15.3%) | 21 (1.1%) |
| $800 to $999 | 169 (6.3%) | 30 (1.6%) |
| $1,000 to $1,499 | 405 (15.1%) | 492 (26.8%) |
| $1,500 to $1,999 | 457 (17.0%) | 882 (48.1%) |
| $2,000 to $2,499 | 395 (14.7%) | 226 (12.3%) |
| $2,500 to $2,999 | 307 (11.4%) | 124 (6.8%) |
| $3,000 or more | 212 (7.9%) | 0 (0.0%) |
| Total | 2,685 (100.0%) | 1,835 (100.0%) |
Physical Housing Characteristics in La Riviera
Housing Structures in La Riviera
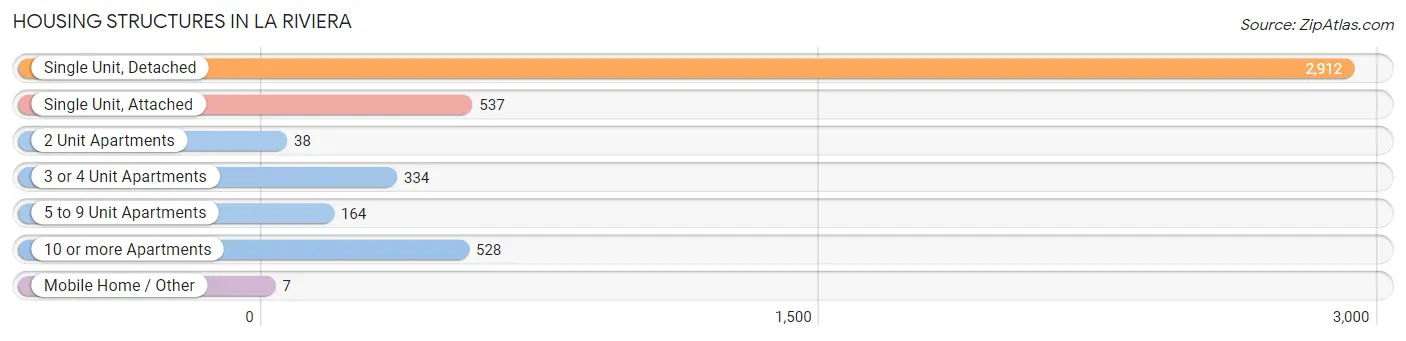
| Structure Type | # Housing Units | % Housing Units |
| Single Unit, Detached | 2,912 | 64.4% |
| Single Unit, Attached | 537 | 11.9% |
| 2 Unit Apartments | 38 | 0.8% |
| 3 or 4 Unit Apartments | 334 | 7.4% |
| 5 to 9 Unit Apartments | 164 | 3.6% |
| 10 or more Apartments | 528 | 11.7% |
| Mobile Home / Other | 7 | 0.2% |
| Total | 4,520 | 100.0% |
Housing Structures by Occupancy in La Riviera
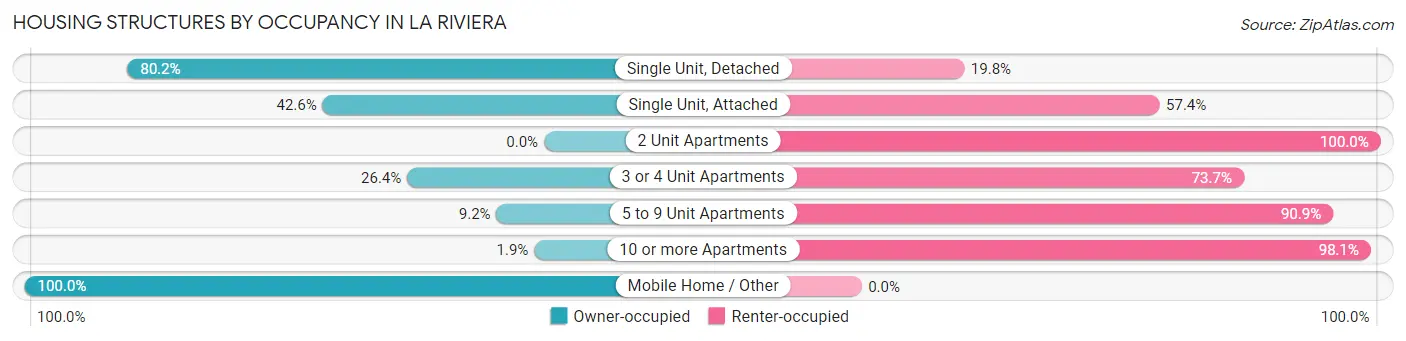
| Structure Type | Owner-occupied | Renter-occupied |
| Single Unit, Detached | 2,336 (80.2%) | 576 (19.8%) |
| Single Unit, Attached | 229 (42.6%) | 308 (57.4%) |
| 2 Unit Apartments | 0 (0.0%) | 38 (100.0%) |
| 3 or 4 Unit Apartments | 88 (26.4%) | 246 (73.7%) |
| 5 to 9 Unit Apartments | 15 (9.1%) | 149 (90.8%) |
| 10 or more Apartments | 10 (1.9%) | 518 (98.1%) |
| Mobile Home / Other | 7 (100.0%) | 0 (0.0%) |
| Total | 2,685 (59.4%) | 1,835 (40.6%) |
Housing Structures by Number of Rooms in La Riviera
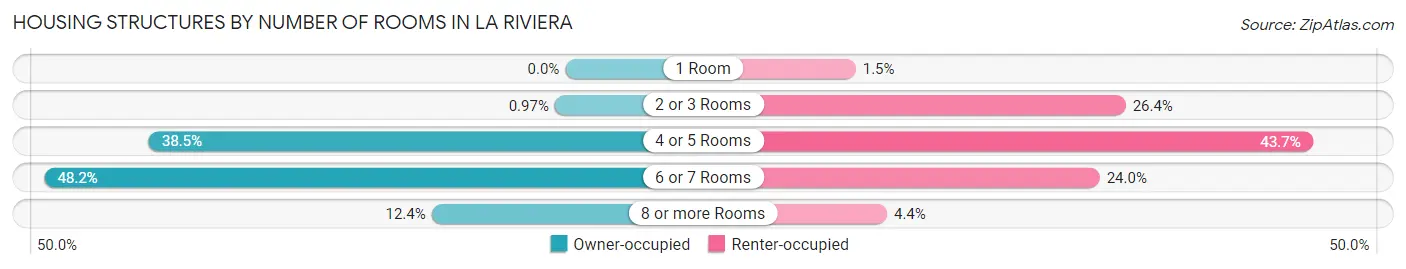
| Number of Rooms | Owner-occupied | Renter-occupied |
| 1 Room | 0 (0.0%) | 27 (1.5%) |
| 2 or 3 Rooms | 26 (1.0%) | 485 (26.4%) |
| 4 or 5 Rooms | 1,034 (38.5%) | 802 (43.7%) |
| 6 or 7 Rooms | 1,293 (48.2%) | 441 (24.0%) |
| 8 or more Rooms | 332 (12.4%) | 80 (4.4%) |
| Total | 2,685 (100.0%) | 1,835 (100.0%) |
Housing Structure by Heating Type in La Riviera
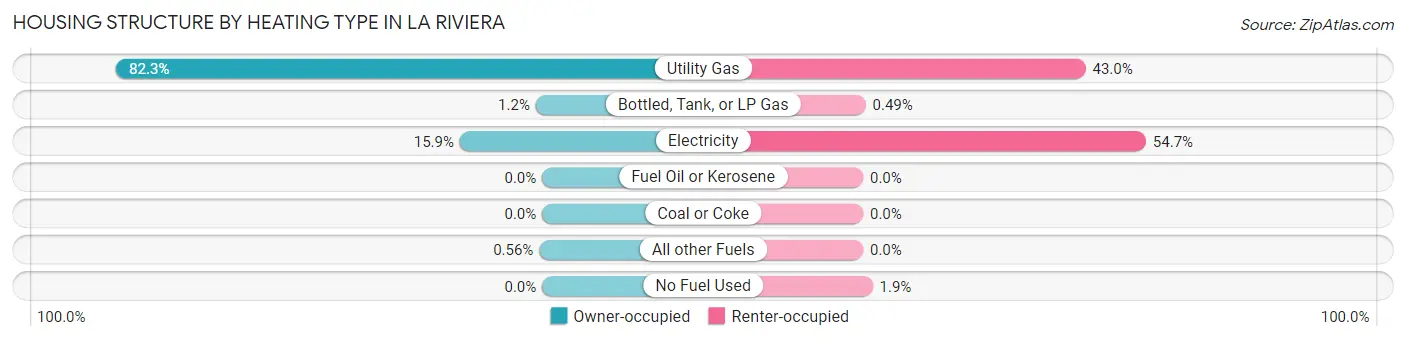
| Heating Type | Owner-occupied | Renter-occupied |
| Utility Gas | 2,210 (82.3%) | 789 (43.0%) |
| Bottled, Tank, or LP Gas | 33 (1.2%) | 9 (0.5%) |
| Electricity | 427 (15.9%) | 1,003 (54.7%) |
| Fuel Oil or Kerosene | 0 (0.0%) | 0 (0.0%) |
| Coal or Coke | 0 (0.0%) | 0 (0.0%) |
| All other Fuels | 15 (0.6%) | 0 (0.0%) |
| No Fuel Used | 0 (0.0%) | 34 (1.8%) |
| Total | 2,685 (100.0%) | 1,835 (100.0%) |
Household Vehicle Usage in La Riviera
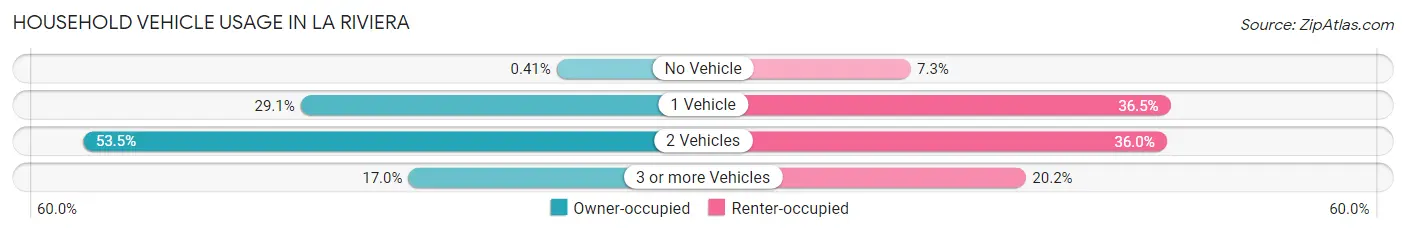
| Vehicles per Household | Owner-occupied | Renter-occupied |
| No Vehicle | 11 (0.4%) | 134 (7.3%) |
| 1 Vehicle | 781 (29.1%) | 669 (36.5%) |
| 2 Vehicles | 1,436 (53.5%) | 661 (36.0%) |
| 3 or more Vehicles | 457 (17.0%) | 371 (20.2%) |
| Total | 2,685 (100.0%) | 1,835 (100.0%) |
Real Estate & Mortgages in La Riviera
Real Estate and Mortgage Overview in La Riviera
| Characteristic | Without Mortgage | With Mortgage |
| Housing Units | 832 | 1,853 |
| Median Property Value | $415,700 | $382,800 |
| Median Household Income | $82,188 | $695 |
| Monthly Housing Costs | $579 | $212 |
| Real Estate Taxes | $2,206 | $55 |
Property Value by Mortgage Status in La Riviera
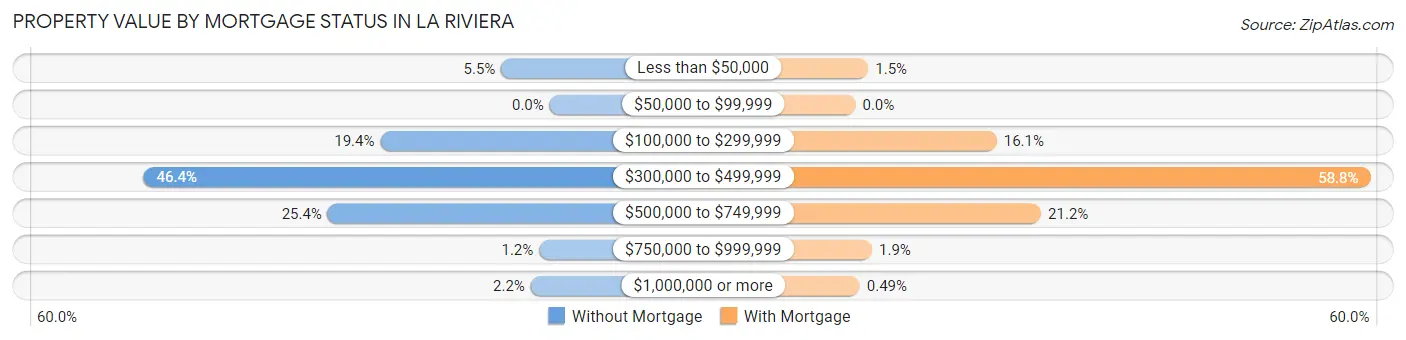
| Property Value | Without Mortgage | With Mortgage |
| Less than $50,000 | 46 (5.5%) | 27 (1.5%) |
| $50,000 to $99,999 | 0 (0.0%) | 0 (0.0%) |
| $100,000 to $299,999 | 161 (19.4%) | 299 (16.1%) |
| $300,000 to $499,999 | 386 (46.4%) | 1,090 (58.8%) |
| $500,000 to $749,999 | 211 (25.4%) | 393 (21.2%) |
| $750,000 to $999,999 | 10 (1.2%) | 35 (1.9%) |
| $1,000,000 or more | 18 (2.2%) | 9 (0.5%) |
| Total | 832 (100.0%) | 1,853 (100.0%) |
Household Income by Mortgage Status in La Riviera
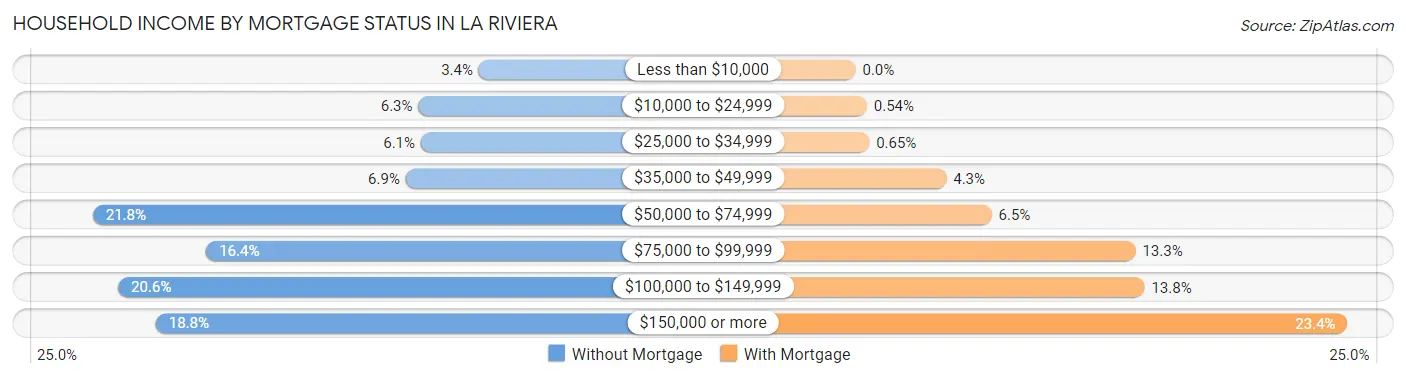
| Household Income | Without Mortgage | With Mortgage |
| Less than $10,000 | 28 (3.4%) | 0 (0.0%) |
| $10,000 to $24,999 | 52 (6.2%) | 10 (0.5%) |
| $25,000 to $34,999 | 51 (6.1%) | 12 (0.6%) |
| $35,000 to $49,999 | 57 (6.9%) | 80 (4.3%) |
| $50,000 to $74,999 | 181 (21.7%) | 120 (6.5%) |
| $75,000 to $99,999 | 136 (16.4%) | 247 (13.3%) |
| $100,000 to $149,999 | 171 (20.5%) | 255 (13.8%) |
| $150,000 or more | 156 (18.8%) | 434 (23.4%) |
| Total | 832 (100.0%) | 1,853 (100.0%) |
Property Value to Household Income Ratio in La Riviera
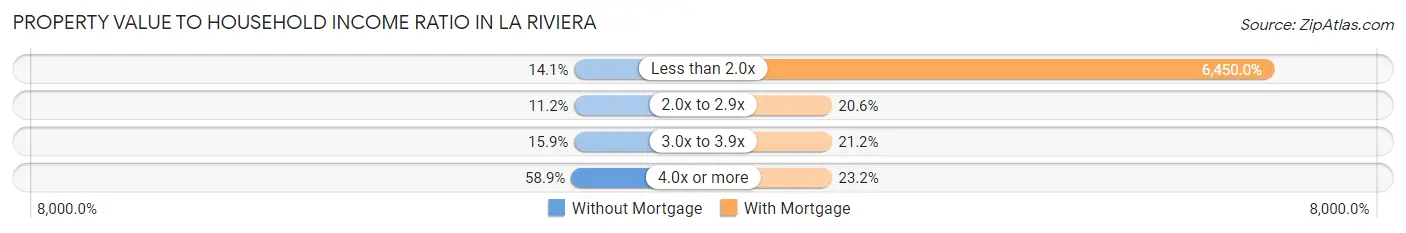
| Value-to-Income Ratio | Without Mortgage | With Mortgage |
| Less than 2.0x | 117 (14.1%) | 119,519 (6,450.0%) |
| 2.0x to 2.9x | 93 (11.2%) | 382 (20.6%) |
| 3.0x to 3.9x | 132 (15.9%) | 392 (21.1%) |
| 4.0x or more | 490 (58.9%) | 429 (23.2%) |
| Total | 832 (100.0%) | 1,853 (100.0%) |
Real Estate Taxes by Mortgage Status in La Riviera
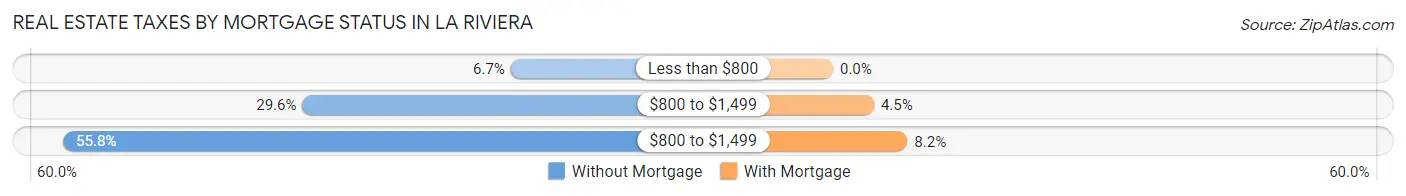
| Property Taxes | Without Mortgage | With Mortgage |
| Less than $800 | 56 (6.7%) | 0 (0.0%) |
| $800 to $1,499 | 246 (29.6%) | 83 (4.5%) |
| $800 to $1,499 | 464 (55.8%) | 151 (8.2%) |
| Total | 832 (100.0%) | 1,853 (100.0%) |
Health & Disability in La Riviera
Health Insurance Coverage by Age in La Riviera
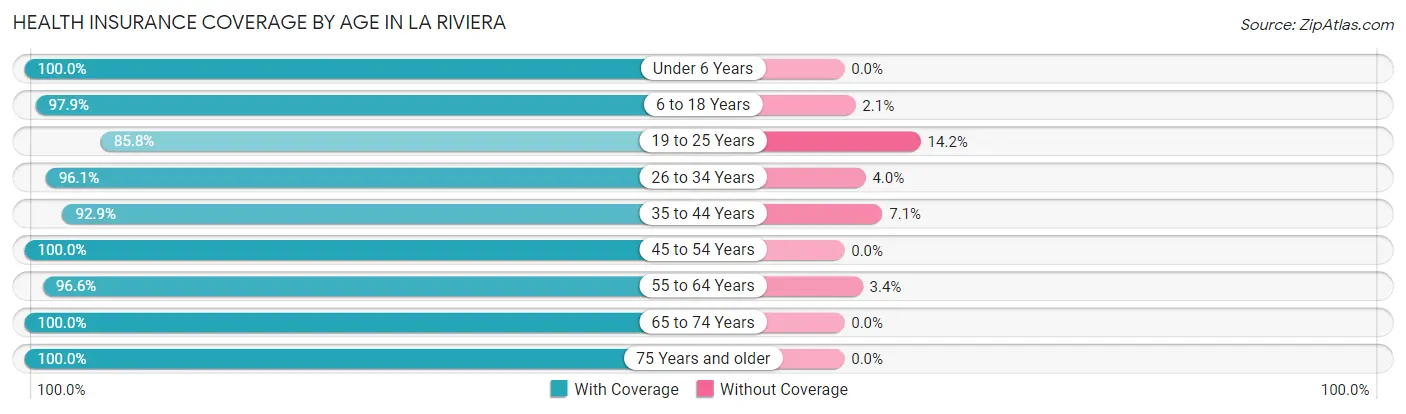
| Age Bracket | With Coverage | Without Coverage |
| Under 6 Years | 646 (100.0%) | 0 (0.0%) |
| 6 to 18 Years | 1,749 (97.9%) | 37 (2.1%) |
| 19 to 25 Years | 1,247 (85.8%) | 207 (14.2%) |
| 26 to 34 Years | 2,117 (96.1%) | 87 (4.0%) |
| 35 to 44 Years | 1,521 (92.9%) | 116 (7.1%) |
| 45 to 54 Years | 1,328 (100.0%) | 0 (0.0%) |
| 55 to 64 Years | 1,102 (96.6%) | 39 (3.4%) |
| 65 to 74 Years | 640 (100.0%) | 0 (0.0%) |
| 75 Years and older | 811 (100.0%) | 0 (0.0%) |
| Total | 11,161 (95.8%) | 486 (4.2%) |
Health Insurance Coverage by Citizenship Status in La Riviera
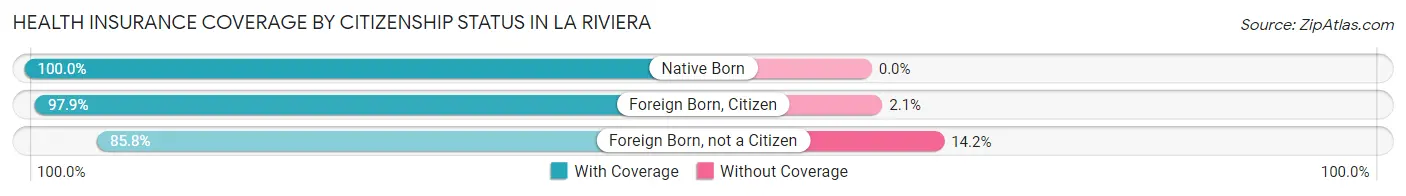
| Citizenship Status | With Coverage | Without Coverage |
| Native Born | 646 (100.0%) | 0 (0.0%) |
| Foreign Born, Citizen | 1,749 (97.9%) | 37 (2.1%) |
| Foreign Born, not a Citizen | 1,247 (85.8%) | 207 (14.2%) |
Health Insurance Coverage by Household Income in La Riviera
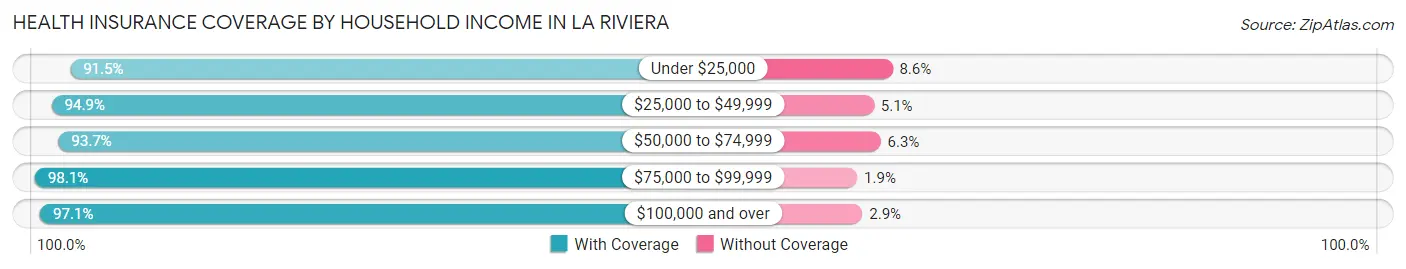
| Household Income | With Coverage | Without Coverage |
| Under $25,000 | 834 (91.4%) | 78 (8.6%) |
| $25,000 to $49,999 | 1,255 (94.9%) | 67 (5.1%) |
| $50,000 to $74,999 | 2,216 (93.7%) | 150 (6.3%) |
| $75,000 to $99,999 | 1,517 (98.1%) | 30 (1.9%) |
| $100,000 and over | 5,246 (97.1%) | 157 (2.9%) |
Public vs Private Health Insurance Coverage by Age in La Riviera
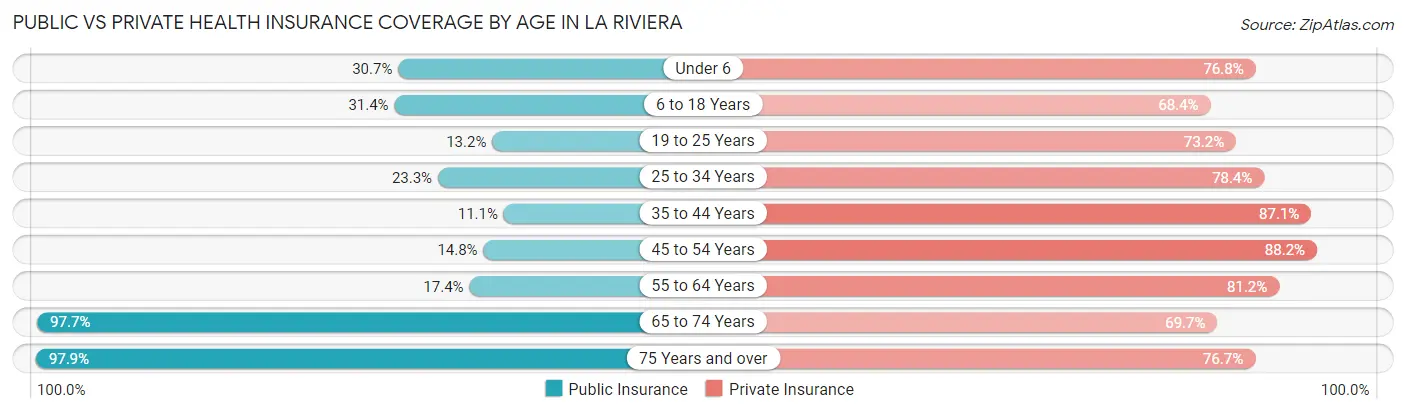
| Age Bracket | Public Insurance | Private Insurance |
| Under 6 | 198 (30.6%) | 496 (76.8%) |
| 6 to 18 Years | 560 (31.4%) | 1,222 (68.4%) |
| 19 to 25 Years | 192 (13.2%) | 1,064 (73.2%) |
| 25 to 34 Years | 513 (23.3%) | 1,728 (78.4%) |
| 35 to 44 Years | 181 (11.1%) | 1,426 (87.1%) |
| 45 to 54 Years | 197 (14.8%) | 1,171 (88.2%) |
| 55 to 64 Years | 199 (17.4%) | 926 (81.2%) |
| 65 to 74 Years | 625 (97.7%) | 446 (69.7%) |
| 75 Years and over | 794 (97.9%) | 622 (76.7%) |
| Total | 3,459 (29.7%) | 9,101 (78.1%) |
Disability Status by Sex by Age in La Riviera
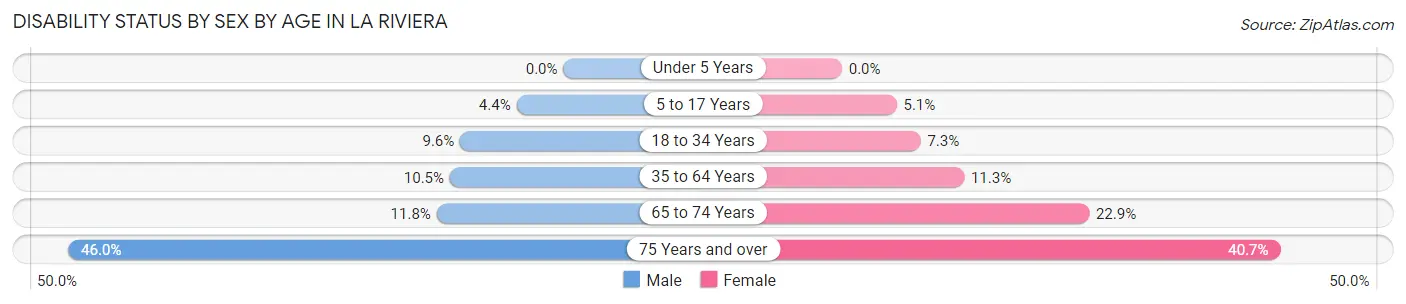
| Age Bracket | Male | Female |
| Under 5 Years | 0 (0.0%) | 0 (0.0%) |
| 5 to 17 Years | 27 (4.3%) | 61 (5.1%) |
| 18 to 34 Years | 165 (9.6%) | 145 (7.3%) |
| 35 to 64 Years | 242 (10.5%) | 205 (11.3%) |
| 65 to 74 Years | 24 (11.8%) | 100 (22.9%) |
| 75 Years and over | 148 (46.0%) | 199 (40.7%) |
Disability Class by Sex by Age in La Riviera
Disability Class: Hearing Difficulty
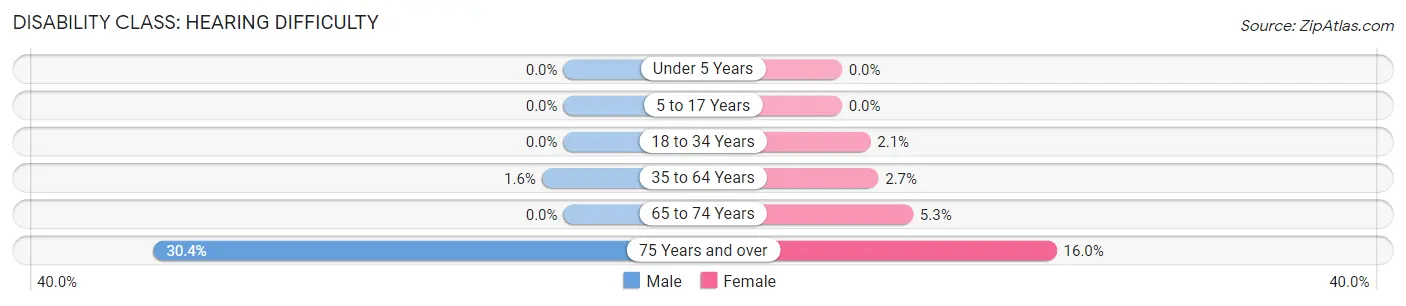
| Age Bracket | Male | Female |
| Under 5 Years | 0 (0.0%) | 0 (0.0%) |
| 5 to 17 Years | 0 (0.0%) | 0 (0.0%) |
| 18 to 34 Years | 0 (0.0%) | 42 (2.1%) |
| 35 to 64 Years | 37 (1.6%) | 49 (2.7%) |
| 65 to 74 Years | 0 (0.0%) | 23 (5.3%) |
| 75 Years and over | 98 (30.4%) | 78 (16.0%) |
Disability Class: Vision Difficulty
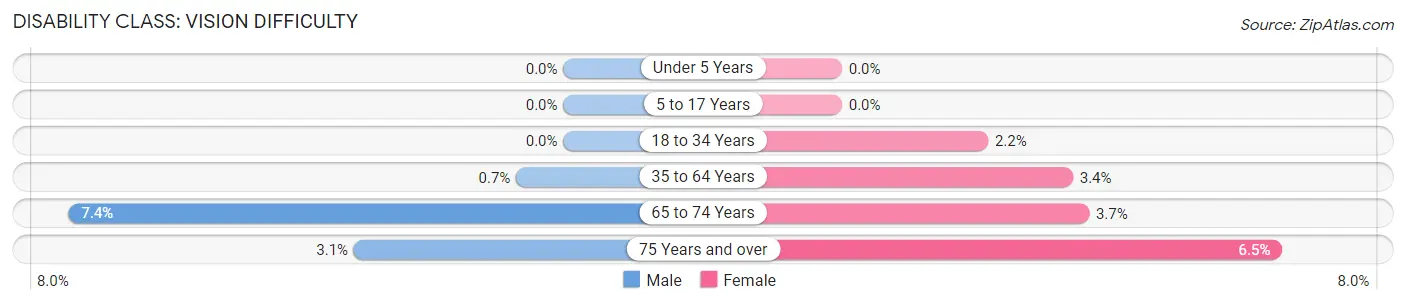
| Age Bracket | Male | Female |
| Under 5 Years | 0 (0.0%) | 0 (0.0%) |
| 5 to 17 Years | 0 (0.0%) | 0 (0.0%) |
| 18 to 34 Years | 0 (0.0%) | 43 (2.2%) |
| 35 to 64 Years | 16 (0.7%) | 62 (3.4%) |
| 65 to 74 Years | 15 (7.3%) | 16 (3.7%) |
| 75 Years and over | 10 (3.1%) | 32 (6.5%) |
Disability Class: Cognitive Difficulty
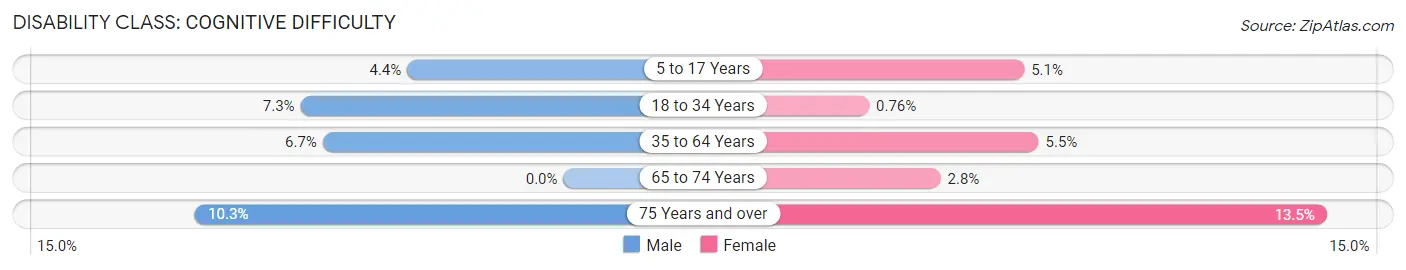
| Age Bracket | Male | Female |
| 5 to 17 Years | 27 (4.3%) | 61 (5.1%) |
| 18 to 34 Years | 126 (7.3%) | 15 (0.8%) |
| 35 to 64 Years | 154 (6.7%) | 99 (5.5%) |
| 65 to 74 Years | 0 (0.0%) | 12 (2.8%) |
| 75 Years and over | 33 (10.2%) | 66 (13.5%) |
Disability Class: Ambulatory Difficulty
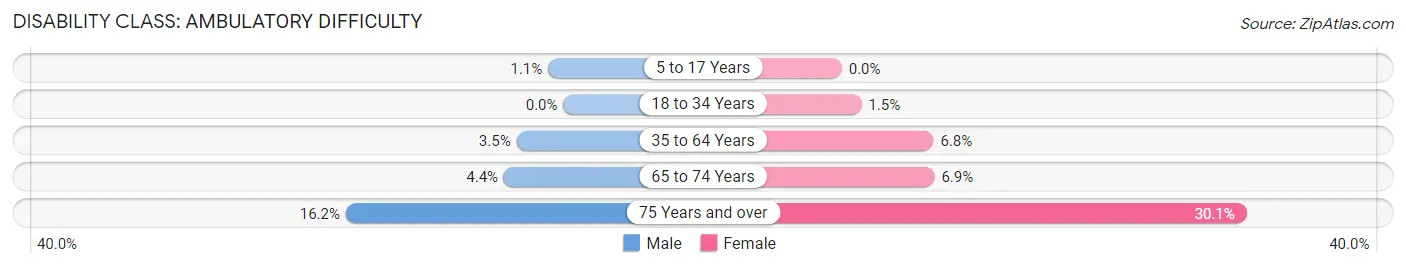
| Age Bracket | Male | Female |
| 5 to 17 Years | 7 (1.1%) | 0 (0.0%) |
| 18 to 34 Years | 0 (0.0%) | 29 (1.5%) |
| 35 to 64 Years | 80 (3.5%) | 123 (6.8%) |
| 65 to 74 Years | 9 (4.4%) | 30 (6.9%) |
| 75 Years and over | 52 (16.2%) | 147 (30.1%) |
Disability Class: Self-Care Difficulty
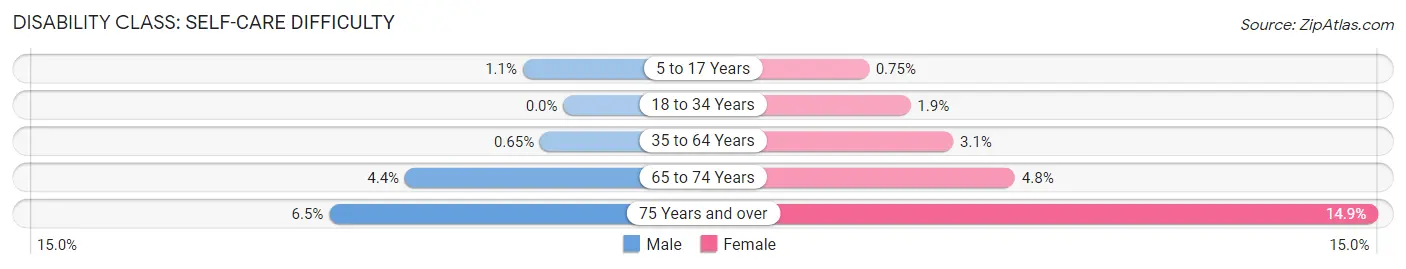
| Age Bracket | Male | Female |
| 5 to 17 Years | 7 (1.1%) | 9 (0.7%) |
| 18 to 34 Years | 0 (0.0%) | 38 (1.9%) |
| 35 to 64 Years | 15 (0.6%) | 56 (3.1%) |
| 65 to 74 Years | 9 (4.4%) | 21 (4.8%) |
| 75 Years and over | 21 (6.5%) | 73 (14.9%) |
Technology Access in La Riviera
Computing Device Access in La Riviera
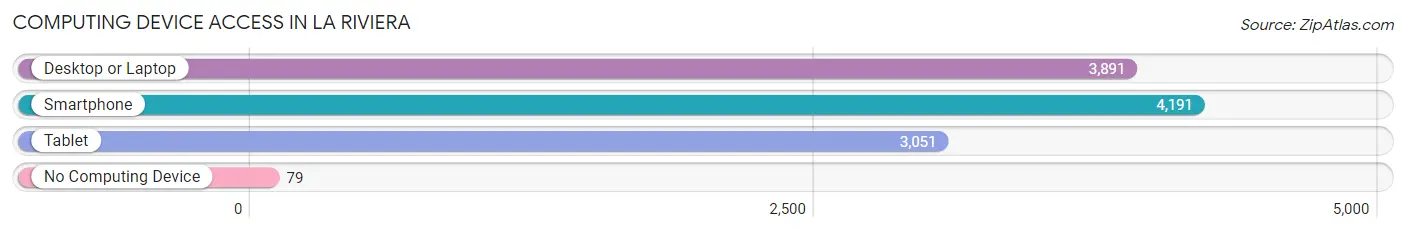
| Device Type | # Households | % Households |
| Desktop or Laptop | 3,891 | 86.1% |
| Smartphone | 4,191 | 92.7% |
| Tablet | 3,051 | 67.5% |
| No Computing Device | 79 | 1.8% |
| Total | 4,520 | 100.0% |
Internet Access in La Riviera
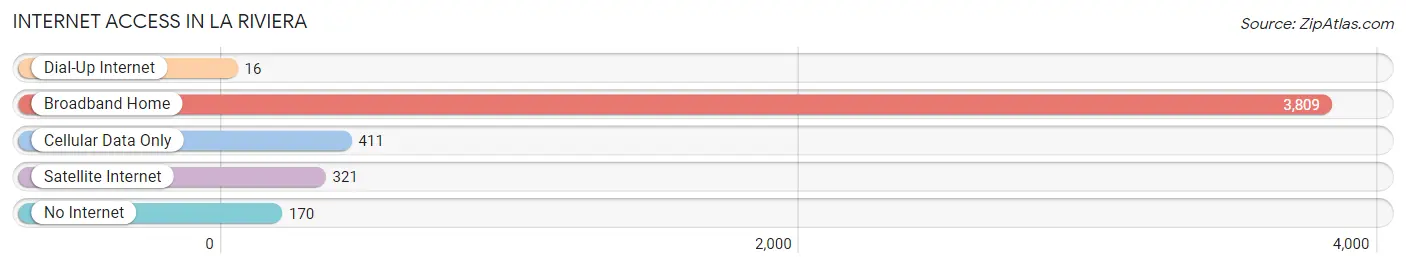
| Internet Type | # Households | % Households |
| Dial-Up Internet | 16 | 0.4% |
| Broadband Home | 3,809 | 84.3% |
| Cellular Data Only | 411 | 9.1% |
| Satellite Internet | 321 | 7.1% |
| No Internet | 170 | 3.8% |
| Total | 4,520 | 100.0% |
La Riviera Summary
Riviera is a small unincorporated community located in Los Angeles County, California. It is situated in the Santa Monica Mountains, just north of the city of Malibu. The community is bordered by the Pacific Ocean to the west, Topanga State Park to the east, and the Santa Monica Mountains to the north. The population of Riviera was estimated to be around 1,000 in 2020.
History
Riviera was originally inhabited by the Chumash people, who lived in the area for thousands of years before the arrival of Europeans. The first Europeans to settle in the area were Spanish missionaries, who established a mission in the area in 1769. The mission was abandoned in 1834, and the area was subsequently settled by ranchers and farmers.
In the late 19th century, the area was developed as a resort community, with the construction of several large hotels and resorts. The area was also home to a number of celebrities, including Charlie Chaplin, Rudolph Valentino, and Douglas Fairbanks.
In the early 20th century, the area was developed as a residential community, with the construction of several large homes. The area was also home to a number of celebrities, including Clark Gable, Cary Grant, and Humphrey Bogart.
Geography
Riviera is located in the Santa Monica Mountains, just north of the city of Malibu. The community is bordered by the Pacific Ocean to the west, Topanga State Park to the east, and the Santa Monica Mountains to the north. The area is characterized by rolling hills, with elevations ranging from sea level to over 1,000 feet.
Economy
Riviera is primarily a residential community, with most of its residents employed in the nearby cities of Malibu and Los Angeles. The area is also home to a number of small businesses, including restaurants, cafes, and retail stores.
Demographics
Riviera is a predominantly white community, with a population of around 1,000 in 2020. The median household income in the area is around $100,000, and the median home value is around $1.2 million. The area is also home to a number of celebrities, including Leonardo DiCaprio, Jennifer Aniston, and Brad Pitt.
Common Questions
What is Per Capita Income in La Riviera?
Per Capita income in La Riviera is $40,881.
What is the Median Family Income in La Riviera?
Median Family Income in La Riviera is $94,167.
What is the Median Household income in La Riviera?
Median Household Income in La Riviera is $85,744.
What is Income or Wage Gap in La Riviera?
Income or Wage Gap in La Riviera is 11.1%.
Women in La Riviera earn 88.9 cents for every dollar earned by a man.
What is Inequality or Gini Index in La Riviera?
Inequality or Gini Index in La Riviera is 0.38.
What is the Total Population of La Riviera?
Total Population of La Riviera is 11,652.
What is the Total Male Population of La Riviera?
Total Male Population of La Riviera is 5,403.
What is the Total Female Population of La Riviera?
Total Female Population of La Riviera is 6,249.
What is the Ratio of Males per 100 Females in La Riviera?
There are 86.46 Males per 100 Females in La Riviera.
What is the Ratio of Females per 100 Males in La Riviera?
There are 115.66 Females per 100 Males in La Riviera.
What is the Median Population Age in La Riviera?
Median Population Age in La Riviera is 33.6 Years.
What is the Average Family Size in La Riviera
Average Family Size in La Riviera is 3.0 People.
What is the Average Household Size in La Riviera
Average Household Size in La Riviera is 2.6 People.
How Large is the Labor Force in La Riviera?
There are 6,640 People in the Labor Forcein in La Riviera.
What is the Percentage of People in the Labor Force in La Riviera?
70.2% of People are in the Labor Force in La Riviera.
What is the Unemployment Rate in La Riviera?
Unemployment Rate in La Riviera is 3.3%.