Cities with the Highest Percentage of Black / African American Population in Ohio
RELATED REPORTS & OPTIONS
Black / African American
Ohio
Compare Cities
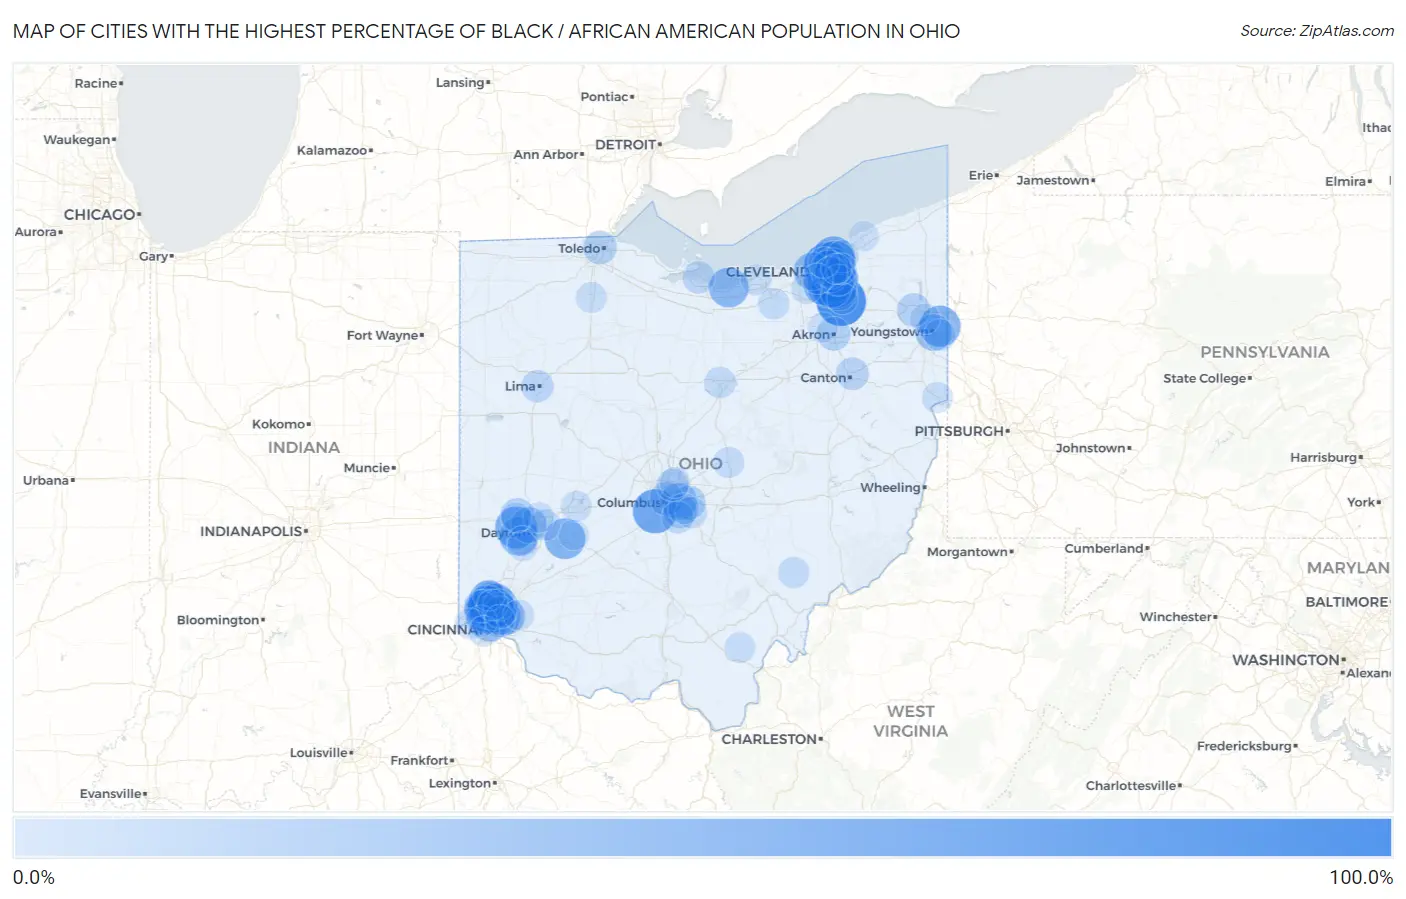
Map of Cities with the Highest Percentage of Black / African American Population in Ohio
0.0%
100.0%
Cities with the Highest Percentage of Black / African American Population in Ohio
| City | Black / African American | vs State | vs National | |
| 1. | Twinsburg Heights | 97.9% | 12.3%(+85.6)#1 | 12.5%(+85.4)#82 |
| 2. | Warrensville Heights | 94.0% | 12.3%(+81.7)#2 | 12.5%(+81.5)#126 |
| 3. | East Cleveland | 88.0% | 12.3%(+75.7)#3 | 12.5%(+75.5)#221 |
| 4. | Skyline Acres | 80.6% | 12.3%(+68.3)#4 | 12.5%(+68.1)#375 |
| 5. | Highland Hills | 79.4% | 12.3%(+67.1)#5 | 12.5%(+66.9)#407 |
| 6. | Bedford Heights | 75.2% | 12.3%(+62.9)#6 | 12.5%(+62.7)#494 |
| 7. | Pleasant Hills | 74.7% | 12.3%(+62.4)#7 | 12.5%(+62.2)#505 |
| 8. | Urbancrest | 74.4% | 12.3%(+62.1)#8 | 12.5%(+61.9)#516 |
| 9. | Maple Heights | 73.0% | 12.3%(+60.7)#9 | 12.5%(+60.5)#550 |
| 10. | North Randall | 72.1% | 12.3%(+59.8)#10 | 12.5%(+59.7)#567 |
| 11. | Fort Mckinley | 68.8% | 12.3%(+56.5)#11 | 12.5%(+56.4)#648 |
| 12. | Euclid | 66.3% | 12.3%(+54.0)#12 | 12.5%(+53.8)#699 |
| 13. | Trotwood | 65.0% | 12.3%(+52.7)#13 | 12.5%(+52.5)#745 |
| 14. | Maplewood Park | 61.5% | 12.3%(+49.1)#14 | 12.5%(+49.0)#851 |
| 15. | North College Hill | 60.3% | 12.3%(+48.0)#15 | 12.5%(+47.9)#883 |
| 16. | Richmond Heights | 60.0% | 12.3%(+47.7)#16 | 12.5%(+47.5)#894 |
| 17. | Golf Manor | 59.7% | 12.3%(+47.4)#17 | 12.5%(+47.2)#905 |
| 18. | Wilberforce | 59.3% | 12.3%(+47.0)#18 | 12.5%(+46.8)#917 |
| 19. | Woodlawn | 58.4% | 12.3%(+46.1)#19 | 12.5%(+46.0)#948 |
| 20. | Garfield Heights | 56.6% | 12.3%(+44.3)#20 | 12.5%(+44.1)#1,015 |
| 21. | Bedford | 55.8% | 12.3%(+43.5)#21 | 12.5%(+43.3)#1,042 |
| 22. | Beulah Beach | 55.2% | 12.3%(+42.9)#22 | 12.5%(+42.8)#1,061 |
| 23. | Forest Park | 55.1% | 12.3%(+42.8)#23 | 12.5%(+42.6)#1,067 |
| 24. | South Euclid | 51.9% | 12.3%(+39.6)#24 | 12.5%(+39.5)#1,173 |
| 25. | Pleasant Run Farm | 51.4% | 12.3%(+39.1)#25 | 12.5%(+38.9)#1,192 |
| 26. | New Burlington | 50.9% | 12.3%(+38.5)#26 | 12.5%(+38.4)#1,213 |
| 27. | Drexel | 50.5% | 12.3%(+38.2)#27 | 12.5%(+38.1)#1,227 |
| 28. | Mount Healthy | 47.3% | 12.3%(+35.0)#28 | 12.5%(+34.8)#1,363 |
| 29. | Cleveland | 46.6% | 12.3%(+34.3)#29 | 12.5%(+34.1)#1,400 |
| 30. | Silverton | 44.9% | 12.3%(+32.6)#30 | 12.5%(+32.4)#1,472 |
| 31. | Woodmere | 44.2% | 12.3%(+31.9)#31 | 12.5%(+31.7)#1,510 |
| 32. | Mount Healthy Heights | 42.7% | 12.3%(+30.4)#32 | 12.5%(+30.2)#1,595 |
| 33. | Madison Place | 42.4% | 12.3%(+30.1)#33 | 12.5%(+29.9)#1,608 |
| 34. | Oakwood Village Cuyahoga County | 42.2% | 12.3%(+29.9)#34 | 12.5%(+29.7)#1,616 |
| 35. | Northbrook | 42.1% | 12.3%(+29.8)#35 | 12.5%(+29.6)#1,624 |
| 36. | Youngstown | 41.8% | 12.3%(+29.5)#36 | 12.5%(+29.4)#1,641 |
| 37. | Cleveland Heights | 41.7% | 12.3%(+29.4)#37 | 12.5%(+29.3)#1,647 |
| 38. | Whitehall | 41.6% | 12.3%(+29.3)#38 | 12.5%(+29.1)#1,651 |
| 39. | Cincinnati | 39.6% | 12.3%(+27.3)#39 | 12.5%(+27.2)#1,762 |
| 40. | Springdale | 38.1% | 12.3%(+25.8)#40 | 12.5%(+25.7)#1,846 |
| 41. | Dayton | 38.0% | 12.3%(+25.7)#41 | 12.5%(+25.5)#1,855 |
| 42. | Glenwillow | 37.9% | 12.3%(+25.6)#42 | 12.5%(+25.5)#1,858 |
| 43. | Groesbeck | 35.9% | 12.3%(+23.5)#43 | 12.5%(+23.4)#1,985 |
| 44. | Shaker Heights | 35.6% | 12.3%(+23.3)#44 | 12.5%(+23.1)#1,995 |
| 45. | Finneytown | 35.6% | 12.3%(+23.2)#45 | 12.5%(+23.1)#1,999 |
| 46. | Lockland | 35.1% | 12.3%(+22.8)#46 | 12.5%(+22.6)#2,027 |
| 47. | Reynoldsburg | 29.8% | 12.3%(+17.5)#47 | 12.5%(+17.4)#2,377 |
| 48. | Akron | 29.5% | 12.3%(+17.2)#48 | 12.5%(+17.0)#2,396 |
| 49. | Clayton | 29.5% | 12.3%(+17.2)#49 | 12.5%(+17.0)#2,399 |
| 50. | Columbus | 29.1% | 12.3%(+16.8)#50 | 12.5%(+16.7)#2,421 |
| 51. | Blacklick Estates | 28.8% | 12.3%(+16.5)#51 | 12.5%(+16.3)#2,450 |
| 52. | Toledo | 28.1% | 12.3%(+15.8)#52 | 12.5%(+15.6)#2,500 |
| 53. | Warren | 28.1% | 12.3%(+15.7)#53 | 12.5%(+15.6)#2,503 |
| 54. | Canton | 25.1% | 12.3%(+12.8)#54 | 12.5%(+12.6)#2,753 |
| 55. | Lima | 23.5% | 12.3%(+11.2)#55 | 12.5%(+11.0)#2,906 |
| 56. | Minerva Park | 23.5% | 12.3%(+11.2)#56 | 12.5%(+11.0)#2,909 |
| 57. | Northgate | 23.4% | 12.3%(+11.1)#57 | 12.5%(+10.9)#2,921 |
| 58. | University Heights | 23.2% | 12.3%(+10.9)#58 | 12.5%(+10.7)#2,941 |
| 59. | Dry Ridge | 23.2% | 12.3%(+10.9)#59 | 12.5%(+10.7)#2,945 |
| 60. | Sandusky | 23.1% | 12.3%(+10.8)#60 | 12.5%(+10.6)#2,959 |
| 61. | Arlington Heights | 22.1% | 12.3%(+9.81)#61 | 12.5%(+9.65)#3,062 |
| 62. | Willoughby Hills | 22.1% | 12.3%(+9.81)#62 | 12.5%(+9.65)#3,064 |
| 63. | Groveport | 21.6% | 12.3%(+9.28)#63 | 12.5%(+9.12)#3,114 |
| 64. | Campbell | 19.9% | 12.3%(+7.56)#64 | 12.5%(+7.40)#3,328 |
| 65. | Pickerington | 19.6% | 12.3%(+7.25)#65 | 12.5%(+7.09)#3,355 |
| 66. | Glendale | 19.4% | 12.3%(+7.10)#66 | 12.5%(+6.94)#3,373 |
| 67. | Mansfield | 19.4% | 12.3%(+7.08)#67 | 12.5%(+6.92)#3,376 |
| 68. | Chesterhill | 19.4% | 12.3%(+7.07)#68 | 12.5%(+6.90)#3,378 |
| 69. | Cheviot | 19.1% | 12.3%(+6.80)#69 | 12.5%(+6.64)#3,413 |
| 70. | Grafton | 19.0% | 12.3%(+6.66)#70 | 12.5%(+6.50)#3,428 |
| 71. | Wright Patterson Afb | 18.7% | 12.3%(+6.42)#71 | 12.5%(+6.26)#3,465 |
| 72. | Utica | 18.5% | 12.3%(+6.17)#72 | 12.5%(+6.01)#3,508 |
| 73. | Fairfield | 17.6% | 12.3%(+5.25)#73 | 12.5%(+5.09)#3,640 |
| 74. | Orange | 17.4% | 12.3%(+5.11)#74 | 12.5%(+4.95)#3,655 |
| 75. | Springfield | 17.4% | 12.3%(+5.10)#75 | 12.5%(+4.94)#3,656 |
| 76. | Brice | 17.4% | 12.3%(+5.06)#76 | 12.5%(+4.90)#3,661 |
| 77. | Portage | 17.3% | 12.3%(+4.99)#77 | 12.5%(+4.83)#3,672 |
| 78. | Twinsburg | 17.3% | 12.3%(+4.99)#78 | 12.5%(+4.83)#3,674 |
| 79. | Glenmoor | 17.2% | 12.3%(+4.84)#79 | 12.5%(+4.68)#3,703 |
| 80. | Lorain | 16.7% | 12.3%(+4.41)#80 | 12.5%(+4.25)#3,777 |
| 81. | Mayfield Heights | 16.7% | 12.3%(+4.40)#81 | 12.5%(+4.24)#3,780 |
| 82. | Vinton | 16.7% | 12.3%(+4.36)#82 | 12.5%(+4.20)#3,785 |
| 83. | Bratenahl | 16.5% | 12.3%(+4.22)#83 | 12.5%(+4.06)#3,810 |
| 84. | Addyston | 16.3% | 12.3%(+3.98)#84 | 12.5%(+3.82)#3,851 |
| 85. | Greenhills | 16.3% | 12.3%(+3.95)#85 | 12.5%(+3.79)#3,859 |
| 86. | Camp Dennison | 16.3% | 12.3%(+3.94)#86 | 12.5%(+3.78)#3,861 |
| 87. | Delshire | 16.2% | 12.3%(+3.89)#87 | 12.5%(+3.73)#3,874 |
| 88. | Huber Ridge | 16.1% | 12.3%(+3.78)#88 | 12.5%(+3.62)#3,895 |
| 89. | Parma Heights | 16.0% | 12.3%(+3.66)#89 | 12.5%(+3.50)#3,916 |
| 90. | Huber Heights | 15.9% | 12.3%(+3.61)#90 | 12.5%(+3.45)#3,924 |
| 91. | Newburgh Heights | 15.4% | 12.3%(+3.09)#91 | 12.5%(+2.93)#4,014 |
| 92. | Englewood | 15.4% | 12.3%(+3.04)#92 | 12.5%(+2.88)#4,026 |
| 93. | Cedarville | 15.0% | 12.3%(+2.68)#93 | 12.5%(+2.52)#4,099 |
| 94. | Mckinley Heights | 14.8% | 12.3%(+2.51)#94 | 12.5%(+2.35)#4,139 |
| 95. | Moraine | 14.7% | 12.3%(+2.39)#95 | 12.5%(+2.23)#4,160 |
| 96. | Painesville | 14.7% | 12.3%(+2.35)#96 | 12.5%(+2.19)#4,170 |
| 97. | Fairlawn | 14.5% | 12.3%(+2.15)#97 | 12.5%(+1.99)#4,211 |
| 98. | West Carrollton | 14.3% | 12.3%(+2.01)#98 | 12.5%(+1.85)#4,235 |
| 99. | Norwood | 14.3% | 12.3%(+1.95)#99 | 12.5%(+1.78)#4,252 |
| 100. | Lyndhurst | 14.2% | 12.3%(+1.90)#100 | 12.5%(+1.74)#4,259 |
Common Questions
What are the Top 10 Cities with the Highest Percentage of Black / African American Population in Ohio?
Top 10 Cities with the Highest Percentage of Black / African American Population in Ohio are:
#1
97.9%
#2
94.0%
#3
88.0%
#4
80.6%
#5
79.4%
#6
75.2%
#7
74.7%
#8
74.4%
#9
73.0%
#10
72.1%
What city has the Highest Percentage of Black / African American Population in Ohio?
Twinsburg Heights has the Highest Percentage of Black / African American Population in Ohio with 97.9%.
What is the Percentage of Black / African American Population in the State of Ohio?
Percentage of Black / African American Population in Ohio is 12.3%.
What is the Percentage of Black / African American Population in the United States?
Percentage of Black / African American Population in the United States is 12.5%.