Cities with the Highest Percentage of Black / African American Population in Michigan
RELATED REPORTS & OPTIONS
Black / African American
Michigan
Compare Cities
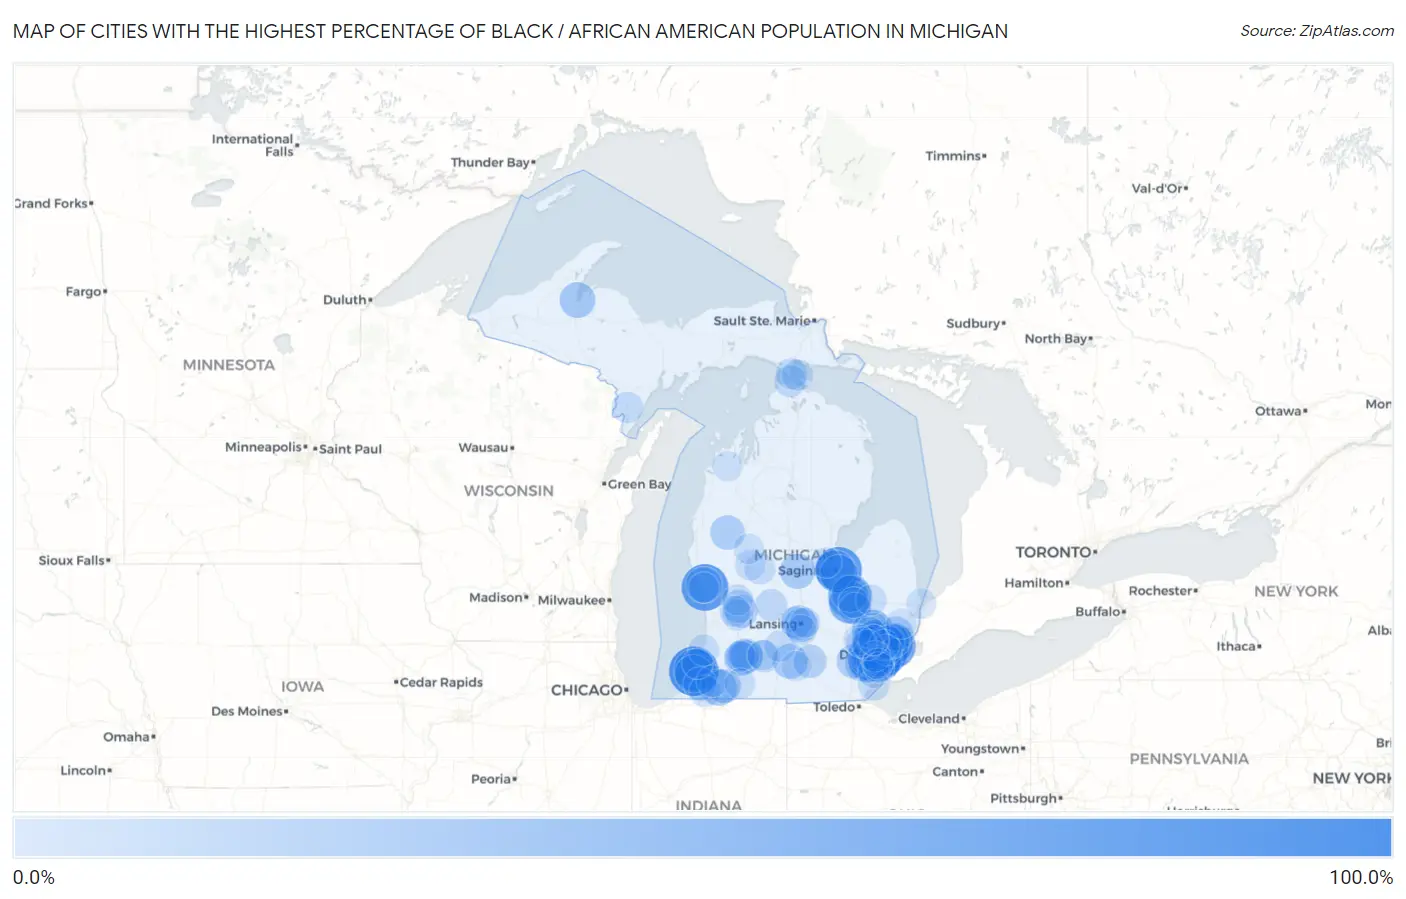
Map of Cities with the Highest Percentage of Black / African American Population in Michigan
0.0%
100.0%
Cities with the Highest Percentage of Black / African American Population in Michigan
| City | Black / African American | vs State | vs National | |
| 1. | Highland Park | 88.1% | 13.6%(+74.6)#1 | 12.5%(+75.6)#220 |
| 2. | Benton Harbor | 87.4% | 13.6%(+73.8)#2 | 12.5%(+74.9)#232 |
| 3. | Detroit | 77.8% | 13.6%(+64.3)#3 | 12.5%(+65.3)#439 |
| 4. | Muskegon Heights | 76.4% | 13.6%(+62.8)#4 | 12.5%(+63.9)#464 |
| 5. | Inkster | 74.7% | 13.6%(+61.2)#5 | 12.5%(+62.2)#507 |
| 6. | Buena Vista | 74.1% | 13.6%(+60.6)#6 | 12.5%(+61.7)#520 |
| 7. | Lathrup Village | 66.3% | 13.6%(+52.7)#7 | 12.5%(+53.8)#702 |
| 8. | Southfield | 65.3% | 13.6%(+51.7)#8 | 12.5%(+52.8)#728 |
| 9. | Harper Woods | 63.9% | 13.6%(+50.3)#9 | 12.5%(+51.4)#778 |
| 10. | Beecher | 63.0% | 13.6%(+49.4)#10 | 12.5%(+50.5)#803 |
| 11. | Benton Heights | 57.5% | 13.6%(+43.9)#11 | 12.5%(+45.0)#985 |
| 12. | Flint | 56.3% | 13.6%(+42.7)#12 | 12.5%(+43.8)#1,025 |
| 13. | Oak Park | 53.3% | 13.6%(+39.7)#13 | 12.5%(+40.8)#1,134 |
| 14. | Eastpointe | 53.1% | 13.6%(+39.6)#14 | 12.5%(+40.6)#1,138 |
| 15. | Pontiac | 49.0% | 13.6%(+35.5)#15 | 12.5%(+36.6)#1,288 |
| 16. | River Rouge | 46.3% | 13.6%(+32.7)#16 | 12.5%(+33.8)#1,419 |
| 17. | Saginaw | 45.6% | 13.6%(+32.1)#17 | 12.5%(+33.2)#1,442 |
| 18. | Romulus | 45.4% | 13.6%(+31.9)#18 | 12.5%(+33.0)#1,452 |
| 19. | Ecorse | 43.7% | 13.6%(+30.1)#19 | 12.5%(+31.2)#1,544 |
| 20. | Bridgeport | 39.1% | 13.6%(+25.6)#20 | 12.5%(+26.7)#1,789 |
| 21. | Fair Plain | 38.9% | 13.6%(+25.4)#21 | 12.5%(+26.4)#1,799 |
| 22. | Cassopolis | 33.1% | 13.6%(+19.6)#22 | 12.5%(+20.7)#2,142 |
| 23. | Mount Morris | 33.1% | 13.6%(+19.6)#23 | 12.5%(+20.7)#2,143 |
| 24. | Scotts | 33.0% | 13.6%(+19.4)#24 | 12.5%(+20.5)#2,153 |
| 25. | Paris | 31.5% | 13.6%(+18.0)#25 | 12.5%(+19.1)#2,238 |
| 26. | Center Line | 30.9% | 13.6%(+17.4)#26 | 12.5%(+18.5)#2,289 |
| 27. | Muskegon | 30.9% | 13.6%(+17.4)#27 | 12.5%(+18.5)#2,291 |
| 28. | Eastwood | 30.2% | 13.6%(+16.6)#28 | 12.5%(+17.7)#2,348 |
| 29. | Baraga | 29.9% | 13.6%(+16.3)#29 | 12.5%(+17.4)#2,374 |
| 30. | Albion | 27.6% | 13.6%(+14.0)#30 | 12.5%(+15.1)#2,526 |
| 31. | St Louis | 27.4% | 13.6%(+13.8)#31 | 12.5%(+14.9)#2,545 |
| 32. | Edgemont Park | 25.4% | 13.6%(+11.9)#32 | 12.5%(+12.9)#2,723 |
| 33. | Baldwin | 24.9% | 13.6%(+11.3)#33 | 12.5%(+12.4)#2,778 |
| 34. | Ypsilanti | 24.1% | 13.6%(+10.5)#34 | 12.5%(+11.6)#2,848 |
| 35. | Mount Clemens | 24.1% | 13.6%(+10.5)#35 | 12.5%(+11.6)#2,849 |
| 36. | Lansing | 23.7% | 13.6%(+10.2)#36 | 12.5%(+11.2)#2,877 |
| 37. | Wayne | 23.5% | 13.6%(+9.94)#37 | 12.5%(+11.0)#2,908 |
| 38. | Vandalia | 23.4% | 13.6%(+9.84)#38 | 12.5%(+10.9)#2,920 |
| 39. | Roseville | 22.8% | 13.6%(+9.26)#39 | 12.5%(+10.3)#2,988 |
| 40. | Westland | 22.3% | 13.6%(+8.71)#40 | 12.5%(+9.80)#3,049 |
| 41. | Kalamazoo | 22.1% | 13.6%(+8.58)#41 | 12.5%(+9.66)#3,060 |
| 42. | Jackson | 20.5% | 13.6%(+6.91)#42 | 12.5%(+8.00)#3,247 |
| 43. | Taylor | 20.3% | 13.6%(+6.77)#43 | 12.5%(+7.86)#3,264 |
| 44. | Warren | 19.9% | 13.6%(+6.29)#44 | 12.5%(+7.38)#3,330 |
| 45. | Berrien Springs | 19.2% | 13.6%(+5.68)#45 | 12.5%(+6.77)#3,396 |
| 46. | Kentwood | 19.1% | 13.6%(+5.55)#46 | 12.5%(+6.64)#3,411 |
| 47. | Ramsay | 18.8% | 13.6%(+5.19)#47 | 12.5%(+6.28)#3,461 |
| 48. | Belleville | 18.4% | 13.6%(+4.81)#48 | 12.5%(+5.90)#3,519 |
| 49. | Grand Rapids | 17.9% | 13.6%(+4.33)#49 | 12.5%(+5.41)#3,597 |
| 50. | Comstock Northwest | 17.9% | 13.6%(+4.31)#50 | 12.5%(+5.40)#3,598 |
| 51. | Farmington Hills | 17.8% | 13.6%(+4.23)#51 | 12.5%(+5.32)#3,607 |
| 52. | Battle Creek | 16.3% | 13.6%(+2.70)#52 | 12.5%(+3.78)#3,862 |
| 53. | Grand Blanc | 15.8% | 13.6%(+2.24)#53 | 12.5%(+3.33)#3,943 |
| 54. | Waverly | 14.7% | 13.6%(+1.10)#54 | 12.5%(+2.19)#4,171 |
| 55. | Franklin | 14.4% | 13.6%(+0.842)#55 | 12.5%(+1.93)#4,221 |
| 56. | Ionia | 14.3% | 13.6%(+0.762)#56 | 12.5%(+1.85)#4,236 |
| 57. | Melvindale | 14.2% | 13.6%(+0.629)#57 | 12.5%(+1.72)#4,263 |
| 58. | Mackinaw City | 14.0% | 13.6%(+0.489)#58 | 12.5%(+1.58)#4,292 |
| 59. | Auburn Hills | 13.9% | 13.6%(+0.378)#59 | 12.5%(+1.46)#4,308 |
| 60. | Niles | 13.5% | 13.6%(-0.104)#60 | 12.5%(+0.983)#4,408 |
| 61. | Dowagiac | 13.3% | 13.6%(-0.265)#61 | 12.5%(+0.822)#4,449 |
| 62. | Daggett | 13.0% | 13.6%(-0.557)#62 | 12.5%(+0.530)#4,514 |
| 63. | St Ignace | 12.4% | 13.6%(-1.15)#63 | 12.5%(-0.065)#4,654 |
| 64. | Olivet | 12.3% | 13.6%(-1.21)#64 | 12.5%(-0.127)#4,668 |
| 65. | Mackinac Island | 12.2% | 13.6%(-1.36)#65 | 12.5%(-0.269)#4,708 |
| 66. | Cutlerville | 12.1% | 13.6%(-1.42)#66 | 12.5%(-0.329)#4,731 |
| 67. | Lakeview | 12.1% | 13.6%(-1.48)#67 | 12.5%(-0.396)#4,749 |
| 68. | Stony Point | 12.0% | 13.6%(-1.56)#68 | 12.5%(-0.470)#4,759 |
| 69. | Flat Rock | 11.2% | 13.6%(-2.39)#69 | 12.5%(-1.30)#4,970 |
| 70. | Parchment | 11.1% | 13.6%(-2.43)#70 | 12.5%(-1.35)#4,979 |
| 71. | South Haven | 10.9% | 13.6%(-2.63)#71 | 12.5%(-1.54)#5,037 |
| 72. | Westwood | 10.5% | 13.6%(-3.02)#72 | 12.5%(-1.93)#5,140 |
| 73. | Comstock Park | 10.5% | 13.6%(-3.02)#73 | 12.5%(-1.93)#5,141 |
| 74. | Three Rivers | 10.2% | 13.6%(-3.31)#74 | 12.5%(-2.22)#5,240 |
| 75. | Wyoming | 10.1% | 13.6%(-3.50)#75 | 12.5%(-2.41)#5,305 |
| 76. | Sylvan Lake | 10.0% | 13.6%(-3.55)#76 | 12.5%(-2.46)#5,324 |
| 77. | Lapeer | 9.8% | 13.6%(-3.76)#77 | 12.5%(-2.67)#5,386 |
| 78. | Hamtramck | 9.8% | 13.6%(-3.80)#78 | 12.5%(-2.71)#5,402 |
| 79. | Burton | 9.7% | 13.6%(-3.87)#79 | 12.5%(-2.78)#5,418 |
| 80. | Lincoln Park | 9.7% | 13.6%(-3.90)#80 | 12.5%(-2.82)#5,430 |
| 81. | Hazel Park | 9.5% | 13.6%(-4.10)#81 | 12.5%(-3.01)#5,488 |
| 82. | Wixom | 9.2% | 13.6%(-4.31)#82 | 12.5%(-3.22)#5,553 |
| 83. | Morley | 9.2% | 13.6%(-4.31)#83 | 12.5%(-3.23)#5,556 |
| 84. | Holt | 8.8% | 13.6%(-4.77)#84 | 12.5%(-3.69)#5,721 |
| 85. | Lake Michigan Beach | 8.7% | 13.6%(-4.84)#85 | 12.5%(-3.76)#5,752 |
| 86. | Freeland | 8.6% | 13.6%(-4.99)#86 | 12.5%(-3.91)#5,822 |
| 87. | Springfield | 8.5% | 13.6%(-5.07)#87 | 12.5%(-3.99)#5,845 |
| 88. | Dearborn Heights | 8.5% | 13.6%(-5.08)#88 | 12.5%(-3.99)#5,850 |
| 89. | Farmington | 8.3% | 13.6%(-5.26)#89 | 12.5%(-4.17)#5,930 |
| 90. | Big Rapids | 8.3% | 13.6%(-5.27)#90 | 12.5%(-4.18)#5,935 |
| 91. | Port Huron | 8.1% | 13.6%(-5.42)#91 | 12.5%(-4.33)#5,982 |
| 92. | Riverview | 8.1% | 13.6%(-5.48)#92 | 12.5%(-4.39)#6,008 |
| 93. | Novi | 8.1% | 13.6%(-5.49)#93 | 12.5%(-4.41)#6,017 |
| 94. | Roosevelt Park | 8.0% | 13.6%(-5.56)#94 | 12.5%(-4.47)#6,052 |
| 95. | Concord | 7.9% | 13.6%(-5.66)#95 | 12.5%(-4.57)#6,095 |
| 96. | Lake Ann | 7.8% | 13.6%(-5.76)#96 | 12.5%(-4.67)#6,140 |
| 97. | Southgate | 7.7% | 13.6%(-5.81)#97 | 12.5%(-4.72)#6,169 |
| 98. | New Haven | 7.7% | 13.6%(-5.85)#98 | 12.5%(-4.76)#6,180 |
| 99. | Bingham Farms | 7.6% | 13.6%(-5.92)#99 | 12.5%(-4.83)#6,215 |
| 100. | East Lansing | 7.5% | 13.6%(-6.11)#100 | 12.5%(-5.02)#6,299 |
Common Questions
What are the Top 10 Cities with the Highest Percentage of Black / African American Population in Michigan?
Top 10 Cities with the Highest Percentage of Black / African American Population in Michigan are:
#1
88.1%
#2
87.4%
#3
77.8%
#4
76.4%
#5
74.7%
#6
74.1%
#7
66.3%
#8
65.3%
#9
63.9%
#10
63.0%
What city has the Highest Percentage of Black / African American Population in Michigan?
Highland Park has the Highest Percentage of Black / African American Population in Michigan with 88.1%.
What is the Percentage of Black / African American Population in the State of Michigan?
Percentage of Black / African American Population in Michigan is 13.6%.
What is the Percentage of Black / African American Population in the United States?
Percentage of Black / African American Population in the United States is 12.5%.