Fairfield, CA Map & Demographics
Fairfield Map
Fairfield Overview
$40,600
PER CAPITA INCOME
$108,091
AVG FAMILY INCOME
$98,857
AVG HOUSEHOLD INCOME
27.5%
WAGE / INCOME GAP [ % ]
72.5¢/ $1
WAGE / INCOME GAP [ $ ]
$12,073
FAMILY INCOME DEFICIT
0.42
INEQUALITY / GINI INDEX
119,420
TOTAL POPULATION
59,319
MALE POPULATION
60,101
FEMALE POPULATION
98.70
MALES / 100 FEMALES
101.32
FEMALES / 100 MALES
35.8
MEDIAN AGE
3.6
AVG FAMILY SIZE
3.1
AVG HOUSEHOLD SIZE
60,558
LABOR FORCE [ PEOPLE ]
64.9%
PERCENT IN LABOR FORCE
5.5%
UNEMPLOYMENT RATE
Fairfield Area Codes
Income in Fairfield
Income Overview in Fairfield
Per Capita Income in Fairfield is $40,600, while median incomes of families and households are $108,091 and $98,857 respectively.
| Characteristic | Number | Measure |
| Per Capita Income | 119,420 | $40,600 |
| Median Family Income | 28,244 | $108,091 |
| Mean Family Income | 28,244 | $132,367 |
| Median Household Income | 37,593 | $98,857 |
| Mean Household Income | 37,593 | $124,268 |
| Income Deficit | 28,244 | $12,073 |
| Wage / Income Gap (%) | 119,420 | 27.50% |
| Wage / Income Gap ($) | 119,420 | 72.50¢ per $1 |
| Gini / Inequality Index | 119,420 | 0.42 |
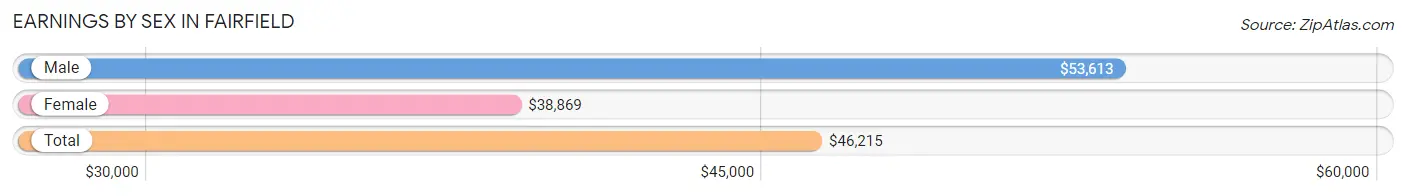
Earnings by Sex in Fairfield
Average Earnings in Fairfield are $46,215, $53,613 for men and $38,869 for women, a difference of 27.5%.
| Sex | Number | Average Earnings |
| Male | 34,023 (54.7%) | $53,613 |
| Female | 28,140 (45.3%) | $38,869 |
| Total | 62,163 (100.0%) | $46,215 |
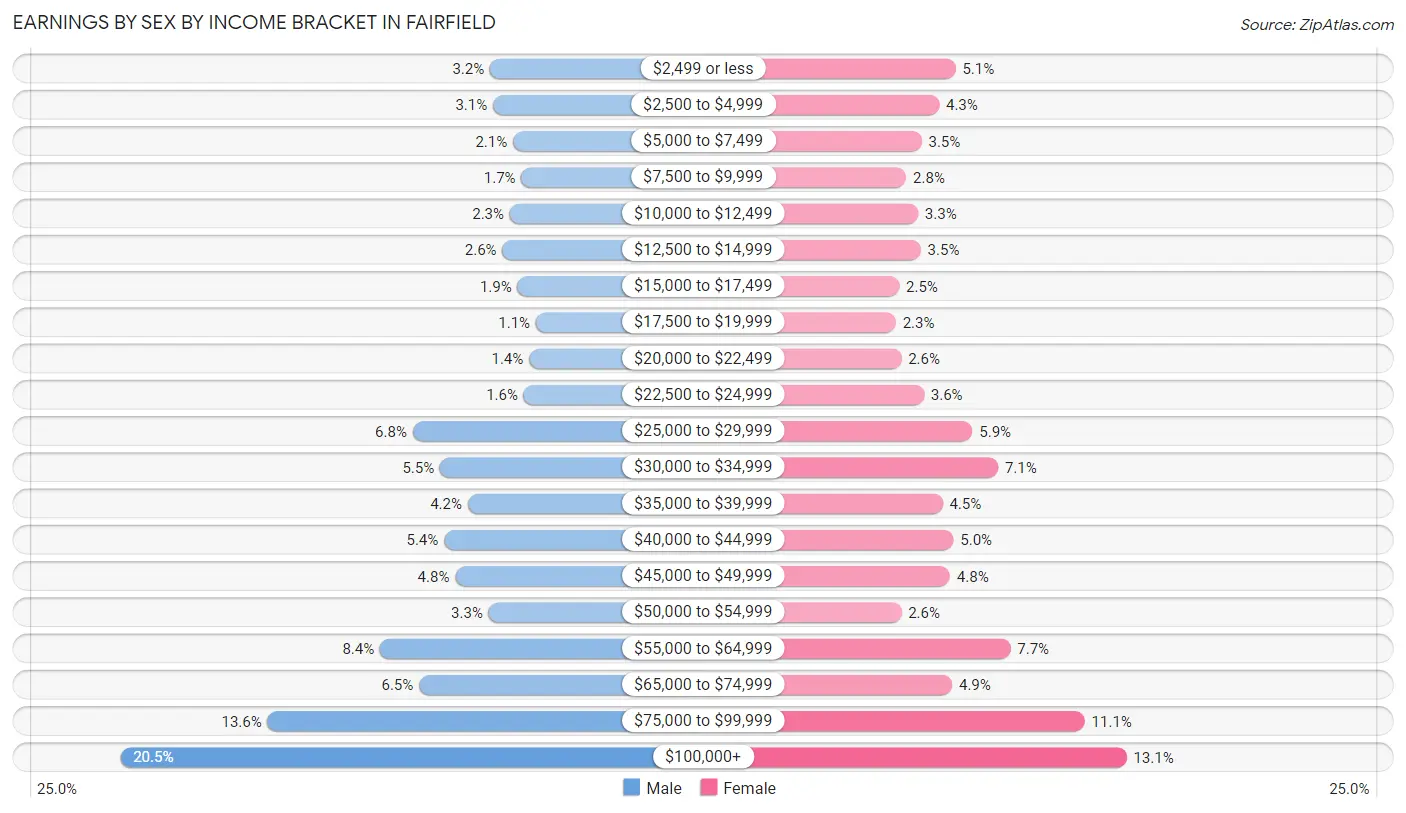
Earnings by Sex by Income Bracket in Fairfield
The most common earnings brackets in Fairfield are $100,000+ for men (6,982 | 20.5%) and $100,000+ for women (3,685 | 13.1%).
| Income | Male | Female |
| $2,499 or less | 1,089 (3.2%) | 1,432 (5.1%) |
| $2,500 to $4,999 | 1,040 (3.1%) | 1,215 (4.3%) |
| $5,000 to $7,499 | 720 (2.1%) | 984 (3.5%) |
| $7,500 to $9,999 | 587 (1.7%) | 783 (2.8%) |
| $10,000 to $12,499 | 774 (2.3%) | 936 (3.3%) |
| $12,500 to $14,999 | 892 (2.6%) | 975 (3.5%) |
| $15,000 to $17,499 | 649 (1.9%) | 689 (2.5%) |
| $17,500 to $19,999 | 357 (1.1%) | 644 (2.3%) |
| $20,000 to $22,499 | 466 (1.4%) | 717 (2.5%) |
| $22,500 to $24,999 | 552 (1.6%) | 1,017 (3.6%) |
| $25,000 to $29,999 | 2,320 (6.8%) | 1,654 (5.9%) |
| $30,000 to $34,999 | 1,884 (5.5%) | 1,993 (7.1%) |
| $35,000 to $39,999 | 1,444 (4.2%) | 1,260 (4.5%) |
| $40,000 to $44,999 | 1,820 (5.3%) | 1,404 (5.0%) |
| $45,000 to $49,999 | 1,642 (4.8%) | 1,358 (4.8%) |
| $50,000 to $54,999 | 1,110 (3.3%) | 717 (2.5%) |
| $55,000 to $64,999 | 2,840 (8.4%) | 2,156 (7.7%) |
| $65,000 to $74,999 | 2,220 (6.5%) | 1,386 (4.9%) |
| $75,000 to $99,999 | 4,635 (13.6%) | 3,135 (11.1%) |
| $100,000+ | 6,982 (20.5%) | 3,685 (13.1%) |
| Total | 34,023 (100.0%) | 28,140 (100.0%) |
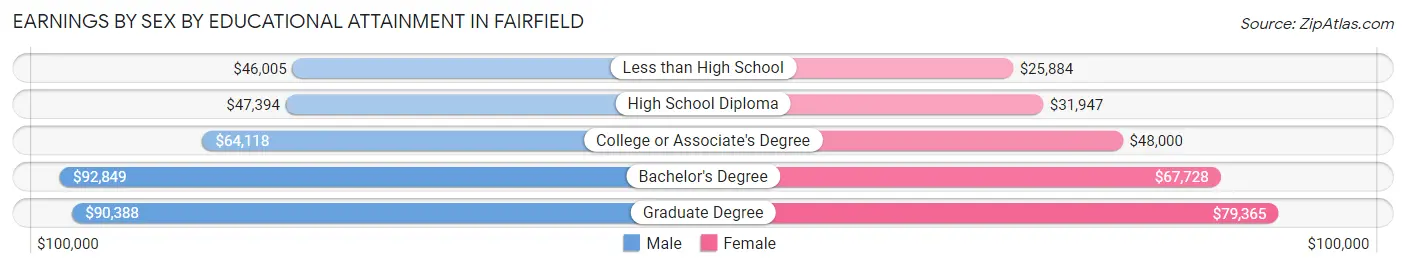
Earnings by Sex by Educational Attainment in Fairfield
Average earnings in Fairfield are $60,845 for men and $46,016 for women, a difference of 24.4%. Men with an educational attainment of bachelor's degree enjoy the highest average annual earnings of $92,849, while those with less than high school education earn the least with $46,005. Women with an educational attainment of graduate degree earn the most with the average annual earnings of $79,365, while those with less than high school education have the smallest earnings of $25,884.
| Educational Attainment | Male Income | Female Income |
| Less than High School | $46,005 | $25,884 |
| High School Diploma | $47,394 | $31,947 |
| College or Associate's Degree | $64,118 | $48,000 |
| Bachelor's Degree | $92,849 | $67,728 |
| Graduate Degree | $90,388 | $79,365 |
| Total | $60,845 | $46,016 |
Family Income in Fairfield
Family Income Brackets in Fairfield
According to the Fairfield family income data, there are 6,750 families falling into the $100,000 to $149,999 income range, which is the most common income bracket and makes up 23.9% of all families. Conversely, the $10,000 to $14,999 income bracket is the least frequent group with only 254 families (0.9%) belonging to this category.
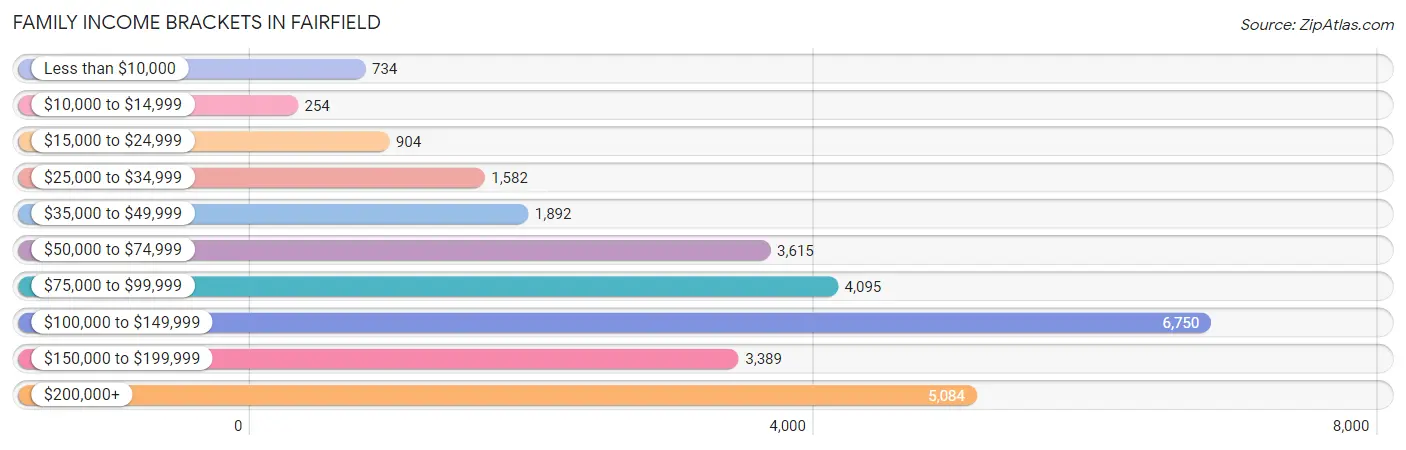
| Income Bracket | # Families | % Families |
| Less than $10,000 | 734 | 2.6% |
| $10,000 to $14,999 | 254 | 0.9% |
| $15,000 to $24,999 | 904 | 3.2% |
| $25,000 to $34,999 | 1,582 | 5.6% |
| $35,000 to $49,999 | 1,892 | 6.7% |
| $50,000 to $74,999 | 3,615 | 12.8% |
| $75,000 to $99,999 | 4,095 | 14.5% |
| $100,000 to $149,999 | 6,750 | 23.9% |
| $150,000 to $199,999 | 3,389 | 12.0% |
| $200,000+ | 5,084 | 18.0% |
Family Income by Famaliy Size in Fairfield
5-person families (3,269 | 11.6%) account for the highest median family income in Fairfield with $125,977 per family, while 2-person families (10,479 | 37.1%) have the highest median income of $45,431 per family member.
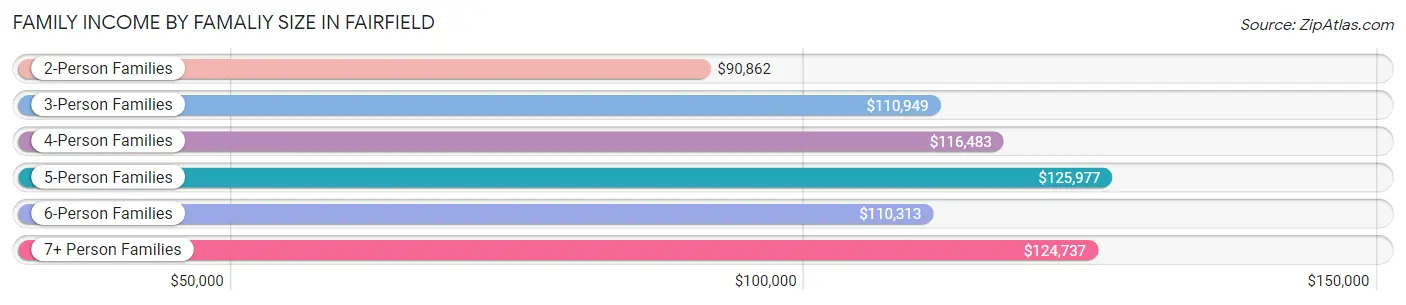
| Income Bracket | # Families | Median Income |
| 2-Person Families | 10,479 (37.1%) | $90,862 |
| 3-Person Families | 6,508 (23.0%) | $110,949 |
| 4-Person Families | 5,580 (19.8%) | $116,483 |
| 5-Person Families | 3,269 (11.6%) | $125,977 |
| 6-Person Families | 1,186 (4.2%) | $110,313 |
| 7+ Person Families | 1,222 (4.3%) | $124,737 |
| Total | 28,244 (100.0%) | $108,091 |
Family Income by Number of Earners in Fairfield
The median family income in Fairfield is $108,091, with families comprising 3+ earners (4,539) having the highest median family income of $158,250, while families with no earners (3,453) have the lowest median family income of $61,815, accounting for 16.1% and 12.2% of families, respectively.
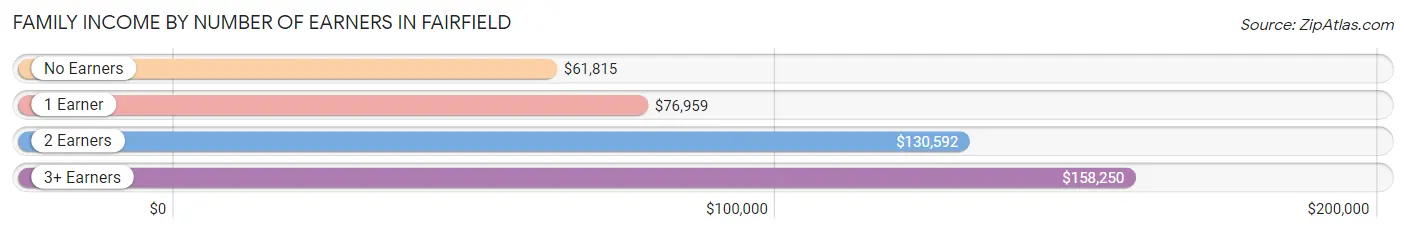
| Number of Earners | # Families | Median Income |
| No Earners | 3,453 (12.2%) | $61,815 |
| 1 Earner | 9,215 (32.6%) | $76,959 |
| 2 Earners | 11,037 (39.1%) | $130,592 |
| 3+ Earners | 4,539 (16.1%) | $158,250 |
| Total | 28,244 (100.0%) | $108,091 |
Household Income in Fairfield
Household Income Brackets in Fairfield
With 8,383 households falling in the category, the $100,000 to $149,999 income range is the most frequent in Fairfield, accounting for 22.3% of all households. In contrast, only 639 households (1.7%) fall into the $10,000 to $14,999 income bracket, making it the least populous group.
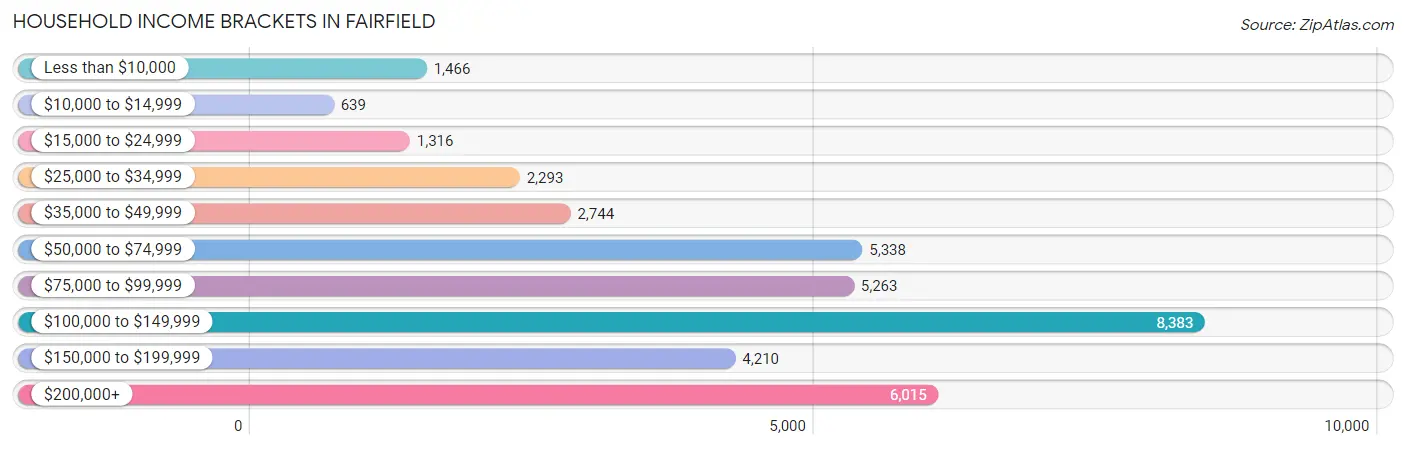
| Income Bracket | # Households | % Households |
| Less than $10,000 | 1,466 | 3.9% |
| $10,000 to $14,999 | 639 | 1.7% |
| $15,000 to $24,999 | 1,316 | 3.5% |
| $25,000 to $34,999 | 2,293 | 6.1% |
| $35,000 to $49,999 | 2,744 | 7.3% |
| $50,000 to $74,999 | 5,338 | 14.2% |
| $75,000 to $99,999 | 5,263 | 14.0% |
| $100,000 to $149,999 | 8,383 | 22.3% |
| $150,000 to $199,999 | 4,210 | 11.2% |
| $200,000+ | 6,015 | 16.0% |
Household Income by Householder Age in Fairfield
The median household income in Fairfield is $98,857, with the highest median household income of $121,178 found in the 45 to 64 years age bracket for the primary householder. A total of 13,381 households (35.6%) fall into this category. Meanwhile, the 15 to 24 years age bracket for the primary householder has the lowest median household income of $54,479, with 1,223 households (3.3%) in this group.
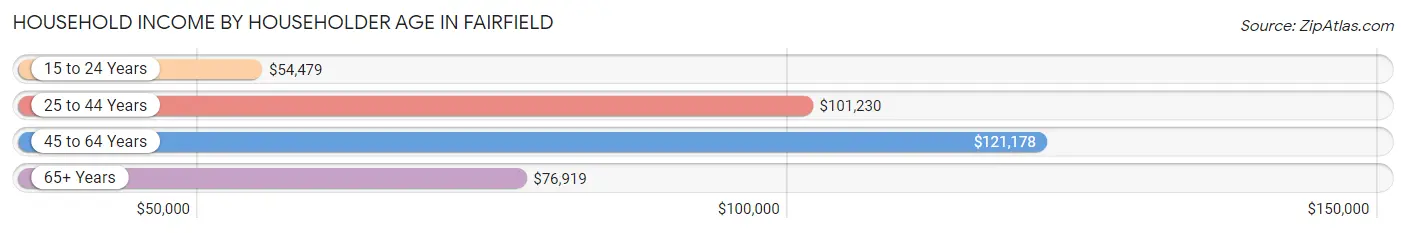
| Income Bracket | # Households | Median Income |
| 15 to 24 Years | 1,223 (3.3%) | $54,479 |
| 25 to 44 Years | 13,776 (36.6%) | $101,230 |
| 45 to 64 Years | 13,381 (35.6%) | $121,178 |
| 65+ Years | 9,213 (24.5%) | $76,919 |
| Total | 37,593 (100.0%) | $98,857 |
Poverty in Fairfield
Income Below Poverty by Sex and Age in Fairfield
With 8.5% poverty level for males and 10.0% for females among the residents of Fairfield, 5 year old males and 16 and 17 year old females are the most vulnerable to poverty, with 228 males (28.9%) and 332 females (19.5%) in their respective age groups living below the poverty level.
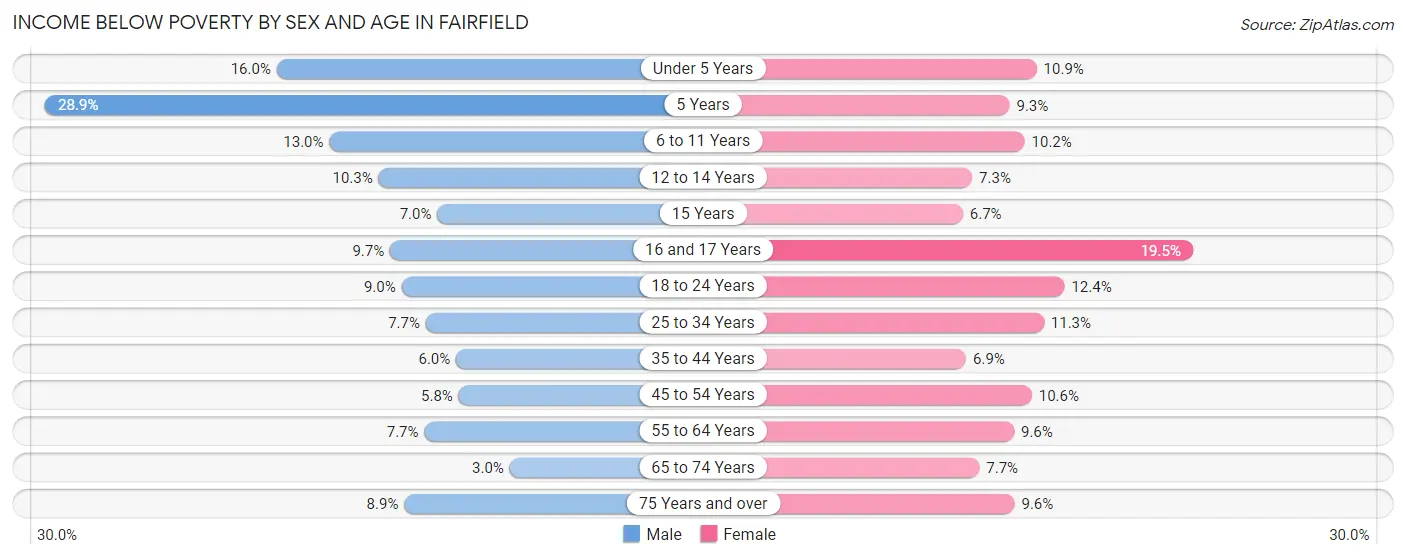
| Age Bracket | Male | Female |
| Under 5 Years | 669 (16.0%) | 465 (10.8%) |
| 5 Years | 228 (28.9%) | 68 (9.3%) |
| 6 to 11 Years | 650 (13.0%) | 447 (10.2%) |
| 12 to 14 Years | 237 (10.3%) | 195 (7.3%) |
| 15 Years | 38 (7.0%) | 66 (6.7%) |
| 16 and 17 Years | 160 (9.7%) | 332 (19.5%) |
| 18 to 24 Years | 492 (9.0%) | 671 (12.4%) |
| 25 to 34 Years | 725 (7.7%) | 943 (11.3%) |
| 35 to 44 Years | 480 (6.0%) | 556 (6.9%) |
| 45 to 54 Years | 419 (5.8%) | 795 (10.6%) |
| 55 to 64 Years | 480 (7.7%) | 651 (9.6%) |
| 65 to 74 Years | 144 (3.0%) | 366 (7.7%) |
| 75 Years and over | 240 (8.9%) | 382 (9.6%) |
| Total | 4,962 (8.5%) | 5,937 (10.0%) |
Income Above Poverty by Sex and Age in Fairfield
According to the poverty statistics in Fairfield, males aged 65 to 74 years and females aged 15 years are the age groups that are most secure financially, with 97.0% of males and 93.3% of females in these age groups living above the poverty line.
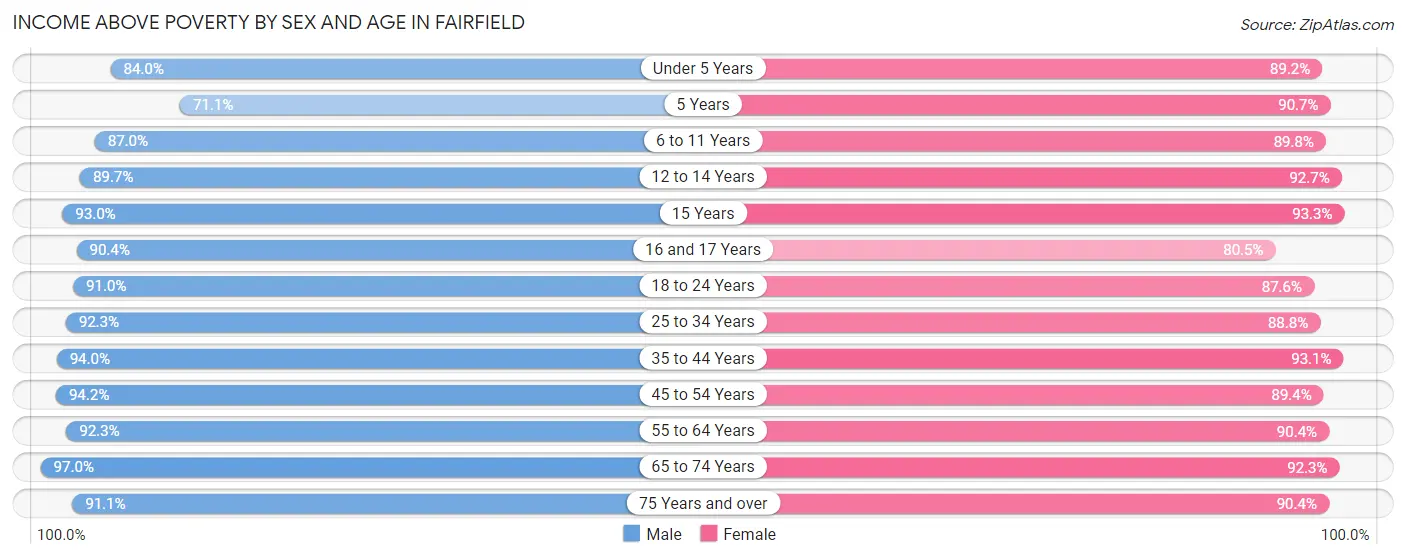
| Age Bracket | Male | Female |
| Under 5 Years | 3,524 (84.0%) | 3,819 (89.1%) |
| 5 Years | 562 (71.1%) | 660 (90.7%) |
| 6 to 11 Years | 4,340 (87.0%) | 3,944 (89.8%) |
| 12 to 14 Years | 2,067 (89.7%) | 2,491 (92.7%) |
| 15 Years | 503 (93.0%) | 913 (93.3%) |
| 16 and 17 Years | 1,498 (90.3%) | 1,367 (80.5%) |
| 18 to 24 Years | 4,967 (91.0%) | 4,740 (87.6%) |
| 25 to 34 Years | 8,745 (92.3%) | 7,440 (88.7%) |
| 35 to 44 Years | 7,563 (94.0%) | 7,480 (93.1%) |
| 45 to 54 Years | 6,763 (94.2%) | 6,721 (89.4%) |
| 55 to 64 Years | 5,721 (92.3%) | 6,138 (90.4%) |
| 65 to 74 Years | 4,680 (97.0%) | 4,410 (92.3%) |
| 75 Years and over | 2,469 (91.1%) | 3,587 (90.4%) |
| Total | 53,402 (91.5%) | 53,710 (90.0%) |
Income Below Poverty Among Married-Couple Families in Fairfield
The poverty statistics for married-couple families in Fairfield show that 3.8% or 765 of the total 20,050 families live below the poverty line. Families with 3 or 4 children have the highest poverty rate of 9.7%, comprising of 188 families. On the other hand, families with 5 or more children have the lowest poverty rate of 0.0%, which includes 0 families.
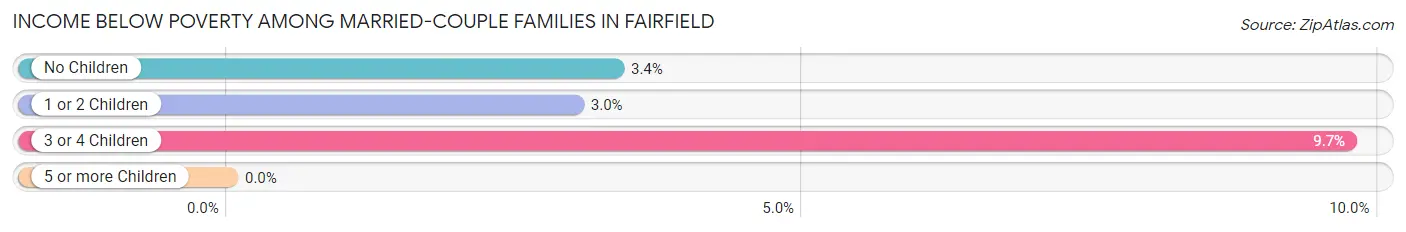
| Children | Above Poverty | Below Poverty |
| No Children | 9,994 (96.6%) | 348 (3.4%) |
| 1 or 2 Children | 7,387 (97.0%) | 229 (3.0%) |
| 3 or 4 Children | 1,743 (90.3%) | 188 (9.7%) |
| 5 or more Children | 161 (100.0%) | 0 (0.0%) |
| Total | 19,285 (96.2%) | 765 (3.8%) |
Income Below Poverty Among Single-Parent Households in Fairfield
According to the poverty data in Fairfield, 7.0% or 192 single-father households and 16.5% or 901 single-mother households are living below the poverty line. Among single-father households, those with 3 or 4 children have the highest poverty rate, with 49 households (14.7%) experiencing poverty. Likewise, among single-mother households, those with 5 or more children have the highest poverty rate, with 10 households (100.0%) falling below the poverty line.
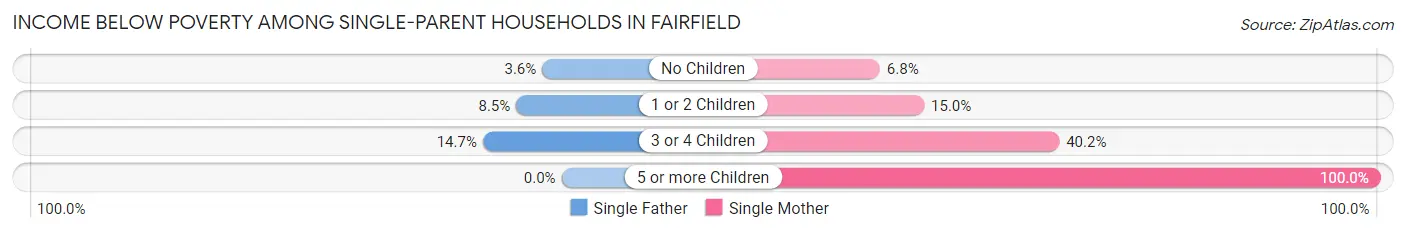
| Children | Single Father | Single Mother |
| No Children | 44 (3.6%) | 136 (6.8%) |
| 1 or 2 Children | 99 (8.5%) | 372 (15.0%) |
| 3 or 4 Children | 49 (14.7%) | 383 (40.2%) |
| 5 or more Children | 0 (0.0%) | 10 (100.0%) |
| Total | 192 (7.0%) | 901 (16.5%) |
Income Below Poverty Among Married-Couple vs Single-Parent Households in Fairfield
The poverty data for Fairfield shows that 765 of the married-couple family households (3.8%) and 1,093 of the single-parent households (13.3%) are living below the poverty level. Within the married-couple family households, those with 3 or 4 children have the highest poverty rate, with 188 households (9.7%) falling below the poverty line. Among the single-parent households, those with 5 or more children have the highest poverty rate, with 10 household (58.8%) living below poverty.
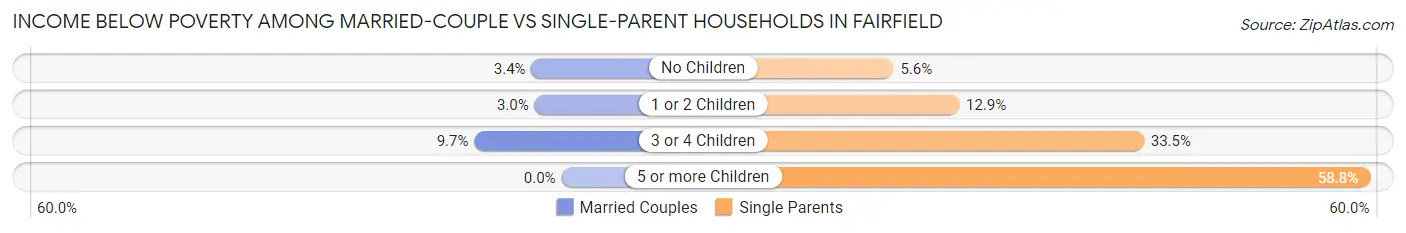
| Children | Married-Couple Families | Single-Parent Households |
| No Children | 348 (3.4%) | 180 (5.6%) |
| 1 or 2 Children | 229 (3.0%) | 471 (12.9%) |
| 3 or 4 Children | 188 (9.7%) | 432 (33.5%) |
| 5 or more Children | 0 (0.0%) | 10 (58.8%) |
| Total | 765 (3.8%) | 1,093 (13.3%) |
Race in Fairfield
The most populous races in Fairfield are White / Caucasian (47,911 | 40.1%), Hispanic or Latino (35,698 | 29.9%), and Asian (21,675 | 18.1%).
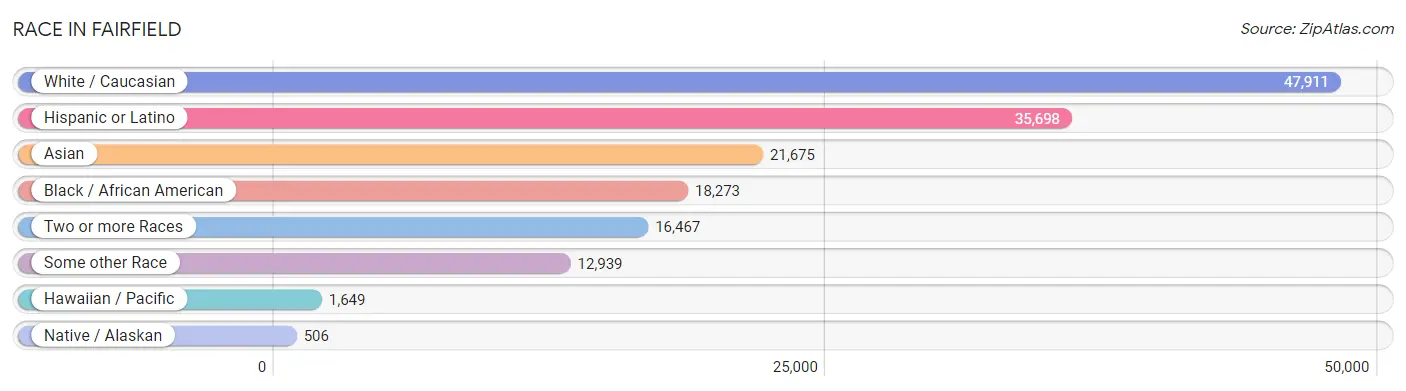
| Race | # Population | % Population |
| Asian | 21,675 | 18.1% |
| Black / African American | 18,273 | 15.3% |
| Hawaiian / Pacific | 1,649 | 1.4% |
| Hispanic or Latino | 35,698 | 29.9% |
| Native / Alaskan | 506 | 0.4% |
| White / Caucasian | 47,911 | 40.1% |
| Two or more Races | 16,467 | 13.8% |
| Some other Race | 12,939 | 10.8% |
| Total | 119,420 | 100.0% |
Ancestry in Fairfield
The most populous ancestries reported in Fairfield are Mexican (29,887 | 25.0%), Korean (16,599 | 13.9%), European (8,162 | 6.8%), Irish (6,153 | 5.1%), and German (5,537 | 4.6%), together accounting for 55.5% of all Fairfield residents.
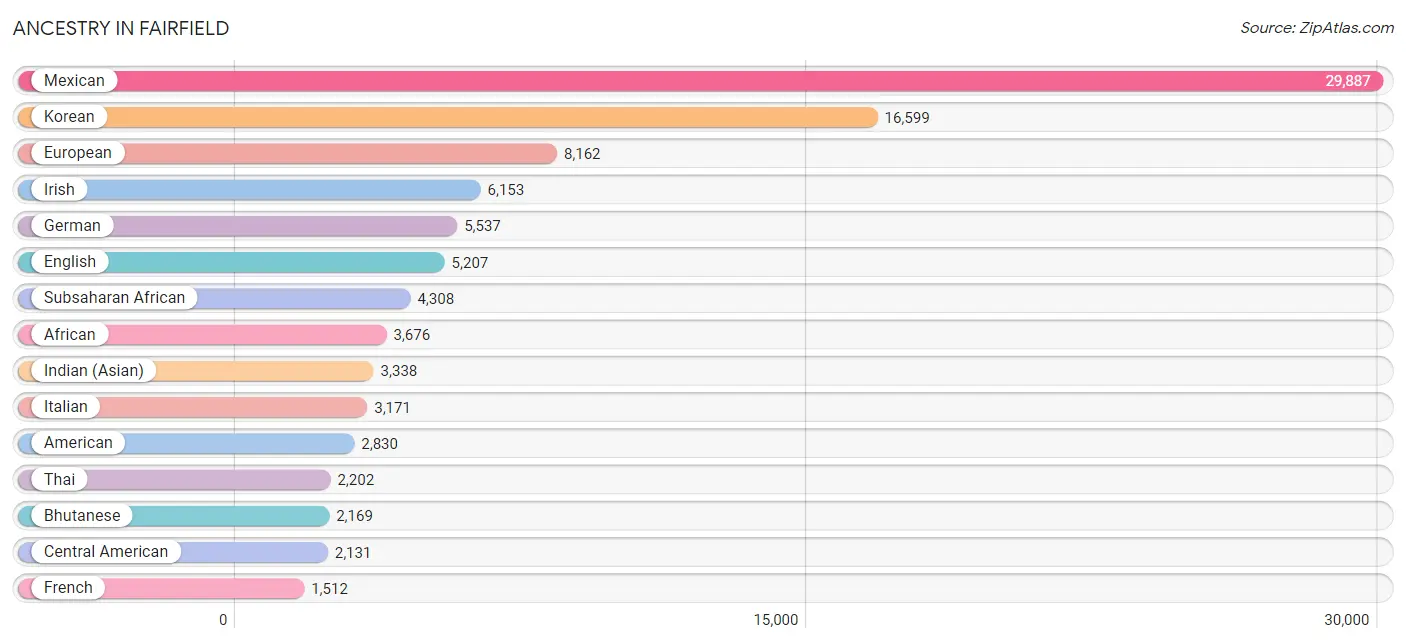
| Ancestry | # Population | % Population |
| Afghan | 135 | 0.1% |
| African | 3,676 | 3.1% |
| American | 2,830 | 2.4% |
| Apache | 48 | 0.0% |
| Arab | 620 | 0.5% |
| Argentinean | 37 | 0.0% |
| Armenian | 94 | 0.1% |
| Austrian | 117 | 0.1% |
| Bangladeshi | 237 | 0.2% |
| Basque | 47 | 0.0% |
| Belgian | 57 | 0.1% |
| Belizean | 55 | 0.1% |
| Bermudan | 10 | 0.0% |
| Bhutanese | 2,169 | 1.8% |
| Blackfeet | 123 | 0.1% |
| Bolivian | 80 | 0.1% |
| Brazilian | 142 | 0.1% |
| British | 412 | 0.4% |
| British West Indian | 41 | 0.0% |
| Bulgarian | 22 | 0.0% |
| Burmese | 1,420 | 1.2% |
| Cambodian | 4 | 0.0% |
| Canadian | 60 | 0.1% |
| Celtic | 17 | 0.0% |
| Central American | 2,131 | 1.8% |
| Central American Indian | 37 | 0.0% |
| Cherokee | 364 | 0.3% |
| Chickasaw | 62 | 0.1% |
| Chilean | 114 | 0.1% |
| Chippewa | 108 | 0.1% |
| Choctaw | 61 | 0.1% |
| Colombian | 45 | 0.0% |
| Comanche | 23 | 0.0% |
| Cree | 12 | 0.0% |
| Creek | 7 | 0.0% |
| Croatian | 125 | 0.1% |
| Cuban | 127 | 0.1% |
| Czech | 33 | 0.0% |
| Czechoslovakian | 34 | 0.0% |
| Danish | 307 | 0.3% |
| Dominican | 9 | 0.0% |
| Dutch | 522 | 0.4% |
| Eastern European | 175 | 0.2% |
| Ecuadorian | 64 | 0.1% |
| Egyptian | 66 | 0.1% |
| English | 5,207 | 4.4% |
| Estonian | 13 | 0.0% |
| Ethiopian | 132 | 0.1% |
| European | 8,162 | 6.8% |
| Filipino | 10 | 0.0% |
| Finnish | 120 | 0.1% |
| French | 1,512 | 1.3% |
| French Canadian | 143 | 0.1% |
| German | 5,537 | 4.6% |
| German Russian | 39 | 0.0% |
| Ghanaian | 104 | 0.1% |
| Greek | 280 | 0.2% |
| Guamanian / Chamorro | 1,322 | 1.1% |
| Guatemalan | 611 | 0.5% |
| Guyanese | 10 | 0.0% |
| Haitian | 12 | 0.0% |
| Honduran | 84 | 0.1% |
| Hungarian | 117 | 0.1% |
| Icelander | 7 | 0.0% |
| Indian (Asian) | 3,338 | 2.8% |
| Indonesian | 60 | 0.1% |
| Iranian | 327 | 0.3% |
| Iraqi | 21 | 0.0% |
| Irish | 6,153 | 5.1% |
| Iroquois | 52 | 0.0% |
| Israeli | 14 | 0.0% |
| Italian | 3,171 | 2.7% |
| Jamaican | 100 | 0.1% |
| Japanese | 80 | 0.1% |
| Jordanian | 3 | 0.0% |
| Kenyan | 44 | 0.0% |
| Korean | 16,599 | 13.9% |
| Laotian | 320 | 0.3% |
| Lebanese | 15 | 0.0% |
| Lithuanian | 167 | 0.1% |
| Malaysian | 701 | 0.6% |
| Maltese | 50 | 0.0% |
| Mexican | 29,887 | 25.0% |
| Mexican American Indian | 330 | 0.3% |
| Mongolian | 16 | 0.0% |
| Moroccan | 64 | 0.1% |
| Native Hawaiian | 656 | 0.5% |
| Navajo | 13 | 0.0% |
| Nepalese | 143 | 0.1% |
| New Zealander | 47 | 0.0% |
| Nicaraguan | 266 | 0.2% |
| Nigerian | 241 | 0.2% |
| Northern European | 148 | 0.1% |
| Norwegian | 832 | 0.7% |
| Osage | 19 | 0.0% |
| Ottawa | 2 | 0.0% |
| Paiute | 17 | 0.0% |
| Pakistani | 530 | 0.4% |
| Palestinian | 260 | 0.2% |
| Panamanian | 35 | 0.0% |
| Paraguayan | 1 | 0.0% |
| Peruvian | 359 | 0.3% |
| Polish | 905 | 0.8% |
| Portuguese | 1,059 | 0.9% |
| Pueblo | 32 | 0.0% |
| Puerto Rican | 1,084 | 0.9% |
| Romanian | 172 | 0.1% |
| Russian | 474 | 0.4% |
| Salvadoran | 1,135 | 0.9% |
| Samoan | 655 | 0.5% |
| Scandinavian | 225 | 0.2% |
| Scotch-Irish | 587 | 0.5% |
| Scottish | 910 | 0.8% |
| Senegalese | 9 | 0.0% |
| Serbian | 184 | 0.2% |
| Sioux | 29 | 0.0% |
| Slavic | 50 | 0.0% |
| Slovak | 49 | 0.0% |
| Slovene | 60 | 0.1% |
| South African | 8 | 0.0% |
| South American | 1,095 | 0.9% |
| Spaniard | 264 | 0.2% |
| Spanish | 521 | 0.4% |
| Sri Lankan | 1,130 | 0.9% |
| Subsaharan African | 4,308 | 3.6% |
| Sudanese | 19 | 0.0% |
| Swedish | 514 | 0.4% |
| Swiss | 175 | 0.2% |
| Syrian | 36 | 0.0% |
| Thai | 2,202 | 1.8% |
| Tlingit-Haida | 87 | 0.1% |
| Tohono O'Odham | 87 | 0.1% |
| Tongan | 127 | 0.1% |
| Trinidadian and Tobagonian | 31 | 0.0% |
| Tsimshian | 23 | 0.0% |
| Turkish | 22 | 0.0% |
| Ukrainian | 300 | 0.3% |
| Uruguayan | 251 | 0.2% |
| Ute | 12 | 0.0% |
| Venezuelan | 122 | 0.1% |
| Welsh | 399 | 0.3% |
| West Indian | 128 | 0.1% |
| Yaqui | 4 | 0.0% | View All 143 Rows |
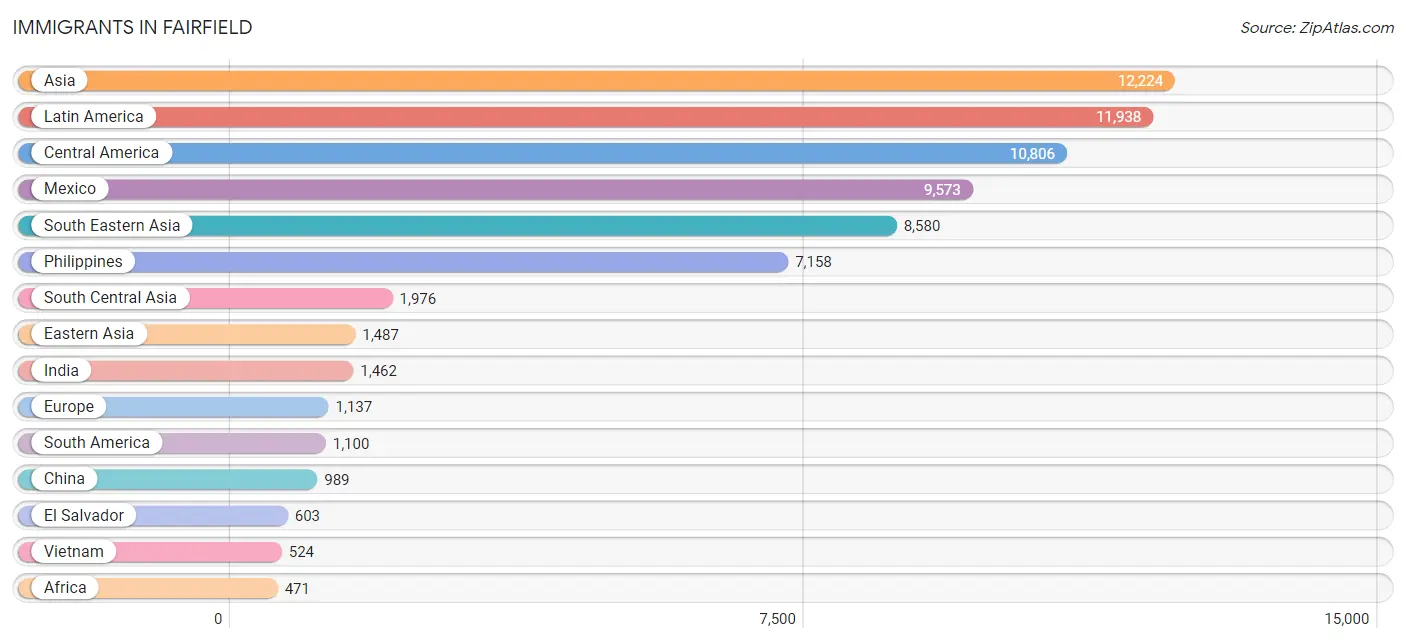
Immigrants in Fairfield
The most numerous immigrant groups reported in Fairfield came from Asia (12,224 | 10.2%), Latin America (11,938 | 10.0%), Central America (10,806 | 9.0%), Mexico (9,573 | 8.0%), and South Eastern Asia (8,580 | 7.2%), together accounting for 44.5% of all Fairfield residents.
| Immigration Origin | # Population | % Population |
| Afghanistan | 170 | 0.1% |
| Africa | 471 | 0.4% |
| Argentina | 37 | 0.0% |
| Asia | 12,224 | 10.2% |
| Australia | 39 | 0.0% |
| Bangladesh | 1 | 0.0% |
| Belarus | 19 | 0.0% |
| Belgium | 23 | 0.0% |
| Bolivia | 4 | 0.0% |
| Brazil | 273 | 0.2% |
| Canada | 427 | 0.4% |
| Caribbean | 32 | 0.0% |
| Central America | 10,806 | 9.0% |
| Chile | 100 | 0.1% |
| China | 989 | 0.8% |
| Colombia | 4 | 0.0% |
| Congo | 34 | 0.0% |
| Croatia | 34 | 0.0% |
| Cuba | 20 | 0.0% |
| Denmark | 27 | 0.0% |
| Eastern Africa | 173 | 0.1% |
| Eastern Asia | 1,487 | 1.3% |
| Eastern Europe | 246 | 0.2% |
| Ecuador | 55 | 0.1% |
| Egypt | 23 | 0.0% |
| El Salvador | 603 | 0.5% |
| England | 90 | 0.1% |
| Ethiopia | 112 | 0.1% |
| Europe | 1,137 | 0.9% |
| Fiji | 172 | 0.1% |
| France | 18 | 0.0% |
| Germany | 231 | 0.2% |
| Ghana | 43 | 0.0% |
| Greece | 146 | 0.1% |
| Guatemala | 399 | 0.3% |
| Haiti | 12 | 0.0% |
| Honduras | 62 | 0.1% |
| Hong Kong | 129 | 0.1% |
| Hungary | 41 | 0.0% |
| India | 1,462 | 1.2% |
| Indonesia | 152 | 0.1% |
| Iran | 231 | 0.2% |
| Iraq | 17 | 0.0% |
| Italy | 132 | 0.1% |
| Japan | 187 | 0.2% |
| Jordan | 67 | 0.1% |
| Kenya | 44 | 0.0% |
| Korea | 311 | 0.3% |
| Laos | 310 | 0.3% |
| Latin America | 11,938 | 10.0% |
| Malaysia | 65 | 0.1% |
| Mexico | 9,573 | 8.0% |
| Micronesia | 15 | 0.0% |
| Middle Africa | 34 | 0.0% |
| Morocco | 25 | 0.0% |
| Nepal | 31 | 0.0% |
| Netherlands | 44 | 0.0% |
| Nicaragua | 116 | 0.1% |
| Nigeria | 51 | 0.0% |
| Northern Africa | 75 | 0.1% |
| Northern Europe | 253 | 0.2% |
| Oceania | 359 | 0.3% |
| Pakistan | 57 | 0.1% |
| Panama | 53 | 0.0% |
| Peru | 239 | 0.2% |
| Philippines | 7,158 | 6.0% |
| Poland | 33 | 0.0% |
| Portugal | 33 | 0.0% |
| Russia | 103 | 0.1% |
| Scotland | 41 | 0.0% |
| Senegal | 9 | 0.0% |
| South Africa | 57 | 0.1% |
| South America | 1,100 | 0.9% |
| South Central Asia | 1,976 | 1.7% |
| South Eastern Asia | 8,580 | 7.2% |
| Southern Europe | 311 | 0.3% |
| Sri Lanka | 24 | 0.0% |
| Sudan | 2 | 0.0% |
| Sweden | 7 | 0.0% |
| Switzerland | 11 | 0.0% |
| Taiwan | 66 | 0.1% |
| Thailand | 339 | 0.3% |
| Turkey | 20 | 0.0% |
| Uganda | 17 | 0.0% |
| Ukraine | 4 | 0.0% |
| Uruguay | 251 | 0.2% |
| Venezuela | 136 | 0.1% |
| Vietnam | 524 | 0.4% |
| Western Africa | 132 | 0.1% |
| Western Asia | 124 | 0.1% |
| Western Europe | 327 | 0.3% | View All 91 Rows |
Sex and Age in Fairfield
Sex and Age in Fairfield
The most populous age groups in Fairfield are 25 to 29 Years (5,091 | 8.6%) for men and 25 to 29 Years (4,368 | 7.3%) for women.
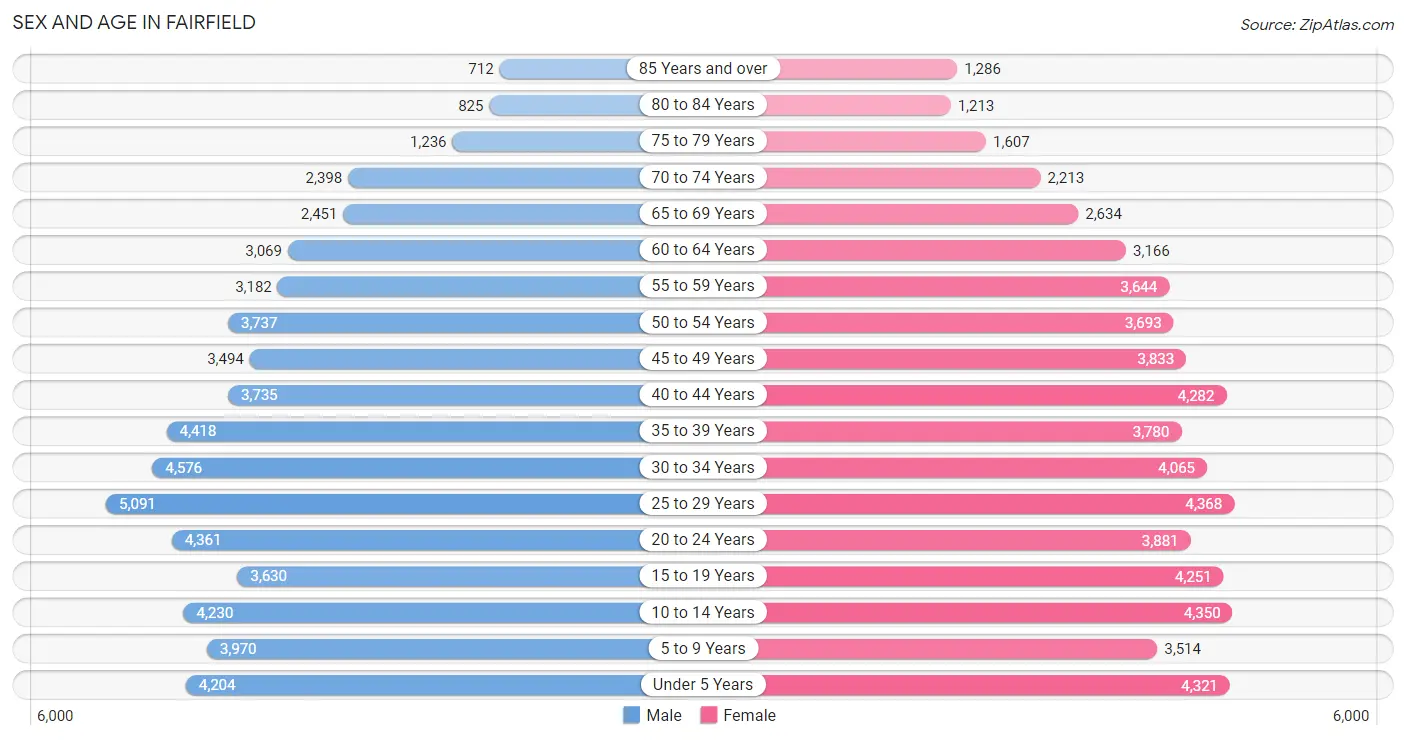
| Age Bracket | Male | Female |
| Under 5 Years | 4,204 (7.1%) | 4,321 (7.2%) |
| 5 to 9 Years | 3,970 (6.7%) | 3,514 (5.9%) |
| 10 to 14 Years | 4,230 (7.1%) | 4,350 (7.2%) |
| 15 to 19 Years | 3,630 (6.1%) | 4,251 (7.1%) |
| 20 to 24 Years | 4,361 (7.3%) | 3,881 (6.5%) |
| 25 to 29 Years | 5,091 (8.6%) | 4,368 (7.3%) |
| 30 to 34 Years | 4,576 (7.7%) | 4,065 (6.8%) |
| 35 to 39 Years | 4,418 (7.4%) | 3,780 (6.3%) |
| 40 to 44 Years | 3,735 (6.3%) | 4,282 (7.1%) |
| 45 to 49 Years | 3,494 (5.9%) | 3,833 (6.4%) |
| 50 to 54 Years | 3,737 (6.3%) | 3,693 (6.1%) |
| 55 to 59 Years | 3,182 (5.4%) | 3,644 (6.1%) |
| 60 to 64 Years | 3,069 (5.2%) | 3,166 (5.3%) |
| 65 to 69 Years | 2,451 (4.1%) | 2,634 (4.4%) |
| 70 to 74 Years | 2,398 (4.0%) | 2,213 (3.7%) |
| 75 to 79 Years | 1,236 (2.1%) | 1,607 (2.7%) |
| 80 to 84 Years | 825 (1.4%) | 1,213 (2.0%) |
| 85 Years and over | 712 (1.2%) | 1,286 (2.1%) |
| Total | 59,319 (100.0%) | 60,101 (100.0%) |
Families and Households in Fairfield
Median Family Size in Fairfield
The median family size in Fairfield is 3.56 persons per family, with single female/mother families (5,462 | 19.3%) accounting for the largest median family size of 3.65 persons per family. On the other hand, single male/father families (2,732 | 9.7%) represent the smallest median family size with 3.03 persons per family.
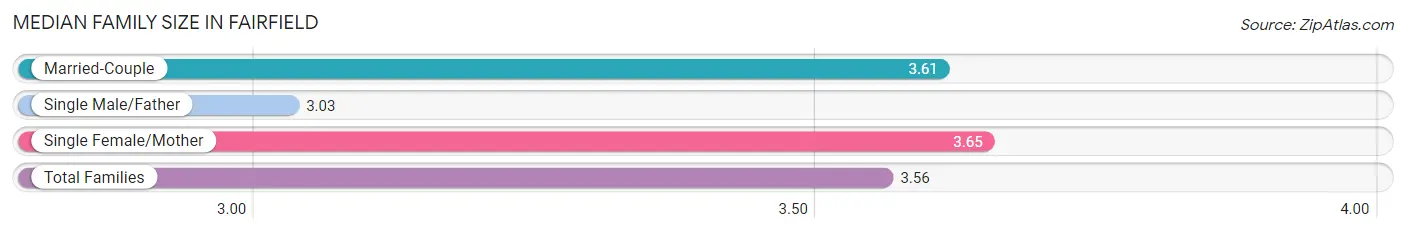
| Family Type | # Families | Family Size |
| Married-Couple | 20,050 (71.0%) | 3.61 |
| Single Male/Father | 2,732 (9.7%) | 3.03 |
| Single Female/Mother | 5,462 (19.3%) | 3.65 |
| Total Families | 28,244 (100.0%) | 3.56 |
Median Household Size in Fairfield
The median household size in Fairfield is 3.13 persons per household, with single female/mother households (5,462 | 14.5%) accounting for the largest median household size of 4.05 persons per household. non-family households (9,349 | 24.9%) represent the smallest median household size with 1.35 persons per household.
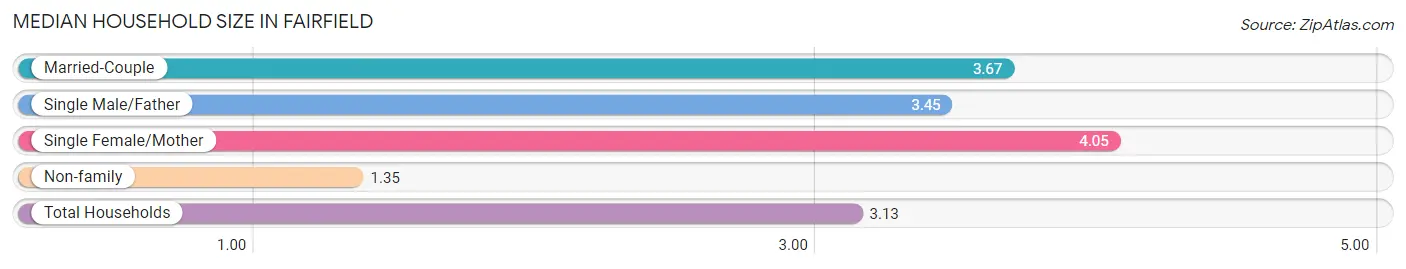
| Household Type | # Households | Household Size |
| Married-Couple | 20,050 (53.3%) | 3.67 |
| Single Male/Father | 2,732 (7.3%) | 3.45 |
| Single Female/Mother | 5,462 (14.5%) | 4.05 |
| Non-family | 9,349 (24.9%) | 1.35 |
| Total Households | 37,593 (100.0%) | 3.13 |
Household Size by Marriage Status in Fairfield
Out of a total of 37,593 households in Fairfield, 28,244 (75.1%) are family households, while 9,349 (24.9%) are nonfamily households. The most numerous type of family households are 2-person households, comprising 9,071, and the most common type of nonfamily households are 1-person households, comprising 7,142.
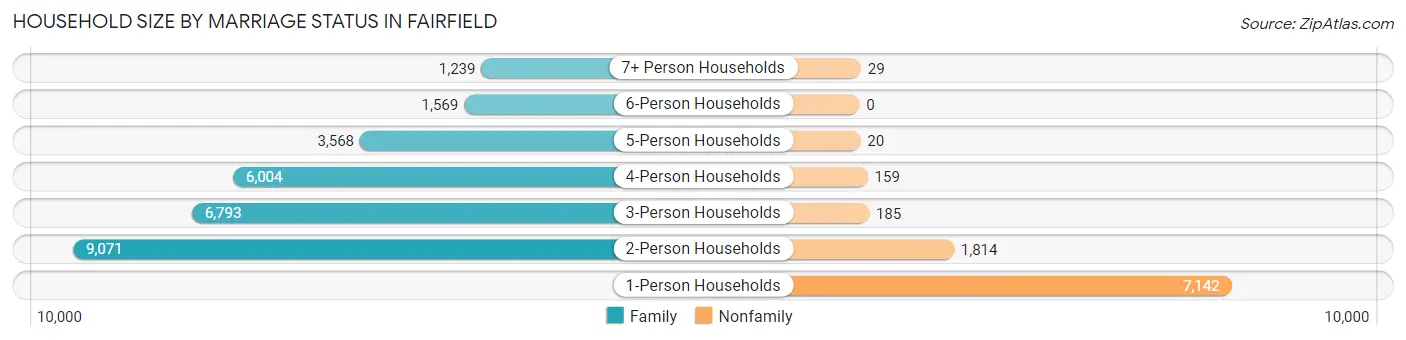
| Household Size | Family Households | Nonfamily Households |
| 1-Person Households | - | 7,142 (19.0%) |
| 2-Person Households | 9,071 (24.1%) | 1,814 (4.8%) |
| 3-Person Households | 6,793 (18.1%) | 185 (0.5%) |
| 4-Person Households | 6,004 (16.0%) | 159 (0.4%) |
| 5-Person Households | 3,568 (9.5%) | 20 (0.1%) |
| 6-Person Households | 1,569 (4.2%) | 0 (0.0%) |
| 7+ Person Households | 1,239 (3.3%) | 29 (0.1%) |
| Total | 28,244 (75.1%) | 9,349 (24.9%) |
Female Fertility in Fairfield
Fertility by Age in Fairfield
Average fertility rate in Fairfield is 63.0 births per 1,000 women. Women in the age bracket of 20 to 34 years have the highest fertility rate with 118.0 births per 1,000 women. Women in the age bracket of 20 to 34 years acount for 78.6% of all women with births.
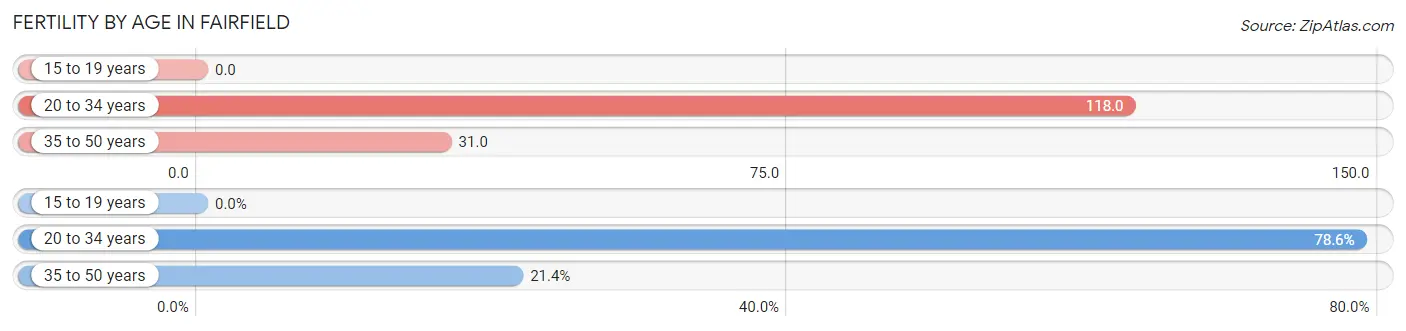
| Age Bracket | Women with Births | Births / 1,000 Women |
| 15 to 19 years | 0 (0.0%) | 0.0 |
| 20 to 34 years | 1,452 (78.6%) | 118.0 |
| 35 to 50 years | 395 (21.4%) | 31.0 |
| Total | 1,847 (100.0%) | 63.0 |
Fertility by Age by Marriage Status in Fairfield
59.2% of women with births (1,847) in Fairfield are married. The highest percentage of unmarried women with births falls into 20 to 34 years age bracket with 45.0% of them unmarried at the time of birth, while the lowest percentage of unmarried women with births belong to 35 to 50 years age bracket with 25.3% of them unmarried.
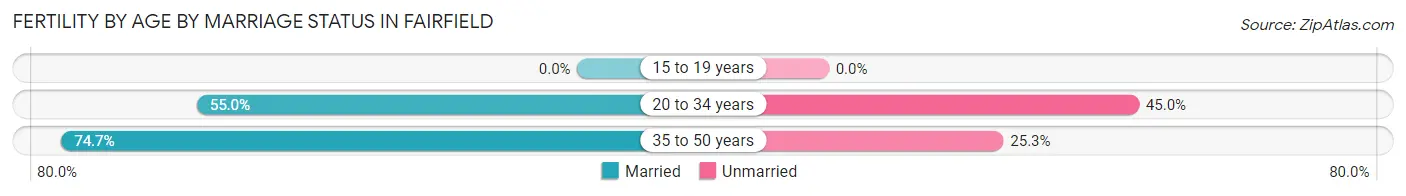
| Age Bracket | Married | Unmarried |
| 15 to 19 years | 0 (0.0%) | 0 (0.0%) |
| 20 to 34 years | 799 (55.0%) | 653 (45.0%) |
| 35 to 50 years | 295 (74.7%) | 100 (25.3%) |
| Total | 1,093 (59.2%) | 754 (40.8%) |
Fertility by Education in Fairfield
Average fertility rate in Fairfield is 63.0 births per 1,000 women. Women with the education attainment of high school diploma have the highest fertility rate of 77.0 births per 1,000 women, while women with the education attainment of less than high school have the lowest fertility at 39.0 births per 1,000 women. Women with the education attainment of college or associate's degree represent 32.5% of all women with births.
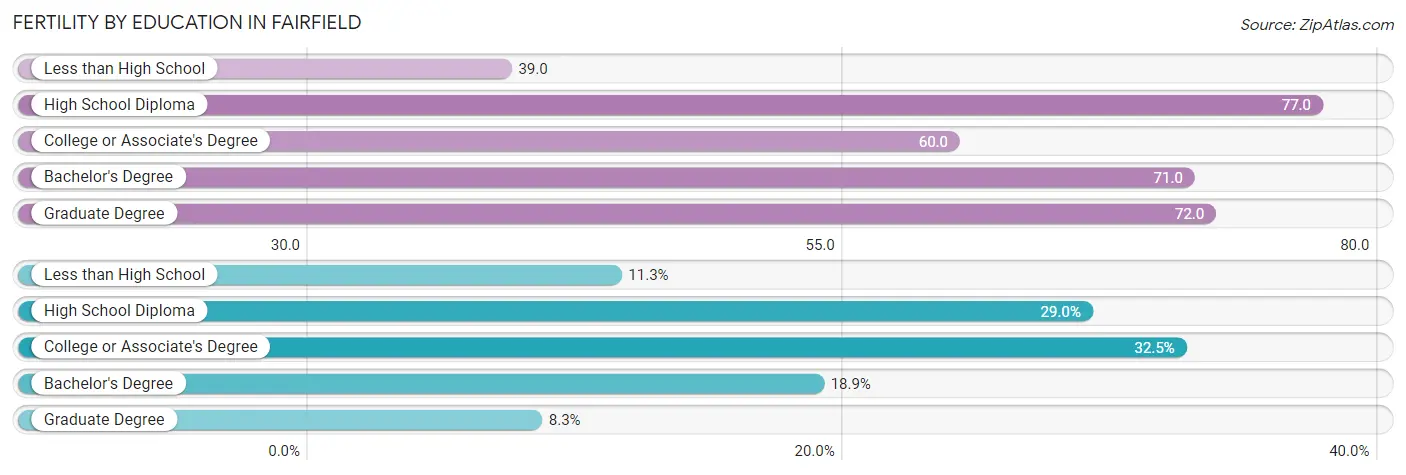
| Educational Attainment | Women with Births | Births / 1,000 Women |
| Less than High School | 209 (11.3%) | 39.0 |
| High School Diploma | 535 (29.0%) | 77.0 |
| College or Associate's Degree | 600 (32.5%) | 60.0 |
| Bachelor's Degree | 349 (18.9%) | 71.0 |
| Graduate Degree | 154 (8.3%) | 72.0 |
| Total | 1,847 (100.0%) | 63.0 |
Fertility by Education by Marriage Status in Fairfield
40.8% of women with births in Fairfield are unmarried. Women with the educational attainment of graduate degree are most likely to be married with 82.5% of them married at childbirth, while women with the educational attainment of less than high school are least likely to be married with 75.1% of them unmarried at childbirth.
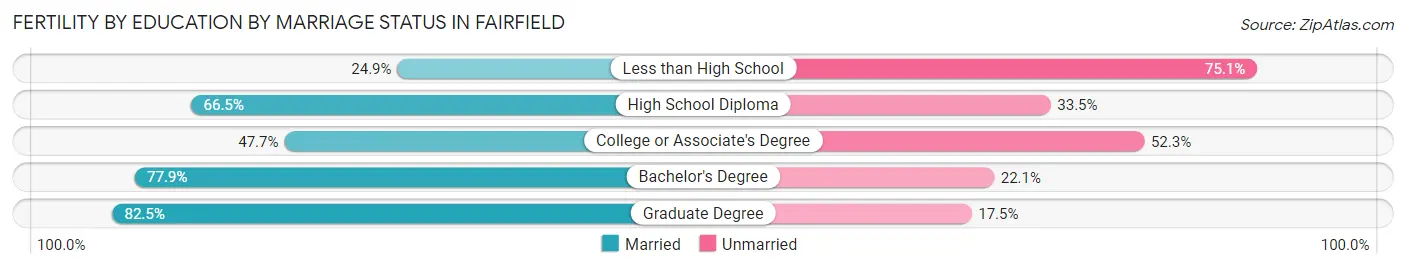
| Educational Attainment | Married | Unmarried |
| Less than High School | 52 (24.9%) | 157 (75.1%) |
| High School Diploma | 356 (66.5%) | 179 (33.5%) |
| College or Associate's Degree | 286 (47.7%) | 314 (52.3%) |
| Bachelor's Degree | 272 (77.9%) | 77 (22.1%) |
| Graduate Degree | 127 (82.5%) | 27 (17.5%) |
| Total | 1,093 (59.2%) | 754 (40.8%) |
Employment Characteristics in Fairfield
Employment by Class of Employer in Fairfield
Among the 55,715 employed individuals in Fairfield, private company employees (33,919 | 60.9%), not-for-profit organizations (5,047 | 9.1%), and local government employees (4,905 | 8.8%) make up the most common classes of employment.
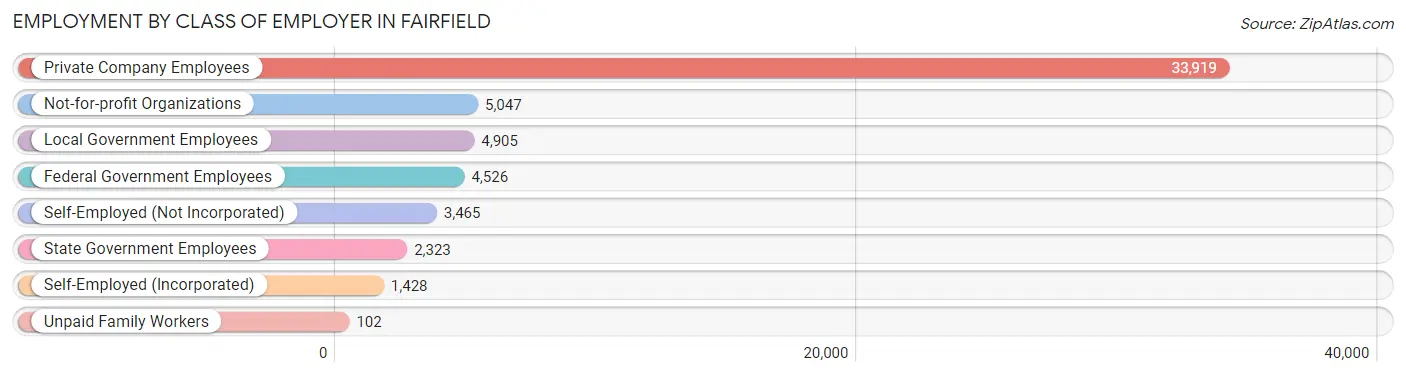
| Employer Class | # Employees | % Employees |
| Private Company Employees | 33,919 | 60.9% |
| Self-Employed (Incorporated) | 1,428 | 2.6% |
| Self-Employed (Not Incorporated) | 3,465 | 6.2% |
| Not-for-profit Organizations | 5,047 | 9.1% |
| Local Government Employees | 4,905 | 8.8% |
| State Government Employees | 2,323 | 4.2% |
| Federal Government Employees | 4,526 | 8.1% |
| Unpaid Family Workers | 102 | 0.2% |
| Total | 55,715 | 100.0% |
Employment Status by Age in Fairfield
According to the labor force statistics for Fairfield, out of the total population over 16 years of age (93,310), 64.9% or 60,558 individuals are in the labor force, with 5.5% or 3,331 of them unemployed. The age group with the highest labor force participation rate is 35 to 44 years, with 84.2% or 13,653 individuals in the labor force. Within the labor force, the 16 to 19 years age range has the highest percentage of unemployed individuals, with 13.2% or 291 of them being unemployed.
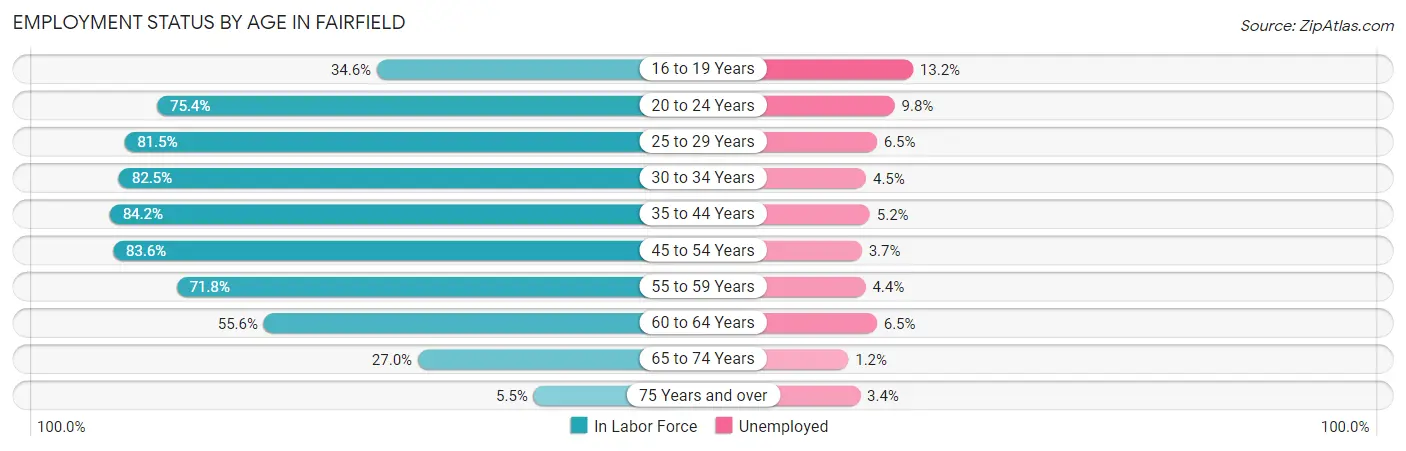
| Age Bracket | In Labor Force | Unemployed |
| 16 to 19 Years | 2,201 (34.6%) | 291 (13.2%) |
| 20 to 24 Years | 6,214 (75.4%) | 609 (9.8%) |
| 25 to 29 Years | 7,709 (81.5%) | 501 (6.5%) |
| 30 to 34 Years | 7,129 (82.5%) | 321 (4.5%) |
| 35 to 44 Years | 13,653 (84.2%) | 710 (5.2%) |
| 45 to 54 Years | 12,337 (83.6%) | 456 (3.7%) |
| 55 to 59 Years | 4,901 (71.8%) | 216 (4.4%) |
| 60 to 64 Years | 3,467 (55.6%) | 225 (6.5%) |
| 65 to 74 Years | 2,618 (27.0%) | 31 (1.2%) |
| 75 Years and over | 378 (5.5%) | 13 (3.4%) |
| Total | 60,558 (64.9%) | 3,331 (5.5%) |
Employment Status by Educational Attainment in Fairfield
According to labor force statistics for Fairfield, 79.2% of individuals (49,209) out of the total population between 25 and 64 years of age (62,133) are in the labor force, with 4.9% or 2,411 of them being unemployed. The group with the highest labor force participation rate are those with the educational attainment of bachelor's degree or higher, with 85.3% or 14,291 individuals in the labor force. Within the labor force, individuals with high school diploma education have the highest percentage of unemployment, with 6.4% or 713 of them being unemployed.
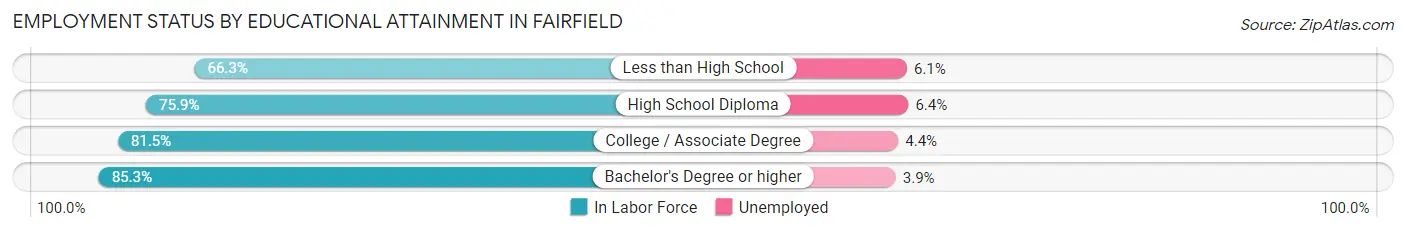
| Educational Attainment | In Labor Force | Unemployed |
| Less than High School | 5,486 (66.3%) | 505 (6.1%) |
| High School Diploma | 11,144 (75.9%) | 940 (6.4%) |
| College / Associate Degree | 18,275 (81.5%) | 987 (4.4%) |
| Bachelor's Degree or higher | 14,291 (85.3%) | 653 (3.9%) |
| Total | 49,209 (79.2%) | 3,045 (4.9%) |
Employment Occupations by Sex in Fairfield
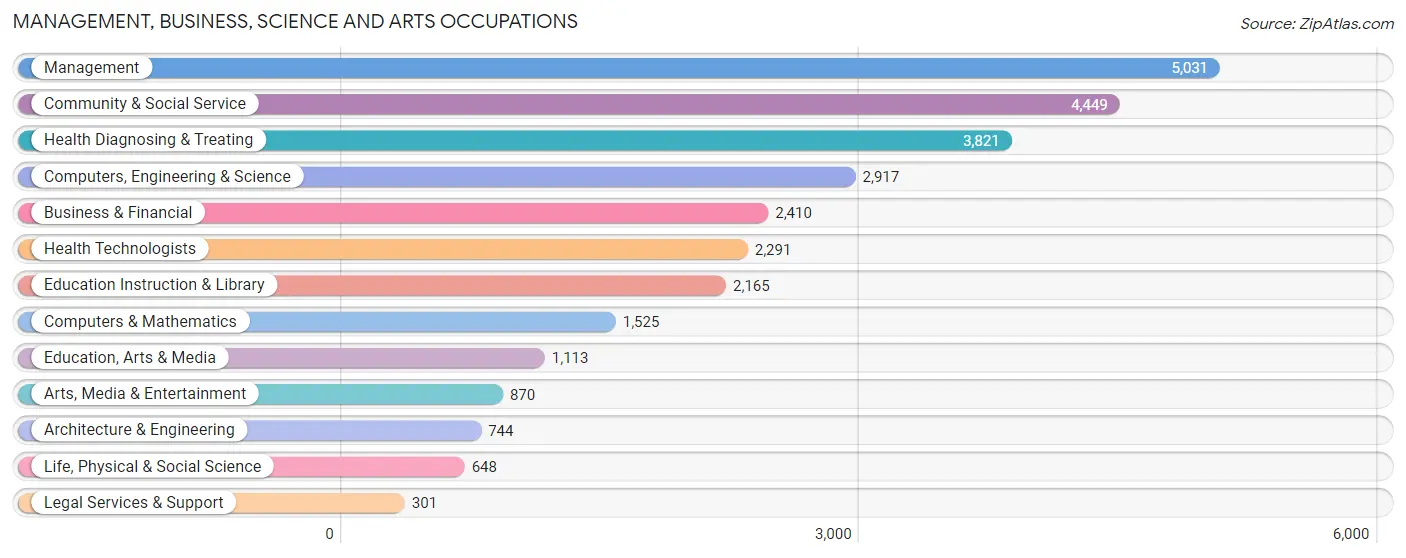
Management, Business, Science and Arts Occupations
The most common Management, Business, Science and Arts occupations in Fairfield are Management (5,031 | 9.1%), Community & Social Service (4,449 | 8.0%), Health Diagnosing & Treating (3,821 | 6.9%), Computers, Engineering & Science (2,917 | 5.3%), and Business & Financial (2,410 | 4.3%).
Management, Business, Science and Arts Occupations by Sex
Within the Management, Business, Science and Arts occupations in Fairfield, the most male-oriented occupations are Computers & Mathematics (78.3%), Architecture & Engineering (71.5%), and Computers, Engineering & Science (69.9%), while the most female-oriented occupations are Health Technologists (71.4%), Health Diagnosing & Treating (68.5%), and Education Instruction & Library (66.1%).
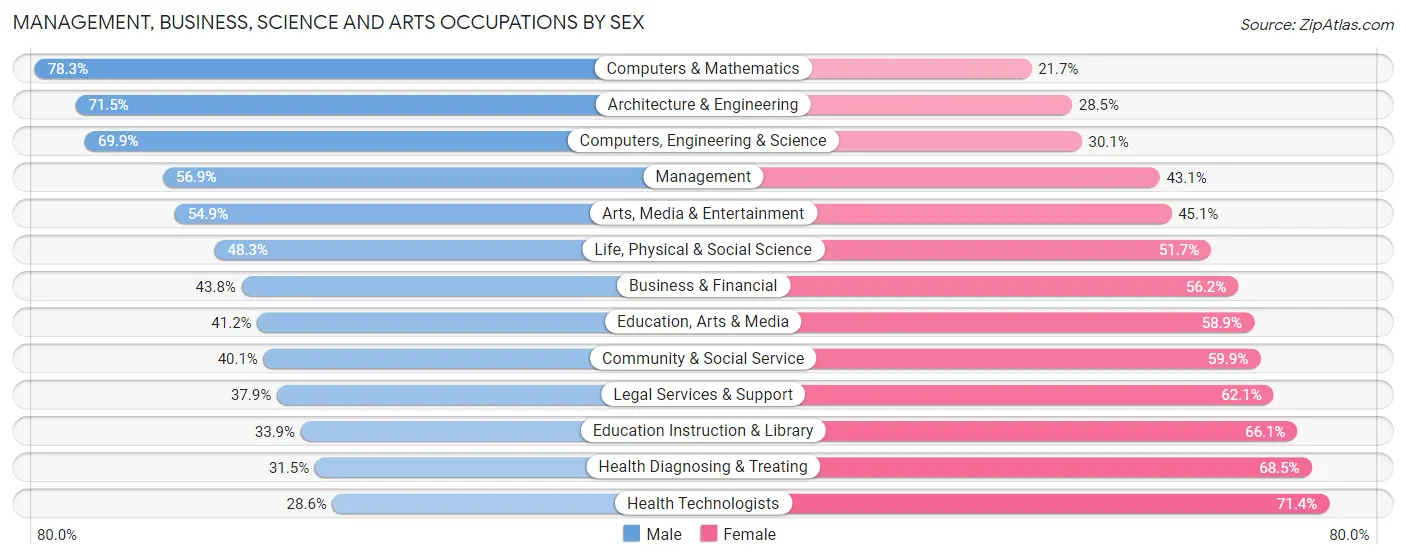
| Occupation | Male | Female |
| Management | 2,862 (56.9%) | 2,169 (43.1%) |
| Business & Financial | 1,055 (43.8%) | 1,355 (56.2%) |
| Computers, Engineering & Science | 2,039 (69.9%) | 878 (30.1%) |
| Computers & Mathematics | 1,194 (78.3%) | 331 (21.7%) |
| Architecture & Engineering | 532 (71.5%) | 212 (28.5%) |
| Life, Physical & Social Science | 313 (48.3%) | 335 (51.7%) |
| Community & Social Service | 1,784 (40.1%) | 2,665 (59.9%) |
| Education, Arts & Media | 458 (41.1%) | 655 (58.9%) |
| Legal Services & Support | 114 (37.9%) | 187 (62.1%) |
| Education Instruction & Library | 734 (33.9%) | 1,431 (66.1%) |
| Arts, Media & Entertainment | 478 (54.9%) | 392 (45.1%) |
| Health Diagnosing & Treating | 1,205 (31.5%) | 2,616 (68.5%) |
| Health Technologists | 655 (28.6%) | 1,636 (71.4%) |
| Total (Category) | 8,945 (48.0%) | 9,683 (52.0%) |
| Total (Overall) | 30,257 (54.5%) | 25,251 (45.5%) |
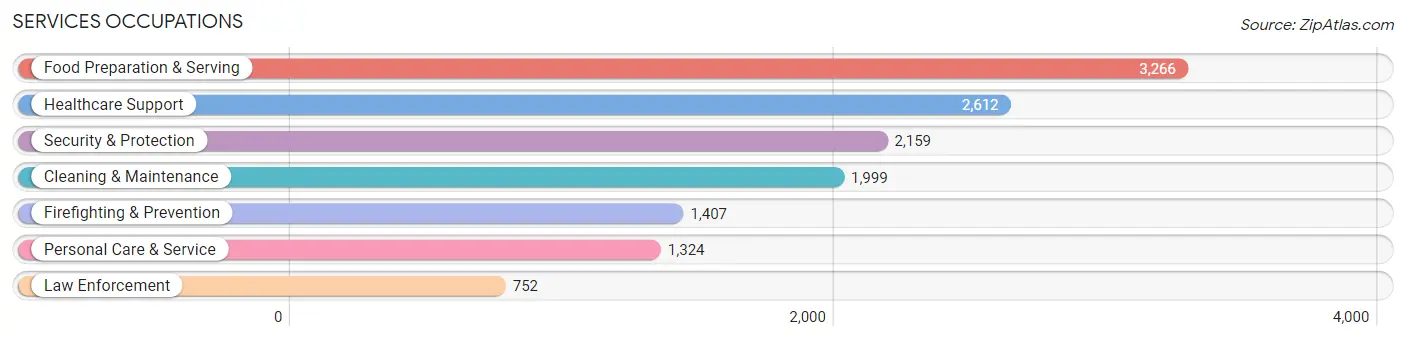
Services Occupations
The most common Services occupations in Fairfield are Food Preparation & Serving (3,266 | 5.9%), Healthcare Support (2,612 | 4.7%), Security & Protection (2,159 | 3.9%), Cleaning & Maintenance (1,999 | 3.6%), and Firefighting & Prevention (1,407 | 2.5%).
Services Occupations by Sex
Within the Services occupations in Fairfield, the most male-oriented occupations are Law Enforcement (95.2%), Security & Protection (79.2%), and Firefighting & Prevention (70.7%), while the most female-oriented occupations are Healthcare Support (82.8%), Personal Care & Service (81.9%), and Food Preparation & Serving (52.0%).
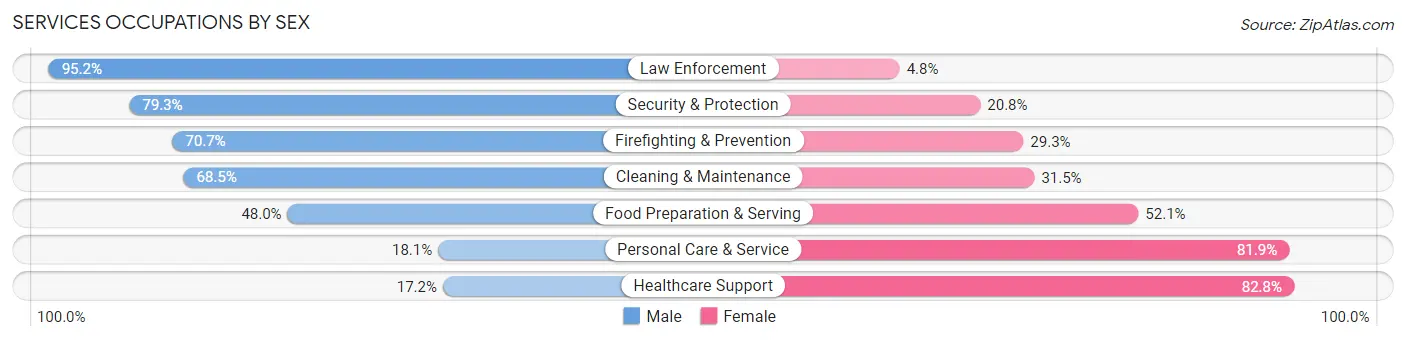
| Occupation | Male | Female |
| Healthcare Support | 449 (17.2%) | 2,163 (82.8%) |
| Security & Protection | 1,711 (79.2%) | 448 (20.7%) |
| Firefighting & Prevention | 995 (70.7%) | 412 (29.3%) |
| Law Enforcement | 716 (95.2%) | 36 (4.8%) |
| Food Preparation & Serving | 1,566 (47.9%) | 1,700 (52.0%) |
| Cleaning & Maintenance | 1,370 (68.5%) | 629 (31.5%) |
| Personal Care & Service | 240 (18.1%) | 1,084 (81.9%) |
| Total (Category) | 5,336 (47.0%) | 6,024 (53.0%) |
| Total (Overall) | 30,257 (54.5%) | 25,251 (45.5%) |
Sales and Office Occupations
The most common Sales and Office occupations in Fairfield are Office & Administration (6,397 | 11.5%), and Sales & Related (5,022 | 9.0%).
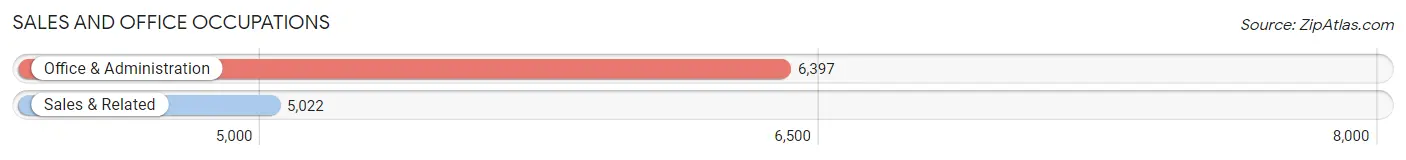
Sales and Office Occupations by Sex
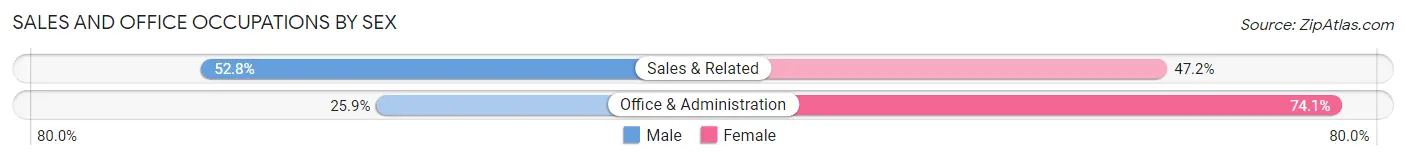
| Occupation | Male | Female |
| Sales & Related | 2,652 (52.8%) | 2,370 (47.2%) |
| Office & Administration | 1,657 (25.9%) | 4,740 (74.1%) |
| Total (Category) | 4,309 (37.7%) | 7,110 (62.3%) |
| Total (Overall) | 30,257 (54.5%) | 25,251 (45.5%) |
Natural Resources, Construction and Maintenance Occupations
The most common Natural Resources, Construction and Maintenance occupations in Fairfield are Construction & Extraction (3,524 | 6.4%), Installation, Maintenance & Repair (1,642 | 3.0%), and Farming, Fishing & Forestry (723 | 1.3%).
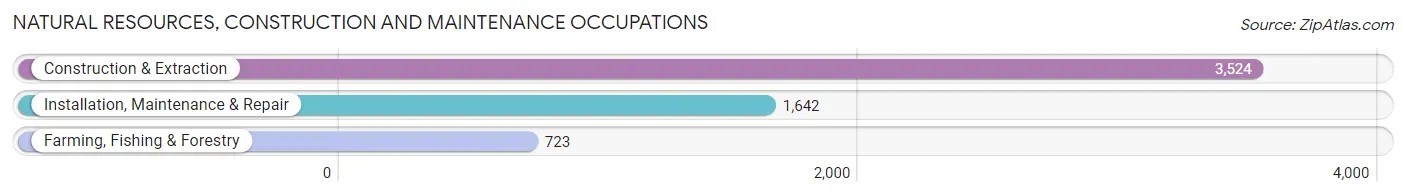
Natural Resources, Construction and Maintenance Occupations by Sex
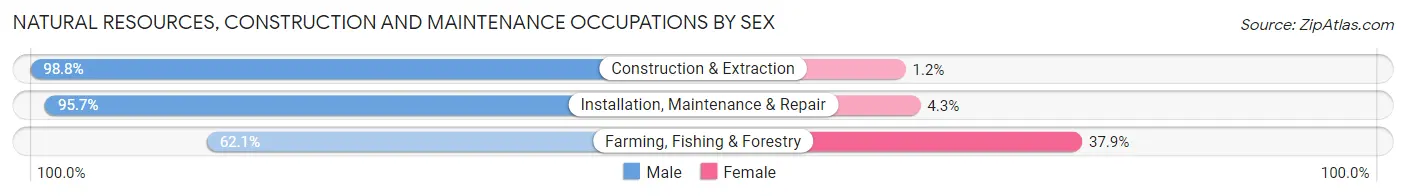
| Occupation | Male | Female |
| Farming, Fishing & Forestry | 449 (62.1%) | 274 (37.9%) |
| Construction & Extraction | 3,482 (98.8%) | 42 (1.2%) |
| Installation, Maintenance & Repair | 1,572 (95.7%) | 70 (4.3%) |
| Total (Category) | 5,503 (93.4%) | 386 (6.6%) |
| Total (Overall) | 30,257 (54.5%) | 25,251 (45.5%) |
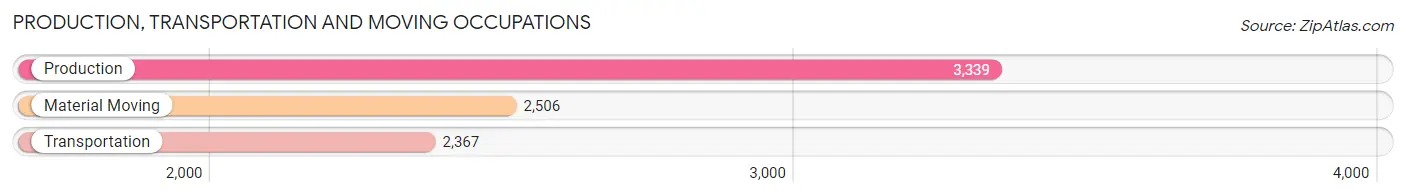
Production, Transportation and Moving Occupations
The most common Production, Transportation and Moving occupations in Fairfield are Production (3,339 | 6.0%), Material Moving (2,506 | 4.5%), and Transportation (2,367 | 4.3%).
Production, Transportation and Moving Occupations by Sex
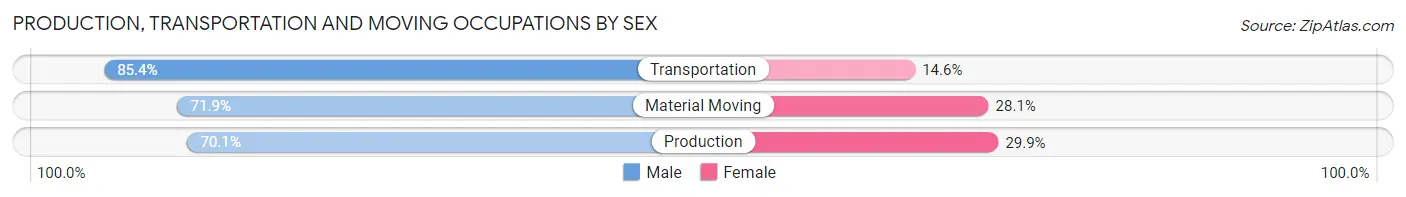
| Occupation | Male | Female |
| Production | 2,341 (70.1%) | 998 (29.9%) |
| Transportation | 2,021 (85.4%) | 346 (14.6%) |
| Material Moving | 1,802 (71.9%) | 704 (28.1%) |
| Total (Category) | 6,164 (75.1%) | 2,048 (24.9%) |
| Total (Overall) | 30,257 (54.5%) | 25,251 (45.5%) |
Employment Industries by Sex in Fairfield
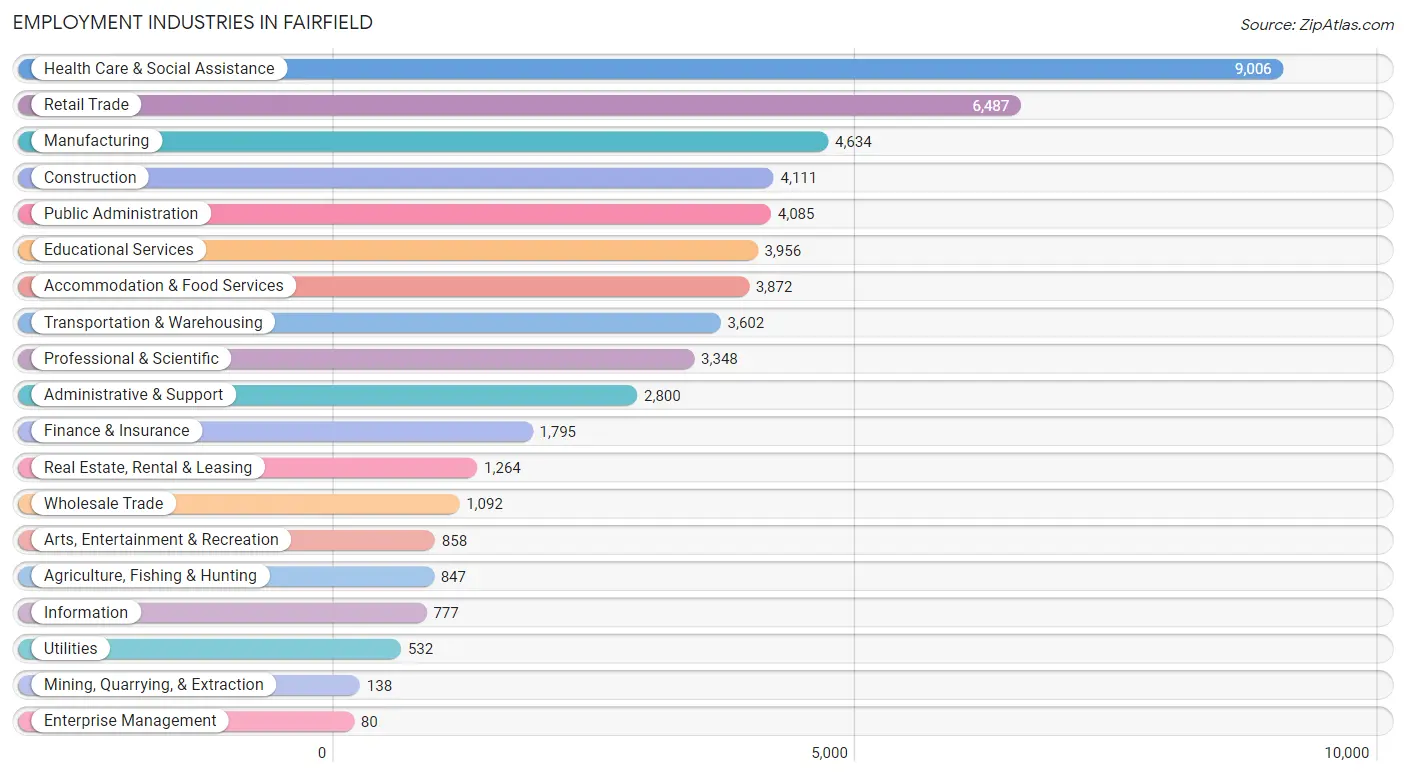
Employment Industries in Fairfield
The major employment industries in Fairfield include Health Care & Social Assistance (9,006 | 16.2%), Retail Trade (6,487 | 11.7%), Manufacturing (4,634 | 8.4%), Construction (4,111 | 7.4%), and Public Administration (4,085 | 7.4%).
Employment Industries by Sex in Fairfield
The Fairfield industries that see more men than women are Mining, Quarrying, & Extraction (100.0%), Construction (92.8%), and Utilities (80.8%), whereas the industries that tend to have a higher number of women are Health Care & Social Assistance (72.4%), Educational Services (60.5%), and Finance & Insurance (57.6%).
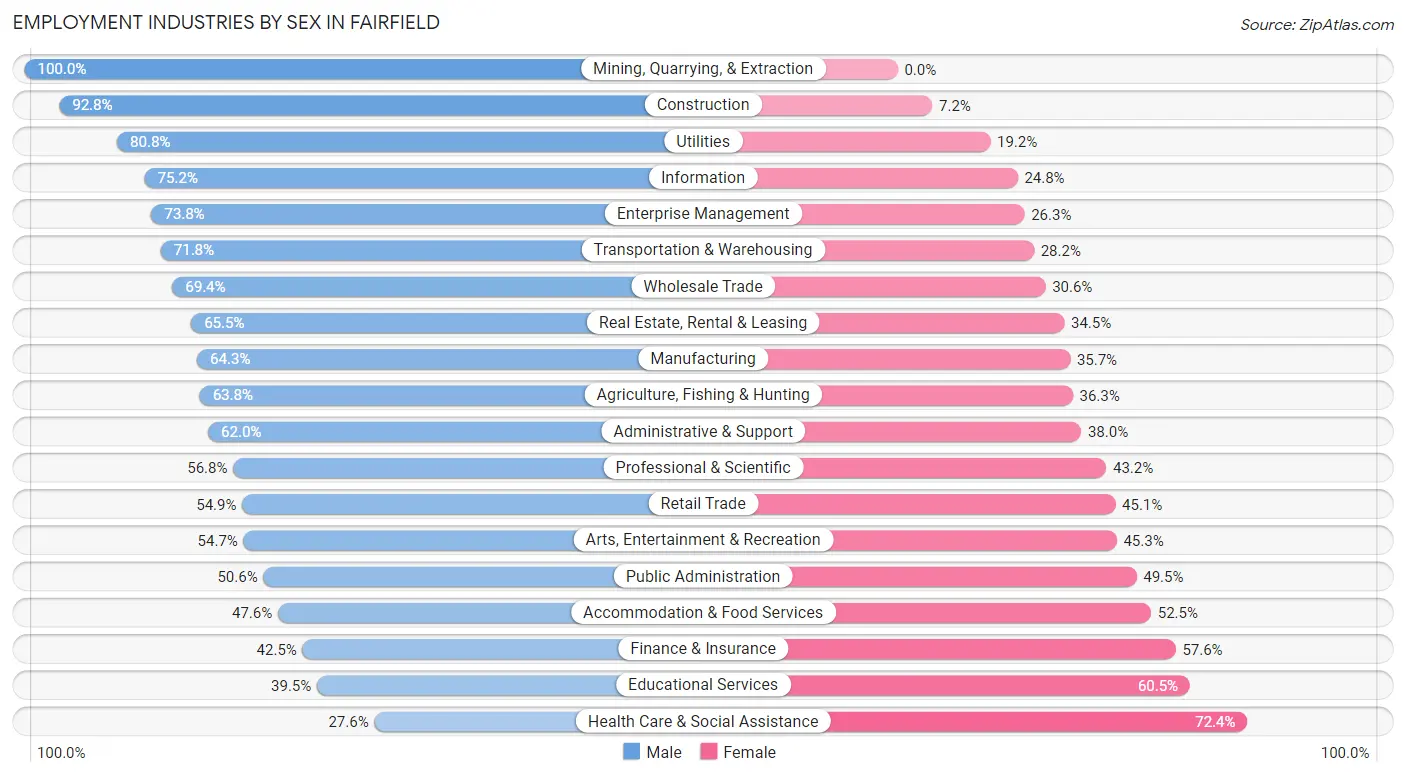
| Industry | Male | Female |
| Agriculture, Fishing & Hunting | 540 (63.7%) | 307 (36.2%) |
| Mining, Quarrying, & Extraction | 138 (100.0%) | 0 (0.0%) |
| Construction | 3,816 (92.8%) | 295 (7.2%) |
| Manufacturing | 2,979 (64.3%) | 1,655 (35.7%) |
| Wholesale Trade | 758 (69.4%) | 334 (30.6%) |
| Retail Trade | 3,564 (54.9%) | 2,923 (45.1%) |
| Transportation & Warehousing | 2,586 (71.8%) | 1,016 (28.2%) |
| Utilities | 430 (80.8%) | 102 (19.2%) |
| Information | 584 (75.2%) | 193 (24.8%) |
| Finance & Insurance | 762 (42.4%) | 1,033 (57.6%) |
| Real Estate, Rental & Leasing | 828 (65.5%) | 436 (34.5%) |
| Professional & Scientific | 1,902 (56.8%) | 1,446 (43.2%) |
| Enterprise Management | 59 (73.8%) | 21 (26.3%) |
| Administrative & Support | 1,736 (62.0%) | 1,064 (38.0%) |
| Educational Services | 1,561 (39.5%) | 2,395 (60.5%) |
| Health Care & Social Assistance | 2,484 (27.6%) | 6,522 (72.4%) |
| Arts, Entertainment & Recreation | 469 (54.7%) | 389 (45.3%) |
| Accommodation & Food Services | 1,841 (47.5%) | 2,031 (52.4%) |
| Public Administration | 2,065 (50.5%) | 2,020 (49.4%) |
| Total | 30,257 (54.5%) | 25,251 (45.5%) |
Education in Fairfield
School Enrollment in Fairfield
The most common levels of schooling among the 30,685 students in Fairfield are college / undergraduate (6,860 | 22.4%), high school (6,532 | 21.3%), and middle school (6,454 | 21.0%).
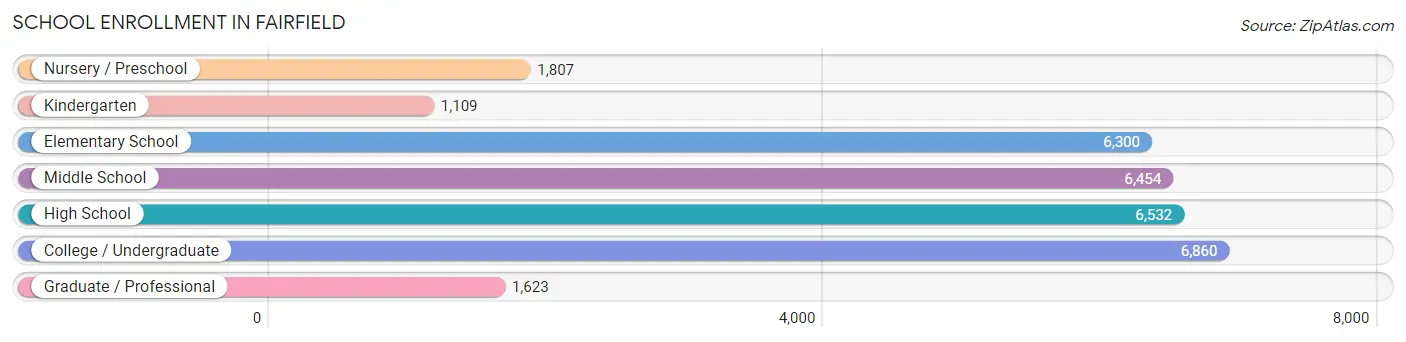
| School Level | # Students | % Students |
| Nursery / Preschool | 1,807 | 5.9% |
| Kindergarten | 1,109 | 3.6% |
| Elementary School | 6,300 | 20.5% |
| Middle School | 6,454 | 21.0% |
| High School | 6,532 | 21.3% |
| College / Undergraduate | 6,860 | 22.4% |
| Graduate / Professional | 1,623 | 5.3% |
| Total | 30,685 | 100.0% |
School Enrollment by Age by Funding Source in Fairfield
Out of a total of 30,685 students who are enrolled in schools in Fairfield, 3,928 (12.8%) attend a private institution, while the remaining 26,757 (87.2%) are enrolled in public schools. The age group of 3 to 4 year olds has the highest likelihood of being enrolled in private schools, with 550 (39.3% in the age bracket) enrolled. Conversely, the age group of 15 to 17 year olds has the lowest likelihood of being enrolled in a private school, with 4,387 (95.3% in the age bracket) attending a public institution.
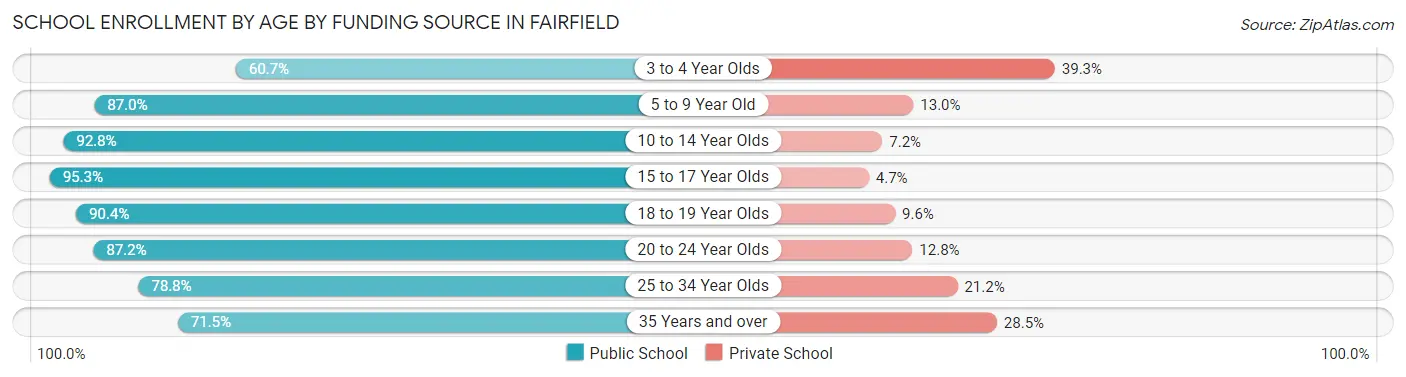
| Age Bracket | Public School | Private School |
| 3 to 4 Year Olds | 848 (60.7%) | 550 (39.3%) |
| 5 to 9 Year Old | 5,893 (87.0%) | 879 (13.0%) |
| 10 to 14 Year Olds | 7,838 (92.8%) | 609 (7.2%) |
| 15 to 17 Year Olds | 4,387 (95.3%) | 216 (4.7%) |
| 18 to 19 Year Olds | 1,756 (90.4%) | 186 (9.6%) |
| 20 to 24 Year Olds | 2,690 (87.2%) | 395 (12.8%) |
| 25 to 34 Year Olds | 1,777 (78.8%) | 478 (21.2%) |
| 35 Years and over | 1,560 (71.5%) | 623 (28.5%) |
| Total | 26,757 (87.2%) | 3,928 (12.8%) |
Educational Attainment by Field of Study in Fairfield
Business (4,847 | 20.9%), science & technology (3,017 | 13.0%), social sciences (1,998 | 8.6%), arts & humanities (1,968 | 8.5%), and education (1,733 | 7.5%) are the most common fields of study among 23,235 individuals in Fairfield who have obtained a bachelor's degree or higher.
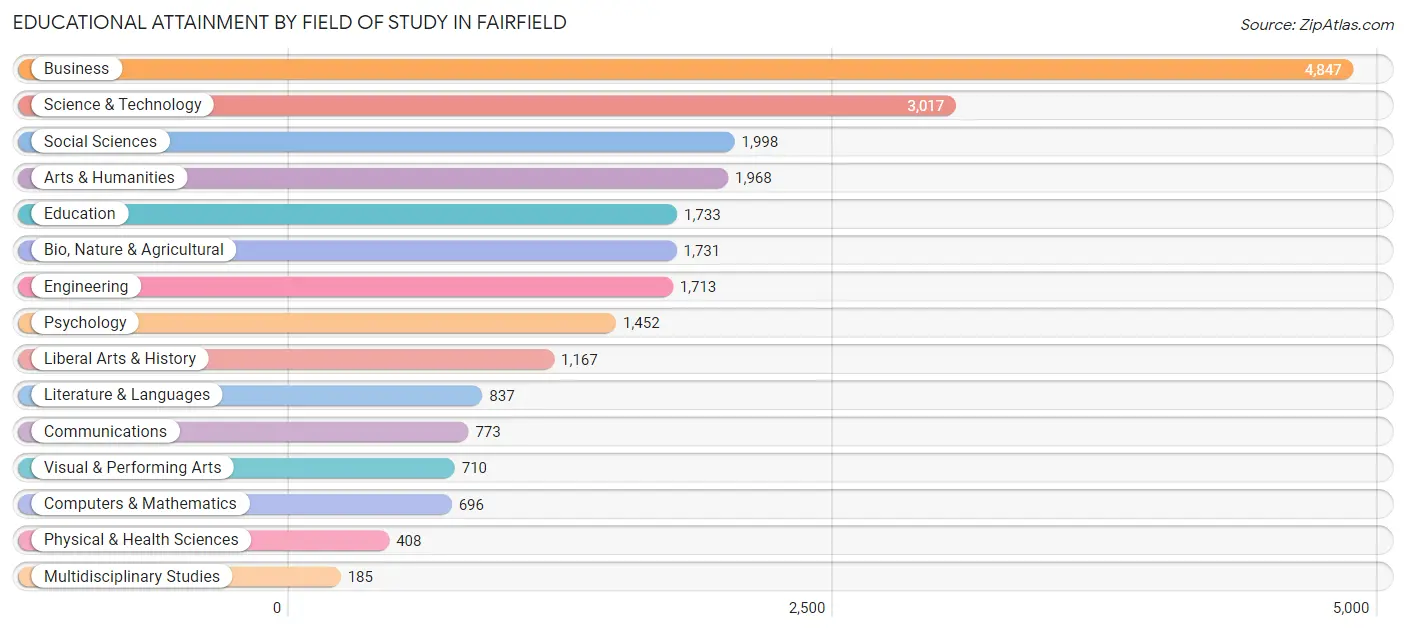
| Field of Study | # Graduates | % Graduates |
| Computers & Mathematics | 696 | 3.0% |
| Bio, Nature & Agricultural | 1,731 | 7.4% |
| Physical & Health Sciences | 408 | 1.8% |
| Psychology | 1,452 | 6.2% |
| Social Sciences | 1,998 | 8.6% |
| Engineering | 1,713 | 7.4% |
| Multidisciplinary Studies | 185 | 0.8% |
| Science & Technology | 3,017 | 13.0% |
| Business | 4,847 | 20.9% |
| Education | 1,733 | 7.5% |
| Literature & Languages | 837 | 3.6% |
| Liberal Arts & History | 1,167 | 5.0% |
| Visual & Performing Arts | 710 | 3.1% |
| Communications | 773 | 3.3% |
| Arts & Humanities | 1,968 | 8.5% |
| Total | 23,235 | 100.0% |
Transportation & Commute in Fairfield
Vehicle Availability by Sex in Fairfield
The most prevalent vehicle ownership categories in Fairfield are males with 2 vehicles (10,665, accounting for 34.8%) and females with 2 vehicles (8,422, making up 43.4%).
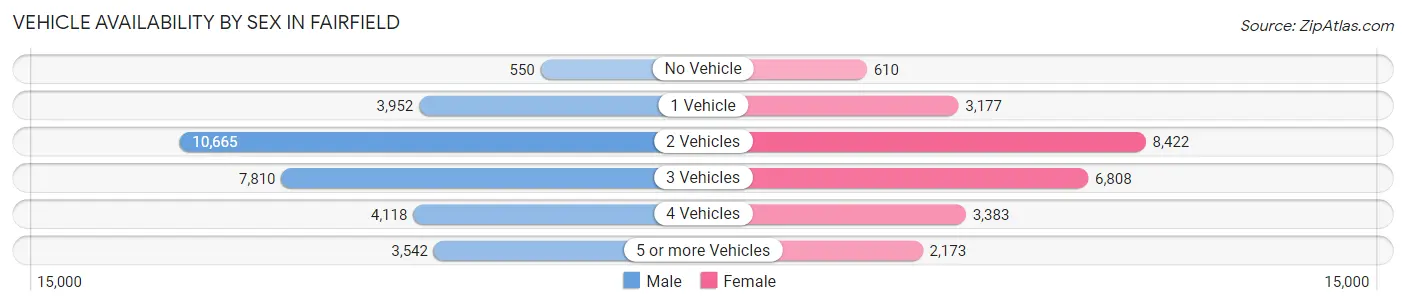
| Vehicles Available | Male | Female |
| No Vehicle | 550 (1.8%) | 610 (2.5%) |
| 1 Vehicle | 3,952 (12.9%) | 3,177 (12.9%) |
| 2 Vehicles | 10,665 (34.8%) | 8,422 (34.3%) |
| 3 Vehicles | 7,810 (25.5%) | 6,808 (27.7%) |
| 4 Vehicles | 4,118 (13.4%) | 3,383 (13.8%) |
| 5 or more Vehicles | 3,542 (11.6%) | 2,173 (8.8%) |
| Total | 30,637 (100.0%) | 24,573 (100.0%) |
Commute Time in Fairfield
The most frequently occuring commute durations in Fairfield are 15 to 19 minutes (7,801 commuters, 15.5%), 10 to 14 minutes (6,704 commuters, 13.3%), and 60 to 89 minutes (6,347 commuters, 12.6%).
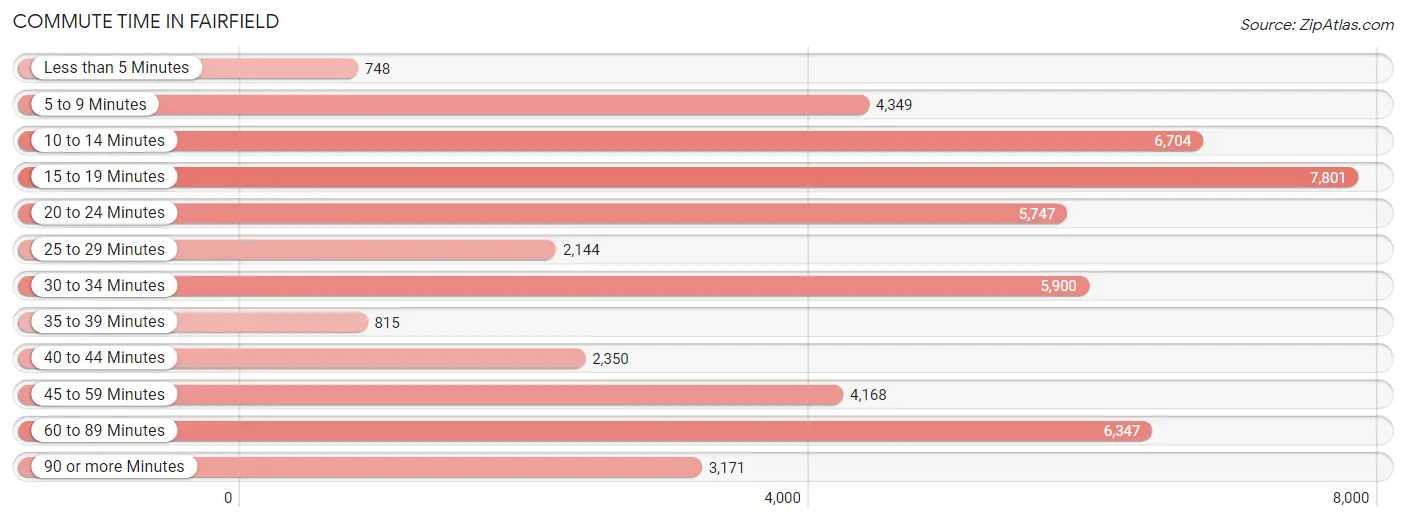
| Commute Time | # Commuters | % Commuters |
| Less than 5 Minutes | 748 | 1.5% |
| 5 to 9 Minutes | 4,349 | 8.7% |
| 10 to 14 Minutes | 6,704 | 13.3% |
| 15 to 19 Minutes | 7,801 | 15.5% |
| 20 to 24 Minutes | 5,747 | 11.4% |
| 25 to 29 Minutes | 2,144 | 4.3% |
| 30 to 34 Minutes | 5,900 | 11.7% |
| 35 to 39 Minutes | 815 | 1.6% |
| 40 to 44 Minutes | 2,350 | 4.7% |
| 45 to 59 Minutes | 4,168 | 8.3% |
| 60 to 89 Minutes | 6,347 | 12.6% |
| 90 or more Minutes | 3,171 | 6.3% |
Commute Time by Sex in Fairfield
The most common commute times in Fairfield are 60 to 89 minutes (4,400 commuters, 15.5%) for males and 15 to 19 minutes (3,882 commuters, 17.7%) for females.
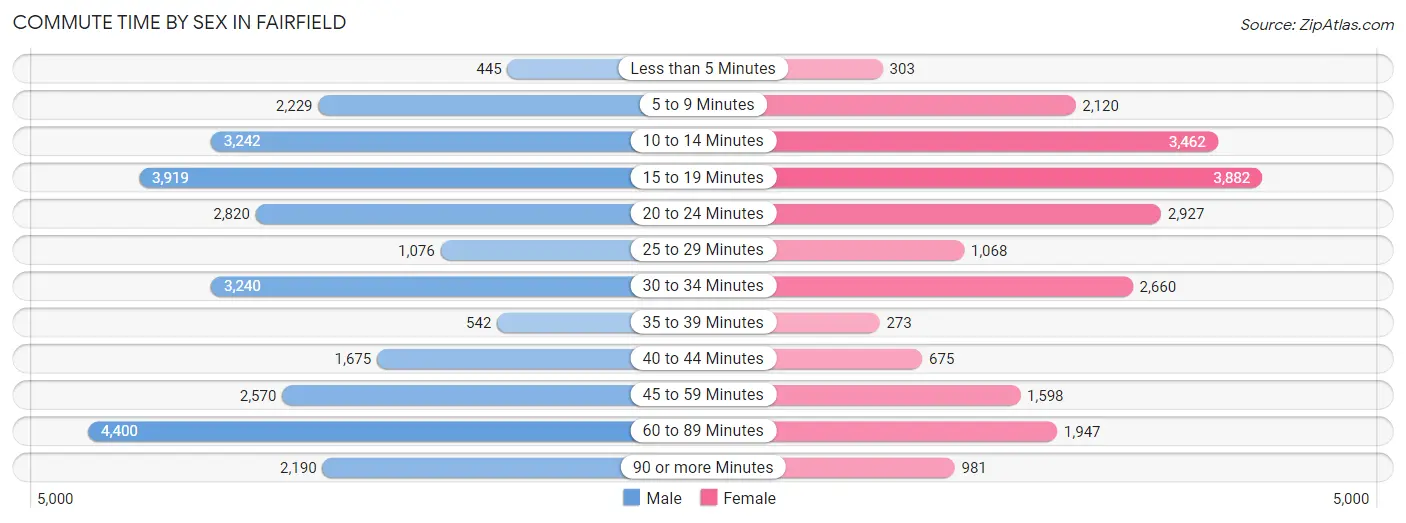
| Commute Time | Male | Female |
| Less than 5 Minutes | 445 (1.6%) | 303 (1.4%) |
| 5 to 9 Minutes | 2,229 (7.9%) | 2,120 (9.7%) |
| 10 to 14 Minutes | 3,242 (11.4%) | 3,462 (15.8%) |
| 15 to 19 Minutes | 3,919 (13.8%) | 3,882 (17.7%) |
| 20 to 24 Minutes | 2,820 (10.0%) | 2,927 (13.4%) |
| 25 to 29 Minutes | 1,076 (3.8%) | 1,068 (4.9%) |
| 30 to 34 Minutes | 3,240 (11.4%) | 2,660 (12.1%) |
| 35 to 39 Minutes | 542 (1.9%) | 273 (1.3%) |
| 40 to 44 Minutes | 1,675 (5.9%) | 675 (3.1%) |
| 45 to 59 Minutes | 2,570 (9.1%) | 1,598 (7.3%) |
| 60 to 89 Minutes | 4,400 (15.5%) | 1,947 (8.9%) |
| 90 or more Minutes | 2,190 (7.7%) | 981 (4.5%) |
Time of Departure to Work by Sex in Fairfield
The most frequent times of departure to work in Fairfield are 12:00 AM to 4:59 AM (3,256, 11.5%) for males and 7:00 AM to 7:29 AM (3,229, 14.7%) for females.
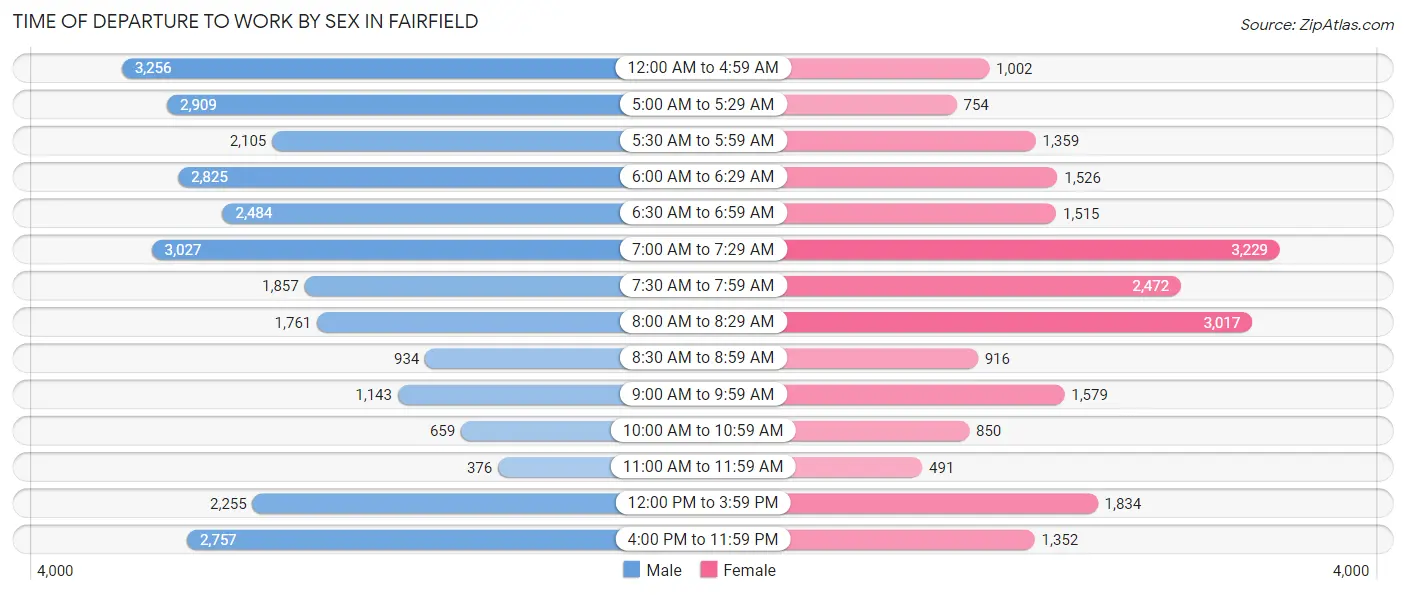
| Time of Departure | Male | Female |
| 12:00 AM to 4:59 AM | 3,256 (11.5%) | 1,002 (4.6%) |
| 5:00 AM to 5:29 AM | 2,909 (10.3%) | 754 (3.4%) |
| 5:30 AM to 5:59 AM | 2,105 (7.4%) | 1,359 (6.2%) |
| 6:00 AM to 6:29 AM | 2,825 (10.0%) | 1,526 (7.0%) |
| 6:30 AM to 6:59 AM | 2,484 (8.8%) | 1,515 (6.9%) |
| 7:00 AM to 7:29 AM | 3,027 (10.7%) | 3,229 (14.7%) |
| 7:30 AM to 7:59 AM | 1,857 (6.6%) | 2,472 (11.3%) |
| 8:00 AM to 8:29 AM | 1,761 (6.2%) | 3,017 (13.8%) |
| 8:30 AM to 8:59 AM | 934 (3.3%) | 916 (4.2%) |
| 9:00 AM to 9:59 AM | 1,143 (4.0%) | 1,579 (7.2%) |
| 10:00 AM to 10:59 AM | 659 (2.3%) | 850 (3.9%) |
| 11:00 AM to 11:59 AM | 376 (1.3%) | 491 (2.2%) |
| 12:00 PM to 3:59 PM | 2,255 (8.0%) | 1,834 (8.4%) |
| 4:00 PM to 11:59 PM | 2,757 (9.7%) | 1,352 (6.2%) |
| Total | 28,348 (100.0%) | 21,896 (100.0%) |
Housing Occupancy in Fairfield
Occupancy by Ownership in Fairfield
Of the total 37,593 dwellings in Fairfield, owner-occupied units account for 22,684 (60.3%), while renter-occupied units make up 14,909 (39.7%).
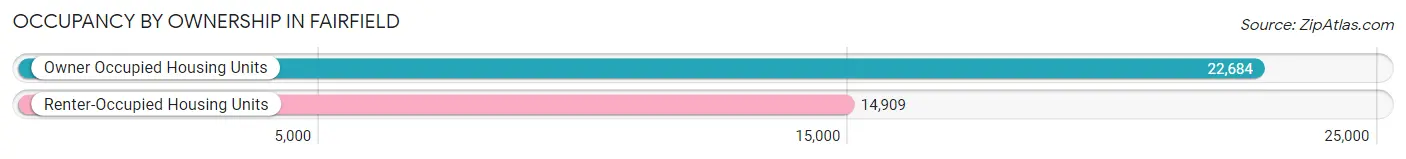
| Occupancy | # Housing Units | % Housing Units |
| Owner Occupied Housing Units | 22,684 | 60.3% |
| Renter-Occupied Housing Units | 14,909 | 39.7% |
| Total Occupied Housing Units | 37,593 | 100.0% |
Occupancy by Household Size in Fairfield
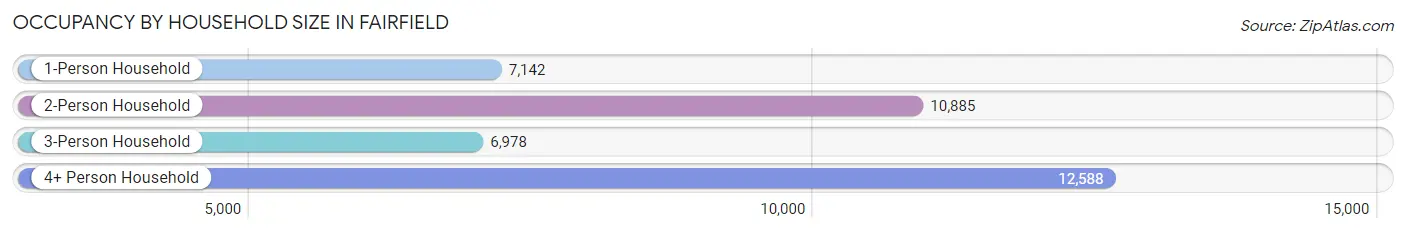
| Household Size | # Housing Units | % Housing Units |
| 1-Person Household | 7,142 | 19.0% |
| 2-Person Household | 10,885 | 28.9% |
| 3-Person Household | 6,978 | 18.6% |
| 4+ Person Household | 12,588 | 33.5% |
| Total Housing Units | 37,593 | 100.0% |
Occupancy by Ownership by Household Size in Fairfield
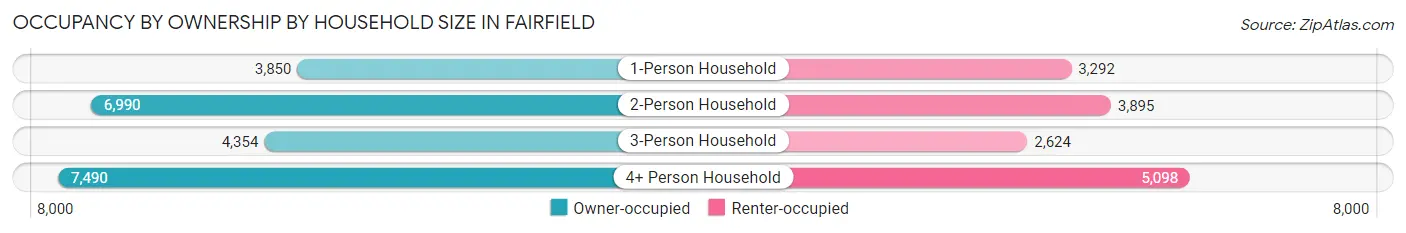
| Household Size | Owner-occupied | Renter-occupied |
| 1-Person Household | 3,850 (53.9%) | 3,292 (46.1%) |
| 2-Person Household | 6,990 (64.2%) | 3,895 (35.8%) |
| 3-Person Household | 4,354 (62.4%) | 2,624 (37.6%) |
| 4+ Person Household | 7,490 (59.5%) | 5,098 (40.5%) |
| Total Housing Units | 22,684 (60.3%) | 14,909 (39.7%) |
Occupancy by Educational Attainment in Fairfield
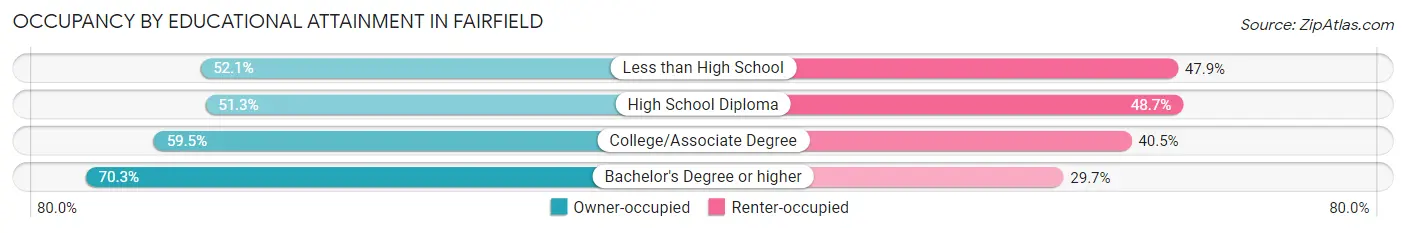
| Household Size | Owner-occupied | Renter-occupied |
| Less than High School | 1,936 (52.1%) | 1,777 (47.9%) |
| High School Diploma | 4,026 (51.3%) | 3,818 (48.7%) |
| College/Associate Degree | 8,726 (59.5%) | 5,937 (40.5%) |
| Bachelor's Degree or higher | 7,996 (70.3%) | 3,377 (29.7%) |
Occupancy by Age of Householder in Fairfield
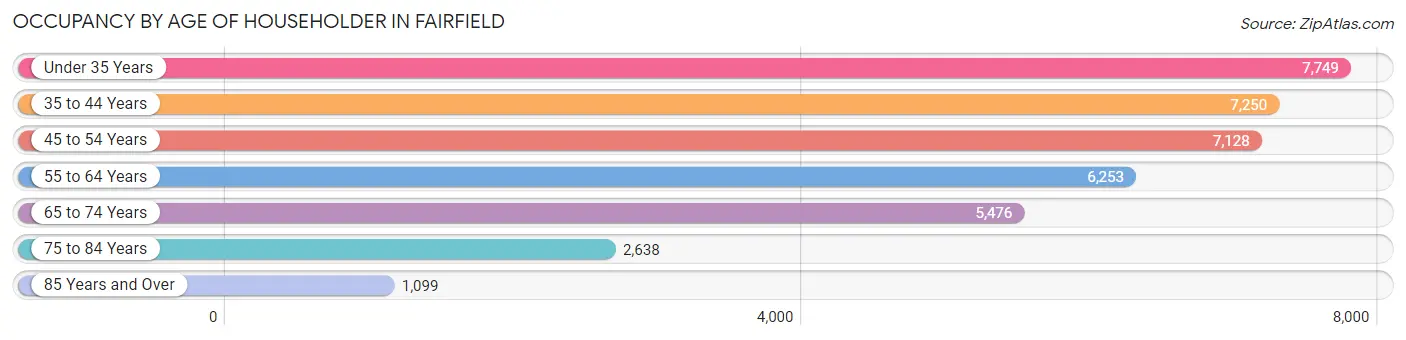
| Age Bracket | # Households | % Households |
| Under 35 Years | 7,749 | 20.6% |
| 35 to 44 Years | 7,250 | 19.3% |
| 45 to 54 Years | 7,128 | 19.0% |
| 55 to 64 Years | 6,253 | 16.6% |
| 65 to 74 Years | 5,476 | 14.6% |
| 75 to 84 Years | 2,638 | 7.0% |
| 85 Years and Over | 1,099 | 2.9% |
| Total | 37,593 | 100.0% |
Housing Finances in Fairfield
Median Income by Occupancy in Fairfield
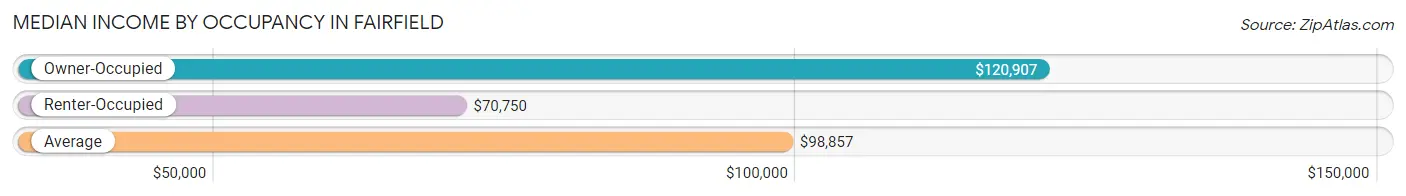
| Occupancy Type | # Households | Median Income |
| Owner-Occupied | 22,684 (60.3%) | $120,907 |
| Renter-Occupied | 14,909 (39.7%) | $70,750 |
| Average | 37,593 (100.0%) | $98,857 |
Occupancy by Householder Income Bracket in Fairfield
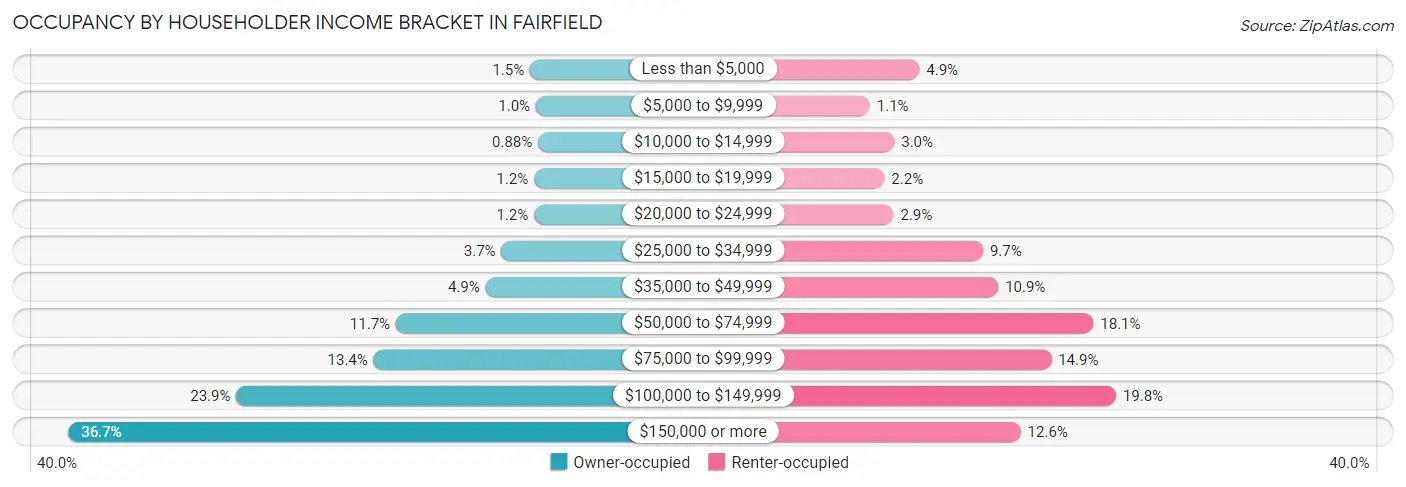
| Income Bracket | Owner-occupied | Renter-occupied |
| Less than $5,000 | 338 (1.5%) | 724 (4.9%) |
| $5,000 to $9,999 | 237 (1.0%) | 162 (1.1%) |
| $10,000 to $14,999 | 200 (0.9%) | 440 (2.9%) |
| $15,000 to $19,999 | 270 (1.2%) | 328 (2.2%) |
| $20,000 to $24,999 | 268 (1.2%) | 431 (2.9%) |
| $25,000 to $34,999 | 833 (3.7%) | 1,447 (9.7%) |
| $35,000 to $49,999 | 1,108 (4.9%) | 1,620 (10.9%) |
| $50,000 to $74,999 | 2,656 (11.7%) | 2,701 (18.1%) |
| $75,000 to $99,999 | 3,041 (13.4%) | 2,223 (14.9%) |
| $100,000 to $149,999 | 5,414 (23.9%) | 2,958 (19.8%) |
| $150,000 or more | 8,319 (36.7%) | 1,875 (12.6%) |
| Total | 22,684 (100.0%) | 14,909 (100.0%) |
Monthly Housing Cost Tiers in Fairfield
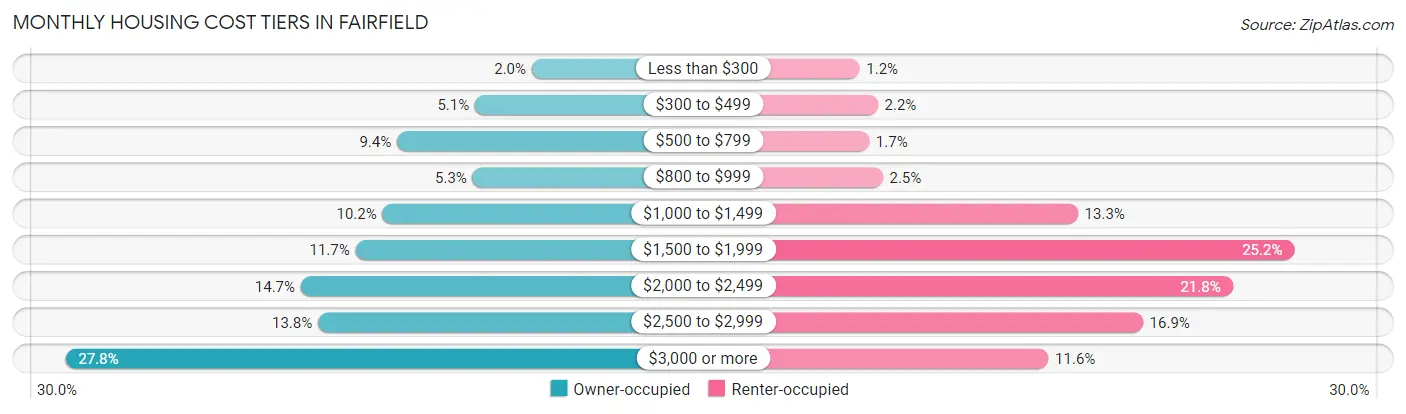
| Monthly Cost | Owner-occupied | Renter-occupied |
| Less than $300 | 450 (2.0%) | 181 (1.2%) |
| $300 to $499 | 1,161 (5.1%) | 331 (2.2%) |
| $500 to $799 | 2,139 (9.4%) | 259 (1.7%) |
| $800 to $999 | 1,190 (5.2%) | 371 (2.5%) |
| $1,000 to $1,499 | 2,321 (10.2%) | 1,979 (13.3%) |
| $1,500 to $1,999 | 2,658 (11.7%) | 3,762 (25.2%) |
| $2,000 to $2,499 | 3,344 (14.7%) | 3,253 (21.8%) |
| $2,500 to $2,999 | 3,127 (13.8%) | 2,513 (16.9%) |
| $3,000 or more | 6,294 (27.8%) | 1,735 (11.6%) |
| Total | 22,684 (100.0%) | 14,909 (100.0%) |
Physical Housing Characteristics in Fairfield
Housing Structures in Fairfield
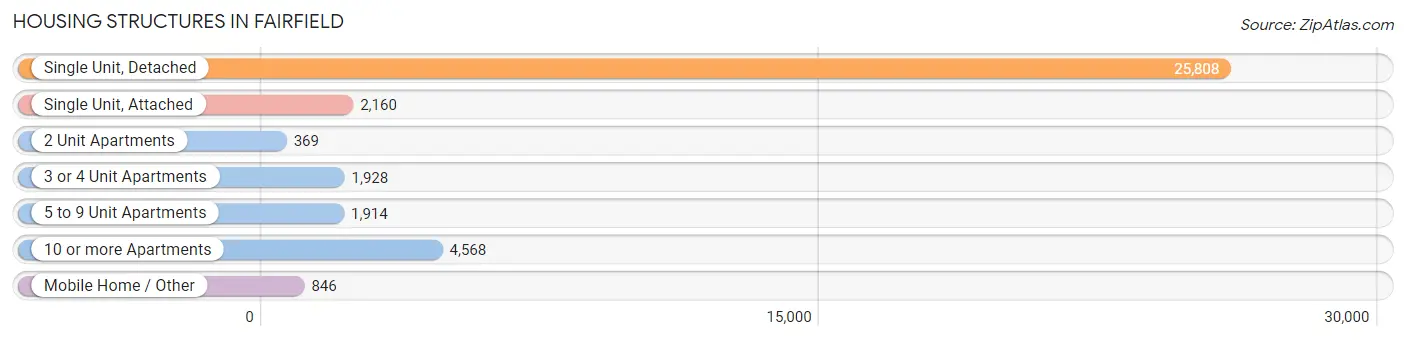
| Structure Type | # Housing Units | % Housing Units |
| Single Unit, Detached | 25,808 | 68.6% |
| Single Unit, Attached | 2,160 | 5.8% |
| 2 Unit Apartments | 369 | 1.0% |
| 3 or 4 Unit Apartments | 1,928 | 5.1% |
| 5 to 9 Unit Apartments | 1,914 | 5.1% |
| 10 or more Apartments | 4,568 | 12.1% |
| Mobile Home / Other | 846 | 2.2% |
| Total | 37,593 | 100.0% |
Housing Structures by Occupancy in Fairfield
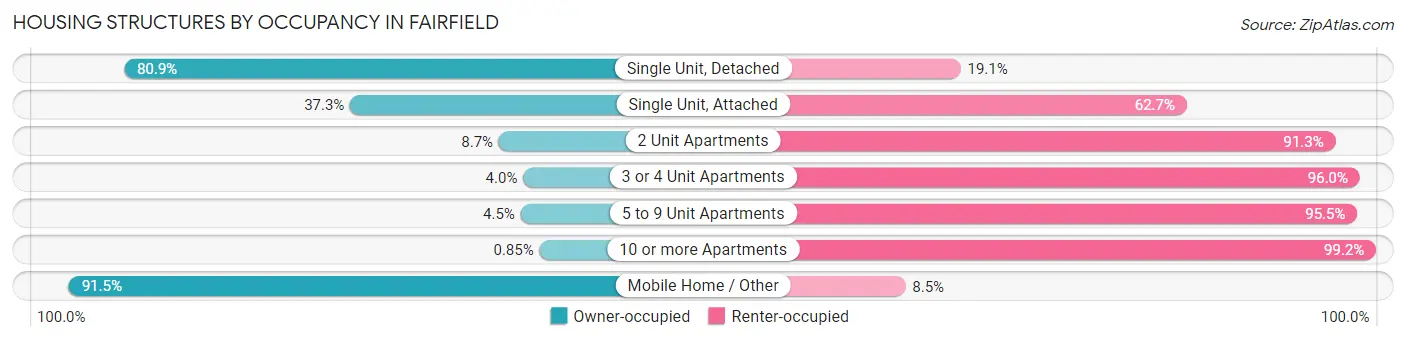
| Structure Type | Owner-occupied | Renter-occupied |
| Single Unit, Detached | 20,870 (80.9%) | 4,938 (19.1%) |
| Single Unit, Attached | 806 (37.3%) | 1,354 (62.7%) |
| 2 Unit Apartments | 32 (8.7%) | 337 (91.3%) |
| 3 or 4 Unit Apartments | 77 (4.0%) | 1,851 (96.0%) |
| 5 to 9 Unit Apartments | 86 (4.5%) | 1,828 (95.5%) |
| 10 or more Apartments | 39 (0.9%) | 4,529 (99.2%) |
| Mobile Home / Other | 774 (91.5%) | 72 (8.5%) |
| Total | 22,684 (60.3%) | 14,909 (39.7%) |
Housing Structures by Number of Rooms in Fairfield
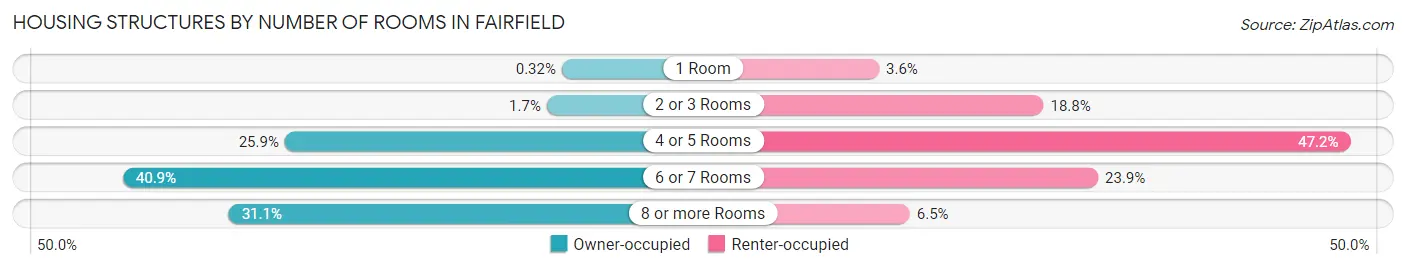
| Number of Rooms | Owner-occupied | Renter-occupied |
| 1 Room | 72 (0.3%) | 540 (3.6%) |
| 2 or 3 Rooms | 387 (1.7%) | 2,807 (18.8%) |
| 4 or 5 Rooms | 5,884 (25.9%) | 7,037 (47.2%) |
| 6 or 7 Rooms | 9,281 (40.9%) | 3,561 (23.9%) |
| 8 or more Rooms | 7,060 (31.1%) | 964 (6.5%) |
| Total | 22,684 (100.0%) | 14,909 (100.0%) |
Housing Structure by Heating Type in Fairfield
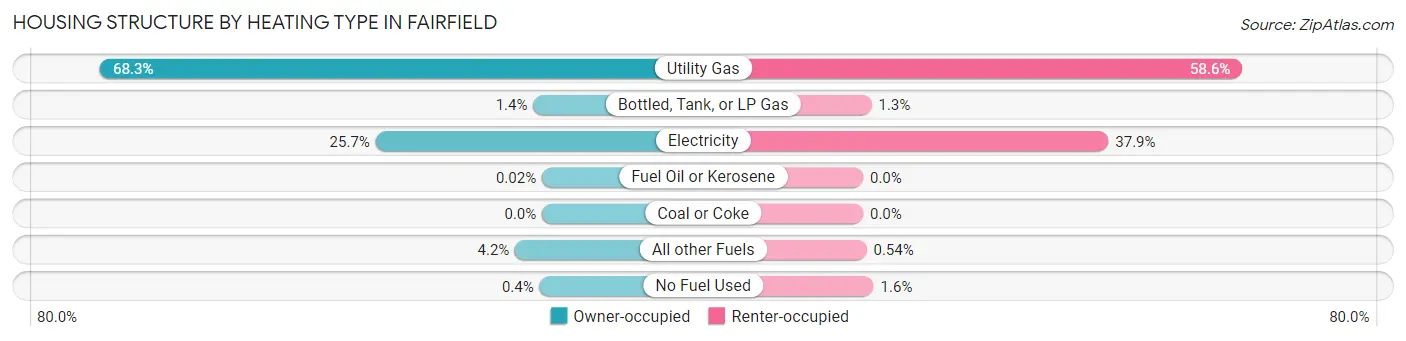
| Heating Type | Owner-occupied | Renter-occupied |
| Utility Gas | 15,500 (68.3%) | 8,736 (58.6%) |
| Bottled, Tank, or LP Gas | 309 (1.4%) | 195 (1.3%) |
| Electricity | 5,836 (25.7%) | 5,653 (37.9%) |
| Fuel Oil or Kerosene | 5 (0.0%) | 0 (0.0%) |
| Coal or Coke | 0 (0.0%) | 0 (0.0%) |
| All other Fuels | 943 (4.2%) | 81 (0.5%) |
| No Fuel Used | 91 (0.4%) | 244 (1.6%) |
| Total | 22,684 (100.0%) | 14,909 (100.0%) |
Household Vehicle Usage in Fairfield
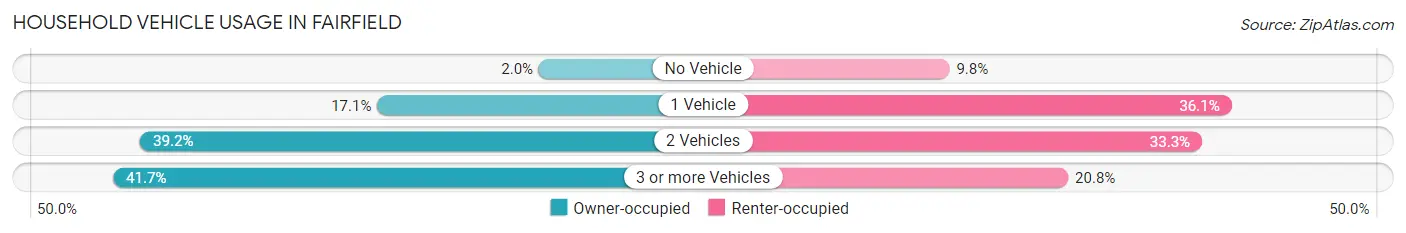
| Vehicles per Household | Owner-occupied | Renter-occupied |
| No Vehicle | 451 (2.0%) | 1,455 (9.8%) |
| 1 Vehicle | 3,874 (17.1%) | 5,379 (36.1%) |
| 2 Vehicles | 8,894 (39.2%) | 4,968 (33.3%) |
| 3 or more Vehicles | 9,465 (41.7%) | 3,107 (20.8%) |
| Total | 22,684 (100.0%) | 14,909 (100.0%) |
Real Estate & Mortgages in Fairfield
Real Estate and Mortgage Overview in Fairfield
| Characteristic | Without Mortgage | With Mortgage |
| Housing Units | 5,367 | 17,317 |
| Median Property Value | $495,700 | $560,900 |
| Median Household Income | $87,917 | $7,153 |
| Monthly Housing Costs | $649 | $6,294 |
| Real Estate Taxes | $3,036 | $255 |
Property Value by Mortgage Status in Fairfield
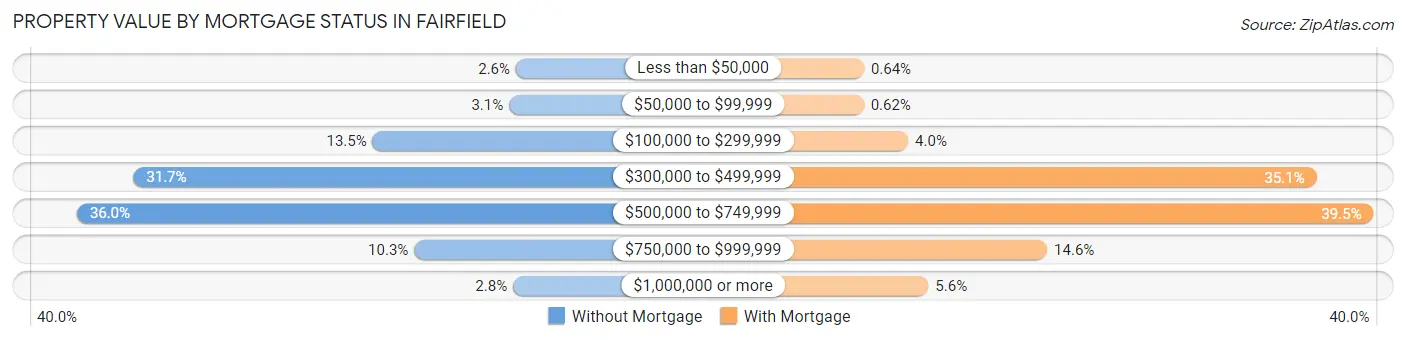
| Property Value | Without Mortgage | With Mortgage |
| Less than $50,000 | 138 (2.6%) | 110 (0.6%) |
| $50,000 to $99,999 | 166 (3.1%) | 108 (0.6%) |
| $100,000 to $299,999 | 724 (13.5%) | 694 (4.0%) |
| $300,000 to $499,999 | 1,702 (31.7%) | 6,081 (35.1%) |
| $500,000 to $749,999 | 1,933 (36.0%) | 6,834 (39.5%) |
| $750,000 to $999,999 | 554 (10.3%) | 2,529 (14.6%) |
| $1,000,000 or more | 150 (2.8%) | 961 (5.6%) |
| Total | 5,367 (100.0%) | 17,317 (100.0%) |
Household Income by Mortgage Status in Fairfield
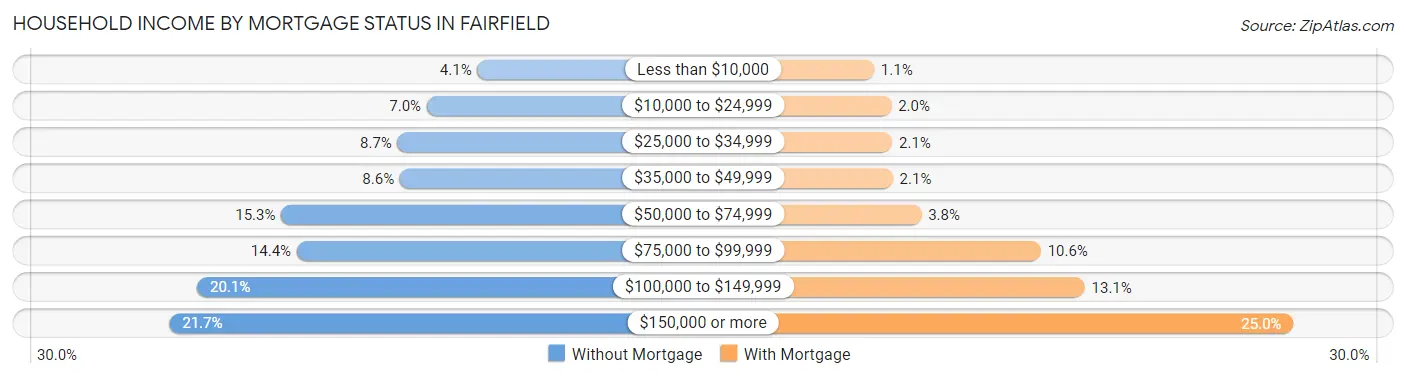
| Household Income | Without Mortgage | With Mortgage |
| Less than $10,000 | 221 (4.1%) | 182 (1.1%) |
| $10,000 to $24,999 | 376 (7.0%) | 354 (2.0%) |
| $25,000 to $34,999 | 466 (8.7%) | 362 (2.1%) |
| $35,000 to $49,999 | 459 (8.6%) | 367 (2.1%) |
| $50,000 to $74,999 | 823 (15.3%) | 649 (3.7%) |
| $75,000 to $99,999 | 775 (14.4%) | 1,833 (10.6%) |
| $100,000 to $149,999 | 1,081 (20.1%) | 2,266 (13.1%) |
| $150,000 or more | 1,166 (21.7%) | 4,333 (25.0%) |
| Total | 5,367 (100.0%) | 17,317 (100.0%) |
Property Value to Household Income Ratio in Fairfield
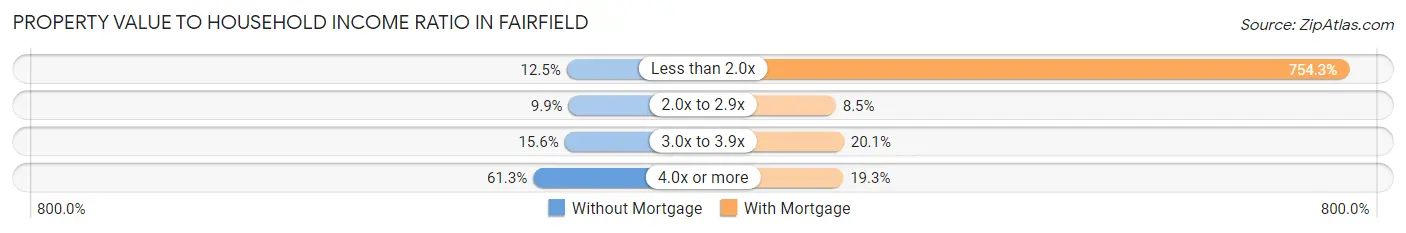
| Value-to-Income Ratio | Without Mortgage | With Mortgage |
| Less than 2.0x | 669 (12.5%) | 130,619 (754.3%) |
| 2.0x to 2.9x | 530 (9.9%) | 1,470 (8.5%) |
| 3.0x to 3.9x | 839 (15.6%) | 3,485 (20.1%) |
| 4.0x or more | 3,289 (61.3%) | 3,348 (19.3%) |
| Total | 5,367 (100.0%) | 17,317 (100.0%) |
Real Estate Taxes by Mortgage Status in Fairfield
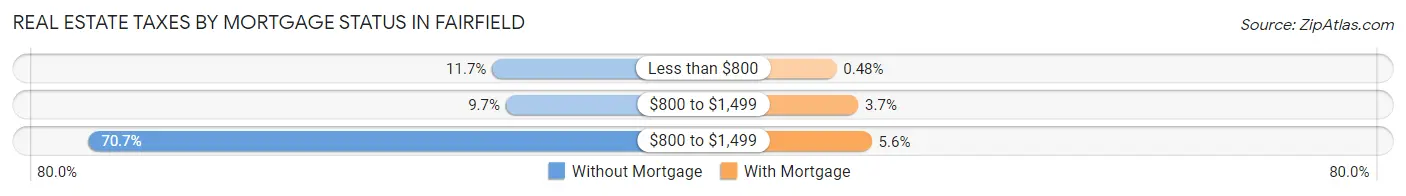
| Property Taxes | Without Mortgage | With Mortgage |
| Less than $800 | 627 (11.7%) | 83 (0.5%) |
| $800 to $1,499 | 520 (9.7%) | 635 (3.7%) |
| $800 to $1,499 | 3,794 (70.7%) | 976 (5.6%) |
| Total | 5,367 (100.0%) | 17,317 (100.0%) |
Health & Disability in Fairfield
Health Insurance Coverage by Age in Fairfield
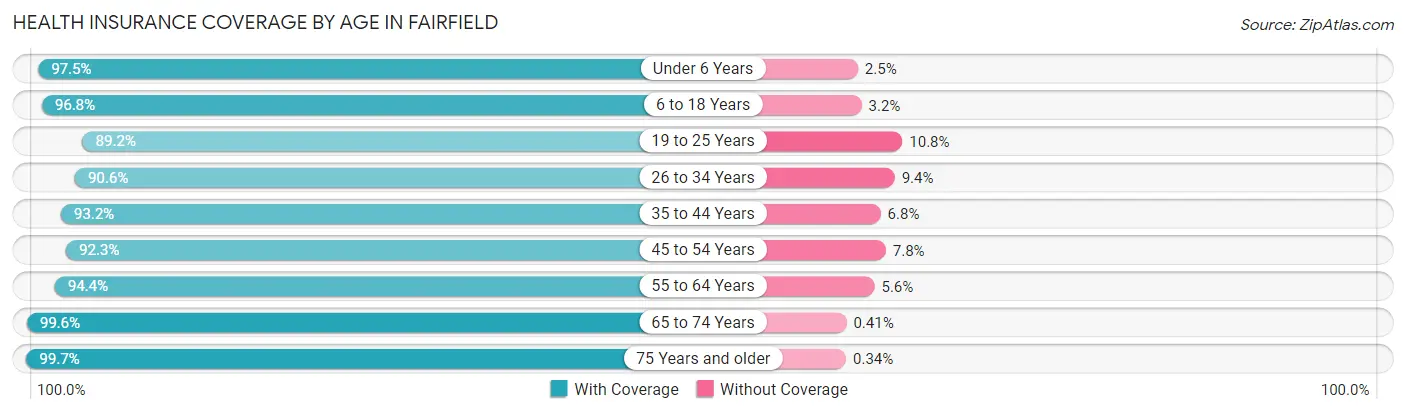
| Age Bracket | With Coverage | Without Coverage |
| Under 6 Years | 9,795 (97.5%) | 255 (2.5%) |
| 6 to 18 Years | 20,429 (96.8%) | 681 (3.2%) |
| 19 to 25 Years | 9,578 (89.2%) | 1,163 (10.8%) |
| 26 to 34 Years | 13,813 (90.6%) | 1,433 (9.4%) |
| 35 to 44 Years | 14,530 (93.2%) | 1,057 (6.8%) |
| 45 to 54 Years | 13,503 (92.2%) | 1,134 (7.7%) |
| 55 to 64 Years | 12,258 (94.4%) | 732 (5.6%) |
| 65 to 74 Years | 9,561 (99.6%) | 39 (0.4%) |
| 75 Years and older | 6,655 (99.7%) | 23 (0.3%) |
| Total | 110,122 (94.4%) | 6,517 (5.6%) |
Health Insurance Coverage by Citizenship Status in Fairfield
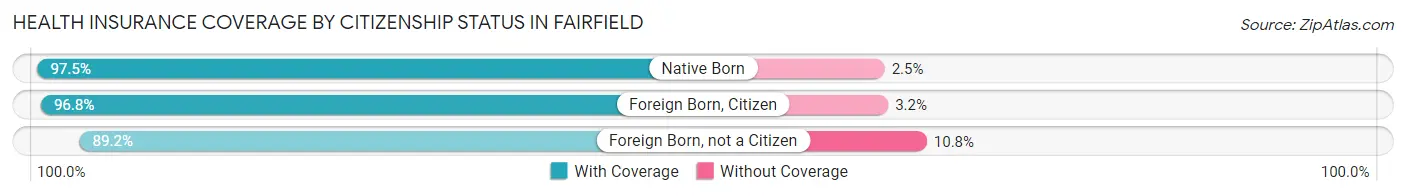
| Citizenship Status | With Coverage | Without Coverage |
| Native Born | 9,795 (97.5%) | 255 (2.5%) |
| Foreign Born, Citizen | 20,429 (96.8%) | 681 (3.2%) |
| Foreign Born, not a Citizen | 9,578 (89.2%) | 1,163 (10.8%) |
Health Insurance Coverage by Household Income in Fairfield
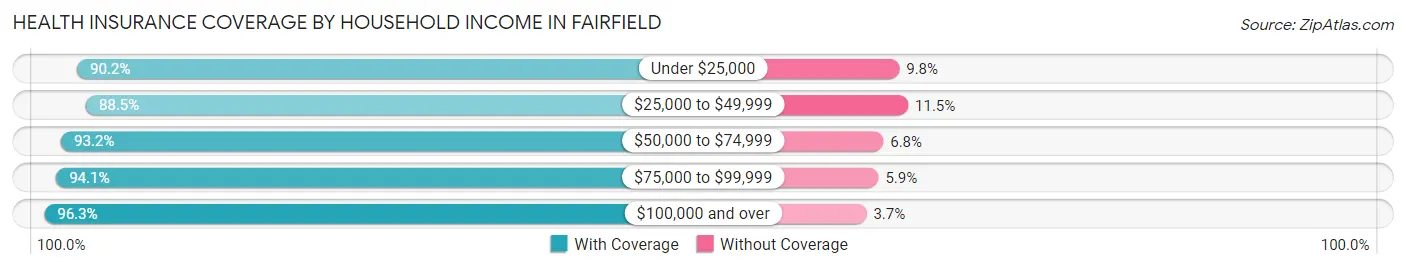
| Household Income | With Coverage | Without Coverage |
| Under $25,000 | 6,089 (90.2%) | 664 (9.8%) |
| $25,000 to $49,999 | 11,313 (88.5%) | 1,469 (11.5%) |
| $50,000 to $74,999 | 13,276 (93.2%) | 974 (6.8%) |
| $75,000 to $99,999 | 14,629 (94.1%) | 923 (5.9%) |
| $100,000 and over | 64,312 (96.3%) | 2,466 (3.7%) |
Public vs Private Health Insurance Coverage by Age in Fairfield
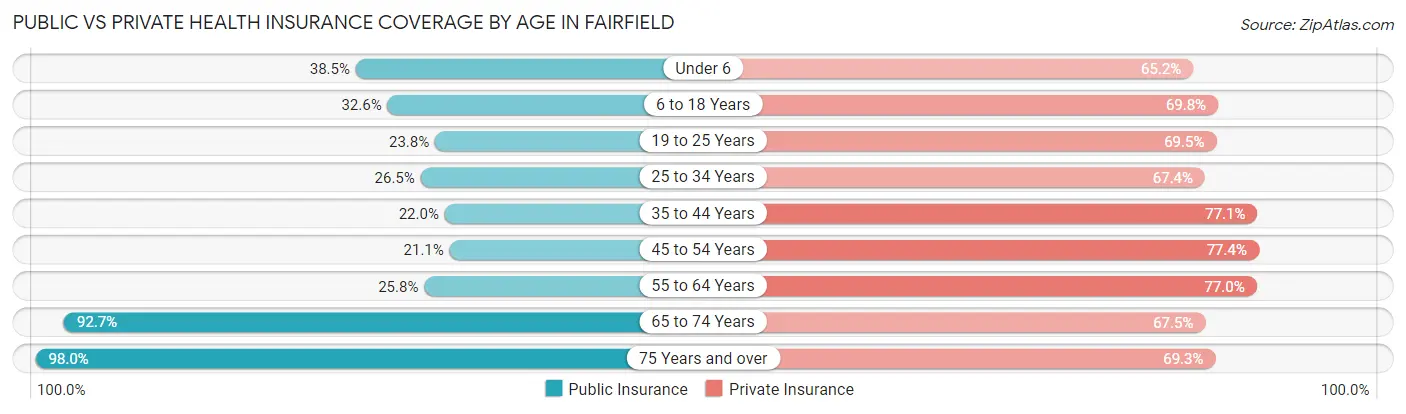
| Age Bracket | Public Insurance | Private Insurance |
| Under 6 | 3,871 (38.5%) | 6,554 (65.2%) |
| 6 to 18 Years | 6,891 (32.6%) | 14,737 (69.8%) |
| 19 to 25 Years | 2,557 (23.8%) | 7,465 (69.5%) |
| 25 to 34 Years | 4,038 (26.5%) | 10,272 (67.4%) |
| 35 to 44 Years | 3,432 (22.0%) | 12,021 (77.1%) |
| 45 to 54 Years | 3,090 (21.1%) | 11,326 (77.4%) |
| 55 to 64 Years | 3,354 (25.8%) | 9,998 (77.0%) |
| 65 to 74 Years | 8,899 (92.7%) | 6,475 (67.4%) |
| 75 Years and over | 6,543 (98.0%) | 4,629 (69.3%) |
| Total | 42,675 (36.6%) | 83,477 (71.6%) |
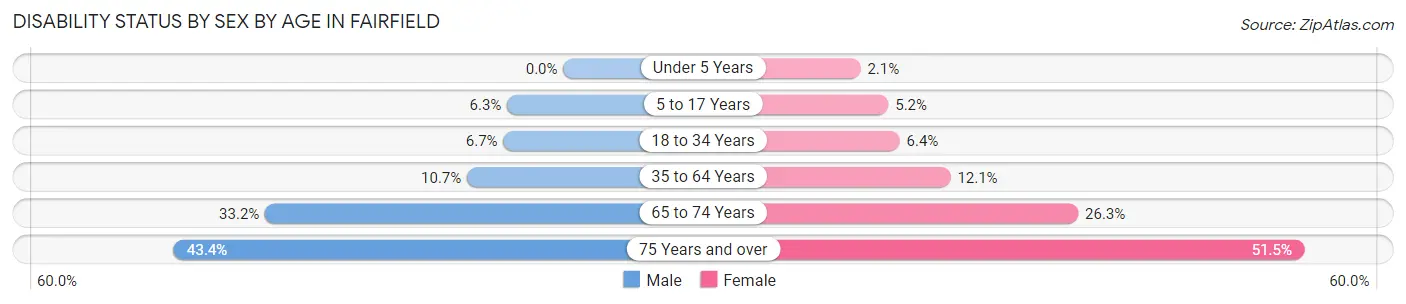
Disability Status by Sex by Age in Fairfield
| Age Bracket | Male | Female |
| Under 5 Years | 0 (0.0%) | 90 (2.1%) |
| 5 to 17 Years | 651 (6.3%) | 546 (5.2%) |
| 18 to 34 Years | 942 (6.7%) | 873 (6.4%) |
| 35 to 64 Years | 2,252 (10.7%) | 2,688 (12.1%) |
| 65 to 74 Years | 1,602 (33.2%) | 1,257 (26.3%) |
| 75 Years and over | 1,175 (43.4%) | 2,042 (51.4%) |
Disability Class by Sex by Age in Fairfield
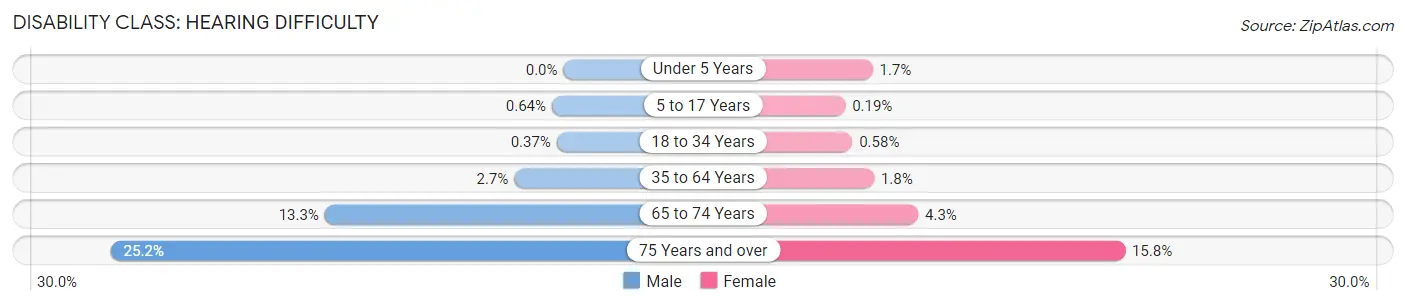
Disability Class: Hearing Difficulty
| Age Bracket | Male | Female |
| Under 5 Years | 0 (0.0%) | 74 (1.7%) |
| 5 to 17 Years | 67 (0.6%) | 20 (0.2%) |
| 18 to 34 Years | 52 (0.4%) | 79 (0.6%) |
| 35 to 64 Years | 575 (2.7%) | 397 (1.8%) |
| 65 to 74 Years | 641 (13.3%) | 203 (4.3%) |
| 75 Years and over | 683 (25.2%) | 626 (15.8%) |
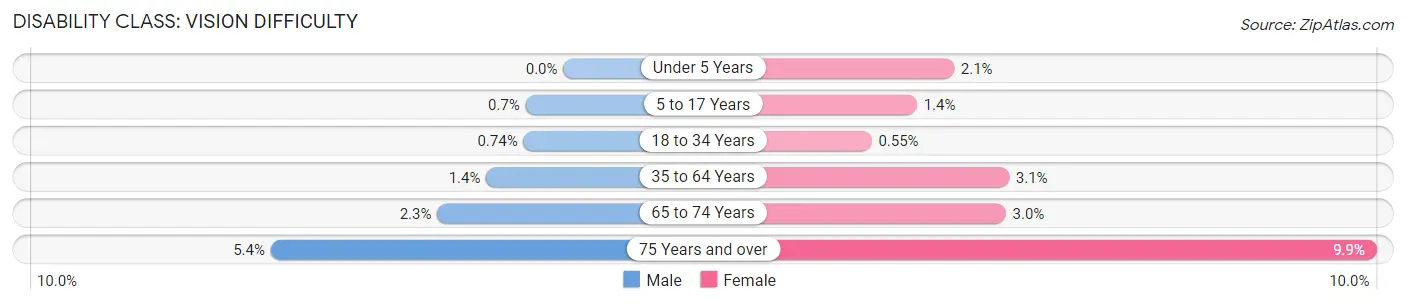
Disability Class: Vision Difficulty
| Age Bracket | Male | Female |
| Under 5 Years | 0 (0.0%) | 90 (2.1%) |
| 5 to 17 Years | 73 (0.7%) | 147 (1.4%) |
| 18 to 34 Years | 105 (0.7%) | 74 (0.5%) |
| 35 to 64 Years | 301 (1.4%) | 689 (3.1%) |
| 65 to 74 Years | 113 (2.3%) | 145 (3.0%) |
| 75 Years and over | 147 (5.4%) | 394 (9.9%) |
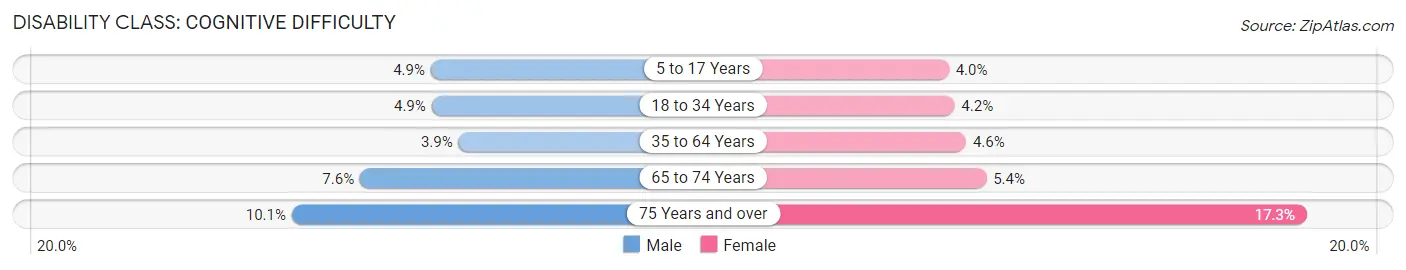
Disability Class: Cognitive Difficulty
| Age Bracket | Male | Female |
| 5 to 17 Years | 512 (4.9%) | 419 (4.0%) |
| 18 to 34 Years | 691 (4.9%) | 567 (4.2%) |
| 35 to 64 Years | 817 (3.9%) | 1,025 (4.6%) |
| 65 to 74 Years | 364 (7.5%) | 256 (5.4%) |
| 75 Years and over | 273 (10.1%) | 685 (17.3%) |
Disability Class: Ambulatory Difficulty
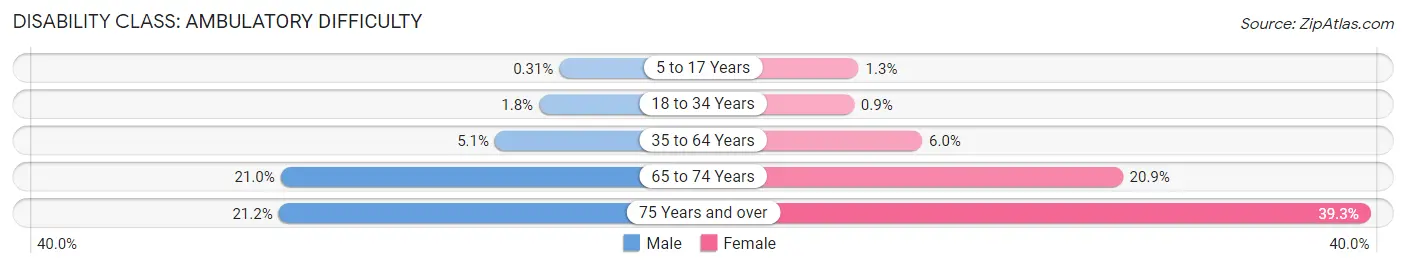
| Age Bracket | Male | Female |
| 5 to 17 Years | 32 (0.3%) | 132 (1.3%) |
| 18 to 34 Years | 256 (1.8%) | 122 (0.9%) |
| 35 to 64 Years | 1,069 (5.1%) | 1,324 (6.0%) |
| 65 to 74 Years | 1,013 (21.0%) | 996 (20.8%) |
| 75 Years and over | 573 (21.1%) | 1,558 (39.3%) |
Disability Class: Self-Care Difficulty
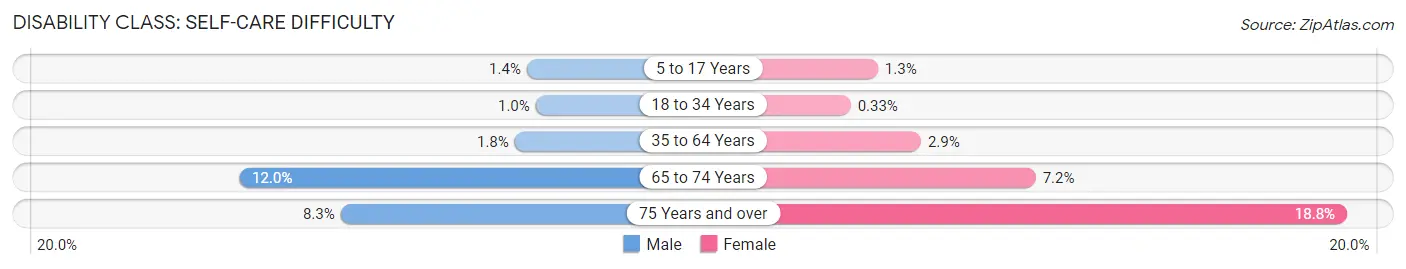
| Age Bracket | Male | Female |
| 5 to 17 Years | 141 (1.4%) | 141 (1.3%) |
| 18 to 34 Years | 146 (1.0%) | 45 (0.3%) |
| 35 to 64 Years | 381 (1.8%) | 653 (2.9%) |
| 65 to 74 Years | 581 (12.0%) | 344 (7.2%) |
| 75 Years and over | 224 (8.3%) | 744 (18.8%) |
Technology Access in Fairfield
Computing Device Access in Fairfield
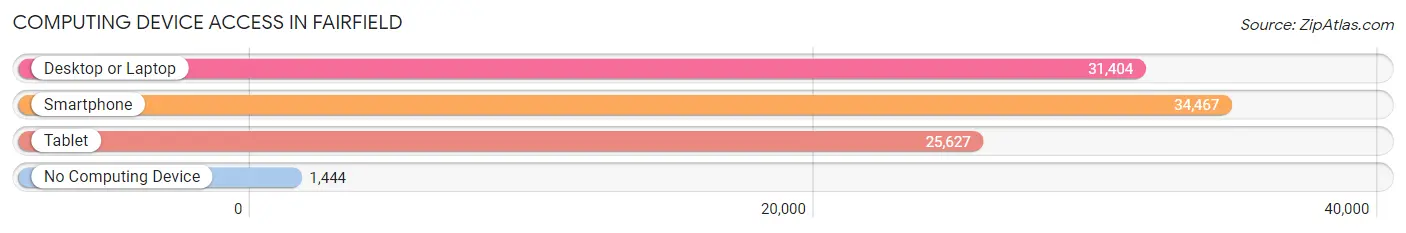
| Device Type | # Households | % Households |
| Desktop or Laptop | 31,404 | 83.5% |
| Smartphone | 34,467 | 91.7% |
| Tablet | 25,627 | 68.2% |
| No Computing Device | 1,444 | 3.8% |
| Total | 37,593 | 100.0% |
Internet Access in Fairfield
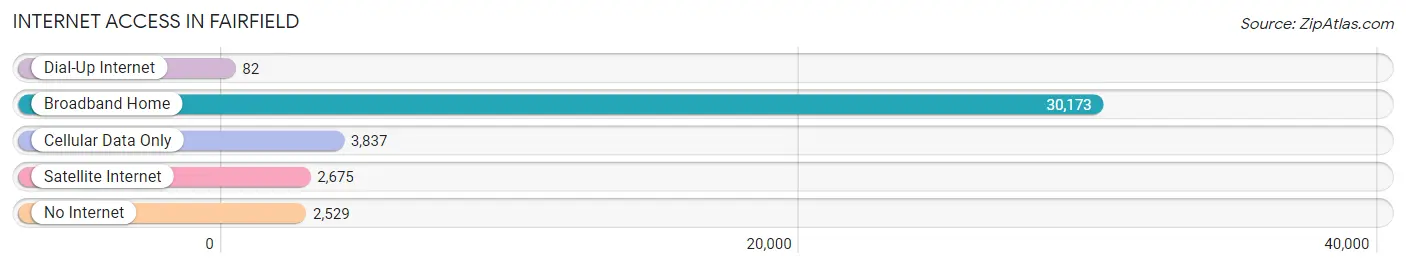
| Internet Type | # Households | % Households |
| Dial-Up Internet | 82 | 0.2% |
| Broadband Home | 30,173 | 80.3% |
| Cellular Data Only | 3,837 | 10.2% |
| Satellite Internet | 2,675 | 7.1% |
| No Internet | 2,529 | 6.7% |
| Total | 37,593 | 100.0% |
Fairfield Summary
Fairfield is a city located in Solano County, California, United States. It is situated in the northeastern part of the San Francisco Bay Area, approximately 40 miles northeast of San Francisco. The city has a population of approximately 108,000 people, making it the largest city in Solano County.
History
The area that is now Fairfield was originally inhabited by the Patwin Native American tribe. The first European settlers arrived in the area in the late 1700s, and the city was officially incorporated in 1903. The city was named after Fairfield, Connecticut, the hometown of one of the original settlers.
In the early 1900s, the city was a major agricultural center, with many farms and ranches in the area. The city was also home to a large military base, Travis Air Force Base, which was established in 1942. The base has since become a major economic driver for the city, and is now the largest employer in the area.
Geography
Fairfield is located in the northeastern part of the San Francisco Bay Area, approximately 40 miles northeast of San Francisco. The city is situated in the Central Valley, and is bordered by the cities of Vacaville, Suisun City, and Rio Vista. The city covers an area of approximately 28 square miles, and has a population density of approximately 3,800 people per square mile.
The city is located at the intersection of Interstate 80 and Interstate 680, making it easily accessible from the Bay Area and other parts of California. The city is also served by the Fairfield-Suisun Transit bus system, which provides public transportation throughout the city and surrounding areas.
Economy
Fairfield is a major economic center in the Bay Area, and is home to a number of large employers. The largest employer in the city is Travis Air Force Base, which employs over 10,000 people. Other major employers in the city include the Solano County Office of Education, Solano Community College, and the Solano County Sheriff’s Office.
The city is also home to a number of retail and commercial businesses, including the Solano Town Center Mall, which is the largest shopping mall in the area. The city is also home to a number of manufacturing and industrial businesses, including the Anheuser-Busch brewery, which is the largest brewery in the state.
Demographics
As of the 2010 census, the population of Fairfield was 108,321, with a population density of 3,800 people per square mile. The racial makeup of the city was 57.2% White, 16.3% African American, 0.7% Native American, 11.2% Asian, 0.3% Pacific Islander, and 14.5% from other races. Hispanic or Latino of any race were 24.2% of the population.
The median income for a household in the city was $60,845, and the median income for a family was $71,817. The per capita income for the city was $27,837. About 11.2% of families and 14.3% of the population were below the poverty line, including 19.2% of those under age 18 and 6.7% of those age 65 or over.
Fairfield is a diverse city, with a variety of cultures and backgrounds represented. The city is home to a large Hispanic population, as well as a large Asian population. The city is also home to a large military population, due to the presence of Travis Air Force Base.
Common Questions
What is Per Capita Income in Fairfield?
Per Capita income in Fairfield is $40,600.
What is the Median Family Income in Fairfield?
Median Family Income in Fairfield is $108,091.
What is the Median Household income in Fairfield?
Median Household Income in Fairfield is $98,857.
What is Income or Wage Gap in Fairfield?
Income or Wage Gap in Fairfield is 27.5%.
Women in Fairfield earn 72.5 cents for every dollar earned by a man.
What is Family Income Deficit in Fairfield?
Family Income Deficit in Fairfield is $12,073.
Families that are below poverty line in Fairfield earn $12,073 less on average than the poverty threshold level.
What is Inequality or Gini Index in Fairfield?
Inequality or Gini Index in Fairfield is 0.42.
What is the Total Population of Fairfield?
Total Population of Fairfield is 119,420.
What is the Total Male Population of Fairfield?
Total Male Population of Fairfield is 59,319.
What is the Total Female Population of Fairfield?
Total Female Population of Fairfield is 60,101.
What is the Ratio of Males per 100 Females in Fairfield?
There are 98.70 Males per 100 Females in Fairfield.
What is the Ratio of Females per 100 Males in Fairfield?
There are 101.32 Females per 100 Males in Fairfield.
What is the Median Population Age in Fairfield?
Median Population Age in Fairfield is 35.8 Years.
What is the Average Family Size in Fairfield
Average Family Size in Fairfield is 3.6 People.
What is the Average Household Size in Fairfield
Average Household Size in Fairfield is 3.1 People.
How Large is the Labor Force in Fairfield?
There are 60,558 People in the Labor Forcein in Fairfield.
What is the Percentage of People in the Labor Force in Fairfield?
64.9% of People are in the Labor Force in Fairfield.
What is the Unemployment Rate in Fairfield?
Unemployment Rate in Fairfield is 5.5%.