Cities with the Highest Percentage of Black / African American Population in South Carolina
RELATED REPORTS & OPTIONS
Black / African American
South Carolina
Compare Cities
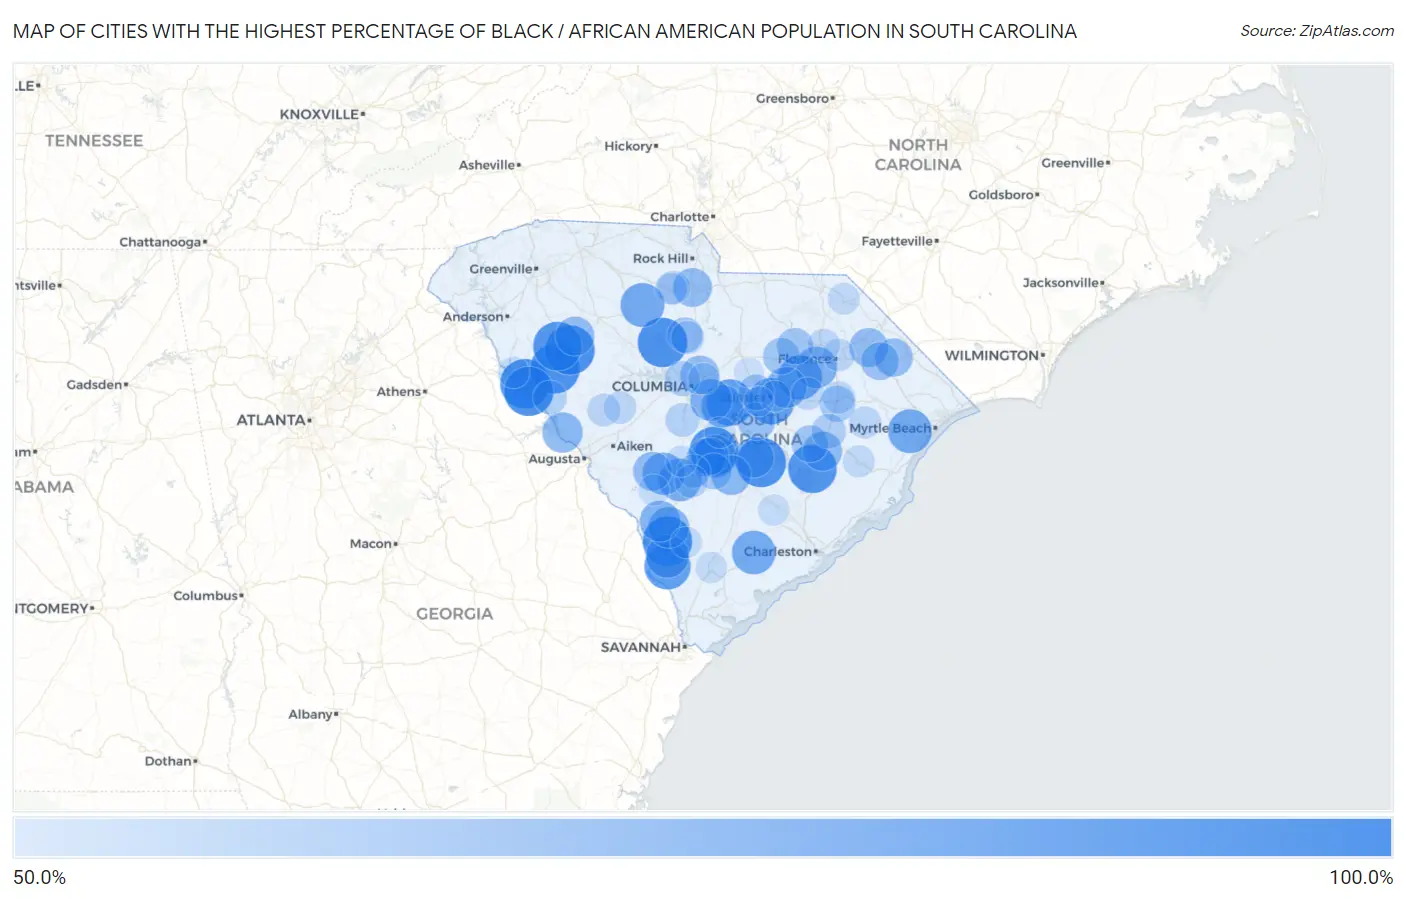
Map of Cities with the Highest Percentage of Black / African American Population in South Carolina
0.0%
100.0%
Cities with the Highest Percentage of Black / African American Population in South Carolina
| City | Black / African American | vs State | vs National | |
| 1. | Mount Carmel | 100.0% | 25.8%(+74.2)#1 | 12.5%(+87.5)#9 |
| 2. | Promised Land | 100.0% | 25.8%(+74.2)#2 | 12.5%(+87.5)#12 |
| 3. | Gifford | 100.0% | 25.8%(+74.2)#3 | 12.5%(+87.5)#16 |
| 4. | Vance | 100.0% | 25.8%(+74.2)#4 | 12.5%(+87.5)#28 |
| 5. | Browntown | 100.0% | 25.8%(+74.2)#5 | 12.5%(+87.5)#30 |
| 6. | Willington | 100.0% | 25.8%(+74.2)#6 | 12.5%(+87.5)#33 |
| 7. | Jenkinsville | 100.0% | 25.8%(+74.2)#7 | 12.5%(+87.5)#38 |
| 8. | Coronaca | 100.0% | 25.8%(+74.2)#8 | 12.5%(+87.5)#49 |
| 9. | Coosawhatchie | 100.0% | 25.8%(+74.2)#9 | 12.5%(+87.5)#57 |
| 10. | Brookdale | 98.3% | 25.8%(+72.5)#10 | 12.5%(+85.9)#77 |
| 11. | Cokesbury | 98.1% | 25.8%(+72.4)#11 | 12.5%(+85.7)#79 |
| 12. | Dunbar | 97.9% | 25.8%(+72.1)#12 | 12.5%(+85.5)#81 |
| 13. | Russellville | 97.9% | 25.8%(+72.1)#13 | 12.5%(+85.4)#84 |
| 14. | Newtown | 96.1% | 25.8%(+70.3)#14 | 12.5%(+83.6)#101 |
| 15. | Helena | 94.6% | 25.8%(+68.8)#15 | 12.5%(+82.2)#118 |
| 16. | Dale | 94.0% | 25.8%(+68.3)#16 | 12.5%(+81.6)#123 |
| 17. | Eastover | 93.0% | 25.8%(+67.2)#17 | 12.5%(+80.5)#136 |
| 18. | South Sumter | 92.8% | 25.8%(+67.1)#18 | 12.5%(+80.4)#143 |
| 19. | Scotia | 92.8% | 25.8%(+67.0)#19 | 12.5%(+80.3)#144 |
| 20. | Foreston | 92.5% | 25.8%(+66.7)#20 | 12.5%(+80.0)#147 |
| 21. | Lynchburg | 88.3% | 25.8%(+62.5)#21 | 12.5%(+75.8)#217 |
| 22. | Carlisle | 87.5% | 25.8%(+61.7)#22 | 12.5%(+75.0)#231 |
| 23. | Bucksport | 87.4% | 25.8%(+61.6)#23 | 12.5%(+74.9)#234 |
| 24. | Jacksonboro | 86.7% | 25.8%(+60.9)#24 | 12.5%(+74.2)#247 |
| 25. | Cash | 85.9% | 25.8%(+60.1)#25 | 12.5%(+73.4)#262 |
| 26. | Estill | 85.5% | 25.8%(+59.7)#26 | 12.5%(+73.0)#268 |
| 27. | Elliott | 84.6% | 25.8%(+58.8)#27 | 12.5%(+72.1)#292 |
| 28. | Denmark | 84.3% | 25.8%(+58.5)#28 | 12.5%(+71.8)#298 |
| 29. | Wilkinson Heights | 83.9% | 25.8%(+58.2)#29 | 12.5%(+71.5)#305 |
| 30. | Blackville | 83.8% | 25.8%(+58.0)#30 | 12.5%(+71.4)#310 |
| 31. | Gadsden | 83.7% | 25.8%(+57.9)#31 | 12.5%(+71.2)#312 |
| 32. | Hopkins | 83.3% | 25.8%(+57.5)#32 | 12.5%(+70.8)#321 |
| 33. | Timmonsville | 82.4% | 25.8%(+56.6)#33 | 12.5%(+69.9)#335 |
| 34. | Manville | 81.6% | 25.8%(+55.8)#34 | 12.5%(+69.1)#356 |
| 35. | Mayesville | 81.0% | 25.8%(+55.3)#35 | 12.5%(+68.6)#366 |
| 36. | Fairfax | 80.8% | 25.8%(+55.0)#36 | 12.5%(+68.3)#371 |
| 37. | Allendale | 80.5% | 25.8%(+54.7)#37 | 12.5%(+68.0)#380 |
| 38. | Clarks Hill | 79.5% | 25.8%(+53.7)#38 | 12.5%(+67.0)#403 |
| 39. | Santee | 79.1% | 25.8%(+53.3)#39 | 12.5%(+66.6)#419 |
| 40. | Bowman | 78.4% | 25.8%(+52.6)#40 | 12.5%(+65.9)#429 |
| 41. | Lane | 77.2% | 25.8%(+51.4)#41 | 12.5%(+64.7)#451 |
| 42. | Waterloo | 76.6% | 25.8%(+50.9)#42 | 12.5%(+64.2)#460 |
| 43. | Wisacky | 76.6% | 25.8%(+50.8)#43 | 12.5%(+64.1)#461 |
| 44. | Richburg | 76.3% | 25.8%(+50.5)#44 | 12.5%(+63.8)#468 |
| 45. | Elko | 76.1% | 25.8%(+50.3)#45 | 12.5%(+63.6)#472 |
| 46. | Sellers | 75.9% | 25.8%(+50.2)#46 | 12.5%(+63.5)#473 |
| 47. | Dentsville | 75.9% | 25.8%(+50.1)#47 | 12.5%(+63.4)#477 |
| 48. | Edisto | 75.4% | 25.8%(+49.6)#48 | 12.5%(+62.9)#490 |
| 49. | Mullins | 74.8% | 25.8%(+49.0)#49 | 12.5%(+62.3)#502 |
| 50. | Marion | 73.9% | 25.8%(+48.1)#50 | 12.5%(+61.4)#524 |
| 51. | Pinewood | 73.4% | 25.8%(+47.6)#51 | 12.5%(+60.9)#545 |
| 52. | Centenary | 73.2% | 25.8%(+47.4)#52 | 12.5%(+60.7)#548 |
| 53. | Orangeburg | 73.1% | 25.8%(+47.3)#53 | 12.5%(+60.6)#549 |
| 54. | Gillisonville | 71.8% | 25.8%(+46.0)#54 | 12.5%(+59.3)#576 |
| 55. | Greeleyville | 71.8% | 25.8%(+46.0)#55 | 12.5%(+59.3)#577 |
| 56. | Bishopville | 71.1% | 25.8%(+45.3)#56 | 12.5%(+58.7)#593 |
| 57. | Lydia | 70.9% | 25.8%(+45.1)#57 | 12.5%(+58.5)#598 |
| 58. | Little Rock | 70.7% | 25.8%(+44.9)#58 | 12.5%(+58.2)#602 |
| 59. | Rains | 70.4% | 25.8%(+44.6)#59 | 12.5%(+57.9)#612 |
| 60. | Sheldon | 70.2% | 25.8%(+44.4)#60 | 12.5%(+57.7)#617 |
| 61. | Rowesville | 69.8% | 25.8%(+44.1)#61 | 12.5%(+57.4)#624 |
| 62. | Lake City | 69.6% | 25.8%(+43.8)#62 | 12.5%(+57.2)#630 |
| 63. | Cherryvale | 69.3% | 25.8%(+43.5)#63 | 12.5%(+56.8)#638 |
| 64. | Finklea | 69.2% | 25.8%(+43.4)#64 | 12.5%(+56.7)#639 |
| 65. | Winnsboro | 68.7% | 25.8%(+42.9)#65 | 12.5%(+56.2)#655 |
| 66. | Daviston | 67.9% | 25.8%(+42.1)#66 | 12.5%(+55.4)#674 |
| 67. | Zion | 67.6% | 25.8%(+41.9)#67 | 12.5%(+55.2)#677 |
| 68. | St Andrews | 67.6% | 25.8%(+41.8)#68 | 12.5%(+55.1)#678 |
| 69. | Kingstree | 67.0% | 25.8%(+41.2)#69 | 12.5%(+54.5)#686 |
| 70. | Mccormick | 65.2% | 25.8%(+39.4)#70 | 12.5%(+52.7)#734 |
| 71. | Swansea | 65.1% | 25.8%(+39.3)#71 | 12.5%(+52.6)#737 |
| 72. | Cope | 64.3% | 25.8%(+38.5)#72 | 12.5%(+51.8)#760 |
| 73. | Beech Island | 63.9% | 25.8%(+38.1)#73 | 12.5%(+51.5)#774 |
| 74. | Eureka Mill | 63.9% | 25.8%(+38.1)#74 | 12.5%(+51.4)#777 |
| 75. | Bamberg | 63.7% | 25.8%(+37.9)#75 | 12.5%(+51.3)#784 |
| 76. | Winnsboro Mills | 63.5% | 25.8%(+37.7)#76 | 12.5%(+51.0)#791 |
| 77. | Johnston | 63.0% | 25.8%(+37.2)#77 | 12.5%(+50.6)#800 |
| 78. | Seabrook | 62.7% | 25.8%(+37.0)#78 | 12.5%(+50.3)#811 |
| 79. | Shiloh | 62.6% | 25.8%(+36.8)#79 | 12.5%(+50.1)#816 |
| 80. | Capitol View | 62.4% | 25.8%(+36.6)#80 | 12.5%(+49.9)#821 |
| 81. | Quinby | 62.3% | 25.8%(+36.5)#81 | 12.5%(+49.8)#824 |
| 82. | Scranton | 62.3% | 25.8%(+36.5)#82 | 12.5%(+49.8)#825 |
| 83. | Darlington | 62.3% | 25.8%(+36.5)#83 | 12.5%(+49.8)#826 |
| 84. | Ridge Spring | 62.1% | 25.8%(+36.3)#84 | 12.5%(+49.6)#834 |
| 85. | Stuckey | 61.7% | 25.8%(+35.9)#85 | 12.5%(+49.3)#843 |
| 86. | Chester | 61.4% | 25.8%(+35.6)#86 | 12.5%(+48.9)#853 |
| 87. | Andrews | 60.8% | 25.8%(+35.0)#87 | 12.5%(+48.3)#871 |
| 88. | Bennettsville | 60.7% | 25.8%(+35.0)#88 | 12.5%(+48.3)#872 |
| 89. | Woodfield | 60.1% | 25.8%(+34.3)#89 | 12.5%(+47.6)#891 |
| 90. | Varnville | 60.0% | 25.8%(+34.2)#90 | 12.5%(+47.5)#895 |
| 91. | Calhoun Falls | 59.9% | 25.8%(+34.1)#91 | 12.5%(+47.5)#896 |
| 92. | Yemassee | 59.8% | 25.8%(+34.0)#92 | 12.5%(+47.3)#902 |
| 93. | Lobeco | 59.7% | 25.8%(+33.9)#93 | 12.5%(+47.2)#904 |
| 94. | Ridgeville | 59.7% | 25.8%(+33.9)#94 | 12.5%(+47.2)#906 |
| 95. | Norway | 59.4% | 25.8%(+33.6)#95 | 12.5%(+46.9)#914 |
| 96. | St Matthews | 59.3% | 25.8%(+33.5)#96 | 12.5%(+46.8)#916 |
| 97. | Barnwell | 59.2% | 25.8%(+33.4)#97 | 12.5%(+46.7)#919 |
| 98. | East Sumter | 58.8% | 25.8%(+33.0)#98 | 12.5%(+46.3)#930 |
| 99. | Cane Savannah | 57.5% | 25.8%(+31.7)#99 | 12.5%(+45.0)#984 |
| 100. | Rembert | 57.3% | 25.8%(+31.5)#100 | 12.5%(+44.8)#993 |
Common Questions
What are the Top 10 Cities with the Highest Percentage of Black / African American Population in South Carolina?
Top 10 Cities with the Highest Percentage of Black / African American Population in South Carolina are:
#1
100.0%
#2
100.0%
#3
100.0%
#4
100.0%
#5
100.0%
#6
100.0%
#7
100.0%
#8
98.3%
#9
98.1%
#10
97.9%
What city has the Highest Percentage of Black / African American Population in South Carolina?
Mount Carmel has the Highest Percentage of Black / African American Population in South Carolina with 100.0%.
What is the Percentage of Black / African American Population in the State of South Carolina?
Percentage of Black / African American Population in South Carolina is 25.8%.
What is the Percentage of Black / African American Population in the United States?
Percentage of Black / African American Population in the United States is 12.5%.