Lemon Grove, CA Map & Demographics
Lemon Grove Map
Lemon Grove Overview
$33,270
PER CAPITA INCOME
$88,750
AVG FAMILY INCOME
$77,833
AVG HOUSEHOLD INCOME
26.1%
WAGE / INCOME GAP [ % ]
73.9¢/ $1
WAGE / INCOME GAP [ $ ]
0.41
INEQUALITY / GINI INDEX
27,482
TOTAL POPULATION
13,866
MALE POPULATION
13,616
FEMALE POPULATION
101.84
MALES / 100 FEMALES
98.20
FEMALES / 100 MALES
37.5
MEDIAN AGE
3.6
AVG FAMILY SIZE
3.0
AVG HOUSEHOLD SIZE
14,506
LABOR FORCE [ PEOPLE ]
65.0%
PERCENT IN LABOR FORCE
8.2%
UNEMPLOYMENT RATE
Lemon Grove Zip Codes
Lemon Grove Area Codes
Income in Lemon Grove
Income Overview in Lemon Grove
Per Capita Income in Lemon Grove is $33,270, while median incomes of families and households are $88,750 and $77,833 respectively.
| Characteristic | Number | Measure |
| Per Capita Income | 27,482 | $33,270 |
| Median Family Income | 6,319 | $88,750 |
| Mean Family Income | 6,319 | $106,648 |
| Median Household Income | 9,159 | $77,833 |
| Mean Household Income | 9,159 | $94,688 |
| Income Deficit | 6,319 | $0 |
| Wage / Income Gap (%) | 27,482 | 26.11% |
| Wage / Income Gap ($) | 27,482 | 73.89¢ per $1 |
| Gini / Inequality Index | 27,482 | 0.41 |
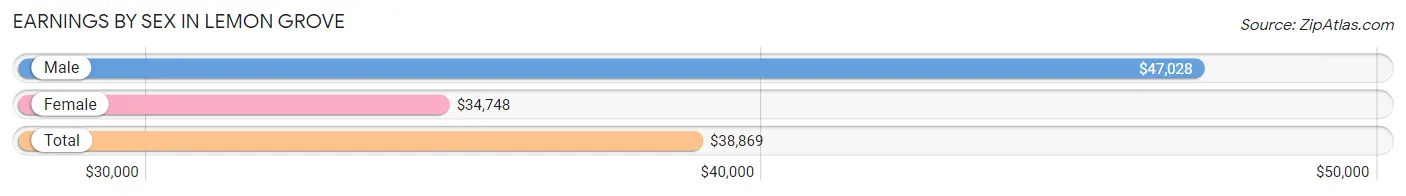
Earnings by Sex in Lemon Grove
Average Earnings in Lemon Grove are $38,869, $47,028 for men and $34,748 for women, a difference of 26.1%.
| Sex | Number | Average Earnings |
| Male | 7,629 (52.8%) | $47,028 |
| Female | 6,826 (47.2%) | $34,748 |
| Total | 14,455 (100.0%) | $38,869 |
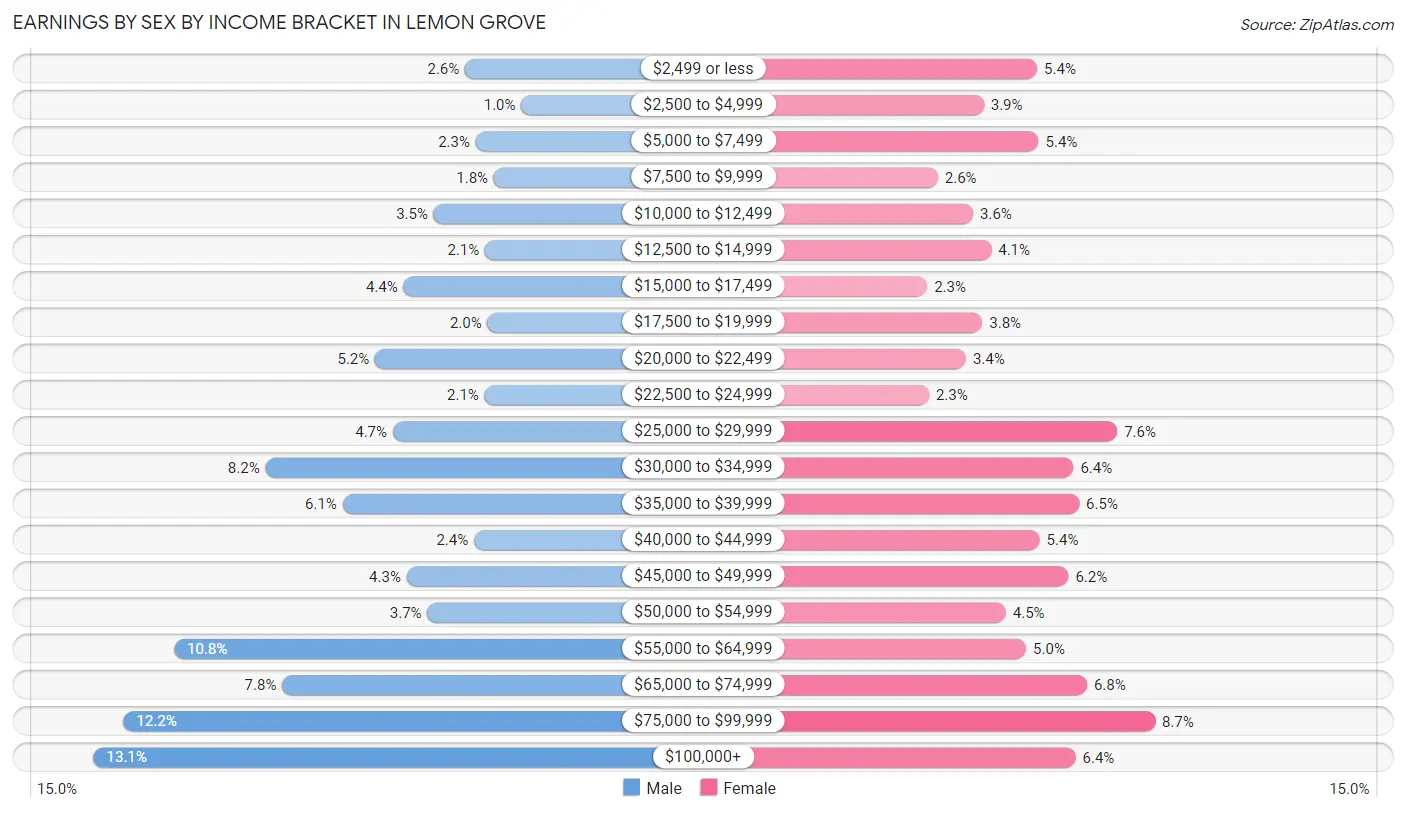
Earnings by Sex by Income Bracket in Lemon Grove
The most common earnings brackets in Lemon Grove are $100,000+ for men (996 | 13.1%) and $75,000 to $99,999 for women (591 | 8.7%).
| Income | Male | Female |
| $2,499 or less | 200 (2.6%) | 365 (5.3%) |
| $2,500 to $4,999 | 79 (1.0%) | 263 (3.8%) |
| $5,000 to $7,499 | 177 (2.3%) | 368 (5.4%) |
| $7,500 to $9,999 | 138 (1.8%) | 175 (2.6%) |
| $10,000 to $12,499 | 267 (3.5%) | 242 (3.5%) |
| $12,500 to $14,999 | 157 (2.1%) | 277 (4.1%) |
| $15,000 to $17,499 | 332 (4.3%) | 154 (2.3%) |
| $17,500 to $19,999 | 152 (2.0%) | 260 (3.8%) |
| $20,000 to $22,499 | 393 (5.1%) | 229 (3.4%) |
| $22,500 to $24,999 | 158 (2.1%) | 158 (2.3%) |
| $25,000 to $29,999 | 355 (4.6%) | 519 (7.6%) |
| $30,000 to $34,999 | 628 (8.2%) | 435 (6.4%) |
| $35,000 to $39,999 | 462 (6.1%) | 446 (6.5%) |
| $40,000 to $44,999 | 181 (2.4%) | 370 (5.4%) |
| $45,000 to $49,999 | 325 (4.3%) | 425 (6.2%) |
| $50,000 to $54,999 | 281 (3.7%) | 305 (4.5%) |
| $55,000 to $64,999 | 824 (10.8%) | 344 (5.0%) |
| $65,000 to $74,999 | 592 (7.8%) | 461 (6.8%) |
| $75,000 to $99,999 | 932 (12.2%) | 591 (8.7%) |
| $100,000+ | 996 (13.1%) | 439 (6.4%) |
| Total | 7,629 (100.0%) | 6,826 (100.0%) |
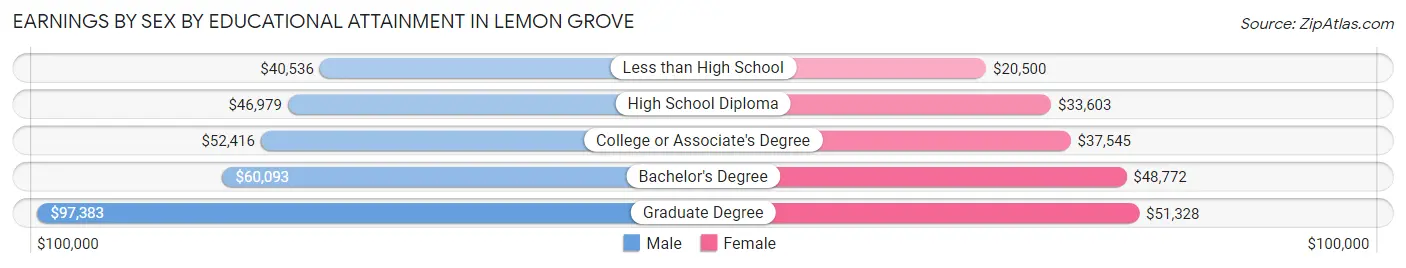
Earnings by Sex by Educational Attainment in Lemon Grove
Average earnings in Lemon Grove are $54,884 for men and $37,182 for women, a difference of 32.3%. Men with an educational attainment of graduate degree enjoy the highest average annual earnings of $97,383, while those with less than high school education earn the least with $40,536. Women with an educational attainment of graduate degree earn the most with the average annual earnings of $51,328, while those with less than high school education have the smallest earnings of $20,500.
| Educational Attainment | Male Income | Female Income |
| Less than High School | $40,536 | $20,500 |
| High School Diploma | $46,979 | $33,603 |
| College or Associate's Degree | $52,416 | $37,545 |
| Bachelor's Degree | $60,093 | $48,772 |
| Graduate Degree | $97,383 | $51,328 |
| Total | $54,884 | $37,182 |
Family Income in Lemon Grove
Family Income Brackets in Lemon Grove
According to the Lemon Grove family income data, there are 1,611 families falling into the $100,000 to $149,999 income range, which is the most common income bracket and makes up 25.5% of all families. Conversely, the $10,000 to $14,999 income bracket is the least frequent group with only 44 families (0.7%) belonging to this category.
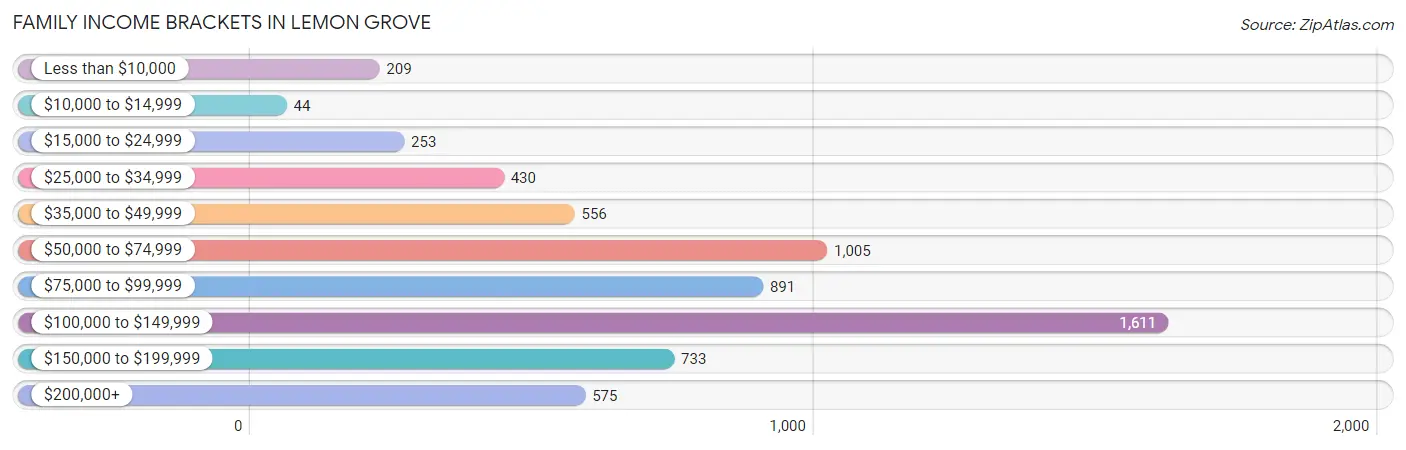
| Income Bracket | # Families | % Families |
| Less than $10,000 | 209 | 3.3% |
| $10,000 to $14,999 | 44 | 0.7% |
| $15,000 to $24,999 | 253 | 4.0% |
| $25,000 to $34,999 | 430 | 6.8% |
| $35,000 to $49,999 | 556 | 8.8% |
| $50,000 to $74,999 | 1,005 | 15.9% |
| $75,000 to $99,999 | 891 | 14.1% |
| $100,000 to $149,999 | 1,611 | 25.5% |
| $150,000 to $199,999 | 733 | 11.6% |
| $200,000+ | 575 | 9.1% |
Family Income by Famaliy Size in Lemon Grove
7+ person families (304 | 4.8%) account for the highest median family income in Lemon Grove with $201,750 per family, while 2-person families (2,318 | 36.7%) have the highest median income of $36,601 per family member.
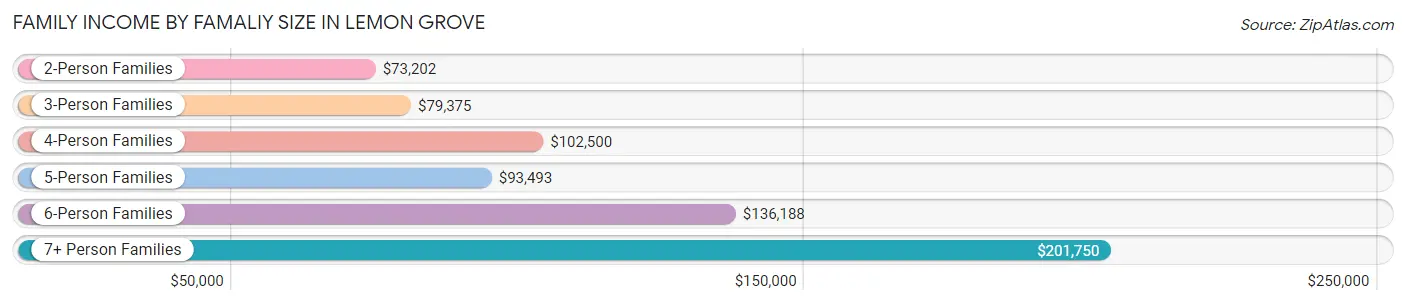
| Income Bracket | # Families | Median Income |
| 2-Person Families | 2,318 (36.7%) | $73,202 |
| 3-Person Families | 1,723 (27.3%) | $79,375 |
| 4-Person Families | 1,152 (18.2%) | $102,500 |
| 5-Person Families | 547 (8.7%) | $93,493 |
| 6-Person Families | 275 (4.3%) | $136,188 |
| 7+ Person Families | 304 (4.8%) | $201,750 |
| Total | 6,319 (100.0%) | $88,750 |
Family Income by Number of Earners in Lemon Grove
The median family income in Lemon Grove is $88,750, with families comprising 3+ earners (1,106) having the highest median family income of $158,971, while families with no earners (751) have the lowest median family income of $45,398, accounting for 17.5% and 11.9% of families, respectively.
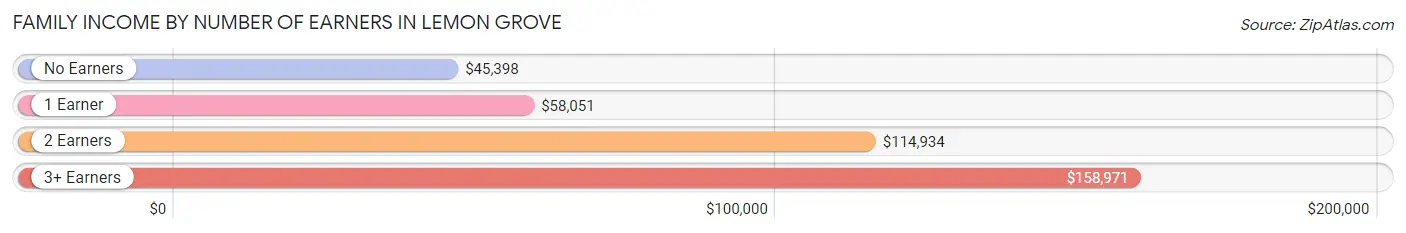
| Number of Earners | # Families | Median Income |
| No Earners | 751 (11.9%) | $45,398 |
| 1 Earner | 1,993 (31.5%) | $58,051 |
| 2 Earners | 2,469 (39.1%) | $114,934 |
| 3+ Earners | 1,106 (17.5%) | $158,971 |
| Total | 6,319 (100.0%) | $88,750 |
Household Income in Lemon Grove
Household Income Brackets in Lemon Grove
With 2,061 households falling in the category, the $100,000 to $149,999 income range is the most frequent in Lemon Grove, accounting for 22.5% of all households. In contrast, only 256 households (2.8%) fall into the $10,000 to $14,999 income bracket, making it the least populous group.
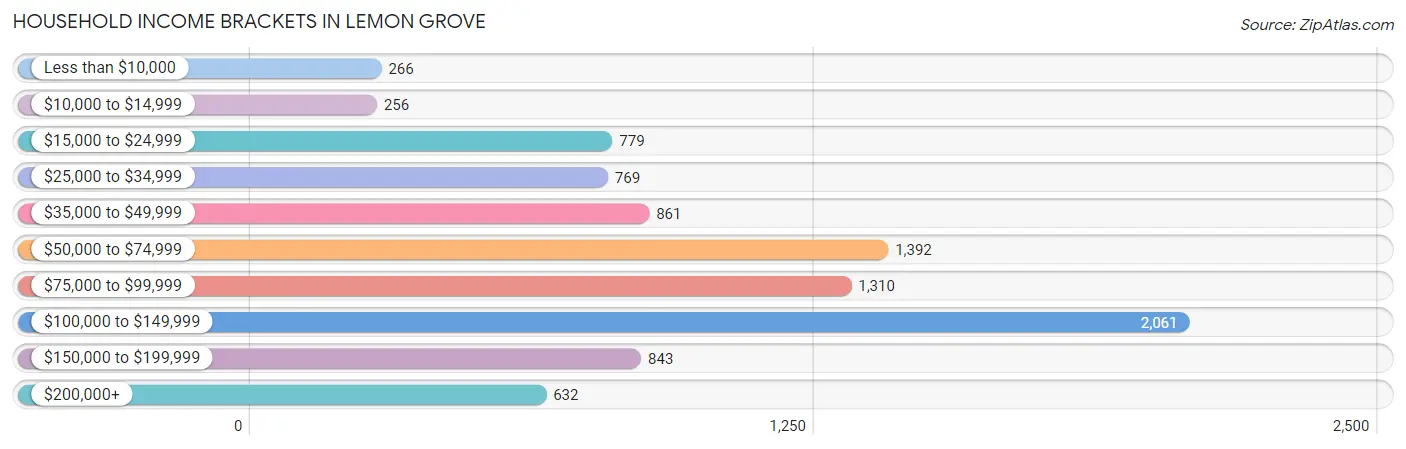
| Income Bracket | # Households | % Households |
| Less than $10,000 | 266 | 2.9% |
| $10,000 to $14,999 | 256 | 2.8% |
| $15,000 to $24,999 | 779 | 8.5% |
| $25,000 to $34,999 | 769 | 8.4% |
| $35,000 to $49,999 | 861 | 9.4% |
| $50,000 to $74,999 | 1,392 | 15.2% |
| $75,000 to $99,999 | 1,310 | 14.3% |
| $100,000 to $149,999 | 2,061 | 22.5% |
| $150,000 to $199,999 | 843 | 9.2% |
| $200,000+ | 632 | 6.9% |
Household Income by Householder Age in Lemon Grove
The median household income in Lemon Grove is $77,833, with the highest median household income of $90,444 found in the 25 to 44 years age bracket for the primary householder. A total of 2,890 households (31.6%) fall into this category. Meanwhile, the 65+ years age bracket for the primary householder has the lowest median household income of $56,295, with 2,433 households (26.6%) in this group.
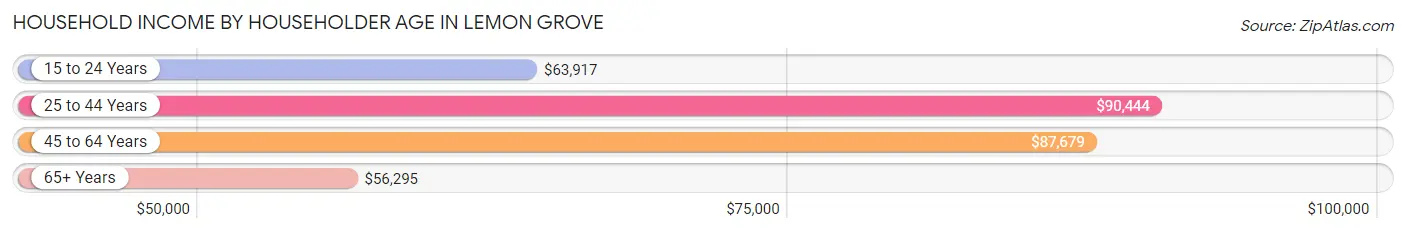
| Income Bracket | # Households | Median Income |
| 15 to 24 Years | 192 (2.1%) | $63,917 |
| 25 to 44 Years | 2,890 (31.6%) | $90,444 |
| 45 to 64 Years | 3,644 (39.8%) | $87,679 |
| 65+ Years | 2,433 (26.6%) | $56,295 |
| Total | 9,159 (100.0%) | $77,833 |
Poverty in Lemon Grove
Income Below Poverty by Sex and Age in Lemon Grove
With 10.3% poverty level for males and 9.6% for females among the residents of Lemon Grove, 16 and 17 year old males and 65 to 74 year old females are the most vulnerable to poverty, with 189 males (54.1%) and 187 females (14.5%) in their respective age groups living below the poverty level.
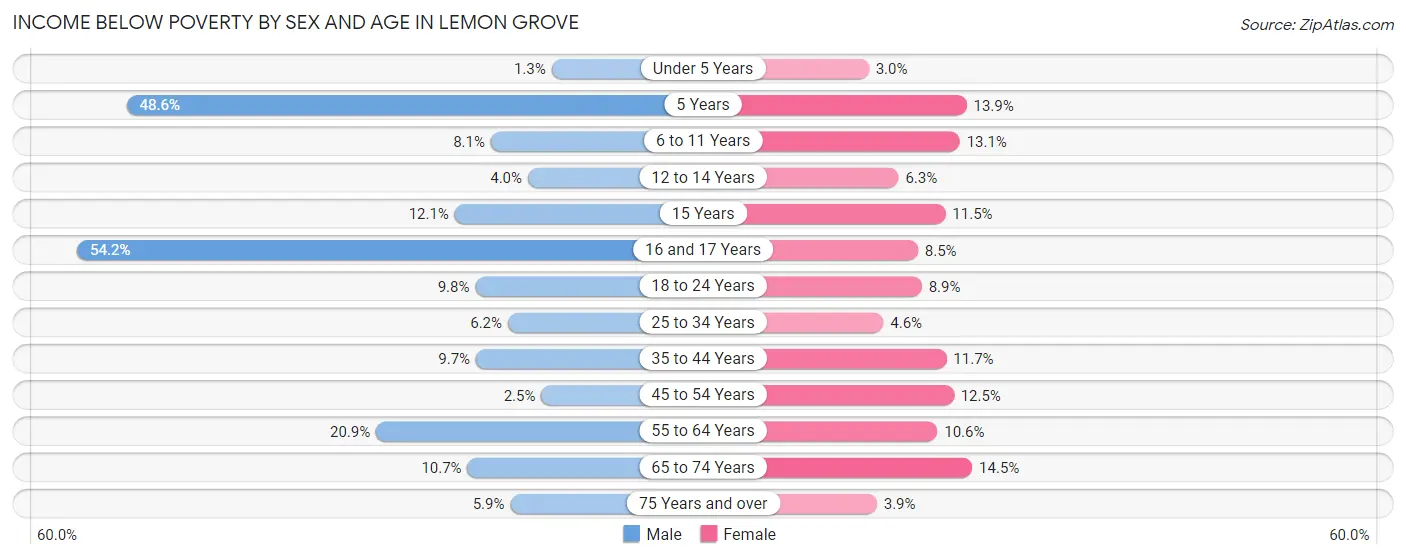
| Age Bracket | Male | Female |
| Under 5 Years | 11 (1.3%) | 18 (3.0%) |
| 5 Years | 89 (48.6%) | 20 (13.9%) |
| 6 to 11 Years | 58 (8.1%) | 135 (13.1%) |
| 12 to 14 Years | 27 (4.0%) | 25 (6.3%) |
| 15 Years | 34 (12.1%) | 15 (11.5%) |
| 16 and 17 Years | 189 (54.1%) | 41 (8.5%) |
| 18 to 24 Years | 127 (9.8%) | 108 (8.9%) |
| 25 to 34 Years | 153 (6.2%) | 92 (4.6%) |
| 35 to 44 Years | 163 (9.7%) | 198 (11.7%) |
| 45 to 54 Years | 44 (2.5%) | 196 (12.5%) |
| 55 to 64 Years | 353 (20.9%) | 224 (10.6%) |
| 65 to 74 Years | 150 (10.7%) | 187 (14.5%) |
| 75 Years and over | 23 (5.9%) | 30 (3.9%) |
| Total | 1,421 (10.3%) | 1,289 (9.6%) |
Income Above Poverty by Sex and Age in Lemon Grove
According to the poverty statistics in Lemon Grove, males aged under 5 years and females aged under 5 years are the age groups that are most secure financially, with 98.7% of males and 97.0% of females in these age groups living above the poverty line.
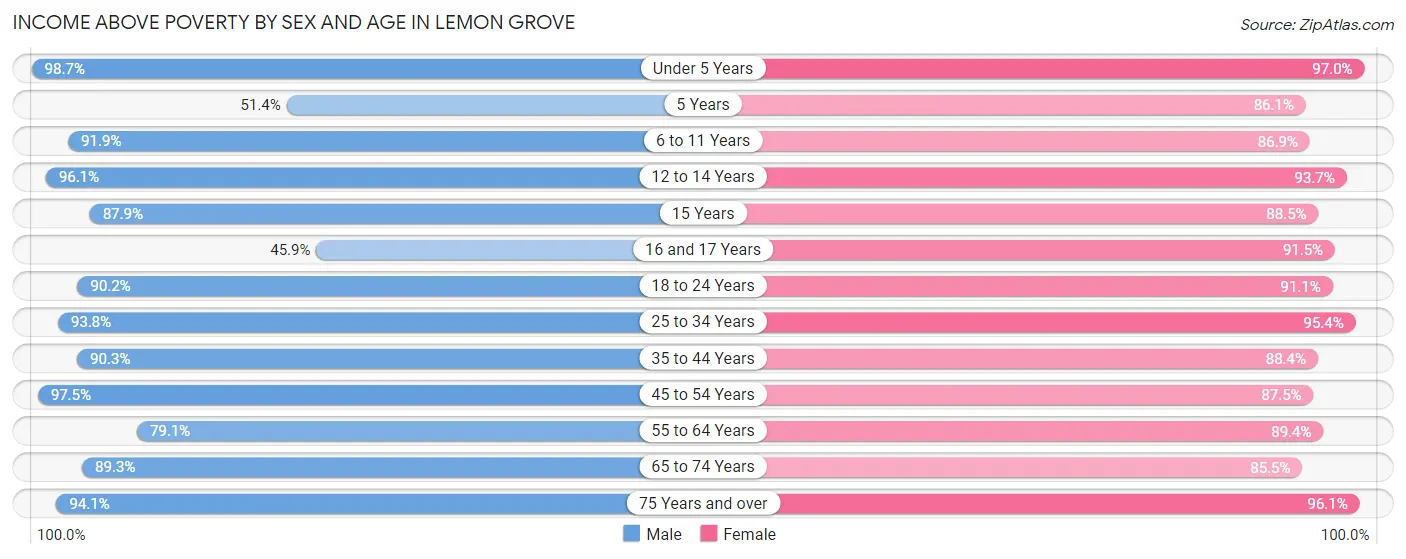
| Age Bracket | Male | Female |
| Under 5 Years | 831 (98.7%) | 583 (97.0%) |
| 5 Years | 94 (51.4%) | 124 (86.1%) |
| 6 to 11 Years | 660 (91.9%) | 893 (86.9%) |
| 12 to 14 Years | 656 (96.1%) | 371 (93.7%) |
| 15 Years | 247 (87.9%) | 115 (88.5%) |
| 16 and 17 Years | 160 (45.9%) | 443 (91.5%) |
| 18 to 24 Years | 1,167 (90.2%) | 1,105 (91.1%) |
| 25 to 34 Years | 2,324 (93.8%) | 1,896 (95.4%) |
| 35 to 44 Years | 1,510 (90.3%) | 1,501 (88.3%) |
| 45 to 54 Years | 1,747 (97.5%) | 1,377 (87.5%) |
| 55 to 64 Years | 1,339 (79.1%) | 1,881 (89.4%) |
| 65 to 74 Years | 1,254 (89.3%) | 1,101 (85.5%) |
| 75 Years and over | 366 (94.1%) | 739 (96.1%) |
| Total | 12,355 (89.7%) | 12,129 (90.4%) |
Income Below Poverty Among Married-Couple Families in Lemon Grove
The poverty statistics for married-couple families in Lemon Grove show that 2.8% or 119 of the total 4,278 families live below the poverty line. Families with no children have the highest poverty rate of 4.0%, comprising of 93 families. On the other hand, families with 5 or more children have the lowest poverty rate of 0.0%, which includes 0 families.
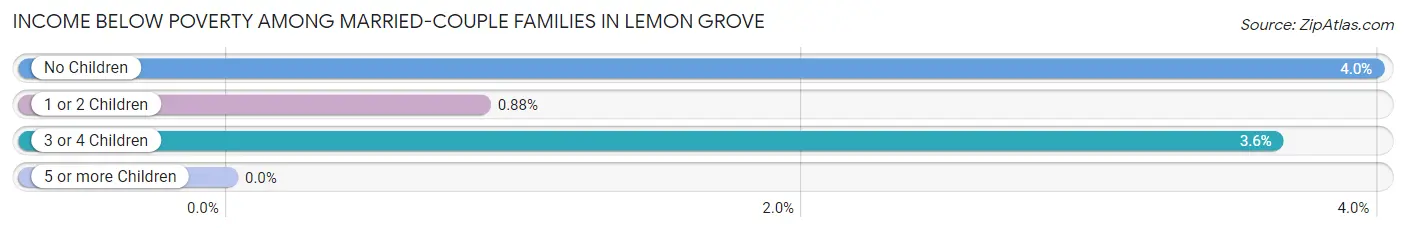
| Children | Above Poverty | Below Poverty |
| No Children | 2,238 (96.0%) | 93 (4.0%) |
| 1 or 2 Children | 1,582 (99.1%) | 14 (0.9%) |
| 3 or 4 Children | 318 (96.4%) | 12 (3.6%) |
| 5 or more Children | 21 (100.0%) | 0 (0.0%) |
| Total | 4,159 (97.2%) | 119 (2.8%) |
Income Below Poverty Among Single-Parent Households in Lemon Grove
According to the poverty data in Lemon Grove, 10.2% or 49 single-father households and 19.5% or 305 single-mother households are living below the poverty line. Among single-father households, those with 1 or 2 children have the highest poverty rate, with 49 households (22.3%) experiencing poverty. Likewise, among single-mother households, those with 3 or 4 children have the highest poverty rate, with 35 households (100.0%) falling below the poverty line.
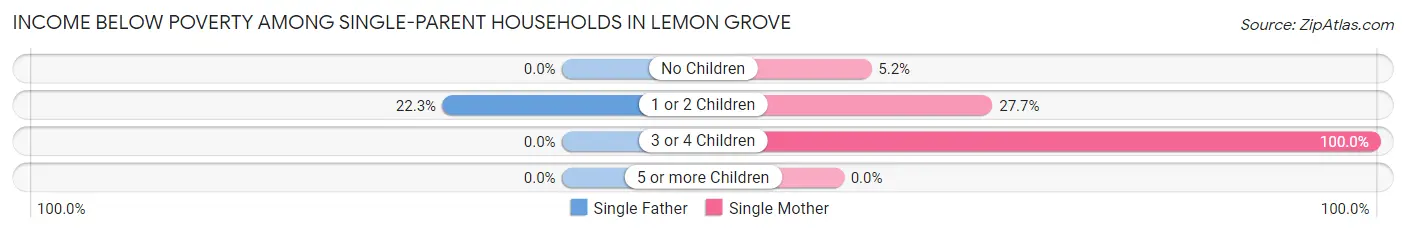
| Children | Single Father | Single Mother |
| No Children | 0 (0.0%) | 33 (5.2%) |
| 1 or 2 Children | 49 (22.3%) | 237 (27.7%) |
| 3 or 4 Children | 0 (0.0%) | 35 (100.0%) |
| 5 or more Children | 0 (0.0%) | 0 (0.0%) |
| Total | 49 (10.2%) | 305 (19.5%) |
Income Below Poverty Among Married-Couple vs Single-Parent Households in Lemon Grove
The poverty data for Lemon Grove shows that 119 of the married-couple family households (2.8%) and 354 of the single-parent households (17.3%) are living below the poverty level. Within the married-couple family households, those with no children have the highest poverty rate, with 93 households (4.0%) falling below the poverty line. Among the single-parent households, those with 3 or 4 children have the highest poverty rate, with 35 household (100.0%) living below poverty.
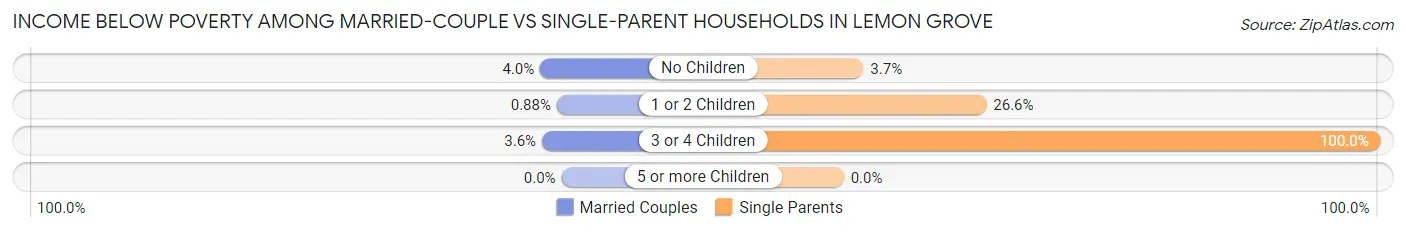
| Children | Married-Couple Families | Single-Parent Households |
| No Children | 93 (4.0%) | 33 (3.7%) |
| 1 or 2 Children | 14 (0.9%) | 286 (26.6%) |
| 3 or 4 Children | 12 (3.6%) | 35 (100.0%) |
| 5 or more Children | 0 (0.0%) | 0 (0.0%) |
| Total | 119 (2.8%) | 354 (17.3%) |
Race in Lemon Grove
The most populous races in Lemon Grove are Hispanic or Latino (11,868 | 43.2%), White / Caucasian (11,666 | 42.4%), and Two or more Races (5,151 | 18.7%).
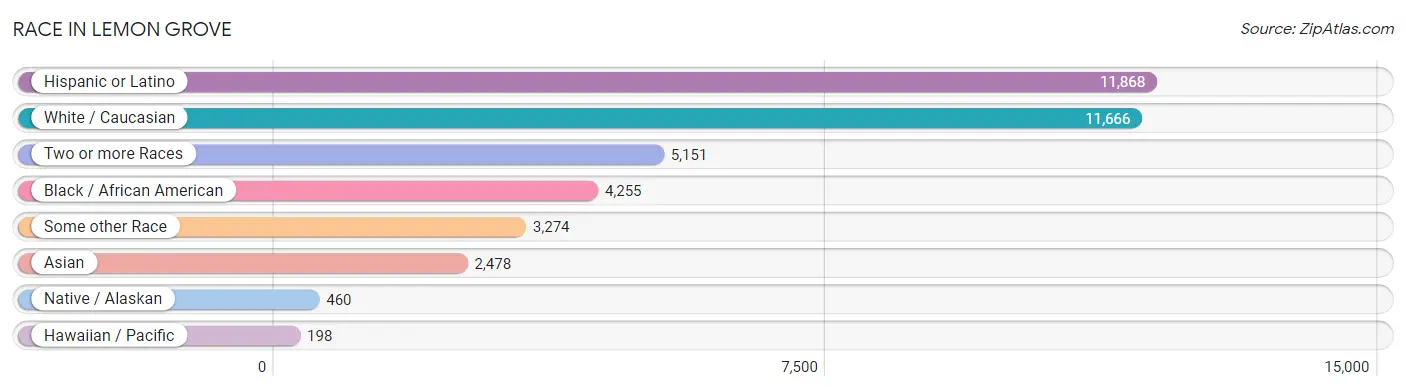
| Race | # Population | % Population |
| Asian | 2,478 | 9.0% |
| Black / African American | 4,255 | 15.5% |
| Hawaiian / Pacific | 198 | 0.7% |
| Hispanic or Latino | 11,868 | 43.2% |
| Native / Alaskan | 460 | 1.7% |
| White / Caucasian | 11,666 | 42.4% |
| Two or more Races | 5,151 | 18.7% |
| Some other Race | 3,274 | 11.9% |
| Total | 27,482 | 100.0% |
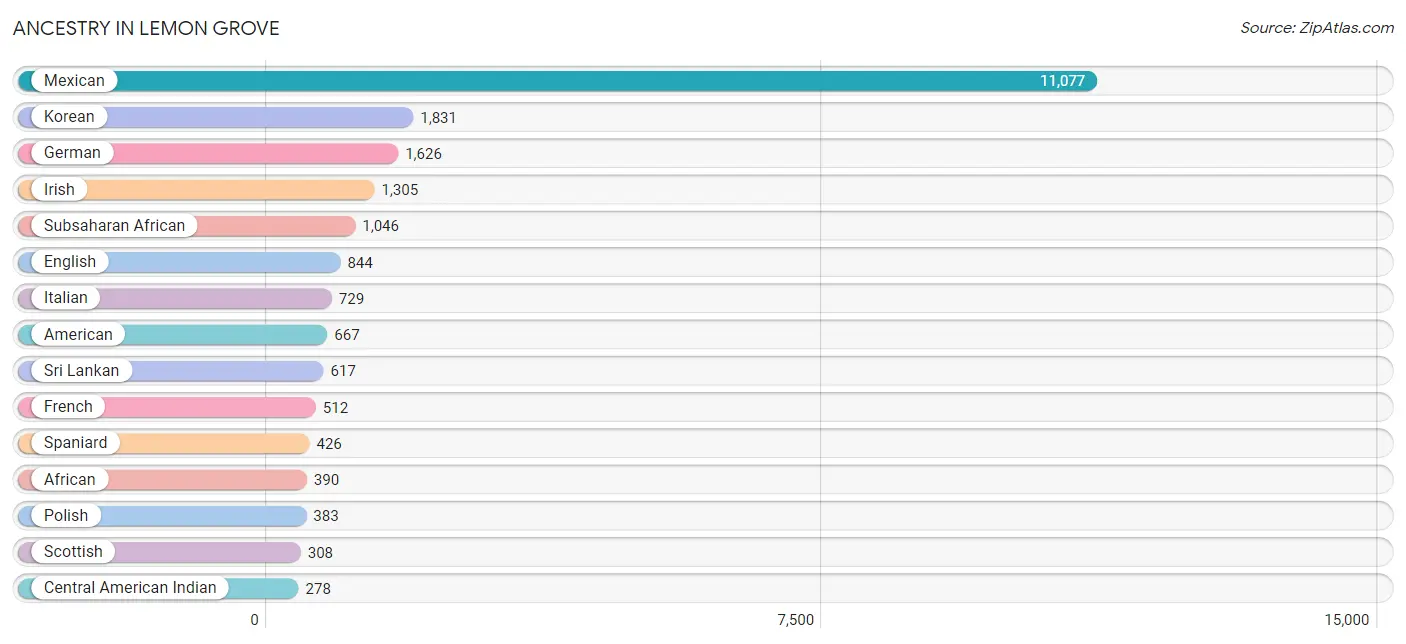
Ancestry in Lemon Grove
The most populous ancestries reported in Lemon Grove are Mexican (11,077 | 40.3%), Korean (1,831 | 6.7%), German (1,626 | 5.9%), Irish (1,305 | 4.8%), and Subsaharan African (1,046 | 3.8%), together accounting for 61.5% of all Lemon Grove residents.
| Ancestry | # Population | % Population |
| Afghan | 20 | 0.1% |
| African | 390 | 1.4% |
| Alaskan Athabascan | 63 | 0.2% |
| Albanian | 8 | 0.0% |
| American | 667 | 2.4% |
| Apache | 7 | 0.0% |
| Arab | 150 | 0.5% |
| Australian | 7 | 0.0% |
| Austrian | 10 | 0.0% |
| Barbadian | 10 | 0.0% |
| Belgian | 7 | 0.0% |
| Bhutanese | 277 | 1.0% |
| Brazilian | 10 | 0.0% |
| British | 71 | 0.3% |
| Bulgarian | 15 | 0.1% |
| Burmese | 33 | 0.1% |
| Cambodian | 6 | 0.0% |
| Canadian | 6 | 0.0% |
| Celtic | 7 | 0.0% |
| Central American | 80 | 0.3% |
| Central American Indian | 278 | 1.0% |
| Cherokee | 93 | 0.3% |
| Chilean | 71 | 0.3% |
| Chippewa | 19 | 0.1% |
| Choctaw | 54 | 0.2% |
| Colombian | 33 | 0.1% |
| Creek | 7 | 0.0% |
| Croatian | 22 | 0.1% |
| Cuban | 9 | 0.0% |
| Czech | 41 | 0.2% |
| Danish | 155 | 0.6% |
| Dutch | 131 | 0.5% |
| English | 844 | 3.1% |
| Ethiopian | 243 | 0.9% |
| European | 231 | 0.8% |
| Finnish | 10 | 0.0% |
| French | 512 | 1.9% |
| French American Indian | 22 | 0.1% |
| French Canadian | 28 | 0.1% |
| German | 1,626 | 5.9% |
| Greek | 7 | 0.0% |
| Guamanian / Chamorro | 52 | 0.2% |
| Hungarian | 17 | 0.1% |
| Indian (Asian) | 223 | 0.8% |
| Inupiat | 63 | 0.2% |
| Iranian | 41 | 0.2% |
| Irish | 1,305 | 4.8% |
| Iroquois | 10 | 0.0% |
| Italian | 729 | 2.6% |
| Jamaican | 54 | 0.2% |
| Japanese | 112 | 0.4% |
| Kenyan | 12 | 0.0% |
| Korean | 1,831 | 6.7% |
| Laotian | 68 | 0.3% |
| Lebanese | 47 | 0.2% |
| Lithuanian | 12 | 0.0% |
| Malaysian | 190 | 0.7% |
| Mexican | 11,077 | 40.3% |
| Mexican American Indian | 92 | 0.3% |
| Mongolian | 50 | 0.2% |
| Native Hawaiian | 56 | 0.2% |
| New Zealander | 8 | 0.0% |
| Nicaraguan | 20 | 0.1% |
| Nigerian | 140 | 0.5% |
| Northern European | 22 | 0.1% |
| Norwegian | 140 | 0.5% |
| Pakistani | 8 | 0.0% |
| Panamanian | 29 | 0.1% |
| Pennsylvania German | 15 | 0.1% |
| Peruvian | 10 | 0.0% |
| Polish | 383 | 1.4% |
| Portuguese | 273 | 1.0% |
| Pueblo | 20 | 0.1% |
| Puerto Rican | 75 | 0.3% |
| Romanian | 17 | 0.1% |
| Russian | 88 | 0.3% |
| Salvadoran | 31 | 0.1% |
| Samoan | 274 | 1.0% |
| Scandinavian | 47 | 0.2% |
| Scotch-Irish | 124 | 0.4% |
| Scottish | 308 | 1.1% |
| Somali | 214 | 0.8% |
| South American | 134 | 0.5% |
| Spaniard | 426 | 1.5% |
| Spanish | 25 | 0.1% |
| Sri Lankan | 617 | 2.2% |
| Subsaharan African | 1,046 | 3.8% |
| Swedish | 152 | 0.5% |
| Swiss | 27 | 0.1% |
| Thai | 33 | 0.1% |
| Tongan | 45 | 0.2% |
| Ukrainian | 21 | 0.1% |
| Ute | 5 | 0.0% |
| Venezuelan | 20 | 0.1% |
| Welsh | 65 | 0.2% |
| Yaqui | 12 | 0.0% | View All 96 Rows |
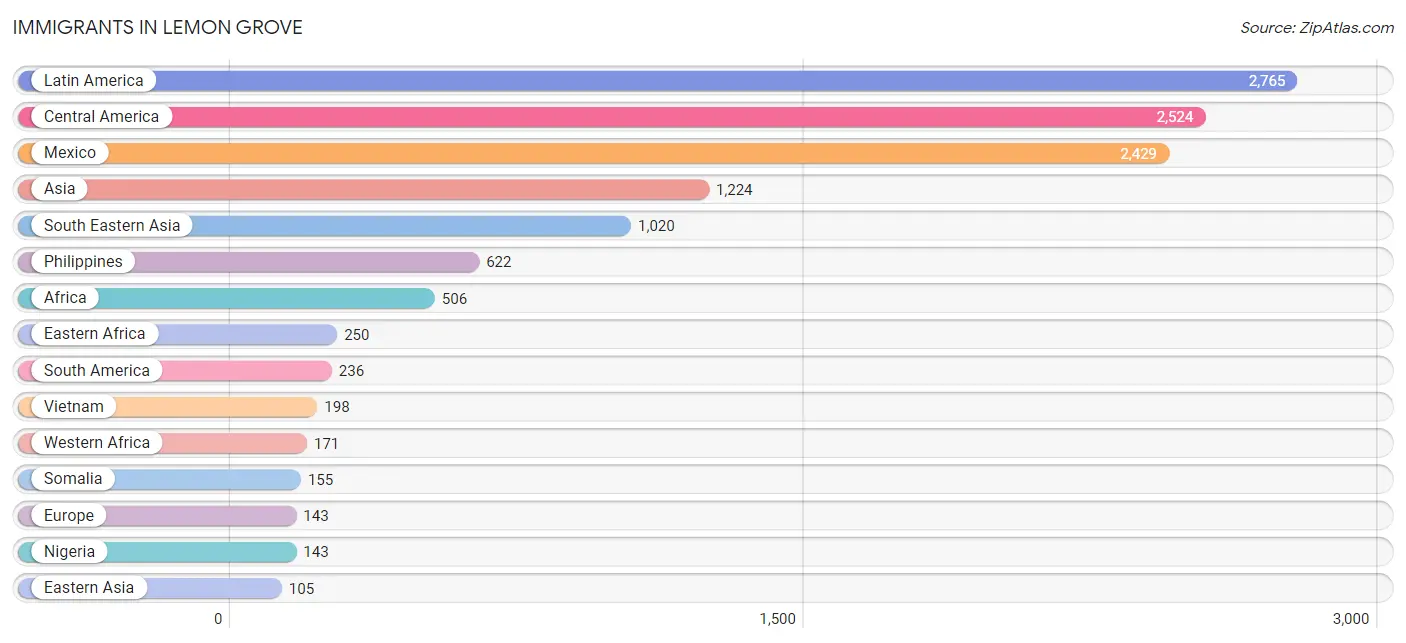
Immigrants in Lemon Grove
The most numerous immigrant groups reported in Lemon Grove came from Latin America (2,765 | 10.1%), Central America (2,524 | 9.2%), Mexico (2,429 | 8.8%), Asia (1,224 | 4.4%), and South Eastern Asia (1,020 | 3.7%), together accounting for 36.2% of all Lemon Grove residents.
| Immigration Origin | # Population | % Population |
| Africa | 506 | 1.8% |
| Asia | 1,224 | 4.4% |
| Australia | 7 | 0.0% |
| Austria | 10 | 0.0% |
| Brazil | 12 | 0.0% |
| Bulgaria | 15 | 0.1% |
| Cambodia | 29 | 0.1% |
| Canada | 16 | 0.1% |
| Caribbean | 5 | 0.0% |
| Central America | 2,524 | 9.2% |
| Chile | 47 | 0.2% |
| China | 47 | 0.2% |
| Colombia | 33 | 0.1% |
| Eastern Africa | 250 | 0.9% |
| Eastern Asia | 105 | 0.4% |
| Eastern Europe | 15 | 0.1% |
| El Salvador | 2 | 0.0% |
| Ethiopia | 57 | 0.2% |
| Europe | 143 | 0.5% |
| Guyana | 78 | 0.3% |
| Hong Kong | 10 | 0.0% |
| India | 15 | 0.1% |
| Indonesia | 68 | 0.3% |
| Iran | 9 | 0.0% |
| Iraq | 75 | 0.3% |
| Italy | 39 | 0.1% |
| Jamaica | 5 | 0.0% |
| Japan | 48 | 0.2% |
| Kenya | 12 | 0.0% |
| Korea | 10 | 0.0% |
| Laos | 52 | 0.2% |
| Latin America | 2,765 | 10.1% |
| Mexico | 2,429 | 8.8% |
| Netherlands | 14 | 0.1% |
| Nicaragua | 20 | 0.1% |
| Nigeria | 143 | 0.5% |
| Northern Europe | 40 | 0.2% |
| Oceania | 18 | 0.1% |
| Panama | 73 | 0.3% |
| Peru | 23 | 0.1% |
| Philippines | 622 | 2.3% |
| Somalia | 155 | 0.6% |
| South America | 236 | 0.9% |
| South Central Asia | 24 | 0.1% |
| South Eastern Asia | 1,020 | 3.7% |
| Southern Europe | 64 | 0.2% |
| Spain | 25 | 0.1% |
| Thailand | 51 | 0.2% |
| Uganda | 26 | 0.1% |
| Venezuela | 43 | 0.2% |
| Vietnam | 198 | 0.7% |
| Western Africa | 171 | 0.6% |
| Western Asia | 75 | 0.3% |
| Western Europe | 24 | 0.1% | View All 54 Rows |
Sex and Age in Lemon Grove
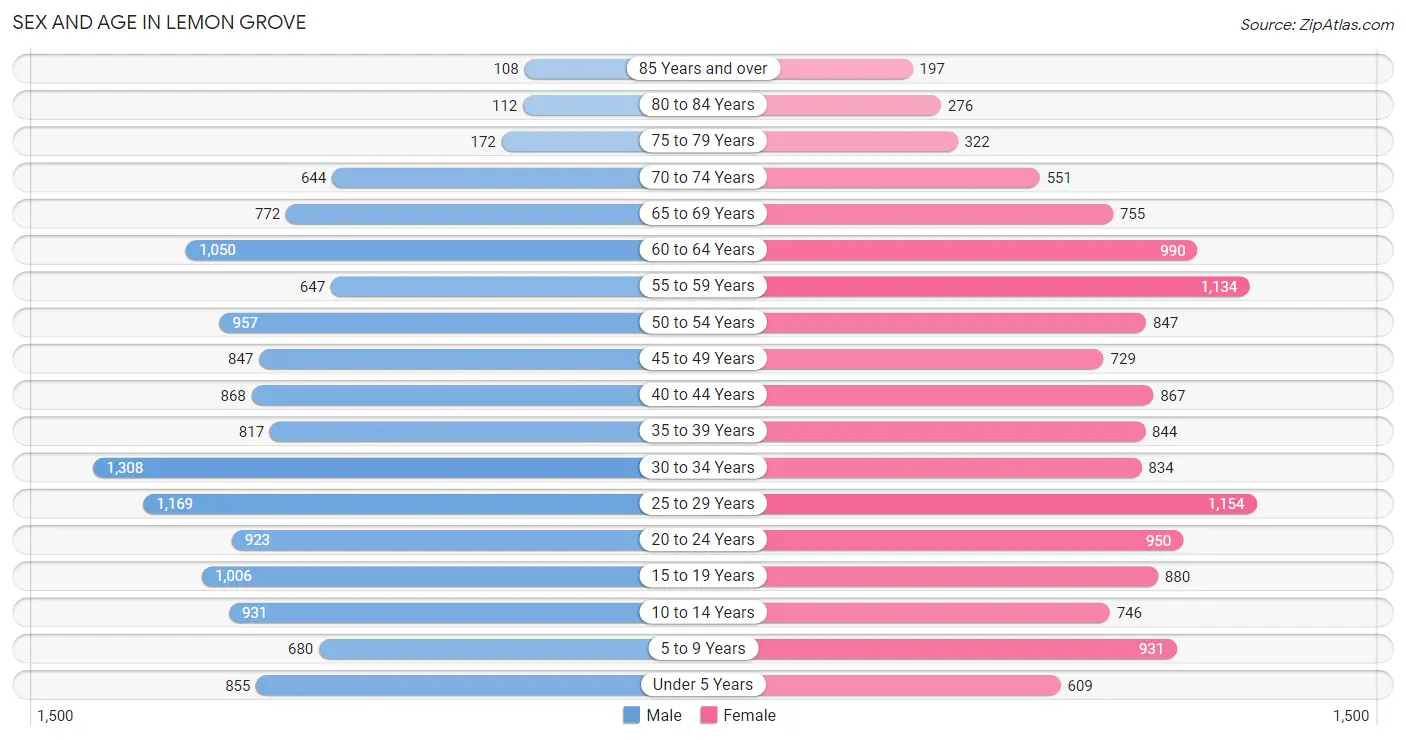
Sex and Age in Lemon Grove
The most populous age groups in Lemon Grove are 30 to 34 Years (1,308 | 9.4%) for men and 25 to 29 Years (1,154 | 8.5%) for women.
| Age Bracket | Male | Female |
| Under 5 Years | 855 (6.2%) | 609 (4.5%) |
| 5 to 9 Years | 680 (4.9%) | 931 (6.8%) |
| 10 to 14 Years | 931 (6.7%) | 746 (5.5%) |
| 15 to 19 Years | 1,006 (7.3%) | 880 (6.5%) |
| 20 to 24 Years | 923 (6.7%) | 950 (7.0%) |
| 25 to 29 Years | 1,169 (8.4%) | 1,154 (8.5%) |
| 30 to 34 Years | 1,308 (9.4%) | 834 (6.1%) |
| 35 to 39 Years | 817 (5.9%) | 844 (6.2%) |
| 40 to 44 Years | 868 (6.3%) | 867 (6.4%) |
| 45 to 49 Years | 847 (6.1%) | 729 (5.3%) |
| 50 to 54 Years | 957 (6.9%) | 847 (6.2%) |
| 55 to 59 Years | 647 (4.7%) | 1,134 (8.3%) |
| 60 to 64 Years | 1,050 (7.6%) | 990 (7.3%) |
| 65 to 69 Years | 772 (5.6%) | 755 (5.5%) |
| 70 to 74 Years | 644 (4.6%) | 551 (4.1%) |
| 75 to 79 Years | 172 (1.2%) | 322 (2.4%) |
| 80 to 84 Years | 112 (0.8%) | 276 (2.0%) |
| 85 Years and over | 108 (0.8%) | 197 (1.5%) |
| Total | 13,866 (100.0%) | 13,616 (100.0%) |
Families and Households in Lemon Grove
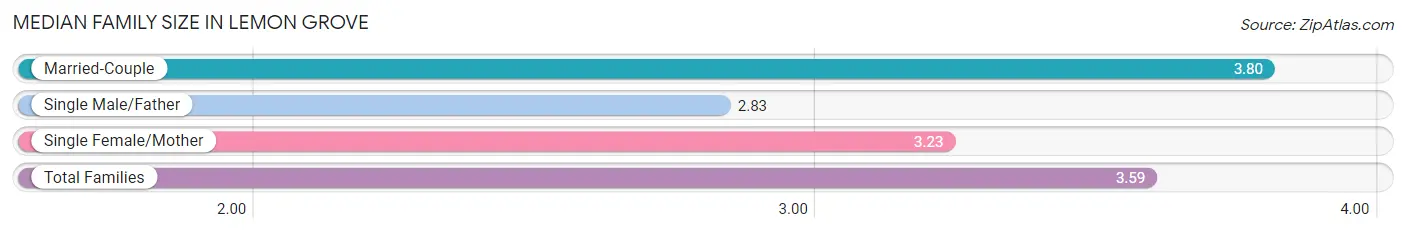
Median Family Size in Lemon Grove
The median family size in Lemon Grove is 3.59 persons per family, with married-couple families (4,278 | 67.7%) accounting for the largest median family size of 3.8 persons per family. On the other hand, single male/father families (478 | 7.6%) represent the smallest median family size with 2.83 persons per family.
| Family Type | # Families | Family Size |
| Married-Couple | 4,278 (67.7%) | 3.80 |
| Single Male/Father | 478 (7.6%) | 2.83 |
| Single Female/Mother | 1,563 (24.7%) | 3.23 |
| Total Families | 6,319 (100.0%) | 3.59 |
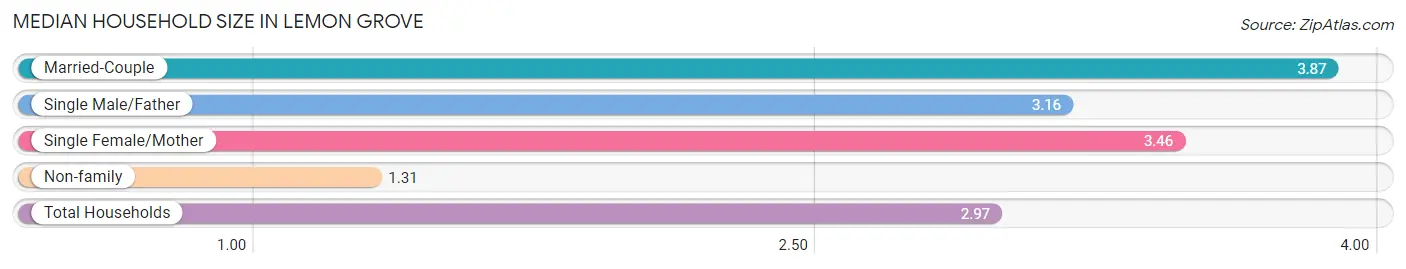
Median Household Size in Lemon Grove
The median household size in Lemon Grove is 2.97 persons per household, with married-couple households (4,278 | 46.7%) accounting for the largest median household size of 3.87 persons per household. non-family households (2,840 | 31.0%) represent the smallest median household size with 1.31 persons per household.
| Household Type | # Households | Household Size |
| Married-Couple | 4,278 (46.7%) | 3.87 |
| Single Male/Father | 478 (5.2%) | 3.16 |
| Single Female/Mother | 1,563 (17.1%) | 3.46 |
| Non-family | 2,840 (31.0%) | 1.31 |
| Total Households | 9,159 (100.0%) | 2.97 |
Household Size by Marriage Status in Lemon Grove
Out of a total of 9,159 households in Lemon Grove, 6,319 (69.0%) are family households, while 2,840 (31.0%) are nonfamily households. The most numerous type of family households are 2-person households, comprising 2,077, and the most common type of nonfamily households are 1-person households, comprising 2,168.
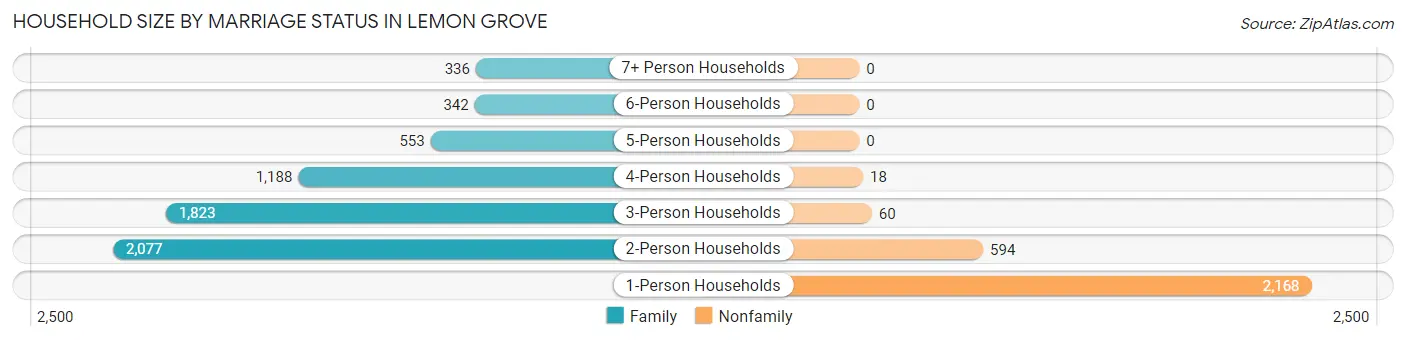
| Household Size | Family Households | Nonfamily Households |
| 1-Person Households | - | 2,168 (23.7%) |
| 2-Person Households | 2,077 (22.7%) | 594 (6.5%) |
| 3-Person Households | 1,823 (19.9%) | 60 (0.7%) |
| 4-Person Households | 1,188 (13.0%) | 18 (0.2%) |
| 5-Person Households | 553 (6.0%) | 0 (0.0%) |
| 6-Person Households | 342 (3.7%) | 0 (0.0%) |
| 7+ Person Households | 336 (3.7%) | 0 (0.0%) |
| Total | 6,319 (69.0%) | 2,840 (31.0%) |
Female Fertility in Lemon Grove
Fertility by Age in Lemon Grove
Average fertility rate in Lemon Grove is 38.0 births per 1,000 women. Women in the age bracket of 20 to 34 years have the highest fertility rate with 48.0 births per 1,000 women. Women in the age bracket of 20 to 34 years acount for 57.1% of all women with births.
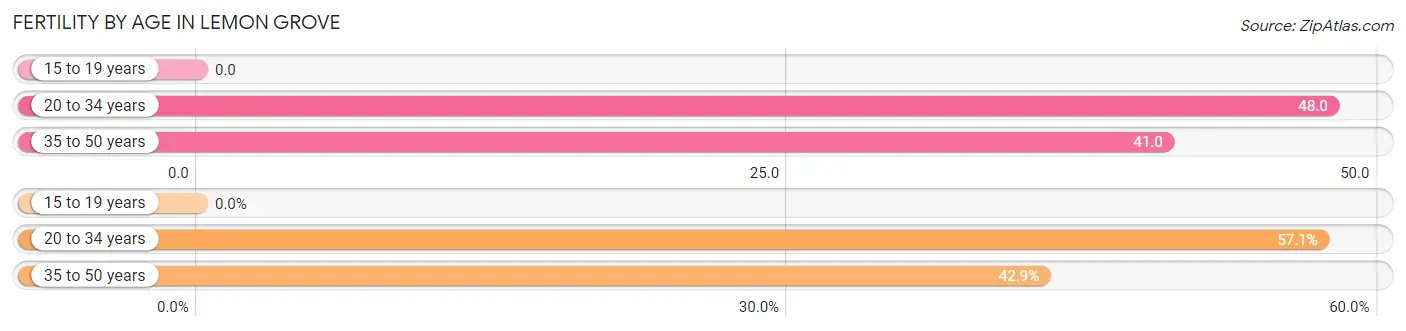
| Age Bracket | Women with Births | Births / 1,000 Women |
| 15 to 19 years | 0 (0.0%) | 0.0 |
| 20 to 34 years | 141 (57.1%) | 48.0 |
| 35 to 50 years | 106 (42.9%) | 41.0 |
| Total | 247 (100.0%) | 38.0 |
Fertility by Age by Marriage Status in Lemon Grove
83.8% of women with births (247) in Lemon Grove are married. The highest percentage of unmarried women with births falls into 35 to 50 years age bracket with 37.7% of them unmarried at the time of birth, while the lowest percentage of unmarried women with births belong to 20 to 34 years age bracket with 0.0% of them unmarried.
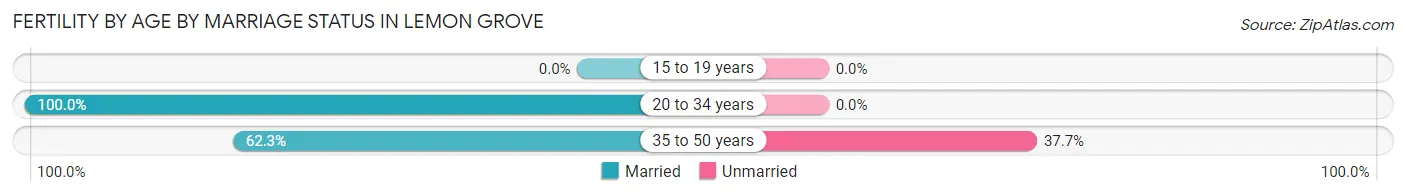
| Age Bracket | Married | Unmarried |
| 15 to 19 years | 0 (0.0%) | 0 (0.0%) |
| 20 to 34 years | 141 (100.0%) | 0 (0.0%) |
| 35 to 50 years | 66 (62.3%) | 40 (37.7%) |
| Total | 207 (83.8%) | 40 (16.2%) |
Fertility by Education in Lemon Grove
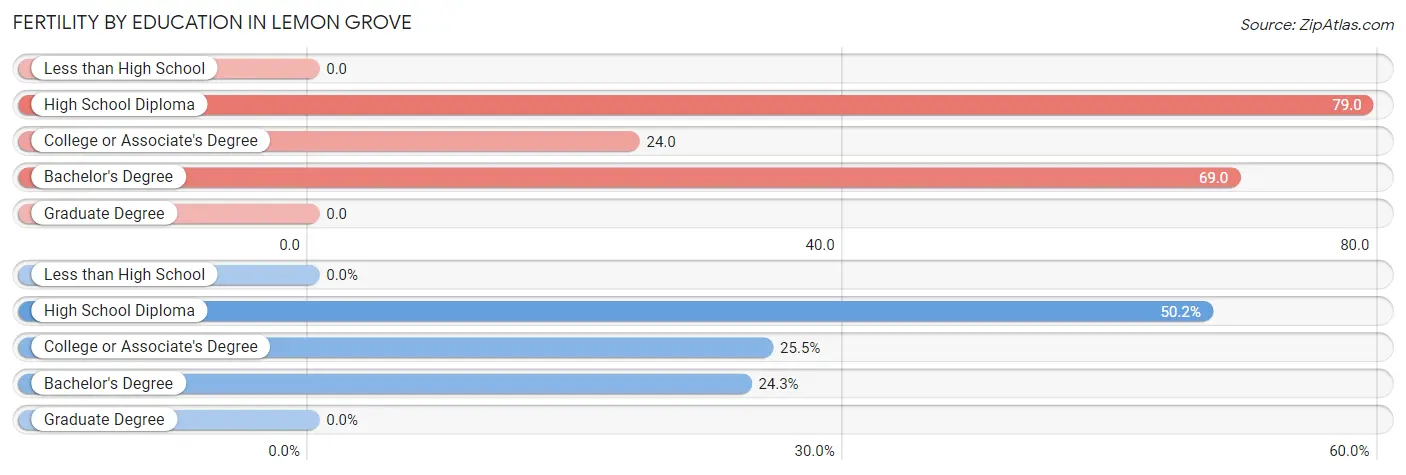
| Educational Attainment | Women with Births | Births / 1,000 Women |
| Less than High School | 0 (0.0%) | 0.0 |
| High School Diploma | 124 (50.2%) | 79.0 |
| College or Associate's Degree | 63 (25.5%) | 24.0 |
| Bachelor's Degree | 60 (24.3%) | 69.0 |
| Graduate Degree | 0 (0.0%) | 0.0 |
| Total | 247 (100.0%) | 38.0 |
Fertility by Education by Marriage Status in Lemon Grove
16.2% of women with births in Lemon Grove are unmarried. Women with the educational attainment of high school diploma are most likely to be married with 100.0% of them married at childbirth, while women with the educational attainment of bachelor's degree are least likely to be married with 66.7% of them unmarried at childbirth.
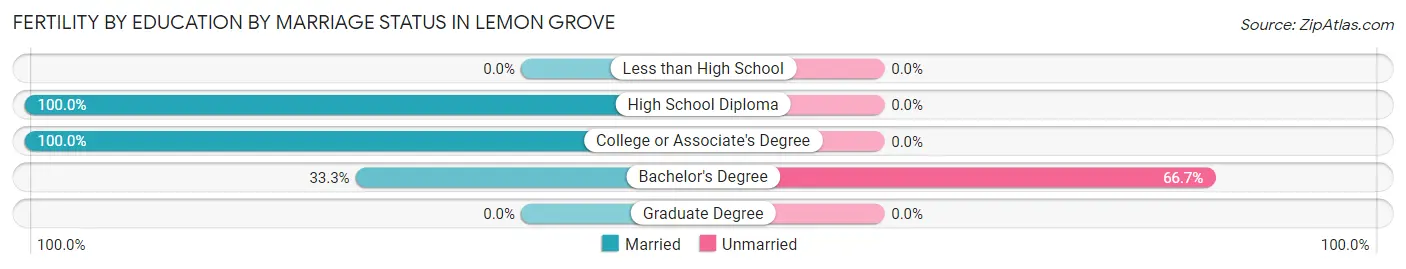
| Educational Attainment | Married | Unmarried |
| Less than High School | 0 (0.0%) | 0 (0.0%) |
| High School Diploma | 124 (100.0%) | 0 (0.0%) |
| College or Associate's Degree | 63 (100.0%) | 0 (0.0%) |
| Bachelor's Degree | 20 (33.3%) | 40 (66.7%) |
| Graduate Degree | 0 (0.0%) | 0 (0.0%) |
| Total | 207 (83.8%) | 40 (16.2%) |
Employment Characteristics in Lemon Grove
Employment by Class of Employer in Lemon Grove
Among the 12,971 employed individuals in Lemon Grove, private company employees (7,641 | 58.9%), federal government employees (1,314 | 10.1%), and not-for-profit organizations (1,155 | 8.9%) make up the most common classes of employment.
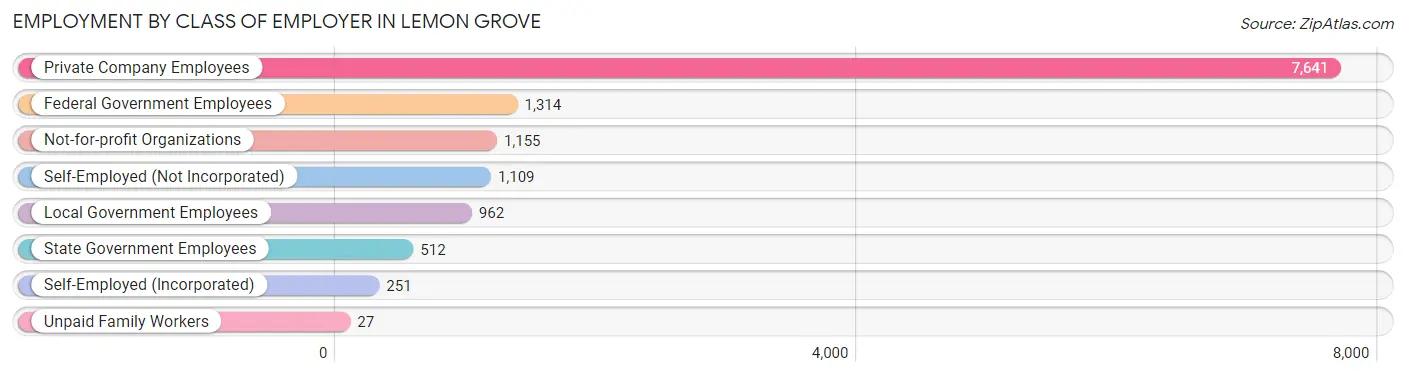
| Employer Class | # Employees | % Employees |
| Private Company Employees | 7,641 | 58.9% |
| Self-Employed (Incorporated) | 251 | 1.9% |
| Self-Employed (Not Incorporated) | 1,109 | 8.6% |
| Not-for-profit Organizations | 1,155 | 8.9% |
| Local Government Employees | 962 | 7.4% |
| State Government Employees | 512 | 4.0% |
| Federal Government Employees | 1,314 | 10.1% |
| Unpaid Family Workers | 27 | 0.2% |
| Total | 12,971 | 100.0% |
Employment Status by Age in Lemon Grove
According to the labor force statistics for Lemon Grove, out of the total population over 16 years of age (22,317), 65.0% or 14,506 individuals are in the labor force, with 8.2% or 1,189 of them unemployed. The age group with the highest labor force participation rate is 45 to 54 years, with 89.9% or 3,039 individuals in the labor force. Within the labor force, the 16 to 19 years age range has the highest percentage of unemployed individuals, with 20.0% or 73 of them being unemployed.
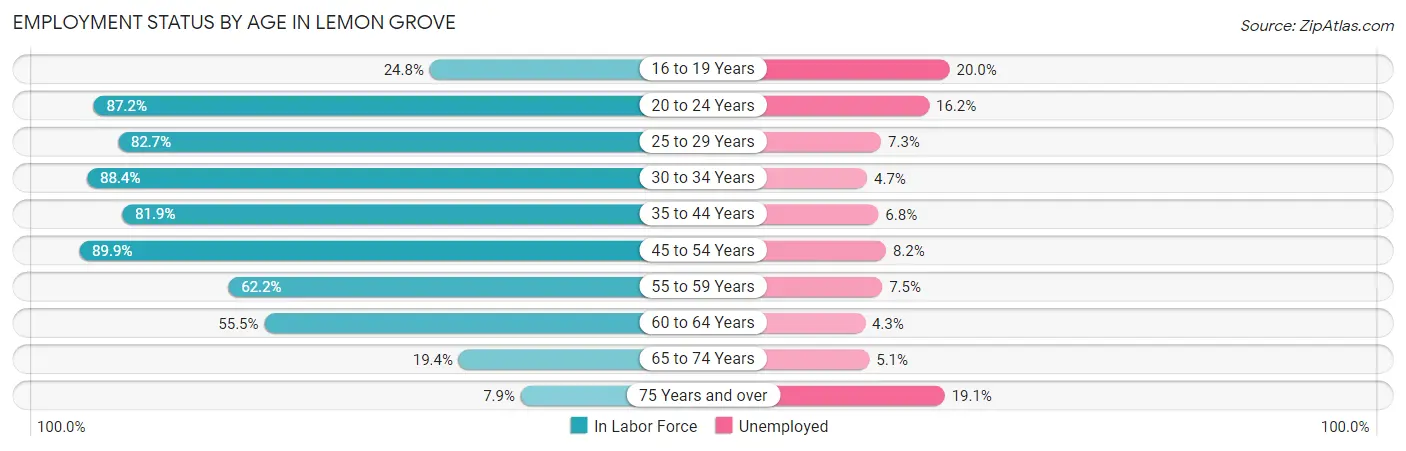
| Age Bracket | In Labor Force | Unemployed |
| 16 to 19 Years | 365 (24.8%) | 73 (20.0%) |
| 20 to 24 Years | 1,633 (87.2%) | 265 (16.2%) |
| 25 to 29 Years | 1,921 (82.7%) | 140 (7.3%) |
| 30 to 34 Years | 1,894 (88.4%) | 89 (4.7%) |
| 35 to 44 Years | 2,781 (81.9%) | 189 (6.8%) |
| 45 to 54 Years | 3,039 (89.9%) | 249 (8.2%) |
| 55 to 59 Years | 1,108 (62.2%) | 83 (7.5%) |
| 60 to 64 Years | 1,132 (55.5%) | 49 (4.3%) |
| 65 to 74 Years | 528 (19.4%) | 27 (5.1%) |
| 75 Years and over | 94 (7.9%) | 18 (19.1%) |
| Total | 14,506 (65.0%) | 1,189 (8.2%) |
Employment Status by Educational Attainment in Lemon Grove
According to labor force statistics for Lemon Grove, 78.9% of individuals (11,884) out of the total population between 25 and 64 years of age (15,062) are in the labor force, with 6.7% or 796 of them being unemployed. The group with the highest labor force participation rate are those with the educational attainment of bachelor's degree or higher, with 87.1% or 2,569 individuals in the labor force. Within the labor force, individuals with less than high school education have the highest percentage of unemployment, with 10.4% or 114 of them being unemployed.
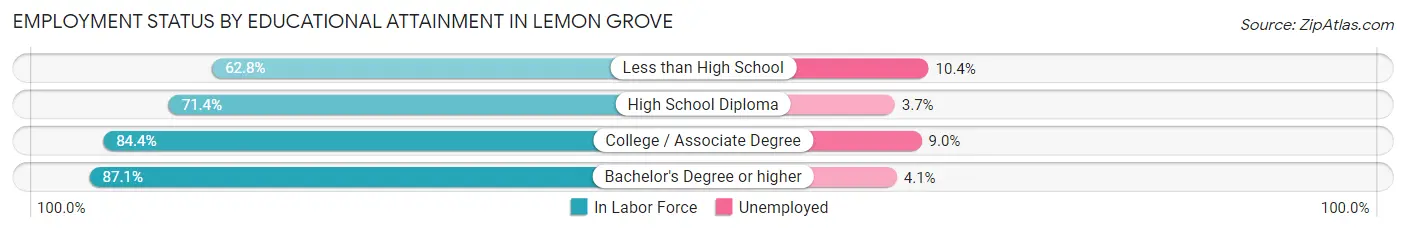
| Educational Attainment | In Labor Force | Unemployed |
| Less than High School | 1,095 (62.8%) | 181 (10.4%) |
| High School Diploma | 2,947 (71.4%) | 153 (3.7%) |
| College / Associate Degree | 5,267 (84.4%) | 562 (9.0%) |
| Bachelor's Degree or higher | 2,569 (87.1%) | 121 (4.1%) |
| Total | 11,884 (78.9%) | 1,009 (6.7%) |
Employment Occupations by Sex in Lemon Grove
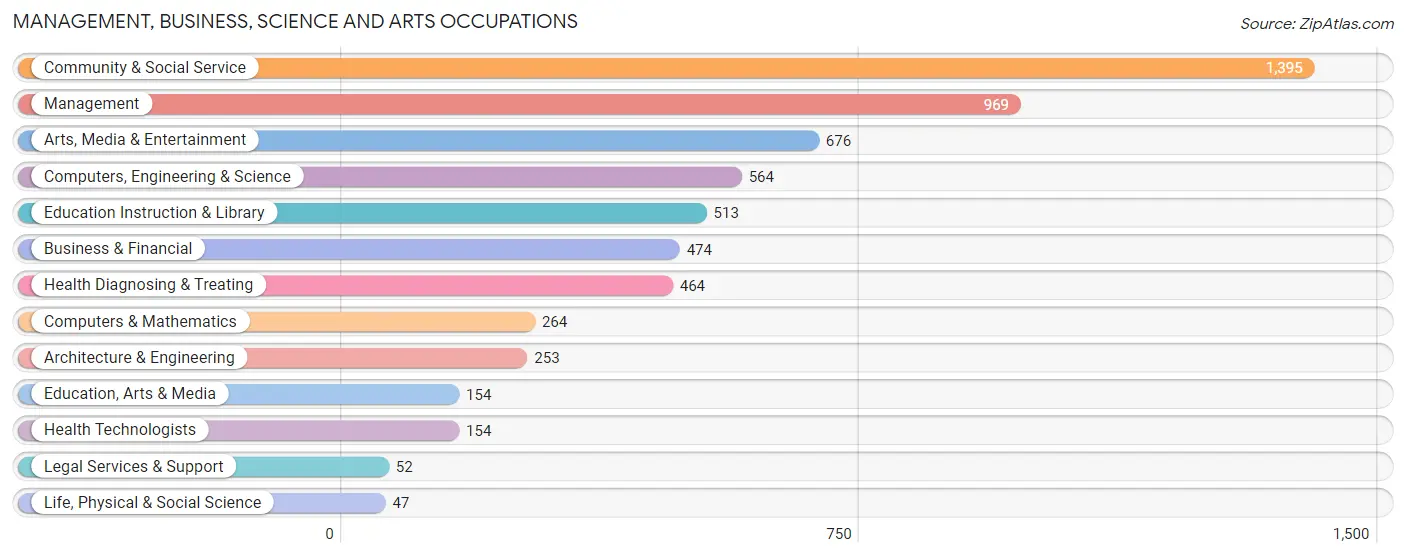
Management, Business, Science and Arts Occupations
The most common Management, Business, Science and Arts occupations in Lemon Grove are Community & Social Service (1,395 | 11.0%), Management (969 | 7.6%), Arts, Media & Entertainment (676 | 5.3%), Computers, Engineering & Science (564 | 4.4%), and Education Instruction & Library (513 | 4.1%).
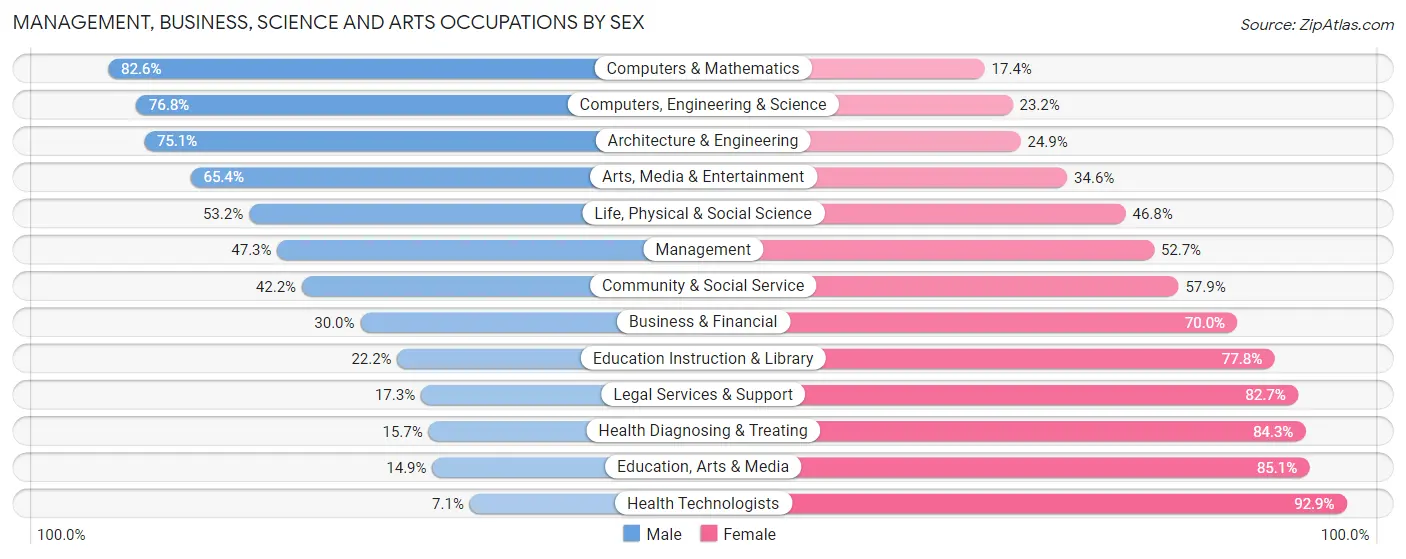
Management, Business, Science and Arts Occupations by Sex
Within the Management, Business, Science and Arts occupations in Lemon Grove, the most male-oriented occupations are Computers & Mathematics (82.6%), Computers, Engineering & Science (76.8%), and Architecture & Engineering (75.1%), while the most female-oriented occupations are Health Technologists (92.9%), Education, Arts & Media (85.1%), and Health Diagnosing & Treating (84.3%).
| Occupation | Male | Female |
| Management | 458 (47.3%) | 511 (52.7%) |
| Business & Financial | 142 (30.0%) | 332 (70.0%) |
| Computers, Engineering & Science | 433 (76.8%) | 131 (23.2%) |
| Computers & Mathematics | 218 (82.6%) | 46 (17.4%) |
| Architecture & Engineering | 190 (75.1%) | 63 (24.9%) |
| Life, Physical & Social Science | 25 (53.2%) | 22 (46.8%) |
| Community & Social Service | 588 (42.1%) | 807 (57.9%) |
| Education, Arts & Media | 23 (14.9%) | 131 (85.1%) |
| Legal Services & Support | 9 (17.3%) | 43 (82.7%) |
| Education Instruction & Library | 114 (22.2%) | 399 (77.8%) |
| Arts, Media & Entertainment | 442 (65.4%) | 234 (34.6%) |
| Health Diagnosing & Treating | 73 (15.7%) | 391 (84.3%) |
| Health Technologists | 11 (7.1%) | 143 (92.9%) |
| Total (Category) | 1,694 (43.8%) | 2,172 (56.2%) |
| Total (Overall) | 6,560 (51.8%) | 6,112 (48.2%) |
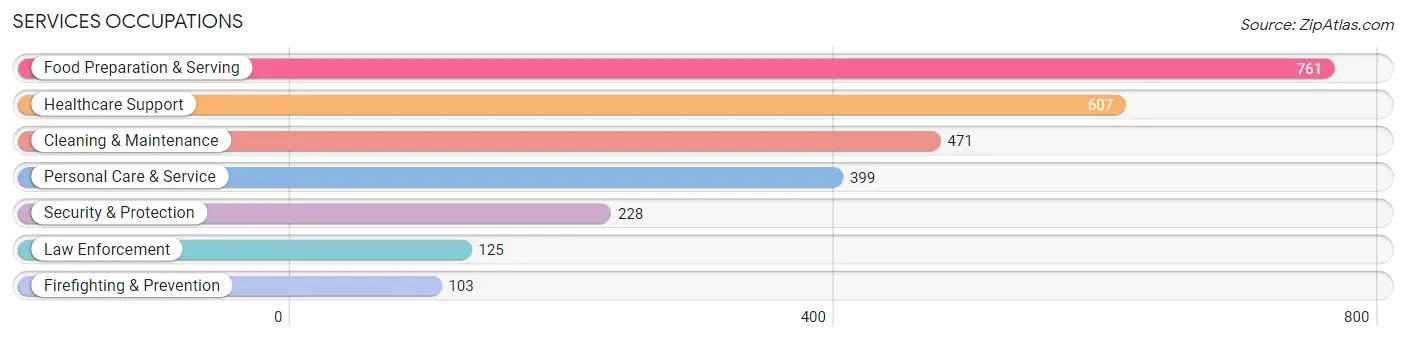
Services Occupations
The most common Services occupations in Lemon Grove are Food Preparation & Serving (761 | 6.0%), Healthcare Support (607 | 4.8%), Cleaning & Maintenance (471 | 3.7%), Personal Care & Service (399 | 3.2%), and Security & Protection (228 | 1.8%).
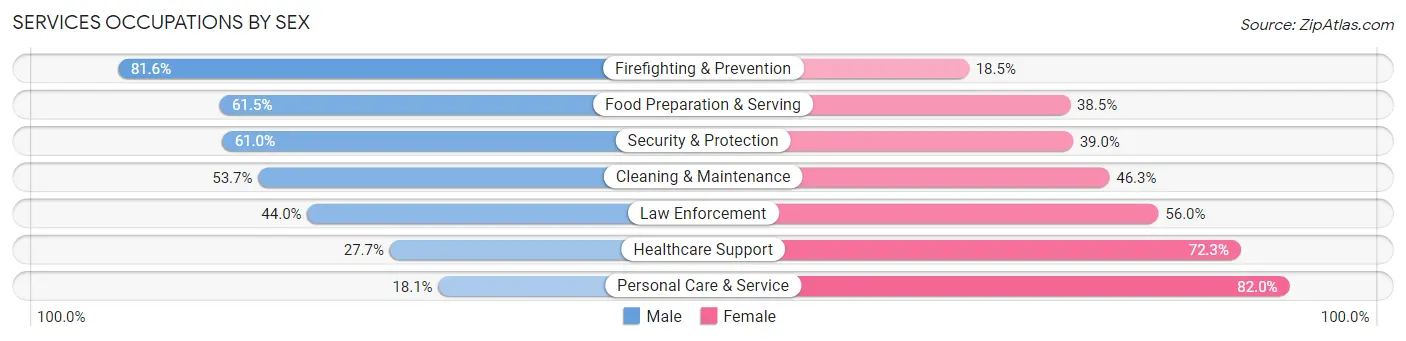
Services Occupations by Sex
Within the Services occupations in Lemon Grove, the most male-oriented occupations are Firefighting & Prevention (81.6%), Food Preparation & Serving (61.5%), and Security & Protection (61.0%), while the most female-oriented occupations are Personal Care & Service (82.0%), Healthcare Support (72.3%), and Law Enforcement (56.0%).
| Occupation | Male | Female |
| Healthcare Support | 168 (27.7%) | 439 (72.3%) |
| Security & Protection | 139 (61.0%) | 89 (39.0%) |
| Firefighting & Prevention | 84 (81.6%) | 19 (18.4%) |
| Law Enforcement | 55 (44.0%) | 70 (56.0%) |
| Food Preparation & Serving | 468 (61.5%) | 293 (38.5%) |
| Cleaning & Maintenance | 253 (53.7%) | 218 (46.3%) |
| Personal Care & Service | 72 (18.0%) | 327 (82.0%) |
| Total (Category) | 1,100 (44.6%) | 1,366 (55.4%) |
| Total (Overall) | 6,560 (51.8%) | 6,112 (48.2%) |
Sales and Office Occupations
The most common Sales and Office occupations in Lemon Grove are Office & Administration (1,713 | 13.5%), and Sales & Related (1,560 | 12.3%).
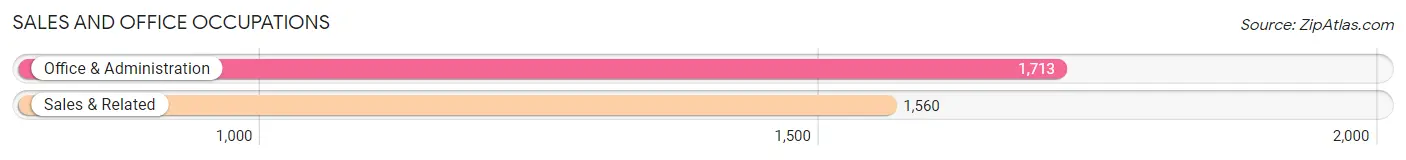
Sales and Office Occupations by Sex
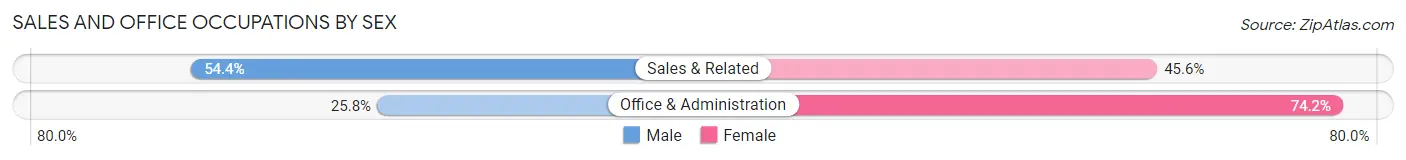
| Occupation | Male | Female |
| Sales & Related | 848 (54.4%) | 712 (45.6%) |
| Office & Administration | 442 (25.8%) | 1,271 (74.2%) |
| Total (Category) | 1,290 (39.4%) | 1,983 (60.6%) |
| Total (Overall) | 6,560 (51.8%) | 6,112 (48.2%) |
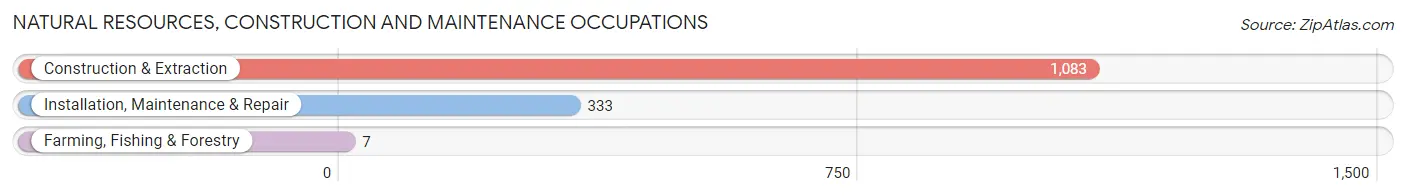
Natural Resources, Construction and Maintenance Occupations
The most common Natural Resources, Construction and Maintenance occupations in Lemon Grove are Construction & Extraction (1,083 | 8.6%), Installation, Maintenance & Repair (333 | 2.6%), and Farming, Fishing & Forestry (7 | 0.1%).
Natural Resources, Construction and Maintenance Occupations by Sex
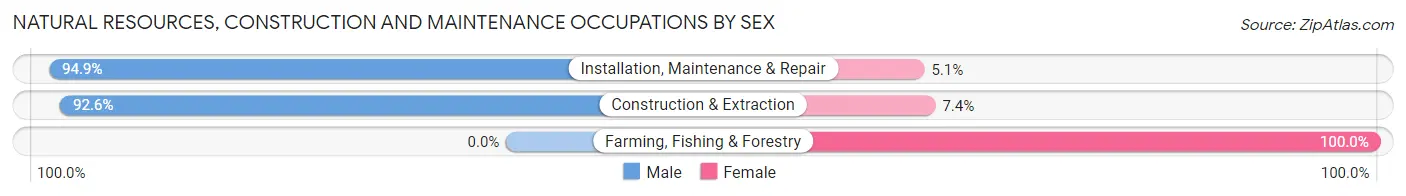
| Occupation | Male | Female |
| Farming, Fishing & Forestry | 0 (0.0%) | 7 (100.0%) |
| Construction & Extraction | 1,003 (92.6%) | 80 (7.4%) |
| Installation, Maintenance & Repair | 316 (94.9%) | 17 (5.1%) |
| Total (Category) | 1,319 (92.7%) | 104 (7.3%) |
| Total (Overall) | 6,560 (51.8%) | 6,112 (48.2%) |
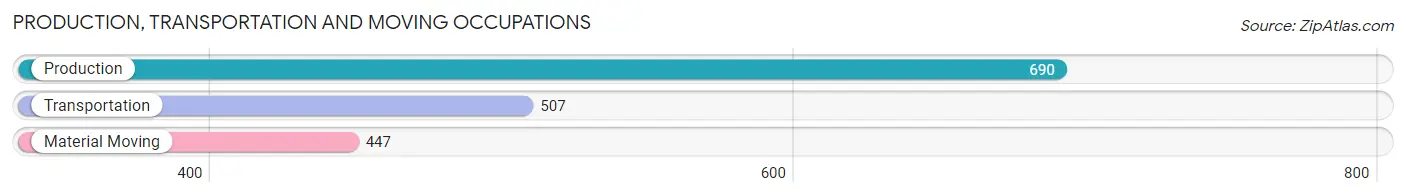
Production, Transportation and Moving Occupations
The most common Production, Transportation and Moving occupations in Lemon Grove are Production (690 | 5.4%), Transportation (507 | 4.0%), and Material Moving (447 | 3.5%).
Production, Transportation and Moving Occupations by Sex
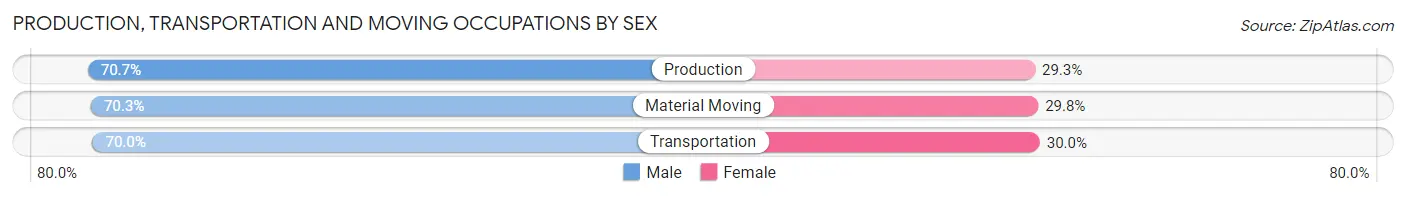
| Occupation | Male | Female |
| Production | 488 (70.7%) | 202 (29.3%) |
| Transportation | 355 (70.0%) | 152 (30.0%) |
| Material Moving | 314 (70.3%) | 133 (29.7%) |
| Total (Category) | 1,157 (70.4%) | 487 (29.6%) |
| Total (Overall) | 6,560 (51.8%) | 6,112 (48.2%) |
Employment Industries by Sex in Lemon Grove
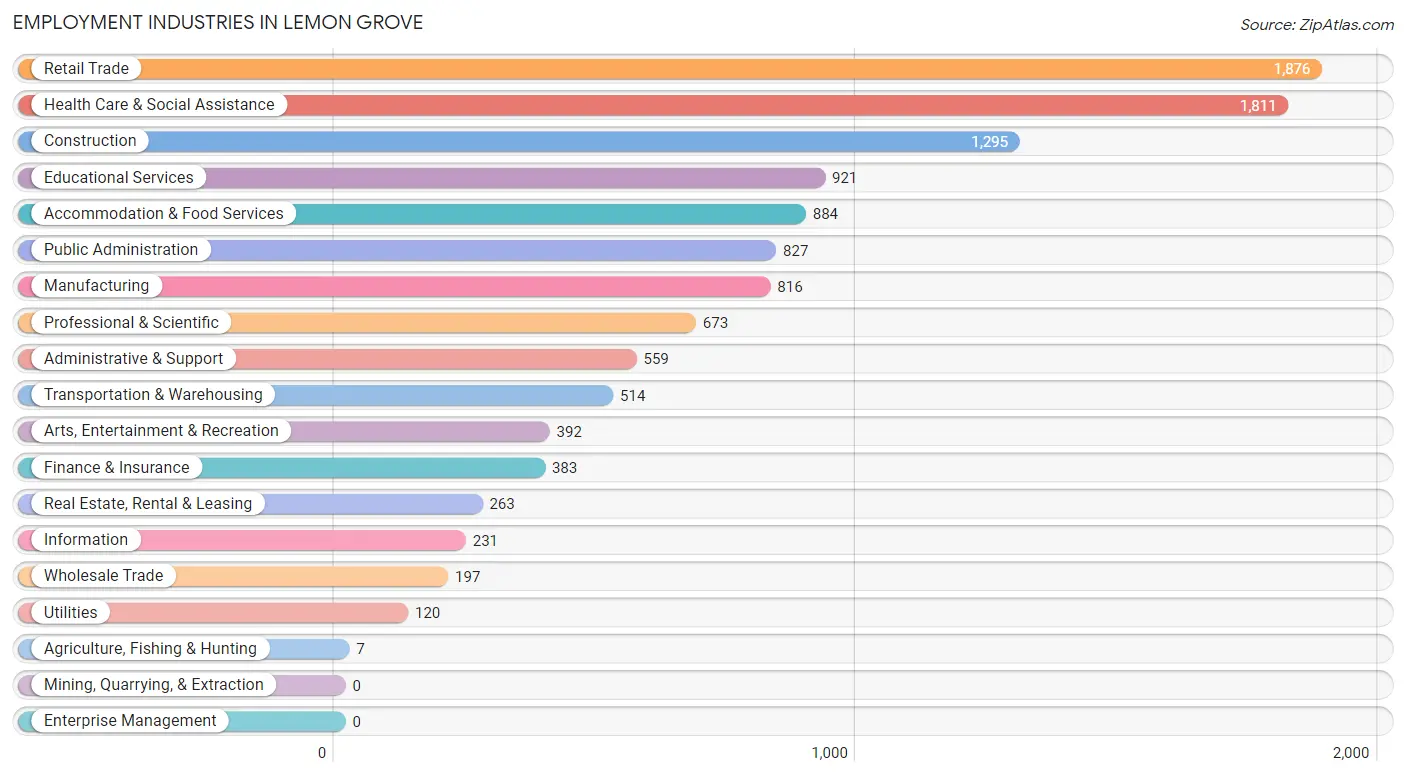
Employment Industries in Lemon Grove
The major employment industries in Lemon Grove include Retail Trade (1,876 | 14.8%), Health Care & Social Assistance (1,811 | 14.3%), Construction (1,295 | 10.2%), Educational Services (921 | 7.3%), and Accommodation & Food Services (884 | 7.0%).
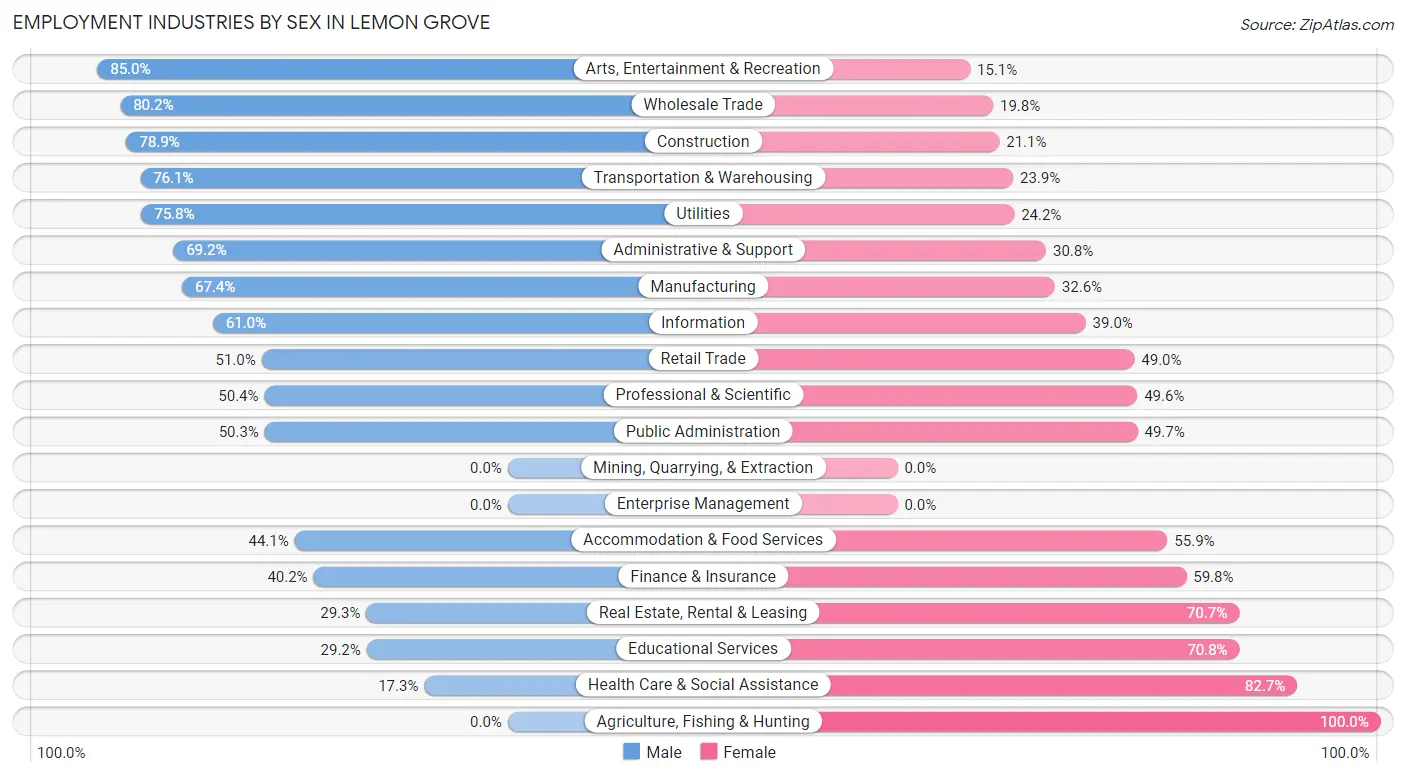
Employment Industries by Sex in Lemon Grove
The Lemon Grove industries that see more men than women are Arts, Entertainment & Recreation (85.0%), Wholesale Trade (80.2%), and Construction (78.9%), whereas the industries that tend to have a higher number of women are Agriculture, Fishing & Hunting (100.0%), Health Care & Social Assistance (82.7%), and Educational Services (70.8%).
| Industry | Male | Female |
| Agriculture, Fishing & Hunting | 0 (0.0%) | 7 (100.0%) |
| Mining, Quarrying, & Extraction | 0 (0.0%) | 0 (0.0%) |
| Construction | 1,022 (78.9%) | 273 (21.1%) |
| Manufacturing | 550 (67.4%) | 266 (32.6%) |
| Wholesale Trade | 158 (80.2%) | 39 (19.8%) |
| Retail Trade | 956 (51.0%) | 920 (49.0%) |
| Transportation & Warehousing | 391 (76.1%) | 123 (23.9%) |
| Utilities | 91 (75.8%) | 29 (24.2%) |
| Information | 141 (61.0%) | 90 (39.0%) |
| Finance & Insurance | 154 (40.2%) | 229 (59.8%) |
| Real Estate, Rental & Leasing | 77 (29.3%) | 186 (70.7%) |
| Professional & Scientific | 339 (50.4%) | 334 (49.6%) |
| Enterprise Management | 0 (0.0%) | 0 (0.0%) |
| Administrative & Support | 387 (69.2%) | 172 (30.8%) |
| Educational Services | 269 (29.2%) | 652 (70.8%) |
| Health Care & Social Assistance | 313 (17.3%) | 1,498 (82.7%) |
| Arts, Entertainment & Recreation | 333 (85.0%) | 59 (15.0%) |
| Accommodation & Food Services | 390 (44.1%) | 494 (55.9%) |
| Public Administration | 416 (50.3%) | 411 (49.7%) |
| Total | 6,560 (51.8%) | 6,112 (48.2%) |
Education in Lemon Grove
School Enrollment in Lemon Grove
The most common levels of schooling among the 6,717 students in Lemon Grove are college / undergraduate (1,723 | 25.7%), high school (1,718 | 25.6%), and elementary school (1,268 | 18.9%).
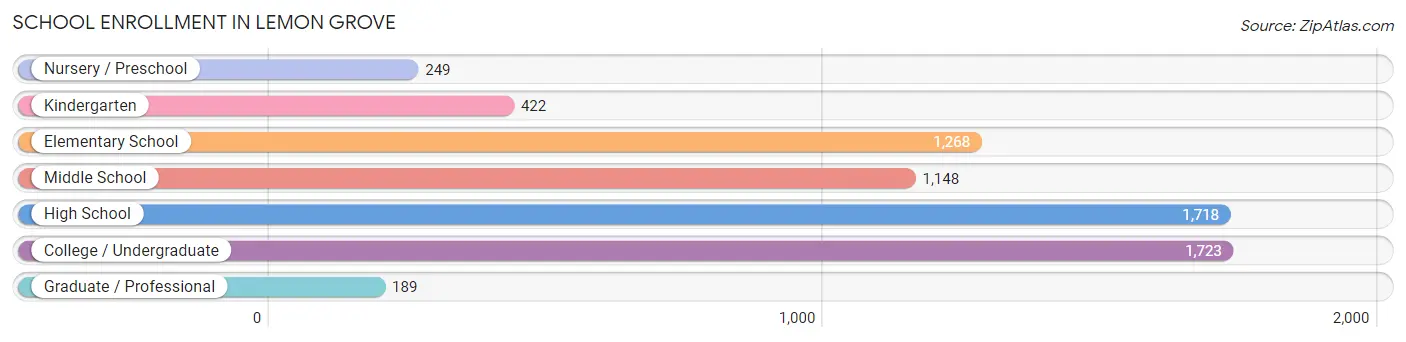
| School Level | # Students | % Students |
| Nursery / Preschool | 249 | 3.7% |
| Kindergarten | 422 | 6.3% |
| Elementary School | 1,268 | 18.9% |
| Middle School | 1,148 | 17.1% |
| High School | 1,718 | 25.6% |
| College / Undergraduate | 1,723 | 25.7% |
| Graduate / Professional | 189 | 2.8% |
| Total | 6,717 | 100.0% |
School Enrollment by Age by Funding Source in Lemon Grove
Out of a total of 6,717 students who are enrolled in schools in Lemon Grove, 665 (9.9%) attend a private institution, while the remaining 6,052 (90.1%) are enrolled in public schools. The age group of 25 to 34 year olds has the highest likelihood of being enrolled in private schools, with 257 (38.0% in the age bracket) enrolled. Conversely, the age group of 15 to 17 year olds has the lowest likelihood of being enrolled in a private school, with 1,192 (97.2% in the age bracket) attending a public institution.
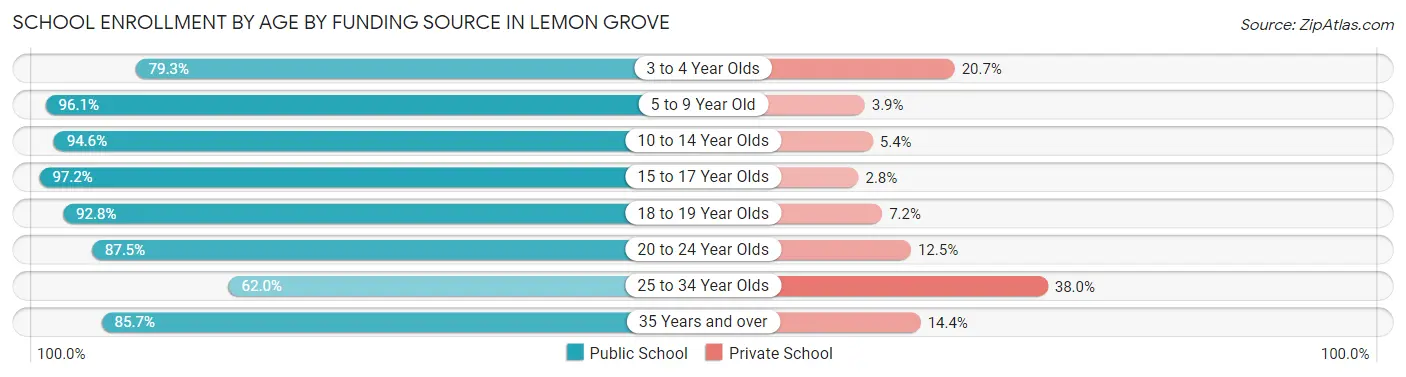
| Age Bracket | Public School | Private School |
| 3 to 4 Year Olds | 234 (79.3%) | 61 (20.7%) |
| 5 to 9 Year Old | 1,417 (96.1%) | 58 (3.9%) |
| 10 to 14 Year Olds | 1,531 (94.6%) | 88 (5.4%) |
| 15 to 17 Year Olds | 1,192 (97.2%) | 34 (2.8%) |
| 18 to 19 Year Olds | 388 (92.8%) | 30 (7.2%) |
| 20 to 24 Year Olds | 516 (87.5%) | 74 (12.5%) |
| 25 to 34 Year Olds | 419 (62.0%) | 257 (38.0%) |
| 35 Years and over | 358 (85.7%) | 60 (14.3%) |
| Total | 6,052 (90.1%) | 665 (9.9%) |
Educational Attainment by Field of Study in Lemon Grove
Business (606 | 14.7%), social sciences (436 | 10.6%), science & technology (424 | 10.3%), engineering (416 | 10.1%), and visual & performing arts (382 | 9.3%) are the most common fields of study among 4,120 individuals in Lemon Grove who have obtained a bachelor's degree or higher.
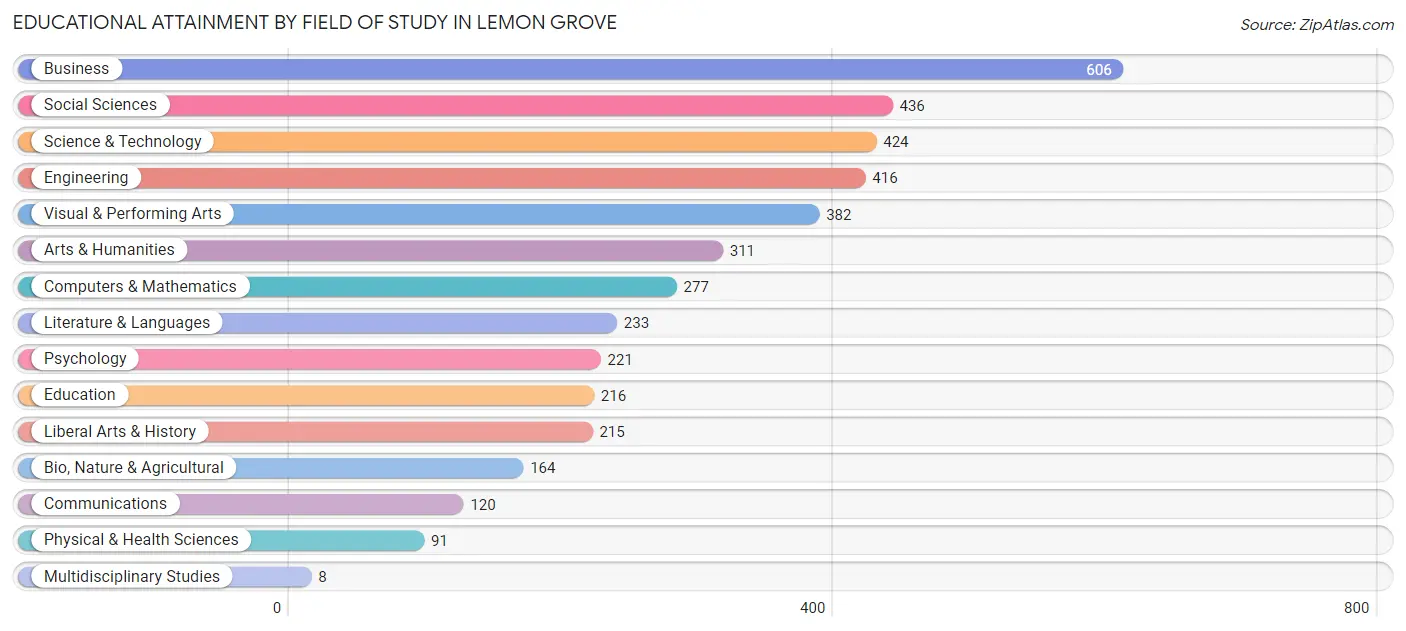
| Field of Study | # Graduates | % Graduates |
| Computers & Mathematics | 277 | 6.7% |
| Bio, Nature & Agricultural | 164 | 4.0% |
| Physical & Health Sciences | 91 | 2.2% |
| Psychology | 221 | 5.4% |
| Social Sciences | 436 | 10.6% |
| Engineering | 416 | 10.1% |
| Multidisciplinary Studies | 8 | 0.2% |
| Science & Technology | 424 | 10.3% |
| Business | 606 | 14.7% |
| Education | 216 | 5.2% |
| Literature & Languages | 233 | 5.7% |
| Liberal Arts & History | 215 | 5.2% |
| Visual & Performing Arts | 382 | 9.3% |
| Communications | 120 | 2.9% |
| Arts & Humanities | 311 | 7.5% |
| Total | 4,120 | 100.0% |
Transportation & Commute in Lemon Grove
Vehicle Availability by Sex in Lemon Grove
The most prevalent vehicle ownership categories in Lemon Grove are males with 2 vehicles (2,860, accounting for 41.3%) and females with 2 vehicles (2,105, making up 47.6%).
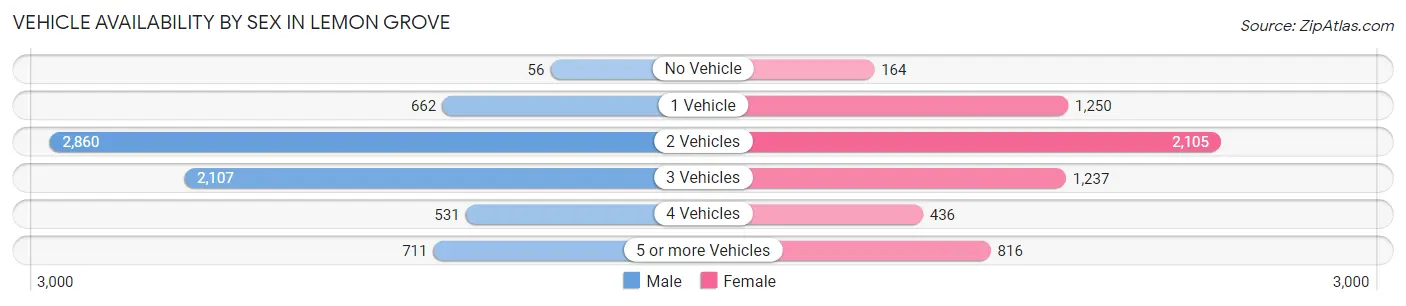
| Vehicles Available | Male | Female |
| No Vehicle | 56 (0.8%) | 164 (2.7%) |
| 1 Vehicle | 662 (9.6%) | 1,250 (20.8%) |
| 2 Vehicles | 2,860 (41.3%) | 2,105 (35.0%) |
| 3 Vehicles | 2,107 (30.4%) | 1,237 (20.6%) |
| 4 Vehicles | 531 (7.7%) | 436 (7.3%) |
| 5 or more Vehicles | 711 (10.3%) | 816 (13.6%) |
| Total | 6,927 (100.0%) | 6,008 (100.0%) |
Commute Time in Lemon Grove
The most frequently occuring commute durations in Lemon Grove are 20 to 24 minutes (2,085 commuters, 18.2%), 30 to 34 minutes (1,995 commuters, 17.4%), and 15 to 19 minutes (1,992 commuters, 17.4%).
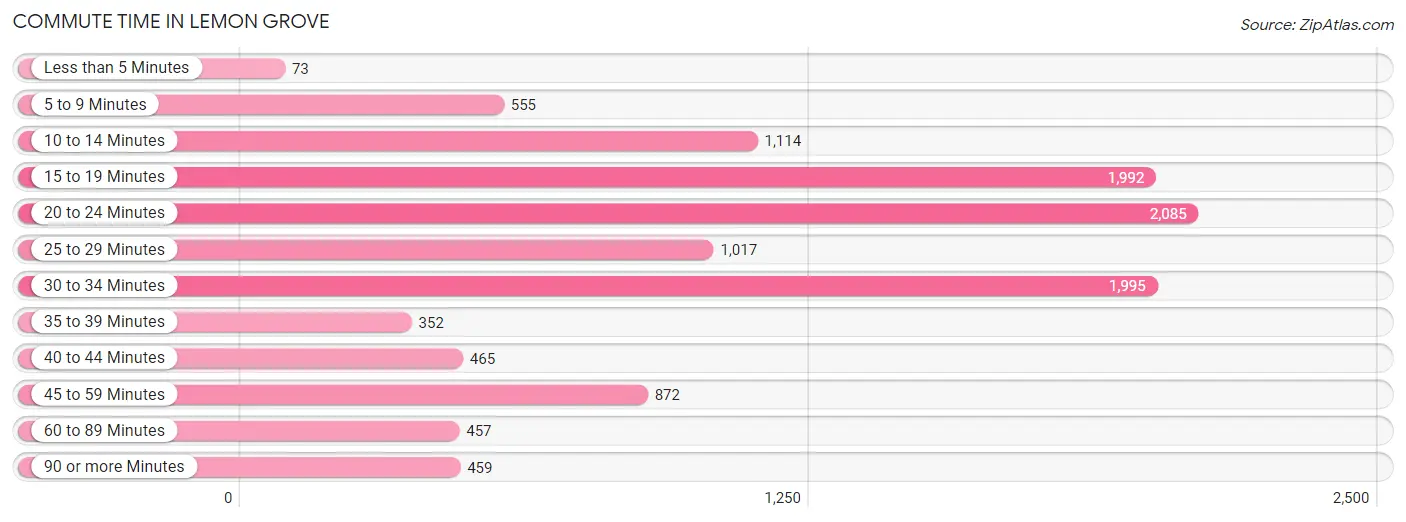
| Commute Time | # Commuters | % Commuters |
| Less than 5 Minutes | 73 | 0.6% |
| 5 to 9 Minutes | 555 | 4.9% |
| 10 to 14 Minutes | 1,114 | 9.7% |
| 15 to 19 Minutes | 1,992 | 17.4% |
| 20 to 24 Minutes | 2,085 | 18.2% |
| 25 to 29 Minutes | 1,017 | 8.9% |
| 30 to 34 Minutes | 1,995 | 17.4% |
| 35 to 39 Minutes | 352 | 3.1% |
| 40 to 44 Minutes | 465 | 4.1% |
| 45 to 59 Minutes | 872 | 7.6% |
| 60 to 89 Minutes | 457 | 4.0% |
| 90 or more Minutes | 459 | 4.0% |
Commute Time by Sex in Lemon Grove
The most common commute times in Lemon Grove are 15 to 19 minutes (1,237 commuters, 19.4%) for males and 20 to 24 minutes (1,063 commuters, 20.9%) for females.
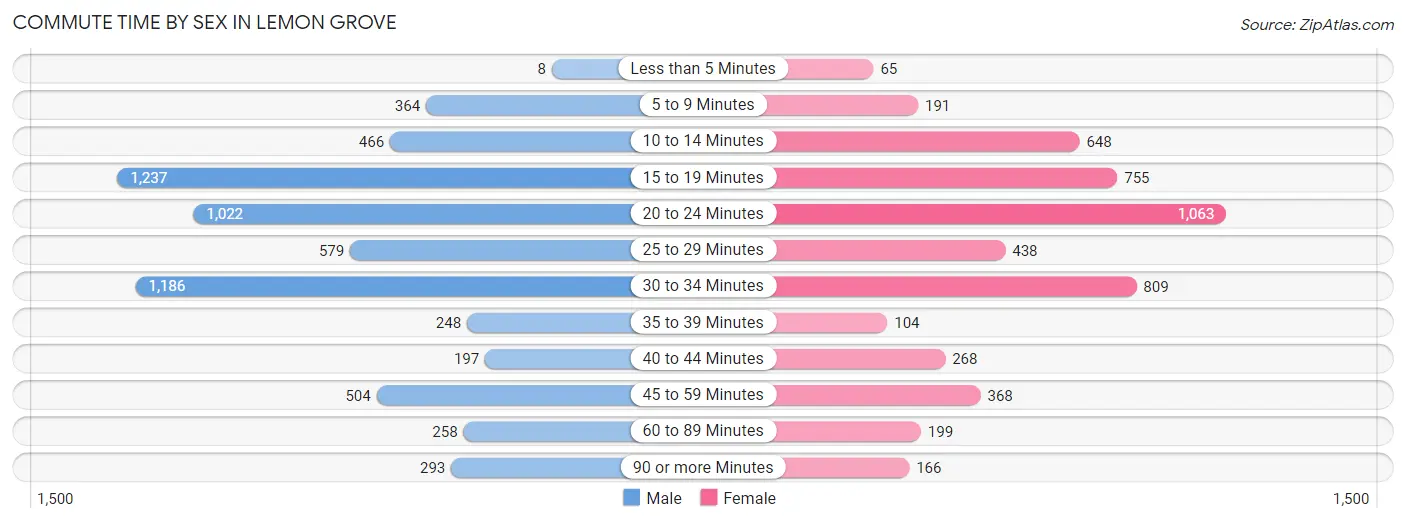
| Commute Time | Male | Female |
| Less than 5 Minutes | 8 (0.1%) | 65 (1.3%) |
| 5 to 9 Minutes | 364 (5.7%) | 191 (3.8%) |
| 10 to 14 Minutes | 466 (7.3%) | 648 (12.8%) |
| 15 to 19 Minutes | 1,237 (19.4%) | 755 (14.9%) |
| 20 to 24 Minutes | 1,022 (16.1%) | 1,063 (20.9%) |
| 25 to 29 Minutes | 579 (9.1%) | 438 (8.6%) |
| 30 to 34 Minutes | 1,186 (18.6%) | 809 (15.9%) |
| 35 to 39 Minutes | 248 (3.9%) | 104 (2.1%) |
| 40 to 44 Minutes | 197 (3.1%) | 268 (5.3%) |
| 45 to 59 Minutes | 504 (7.9%) | 368 (7.2%) |
| 60 to 89 Minutes | 258 (4.1%) | 199 (3.9%) |
| 90 or more Minutes | 293 (4.6%) | 166 (3.3%) |
Time of Departure to Work by Sex in Lemon Grove
The most frequent times of departure to work in Lemon Grove are 5:00 AM to 5:29 AM (805, 12.7%) for males and 6:30 AM to 6:59 AM (771, 15.2%) for females.
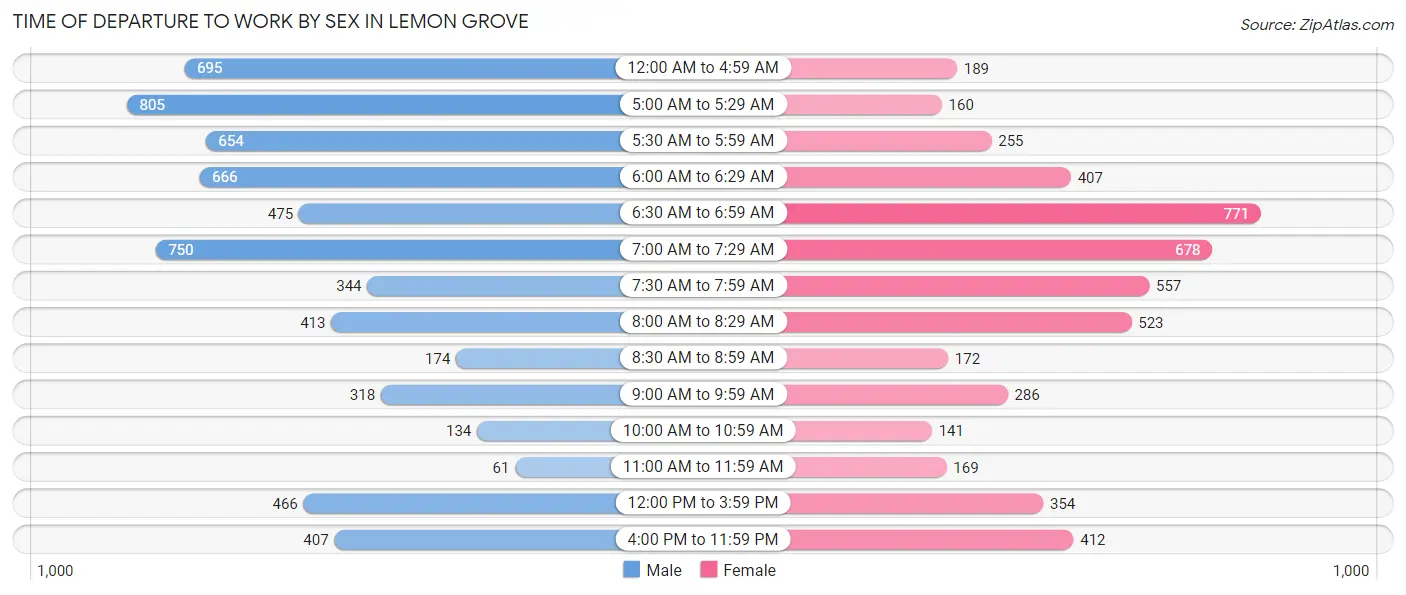
| Time of Departure | Male | Female |
| 12:00 AM to 4:59 AM | 695 (10.9%) | 189 (3.7%) |
| 5:00 AM to 5:29 AM | 805 (12.7%) | 160 (3.2%) |
| 5:30 AM to 5:59 AM | 654 (10.3%) | 255 (5.0%) |
| 6:00 AM to 6:29 AM | 666 (10.5%) | 407 (8.0%) |
| 6:30 AM to 6:59 AM | 475 (7.5%) | 771 (15.2%) |
| 7:00 AM to 7:29 AM | 750 (11.8%) | 678 (13.4%) |
| 7:30 AM to 7:59 AM | 344 (5.4%) | 557 (11.0%) |
| 8:00 AM to 8:29 AM | 413 (6.5%) | 523 (10.3%) |
| 8:30 AM to 8:59 AM | 174 (2.7%) | 172 (3.4%) |
| 9:00 AM to 9:59 AM | 318 (5.0%) | 286 (5.6%) |
| 10:00 AM to 10:59 AM | 134 (2.1%) | 141 (2.8%) |
| 11:00 AM to 11:59 AM | 61 (1.0%) | 169 (3.3%) |
| 12:00 PM to 3:59 PM | 466 (7.3%) | 354 (7.0%) |
| 4:00 PM to 11:59 PM | 407 (6.4%) | 412 (8.1%) |
| Total | 6,362 (100.0%) | 5,074 (100.0%) |
Housing Occupancy in Lemon Grove
Occupancy by Ownership in Lemon Grove
Of the total 9,159 dwellings in Lemon Grove, owner-occupied units account for 4,939 (53.9%), while renter-occupied units make up 4,220 (46.1%).
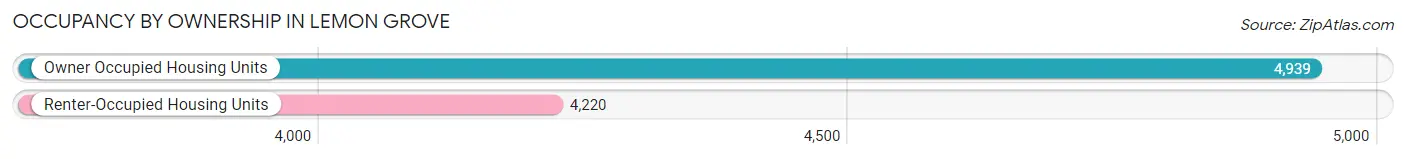
| Occupancy | # Housing Units | % Housing Units |
| Owner Occupied Housing Units | 4,939 | 53.9% |
| Renter-Occupied Housing Units | 4,220 | 46.1% |
| Total Occupied Housing Units | 9,159 | 100.0% |
Occupancy by Household Size in Lemon Grove
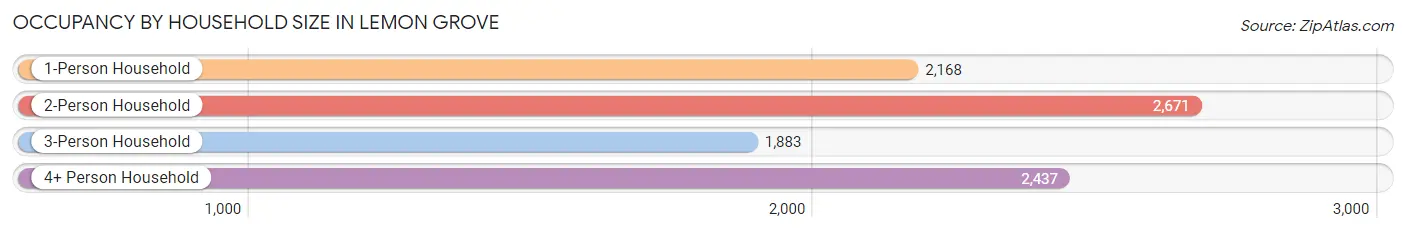
| Household Size | # Housing Units | % Housing Units |
| 1-Person Household | 2,168 | 23.7% |
| 2-Person Household | 2,671 | 29.2% |
| 3-Person Household | 1,883 | 20.6% |
| 4+ Person Household | 2,437 | 26.6% |
| Total Housing Units | 9,159 | 100.0% |
Occupancy by Ownership by Household Size in Lemon Grove
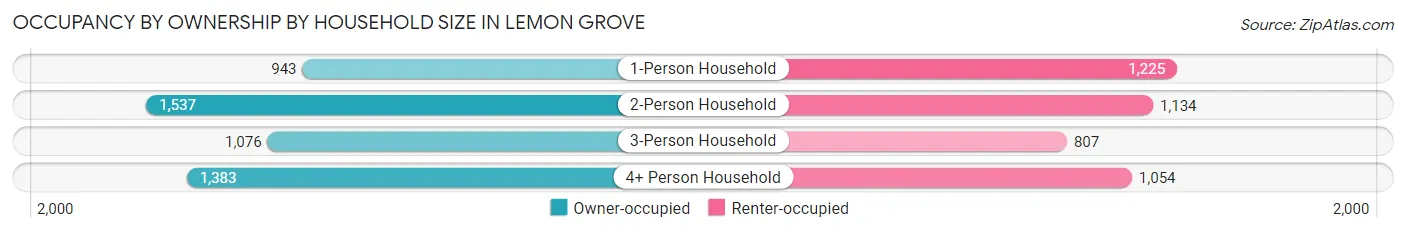
| Household Size | Owner-occupied | Renter-occupied |
| 1-Person Household | 943 (43.5%) | 1,225 (56.5%) |
| 2-Person Household | 1,537 (57.5%) | 1,134 (42.5%) |
| 3-Person Household | 1,076 (57.1%) | 807 (42.9%) |
| 4+ Person Household | 1,383 (56.8%) | 1,054 (43.2%) |
| Total Housing Units | 4,939 (53.9%) | 4,220 (46.1%) |
Occupancy by Educational Attainment in Lemon Grove
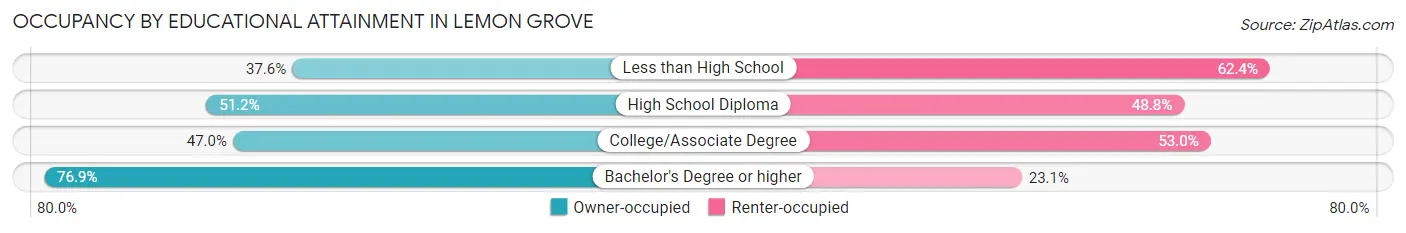
| Household Size | Owner-occupied | Renter-occupied |
| Less than High School | 416 (37.6%) | 691 (62.4%) |
| High School Diploma | 898 (51.2%) | 857 (48.8%) |
| College/Associate Degree | 1,911 (47.0%) | 2,157 (53.0%) |
| Bachelor's Degree or higher | 1,714 (76.9%) | 515 (23.1%) |
Occupancy by Age of Householder in Lemon Grove
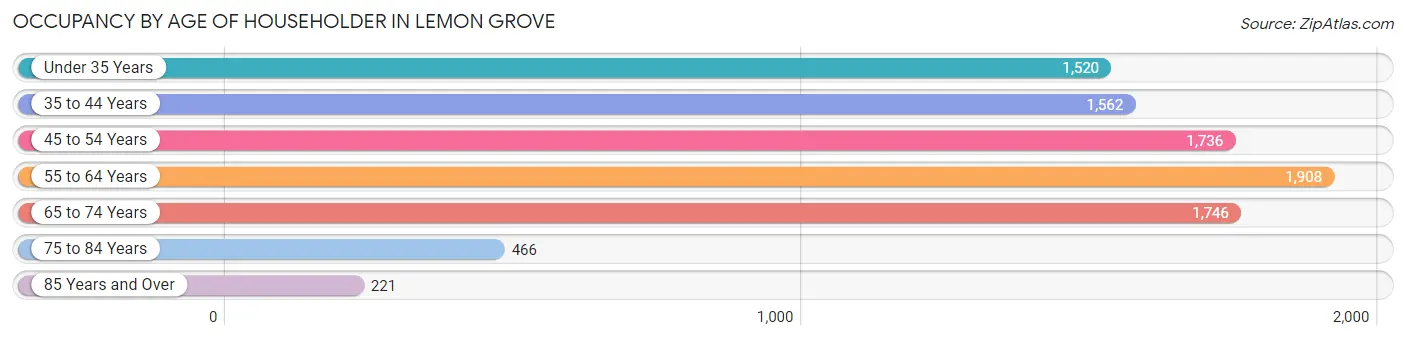
| Age Bracket | # Households | % Households |
| Under 35 Years | 1,520 | 16.6% |
| 35 to 44 Years | 1,562 | 17.1% |
| 45 to 54 Years | 1,736 | 19.0% |
| 55 to 64 Years | 1,908 | 20.8% |
| 65 to 74 Years | 1,746 | 19.1% |
| 75 to 84 Years | 466 | 5.1% |
| 85 Years and Over | 221 | 2.4% |
| Total | 9,159 | 100.0% |
Housing Finances in Lemon Grove
Median Income by Occupancy in Lemon Grove
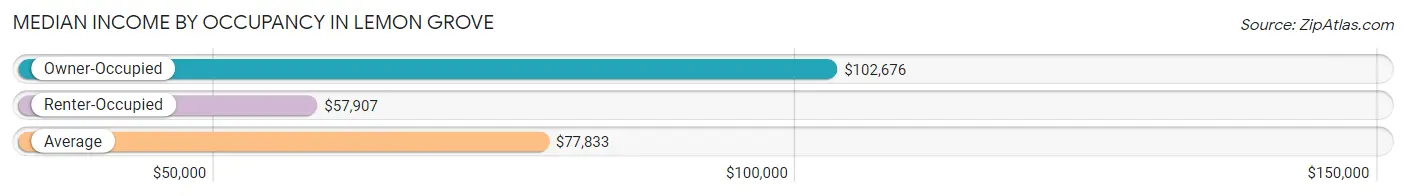
| Occupancy Type | # Households | Median Income |
| Owner-Occupied | 4,939 (53.9%) | $102,676 |
| Renter-Occupied | 4,220 (46.1%) | $57,907 |
| Average | 9,159 (100.0%) | $77,833 |
Occupancy by Householder Income Bracket in Lemon Grove
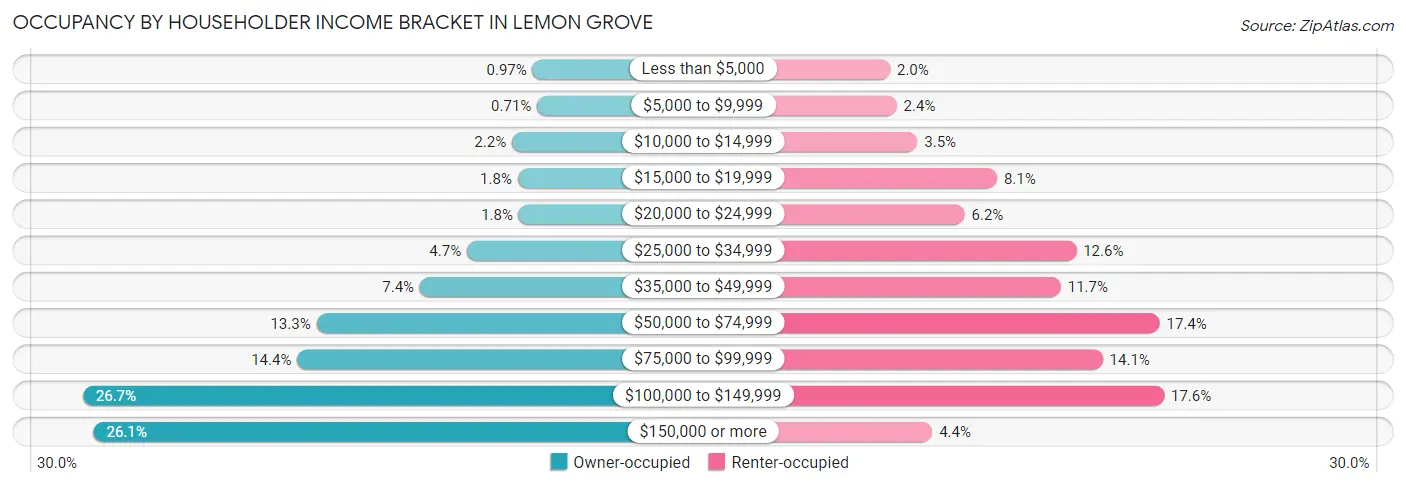
| Income Bracket | Owner-occupied | Renter-occupied |
| Less than $5,000 | 48 (1.0%) | 83 (2.0%) |
| $5,000 to $9,999 | 35 (0.7%) | 99 (2.4%) |
| $10,000 to $14,999 | 106 (2.1%) | 149 (3.5%) |
| $15,000 to $19,999 | 90 (1.8%) | 341 (8.1%) |
| $20,000 to $24,999 | 87 (1.8%) | 263 (6.2%) |
| $25,000 to $34,999 | 233 (4.7%) | 532 (12.6%) |
| $35,000 to $49,999 | 366 (7.4%) | 495 (11.7%) |
| $50,000 to $74,999 | 658 (13.3%) | 733 (17.4%) |
| $75,000 to $99,999 | 712 (14.4%) | 596 (14.1%) |
| $100,000 to $149,999 | 1,317 (26.7%) | 744 (17.6%) |
| $150,000 or more | 1,287 (26.1%) | 185 (4.4%) |
| Total | 4,939 (100.0%) | 4,220 (100.0%) |
Monthly Housing Cost Tiers in Lemon Grove
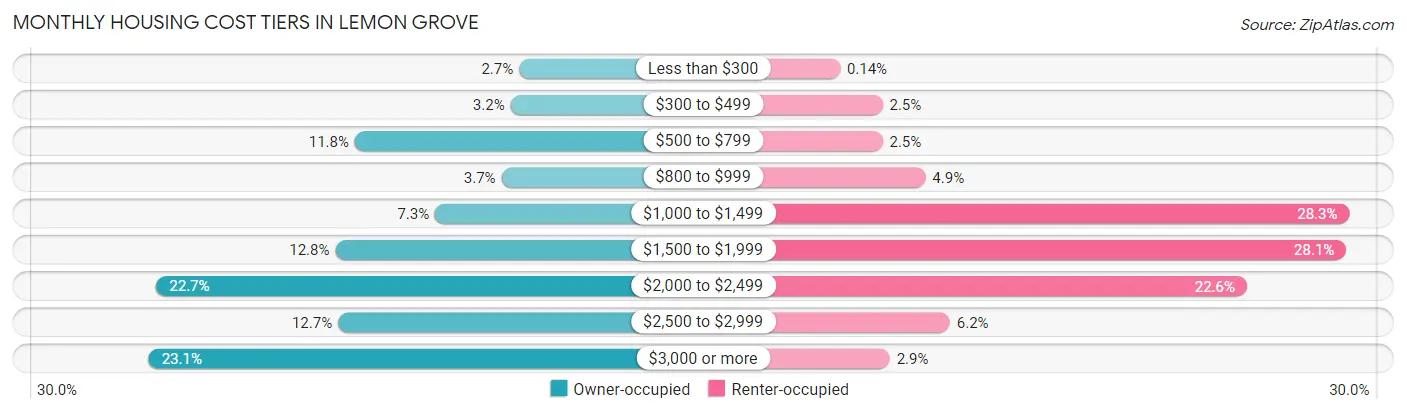
| Monthly Cost | Owner-occupied | Renter-occupied |
| Less than $300 | 133 (2.7%) | 6 (0.1%) |
| $300 to $499 | 156 (3.2%) | 105 (2.5%) |
| $500 to $799 | 581 (11.8%) | 105 (2.5%) |
| $800 to $999 | 181 (3.7%) | 205 (4.9%) |
| $1,000 to $1,499 | 362 (7.3%) | 1,193 (28.3%) |
| $1,500 to $1,999 | 634 (12.8%) | 1,186 (28.1%) |
| $2,000 to $2,499 | 1,122 (22.7%) | 954 (22.6%) |
| $2,500 to $2,999 | 627 (12.7%) | 262 (6.2%) |
| $3,000 or more | 1,143 (23.1%) | 122 (2.9%) |
| Total | 4,939 (100.0%) | 4,220 (100.0%) |
Physical Housing Characteristics in Lemon Grove
Housing Structures in Lemon Grove
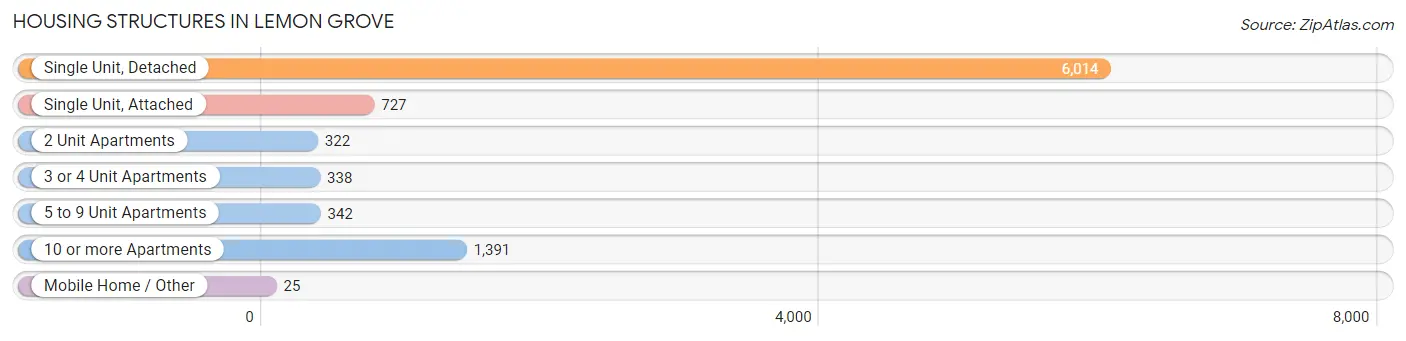
| Structure Type | # Housing Units | % Housing Units |
| Single Unit, Detached | 6,014 | 65.7% |
| Single Unit, Attached | 727 | 7.9% |
| 2 Unit Apartments | 322 | 3.5% |
| 3 or 4 Unit Apartments | 338 | 3.7% |
| 5 to 9 Unit Apartments | 342 | 3.7% |
| 10 or more Apartments | 1,391 | 15.2% |
| Mobile Home / Other | 25 | 0.3% |
| Total | 9,159 | 100.0% |
Housing Structures by Occupancy in Lemon Grove
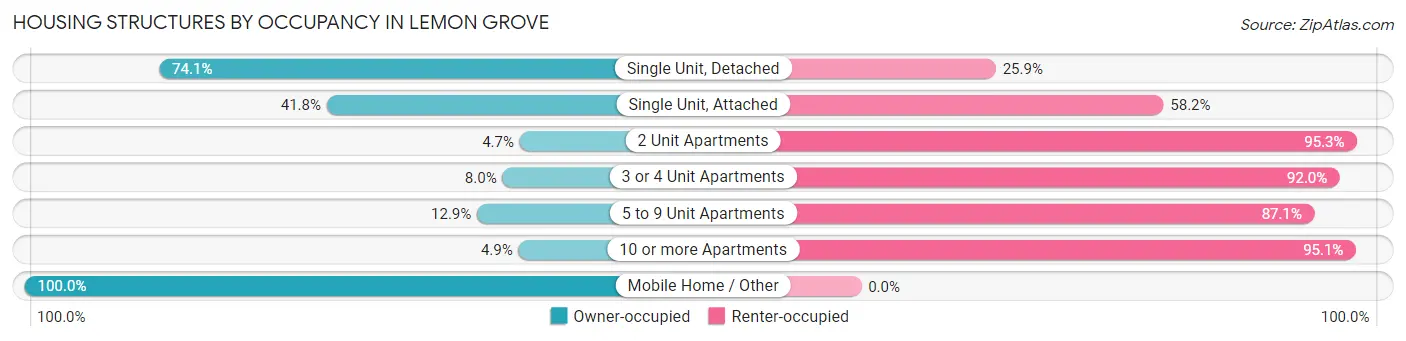
| Structure Type | Owner-occupied | Renter-occupied |
| Single Unit, Detached | 4,456 (74.1%) | 1,558 (25.9%) |
| Single Unit, Attached | 304 (41.8%) | 423 (58.2%) |
| 2 Unit Apartments | 15 (4.7%) | 307 (95.3%) |
| 3 or 4 Unit Apartments | 27 (8.0%) | 311 (92.0%) |
| 5 to 9 Unit Apartments | 44 (12.9%) | 298 (87.1%) |
| 10 or more Apartments | 68 (4.9%) | 1,323 (95.1%) |
| Mobile Home / Other | 25 (100.0%) | 0 (0.0%) |
| Total | 4,939 (53.9%) | 4,220 (46.1%) |
Housing Structures by Number of Rooms in Lemon Grove
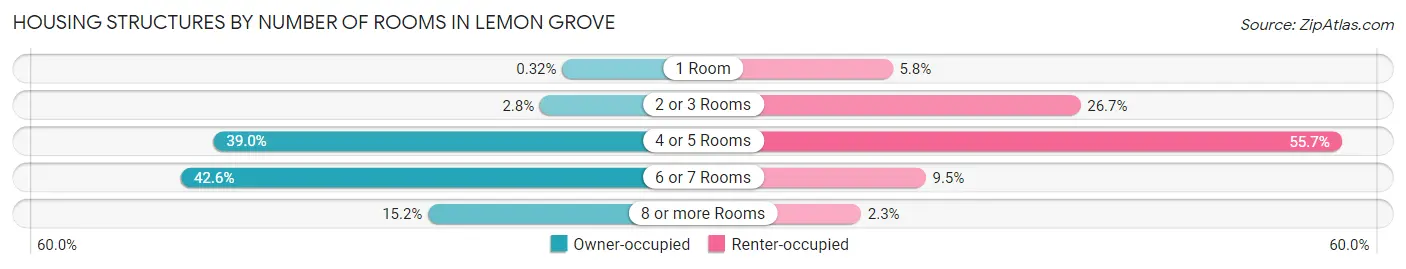
| Number of Rooms | Owner-occupied | Renter-occupied |
| 1 Room | 16 (0.3%) | 246 (5.8%) |
| 2 or 3 Rooms | 138 (2.8%) | 1,126 (26.7%) |
| 4 or 5 Rooms | 1,928 (39.0%) | 2,349 (55.7%) |
| 6 or 7 Rooms | 2,106 (42.6%) | 401 (9.5%) |
| 8 or more Rooms | 751 (15.2%) | 98 (2.3%) |
| Total | 4,939 (100.0%) | 4,220 (100.0%) |
Housing Structure by Heating Type in Lemon Grove
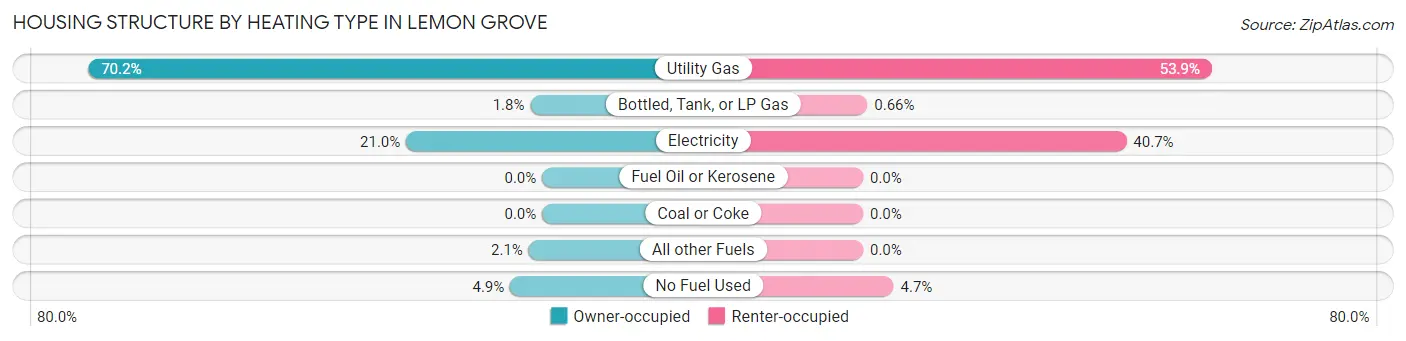
| Heating Type | Owner-occupied | Renter-occupied |
| Utility Gas | 3,465 (70.2%) | 2,275 (53.9%) |
| Bottled, Tank, or LP Gas | 90 (1.8%) | 28 (0.7%) |
| Electricity | 1,038 (21.0%) | 1,718 (40.7%) |
| Fuel Oil or Kerosene | 0 (0.0%) | 0 (0.0%) |
| Coal or Coke | 0 (0.0%) | 0 (0.0%) |
| All other Fuels | 102 (2.1%) | 0 (0.0%) |
| No Fuel Used | 244 (4.9%) | 199 (4.7%) |
| Total | 4,939 (100.0%) | 4,220 (100.0%) |
Household Vehicle Usage in Lemon Grove
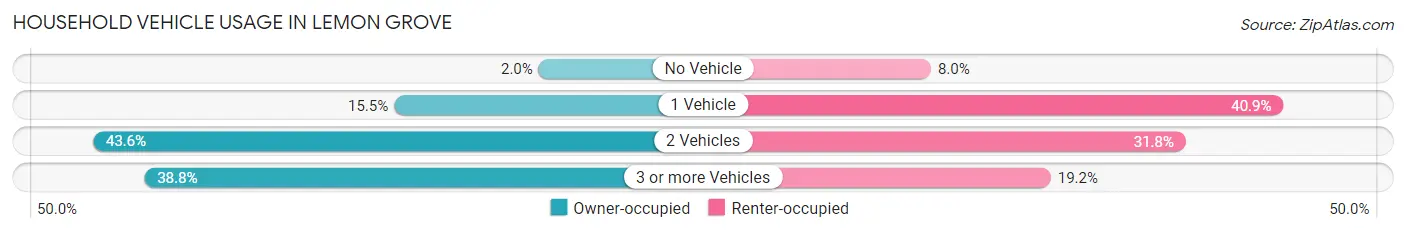
| Vehicles per Household | Owner-occupied | Renter-occupied |
| No Vehicle | 100 (2.0%) | 339 (8.0%) |
| 1 Vehicle | 766 (15.5%) | 1,727 (40.9%) |
| 2 Vehicles | 2,155 (43.6%) | 1,343 (31.8%) |
| 3 or more Vehicles | 1,918 (38.8%) | 811 (19.2%) |
| Total | 4,939 (100.0%) | 4,220 (100.0%) |
Real Estate & Mortgages in Lemon Grove
Real Estate and Mortgage Overview in Lemon Grove
| Characteristic | Without Mortgage | With Mortgage |
| Housing Units | 839 | 4,100 |
| Median Property Value | $588,100 | $594,300 |
| Median Household Income | $77,869 | $1,140 |
| Monthly Housing Costs | $663 | $1,143 |
| Real Estate Taxes | $3,572 | $76 |
Property Value by Mortgage Status in Lemon Grove
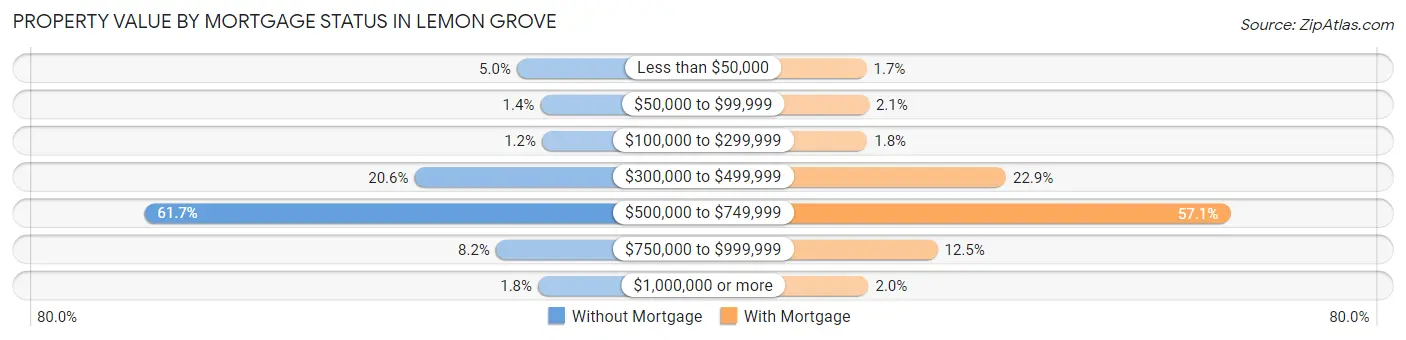
| Property Value | Without Mortgage | With Mortgage |
| Less than $50,000 | 42 (5.0%) | 69 (1.7%) |
| $50,000 to $99,999 | 12 (1.4%) | 84 (2.1%) |
| $100,000 to $299,999 | 10 (1.2%) | 74 (1.8%) |
| $300,000 to $499,999 | 173 (20.6%) | 940 (22.9%) |
| $500,000 to $749,999 | 518 (61.7%) | 2,340 (57.1%) |
| $750,000 to $999,999 | 69 (8.2%) | 512 (12.5%) |
| $1,000,000 or more | 15 (1.8%) | 81 (2.0%) |
| Total | 839 (100.0%) | 4,100 (100.0%) |
Household Income by Mortgage Status in Lemon Grove
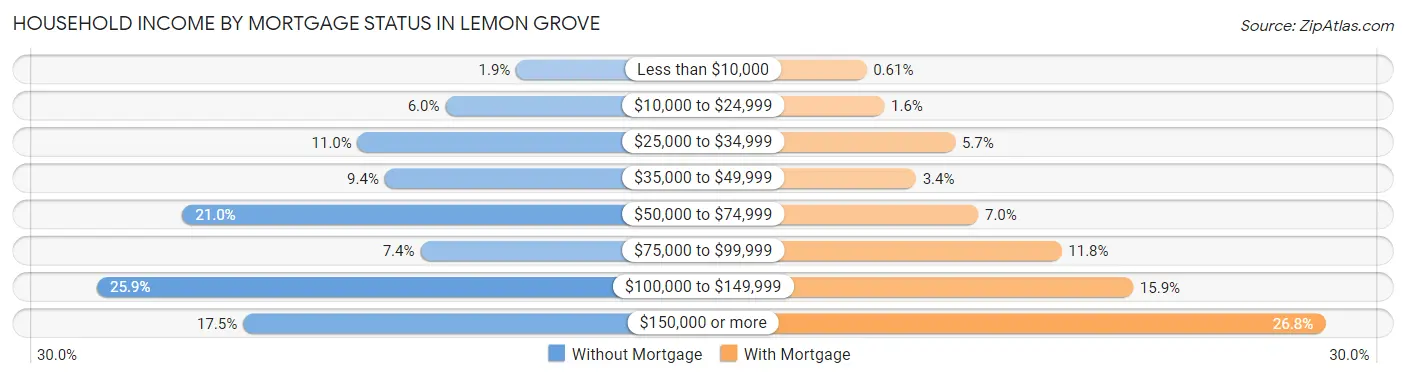
| Household Income | Without Mortgage | With Mortgage |
| Less than $10,000 | 16 (1.9%) | 25 (0.6%) |
| $10,000 to $24,999 | 50 (6.0%) | 67 (1.6%) |
| $25,000 to $34,999 | 92 (11.0%) | 233 (5.7%) |
| $35,000 to $49,999 | 79 (9.4%) | 141 (3.4%) |
| $50,000 to $74,999 | 176 (21.0%) | 287 (7.0%) |
| $75,000 to $99,999 | 62 (7.4%) | 482 (11.8%) |
| $100,000 to $149,999 | 217 (25.9%) | 650 (15.9%) |
| $150,000 or more | 147 (17.5%) | 1,100 (26.8%) |
| Total | 839 (100.0%) | 4,100 (100.0%) |
Property Value to Household Income Ratio in Lemon Grove
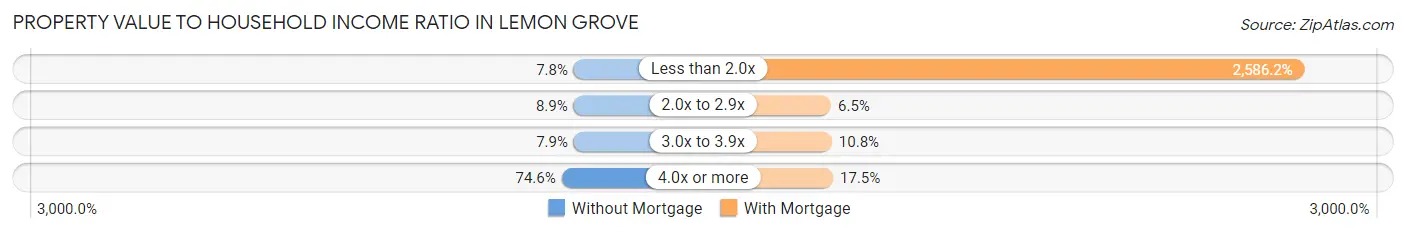
| Value-to-Income Ratio | Without Mortgage | With Mortgage |
| Less than 2.0x | 65 (7.7%) | 106,034 (2,586.2%) |
| 2.0x to 2.9x | 75 (8.9%) | 265 (6.5%) |
| 3.0x to 3.9x | 66 (7.9%) | 443 (10.8%) |
| 4.0x or more | 626 (74.6%) | 716 (17.5%) |
| Total | 839 (100.0%) | 4,100 (100.0%) |
Real Estate Taxes by Mortgage Status in Lemon Grove
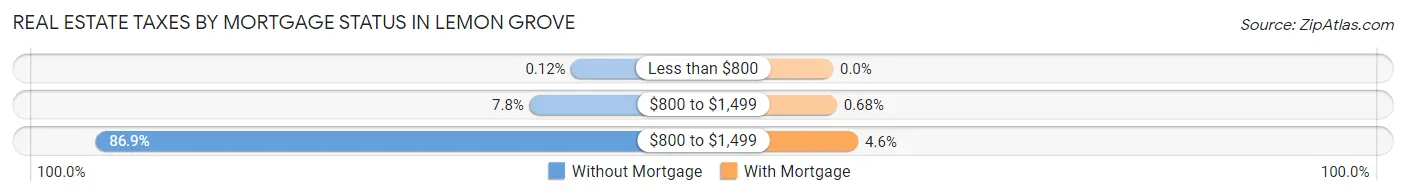
| Property Taxes | Without Mortgage | With Mortgage |
| Less than $800 | 1 (0.1%) | 0 (0.0%) |
| $800 to $1,499 | 65 (7.7%) | 28 (0.7%) |
| $800 to $1,499 | 729 (86.9%) | 188 (4.6%) |
| Total | 839 (100.0%) | 4,100 (100.0%) |
Health & Disability in Lemon Grove
Health Insurance Coverage by Age in Lemon Grove
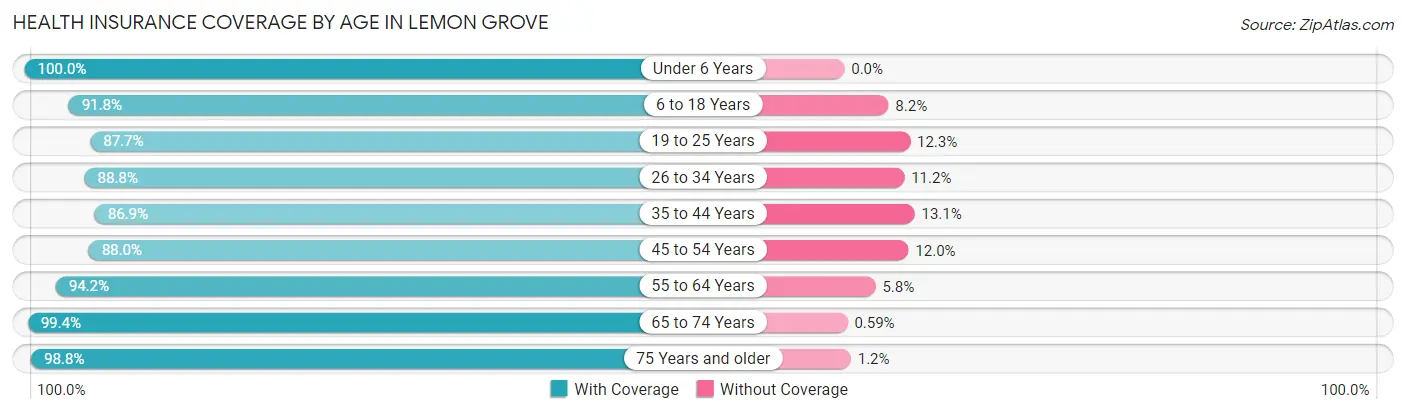
| Age Bracket | With Coverage | Without Coverage |
| Under 6 Years | 1,855 (100.0%) | 0 (0.0%) |
| 6 to 18 Years | 4,082 (91.8%) | 366 (8.2%) |
| 19 to 25 Years | 2,361 (87.7%) | 330 (12.3%) |
| 26 to 34 Years | 3,004 (88.8%) | 378 (11.2%) |
| 35 to 44 Years | 2,866 (86.9%) | 432 (13.1%) |
| 45 to 54 Years | 2,930 (88.0%) | 398 (12.0%) |
| 55 to 64 Years | 3,576 (94.2%) | 221 (5.8%) |
| 65 to 74 Years | 2,676 (99.4%) | 16 (0.6%) |
| 75 Years and older | 1,144 (98.8%) | 14 (1.2%) |
| Total | 24,494 (91.9%) | 2,155 (8.1%) |
Health Insurance Coverage by Citizenship Status in Lemon Grove
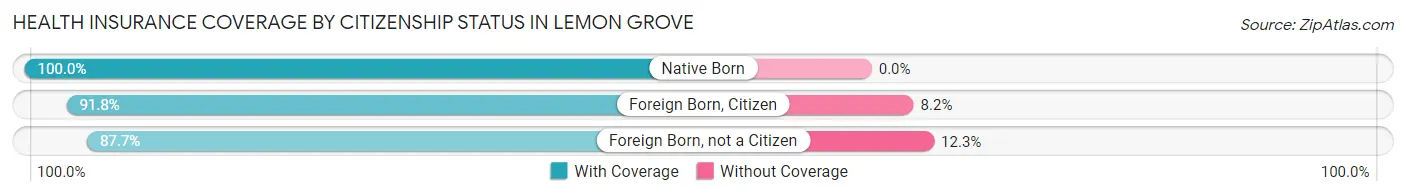
| Citizenship Status | With Coverage | Without Coverage |
| Native Born | 1,855 (100.0%) | 0 (0.0%) |
| Foreign Born, Citizen | 4,082 (91.8%) | 366 (8.2%) |
| Foreign Born, not a Citizen | 2,361 (87.7%) | 330 (12.3%) |
Health Insurance Coverage by Household Income in Lemon Grove
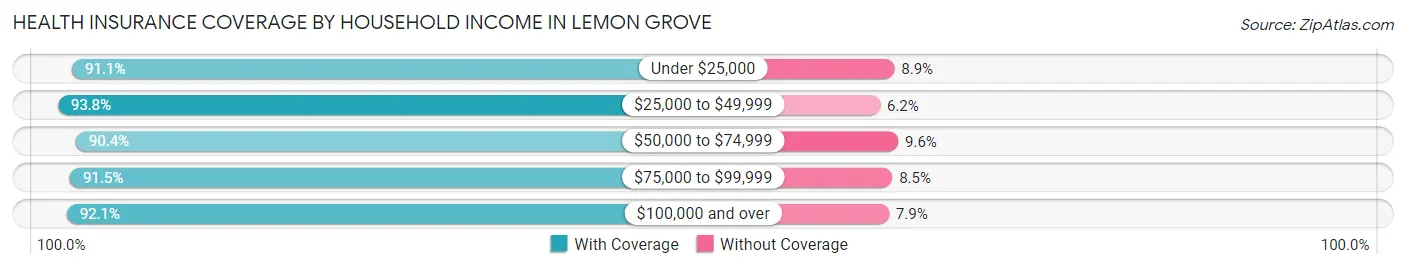
| Household Income | With Coverage | Without Coverage |
| Under $25,000 | 2,352 (91.1%) | 230 (8.9%) |
| $25,000 to $49,999 | 3,316 (93.8%) | 220 (6.2%) |
| $50,000 to $74,999 | 3,250 (90.4%) | 346 (9.6%) |
| $75,000 to $99,999 | 3,313 (91.5%) | 308 (8.5%) |
| $100,000 and over | 12,136 (92.1%) | 1,040 (7.9%) |
Public vs Private Health Insurance Coverage by Age in Lemon Grove
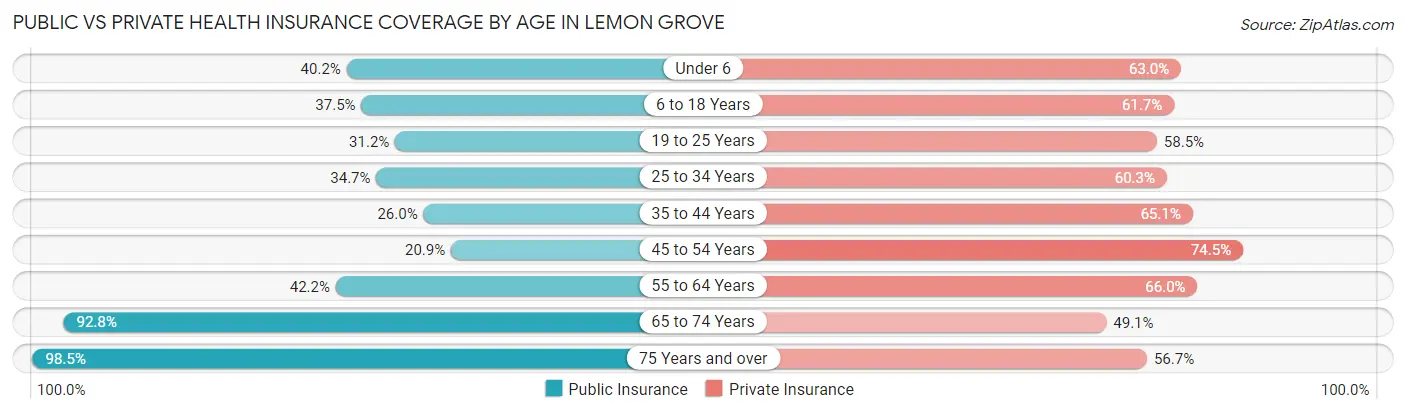
| Age Bracket | Public Insurance | Private Insurance |
| Under 6 | 746 (40.2%) | 1,168 (63.0%) |
| 6 to 18 Years | 1,667 (37.5%) | 2,742 (61.7%) |
| 19 to 25 Years | 840 (31.2%) | 1,574 (58.5%) |
| 25 to 34 Years | 1,174 (34.7%) | 2,040 (60.3%) |
| 35 to 44 Years | 856 (26.0%) | 2,148 (65.1%) |
| 45 to 54 Years | 694 (20.8%) | 2,478 (74.5%) |
| 55 to 64 Years | 1,604 (42.2%) | 2,506 (66.0%) |
| 65 to 74 Years | 2,497 (92.8%) | 1,322 (49.1%) |
| 75 Years and over | 1,141 (98.5%) | 656 (56.7%) |
| Total | 11,219 (42.1%) | 16,634 (62.4%) |
Disability Status by Sex by Age in Lemon Grove
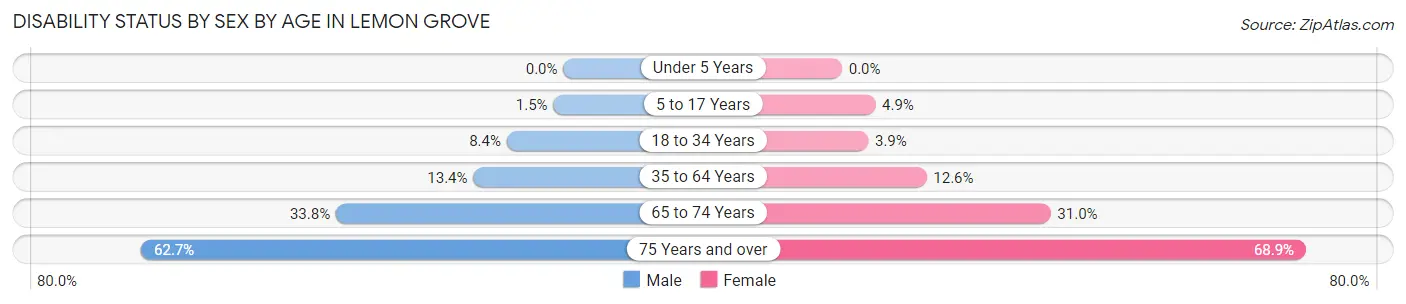
| Age Bracket | Male | Female |
| Under 5 Years | 0 (0.0%) | 0 (0.0%) |
| 5 to 17 Years | 33 (1.5%) | 113 (4.9%) |
| 18 to 34 Years | 276 (8.4%) | 121 (3.9%) |
| 35 to 64 Years | 679 (13.4%) | 671 (12.6%) |
| 65 to 74 Years | 474 (33.8%) | 399 (31.0%) |
| 75 Years and over | 244 (62.7%) | 530 (68.9%) |
Disability Class by Sex by Age in Lemon Grove
Disability Class: Hearing Difficulty
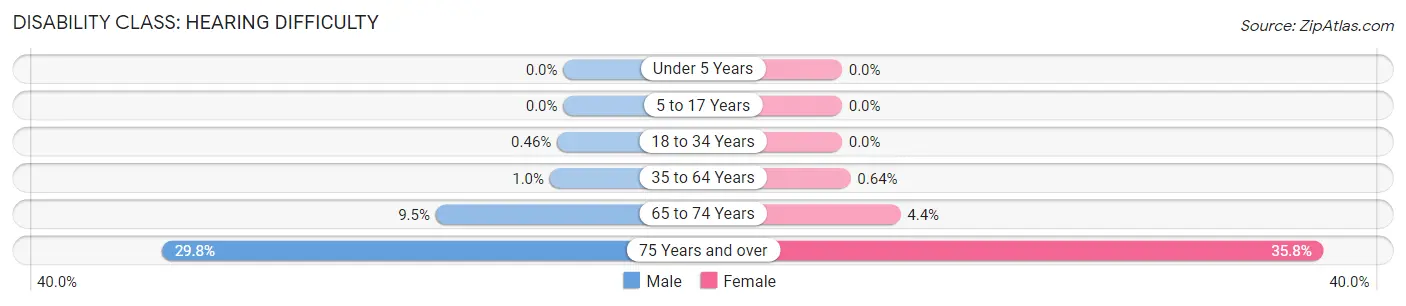
| Age Bracket | Male | Female |
| Under 5 Years | 0 (0.0%) | 0 (0.0%) |
| 5 to 17 Years | 0 (0.0%) | 0 (0.0%) |
| 18 to 34 Years | 15 (0.5%) | 0 (0.0%) |
| 35 to 64 Years | 51 (1.0%) | 34 (0.6%) |
| 65 to 74 Years | 133 (9.5%) | 56 (4.3%) |
| 75 Years and over | 116 (29.8%) | 275 (35.8%) |
Disability Class: Vision Difficulty
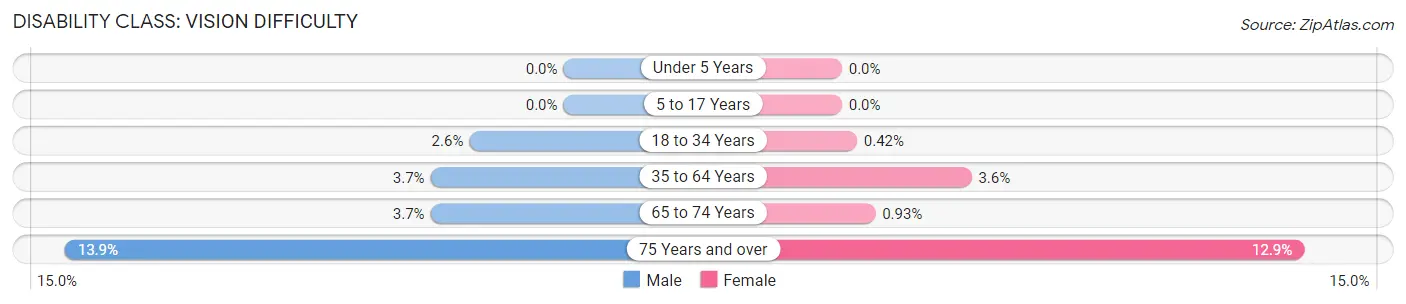
| Age Bracket | Male | Female |
| Under 5 Years | 0 (0.0%) | 0 (0.0%) |
| 5 to 17 Years | 0 (0.0%) | 0 (0.0%) |
| 18 to 34 Years | 86 (2.6%) | 13 (0.4%) |
| 35 to 64 Years | 188 (3.7%) | 193 (3.6%) |
| 65 to 74 Years | 52 (3.7%) | 12 (0.9%) |
| 75 Years and over | 54 (13.9%) | 99 (12.9%) |
Disability Class: Cognitive Difficulty
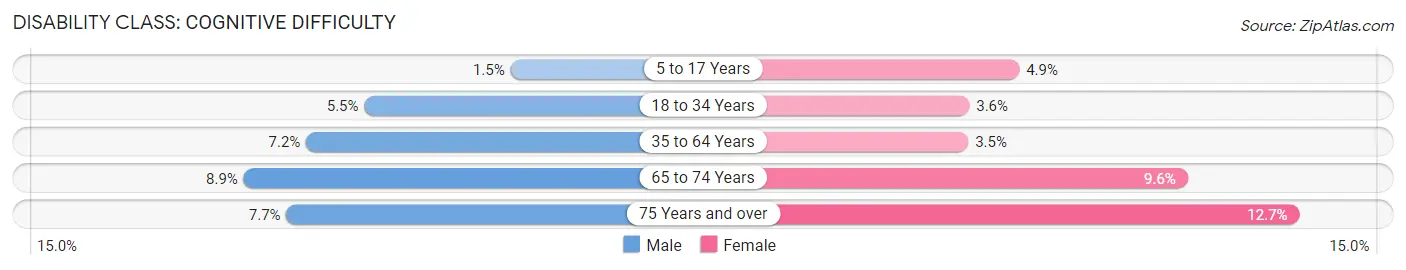
| Age Bracket | Male | Female |
| 5 to 17 Years | 33 (1.5%) | 113 (4.9%) |
| 18 to 34 Years | 182 (5.5%) | 110 (3.5%) |
| 35 to 64 Years | 364 (7.2%) | 188 (3.5%) |
| 65 to 74 Years | 125 (8.9%) | 124 (9.6%) |
| 75 Years and over | 30 (7.7%) | 98 (12.7%) |
Disability Class: Ambulatory Difficulty
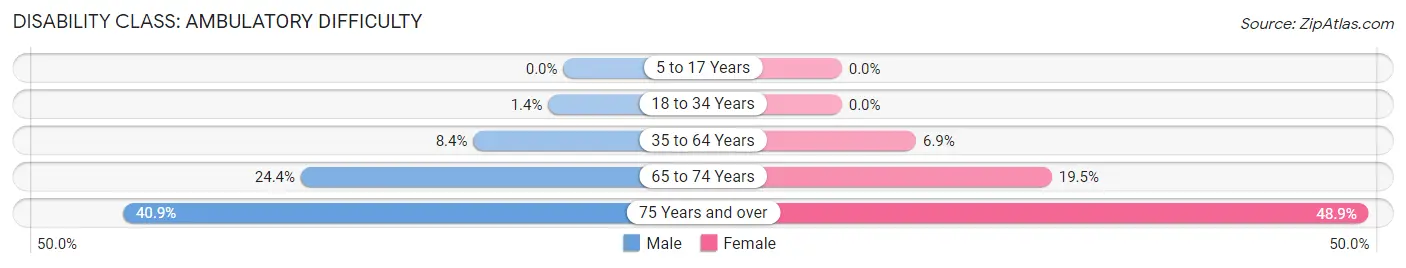
| Age Bracket | Male | Female |
| 5 to 17 Years | 0 (0.0%) | 0 (0.0%) |
| 18 to 34 Years | 46 (1.4%) | 0 (0.0%) |
| 35 to 64 Years | 425 (8.4%) | 368 (6.9%) |
| 65 to 74 Years | 342 (24.4%) | 251 (19.5%) |
| 75 Years and over | 159 (40.9%) | 376 (48.9%) |
Disability Class: Self-Care Difficulty
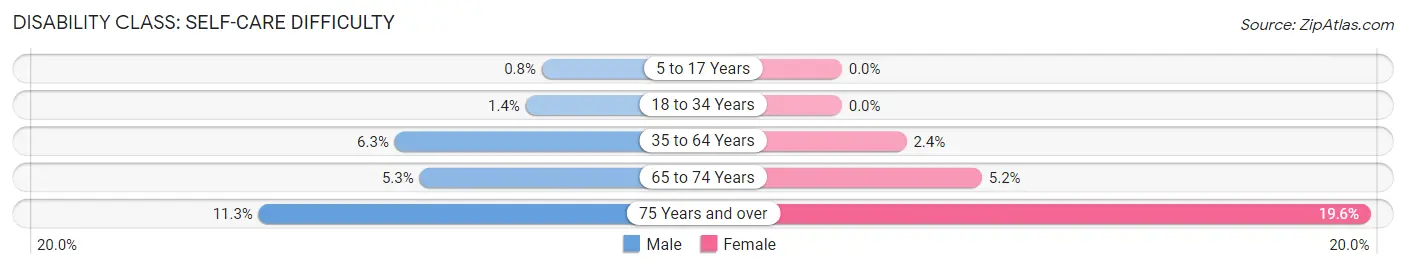
| Age Bracket | Male | Female |
| 5 to 17 Years | 18 (0.8%) | 0 (0.0%) |
| 18 to 34 Years | 46 (1.4%) | 0 (0.0%) |
| 35 to 64 Years | 318 (6.3%) | 128 (2.4%) |
| 65 to 74 Years | 75 (5.3%) | 67 (5.2%) |
| 75 Years and over | 44 (11.3%) | 151 (19.6%) |
Technology Access in Lemon Grove
Computing Device Access in Lemon Grove
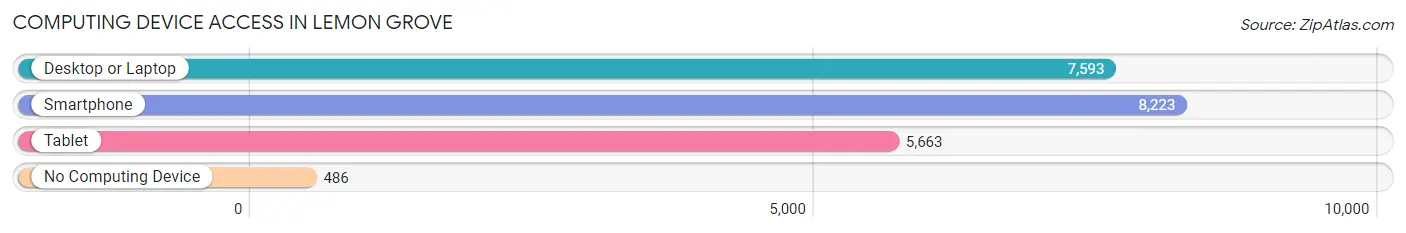
| Device Type | # Households | % Households |
| Desktop or Laptop | 7,593 | 82.9% |
| Smartphone | 8,223 | 89.8% |
| Tablet | 5,663 | 61.8% |
| No Computing Device | 486 | 5.3% |
| Total | 9,159 | 100.0% |
Internet Access in Lemon Grove
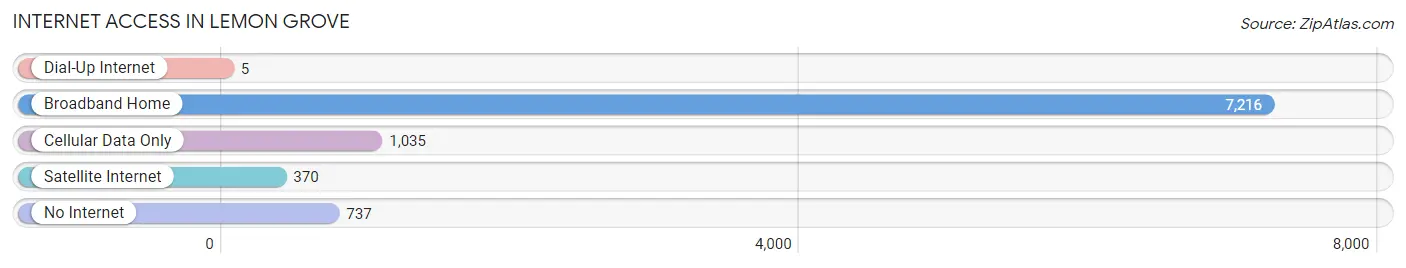
| Internet Type | # Households | % Households |
| Dial-Up Internet | 5 | 0.1% |
| Broadband Home | 7,216 | 78.8% |
| Cellular Data Only | 1,035 | 11.3% |
| Satellite Internet | 370 | 4.0% |
| No Internet | 737 | 8.1% |
| Total | 9,159 | 100.0% |
Lemon Grove Summary
Lemon Grove is a city located in San Diego County, California. It is situated in the southeastern part of the county, just east of the city of San Diego. The population of Lemon Grove was 25,320 as of the 2010 census, making it the 17th largest city in San Diego County.
History
Lemon Grove was founded in 1894 by a group of settlers from San Diego. The settlers purchased a large tract of land from the San Diego Land and Town Company and began to develop the area. The town was named after the many lemon trees that were planted in the area. The first post office was established in 1895 and the first school was built in 1897.
In the early 1900s, Lemon Grove was a small agricultural community, with most of the land being used for growing citrus fruits. The town was also home to a number of small businesses, including a blacksmith shop, a general store, and a hotel.
In the 1920s, the town began to grow rapidly as more people moved to the area. The population increased from 1,000 in 1920 to 4,000 in 1930. During this time, the town was incorporated as a city in 1925.
Geography
Lemon Grove is located in the southeastern part of San Diego County, just east of the city of San Diego. The city covers an area of 4.3 square miles and has an elevation of 441 feet. The city is bordered by the cities of La Mesa to the north, Spring Valley to the east, and San Diego to the south and west.
The climate in Lemon Grove is classified as Mediterranean, with warm, dry summers and mild, wet winters. The average temperature in the summer is around 75 degrees Fahrenheit, while the average temperature in the winter is around 55 degrees Fahrenheit.
Economy
The economy of Lemon Grove is largely based on retail and services. The city is home to a number of shopping centers, including the Lemon Grove Shopping Center, the Lemon Grove Plaza, and the Lemon Grove Town Center. The city is also home to a number of restaurants, banks, and other businesses.
The city is also home to a number of manufacturing and industrial businesses, including a number of food processing plants. The city is also home to a number of government offices, including the San Diego County Sheriff's Department and the San Diego County Health and Human Services Agency.
Demographics
As of the 2010 census, the population of Lemon Grove was 25,320. The racial makeup of the city was 57.2% White, 4.2% African American, 0.7% Native American, 11.2% Asian, 0.3% Pacific Islander, 22.7% from other races, and 3.7% from two or more races. Hispanic or Latino of any race were 44.2% of the population.
The median household income in Lemon Grove was $50,945, and the median family income was $58,945. The per capita income for the city was $22,845. About 14.2% of the population was below the poverty line.
Common Questions
What is Per Capita Income in Lemon Grove?
Per Capita income in Lemon Grove is $33,270.
What is the Median Family Income in Lemon Grove?
Median Family Income in Lemon Grove is $88,750.
What is the Median Household income in Lemon Grove?
Median Household Income in Lemon Grove is $77,833.
What is Income or Wage Gap in Lemon Grove?
Income or Wage Gap in Lemon Grove is 26.1%.
Women in Lemon Grove earn 73.9 cents for every dollar earned by a man.
What is Inequality or Gini Index in Lemon Grove?
Inequality or Gini Index in Lemon Grove is 0.41.
What is the Total Population of Lemon Grove?
Total Population of Lemon Grove is 27,482.
What is the Total Male Population of Lemon Grove?
Total Male Population of Lemon Grove is 13,866.
What is the Total Female Population of Lemon Grove?
Total Female Population of Lemon Grove is 13,616.
What is the Ratio of Males per 100 Females in Lemon Grove?
There are 101.84 Males per 100 Females in Lemon Grove.
What is the Ratio of Females per 100 Males in Lemon Grove?
There are 98.20 Females per 100 Males in Lemon Grove.
What is the Median Population Age in Lemon Grove?
Median Population Age in Lemon Grove is 37.5 Years.
What is the Average Family Size in Lemon Grove
Average Family Size in Lemon Grove is 3.6 People.
What is the Average Household Size in Lemon Grove
Average Household Size in Lemon Grove is 3.0 People.
How Large is the Labor Force in Lemon Grove?
There are 14,506 People in the Labor Forcein in Lemon Grove.
What is the Percentage of People in the Labor Force in Lemon Grove?
65.0% of People are in the Labor Force in Lemon Grove.
What is the Unemployment Rate in Lemon Grove?
Unemployment Rate in Lemon Grove is 8.2%.