Suisun City, CA Map & Demographics
Suisun City Map
Suisun City Overview
$36,348
PER CAPITA INCOME
$108,848
AVG FAMILY INCOME
$95,394
AVG HOUSEHOLD INCOME
22.4%
WAGE / INCOME GAP [ % ]
77.6¢/ $1
WAGE / INCOME GAP [ $ ]
$8,643
FAMILY INCOME DEFICIT
0.38
INEQUALITY / GINI INDEX
29,350
TOTAL POPULATION
14,946
MALE POPULATION
14,404
FEMALE POPULATION
103.76
MALES / 100 FEMALES
96.37
FEMALES / 100 MALES
36.0
MEDIAN AGE
3.6
AVG FAMILY SIZE
3.0
AVG HOUSEHOLD SIZE
15,521
LABOR FORCE [ PEOPLE ]
66.9%
PERCENT IN LABOR FORCE
6.9%
UNEMPLOYMENT RATE
Suisun City Zip Codes
Suisun City Area Codes
Income in Suisun City
Income Overview in Suisun City
Per Capita Income in Suisun City is $36,348, while median incomes of families and households are $108,848 and $95,394 respectively.
| Characteristic | Number | Measure |
| Per Capita Income | 29,350 | $36,348 |
| Median Family Income | 7,023 | $108,848 |
| Mean Family Income | 7,023 | $120,140 |
| Median Household Income | 9,655 | $95,394 |
| Mean Household Income | 9,655 | $107,490 |
| Income Deficit | 7,023 | $8,643 |
| Wage / Income Gap (%) | 29,350 | 22.39% |
| Wage / Income Gap ($) | 29,350 | 77.61¢ per $1 |
| Gini / Inequality Index | 29,350 | 0.38 |
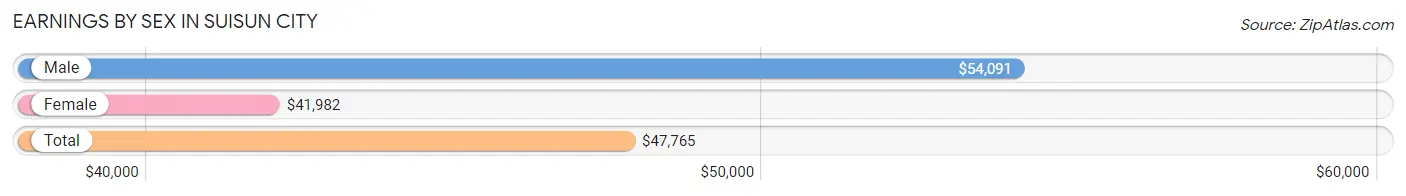
Earnings by Sex in Suisun City
Average Earnings in Suisun City are $47,765, $54,091 for men and $41,982 for women, a difference of 22.4%.
| Sex | Number | Average Earnings |
| Male | 8,003 (51.1%) | $54,091 |
| Female | 7,644 (48.8%) | $41,982 |
| Total | 15,647 (100.0%) | $47,765 |
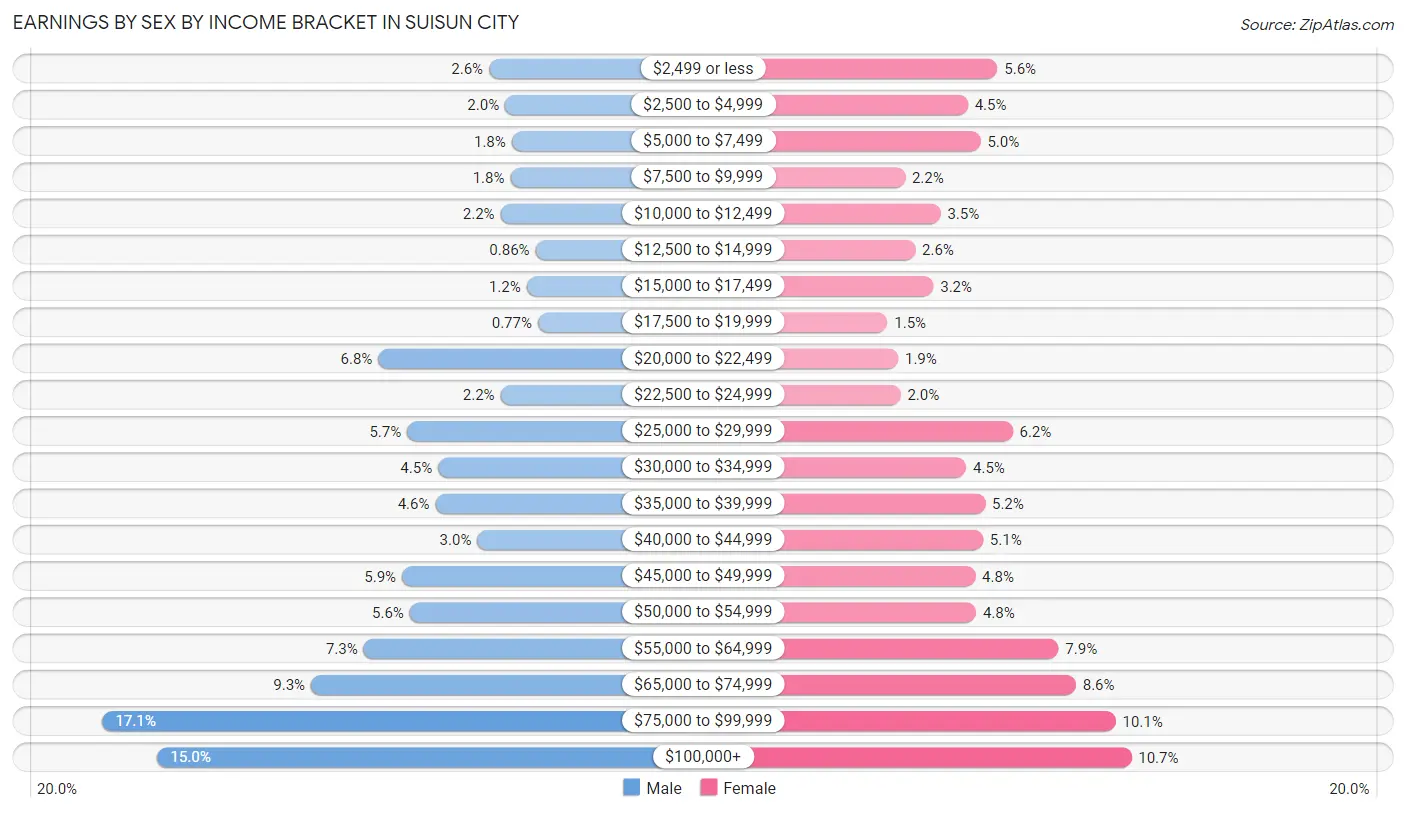
Earnings by Sex by Income Bracket in Suisun City
The most common earnings brackets in Suisun City are $75,000 to $99,999 for men (1,367 | 17.1%) and $100,000+ for women (815 | 10.7%).
| Income | Male | Female |
| $2,499 or less | 208 (2.6%) | 431 (5.6%) |
| $2,500 to $4,999 | 160 (2.0%) | 346 (4.5%) |
| $5,000 to $7,499 | 140 (1.8%) | 383 (5.0%) |
| $7,500 to $9,999 | 144 (1.8%) | 167 (2.2%) |
| $10,000 to $12,499 | 174 (2.2%) | 268 (3.5%) |
| $12,500 to $14,999 | 69 (0.9%) | 196 (2.6%) |
| $15,000 to $17,499 | 95 (1.2%) | 248 (3.2%) |
| $17,500 to $19,999 | 62 (0.8%) | 116 (1.5%) |
| $20,000 to $22,499 | 540 (6.8%) | 147 (1.9%) |
| $22,500 to $24,999 | 174 (2.2%) | 154 (2.0%) |
| $25,000 to $29,999 | 454 (5.7%) | 475 (6.2%) |
| $30,000 to $34,999 | 361 (4.5%) | 342 (4.5%) |
| $35,000 to $39,999 | 369 (4.6%) | 396 (5.2%) |
| $40,000 to $44,999 | 243 (3.0%) | 390 (5.1%) |
| $45,000 to $49,999 | 469 (5.9%) | 368 (4.8%) |
| $50,000 to $54,999 | 446 (5.6%) | 370 (4.8%) |
| $55,000 to $64,999 | 584 (7.3%) | 606 (7.9%) |
| $65,000 to $74,999 | 742 (9.3%) | 656 (8.6%) |
| $75,000 to $99,999 | 1,367 (17.1%) | 770 (10.1%) |
| $100,000+ | 1,202 (15.0%) | 815 (10.7%) |
| Total | 8,003 (100.0%) | 7,644 (100.0%) |
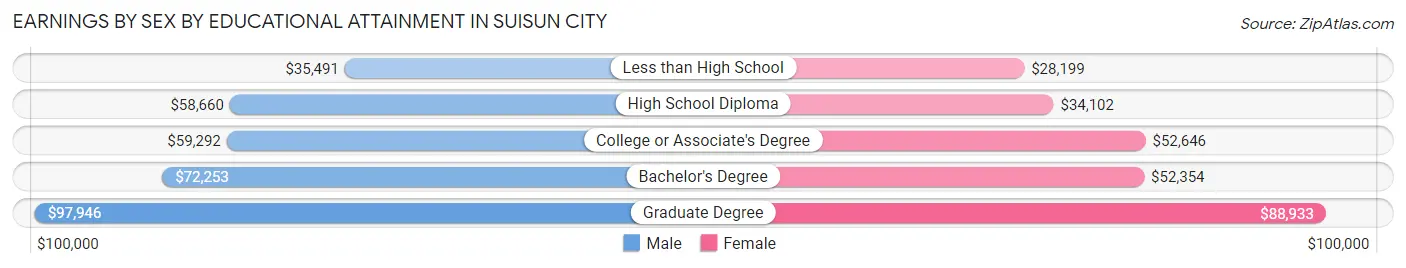
Earnings by Sex by Educational Attainment in Suisun City
Average earnings in Suisun City are $62,819 for men and $50,019 for women, a difference of 20.4%. Men with an educational attainment of graduate degree enjoy the highest average annual earnings of $97,946, while those with less than high school education earn the least with $35,491. Women with an educational attainment of graduate degree earn the most with the average annual earnings of $88,933, while those with less than high school education have the smallest earnings of $28,199.
| Educational Attainment | Male Income | Female Income |
| Less than High School | $35,491 | $28,199 |
| High School Diploma | $58,660 | $34,102 |
| College or Associate's Degree | $59,292 | $52,646 |
| Bachelor's Degree | $72,253 | $52,354 |
| Graduate Degree | $97,946 | $88,933 |
| Total | $62,819 | $50,019 |
Family Income in Suisun City
Family Income Brackets in Suisun City
According to the Suisun City family income data, there are 1,945 families falling into the $100,000 to $149,999 income range, which is the most common income bracket and makes up 27.7% of all families. Conversely, the $10,000 to $14,999 income bracket is the least frequent group with only 91 families (1.3%) belonging to this category.
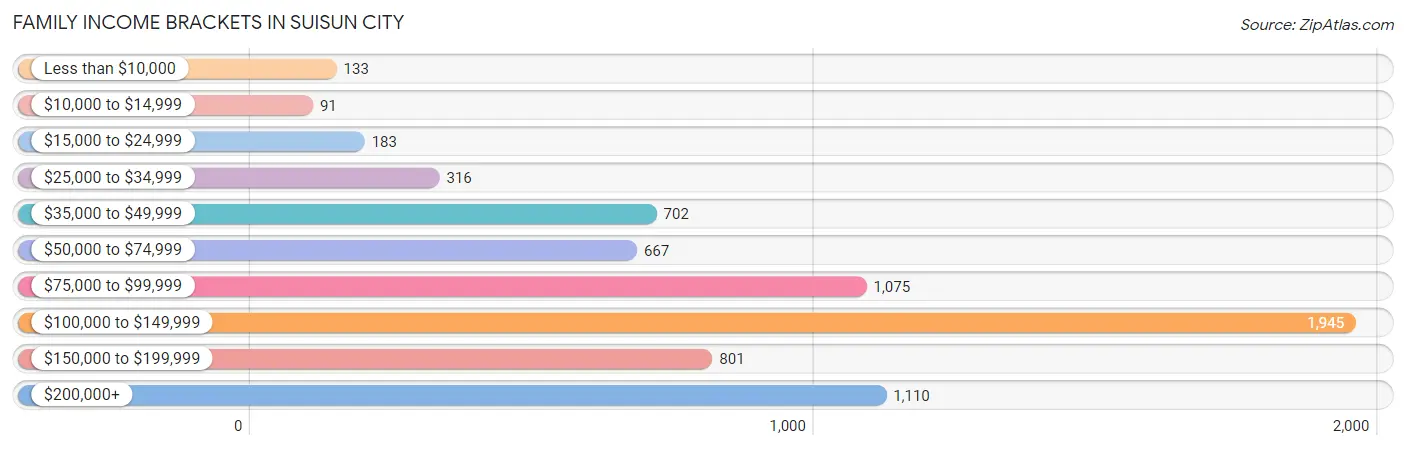
| Income Bracket | # Families | % Families |
| Less than $10,000 | 133 | 1.9% |
| $10,000 to $14,999 | 91 | 1.3% |
| $15,000 to $24,999 | 183 | 2.6% |
| $25,000 to $34,999 | 316 | 4.5% |
| $35,000 to $49,999 | 702 | 10.0% |
| $50,000 to $74,999 | 667 | 9.5% |
| $75,000 to $99,999 | 1,075 | 15.3% |
| $100,000 to $149,999 | 1,945 | 27.7% |
| $150,000 to $199,999 | 801 | 11.4% |
| $200,000+ | 1,110 | 15.8% |
Family Income by Famaliy Size in Suisun City
7+ person families (254 | 3.6%) account for the highest median family income in Suisun City with $158,611 per family, while 2-person families (2,230 | 31.8%) have the highest median income of $51,450 per family member.
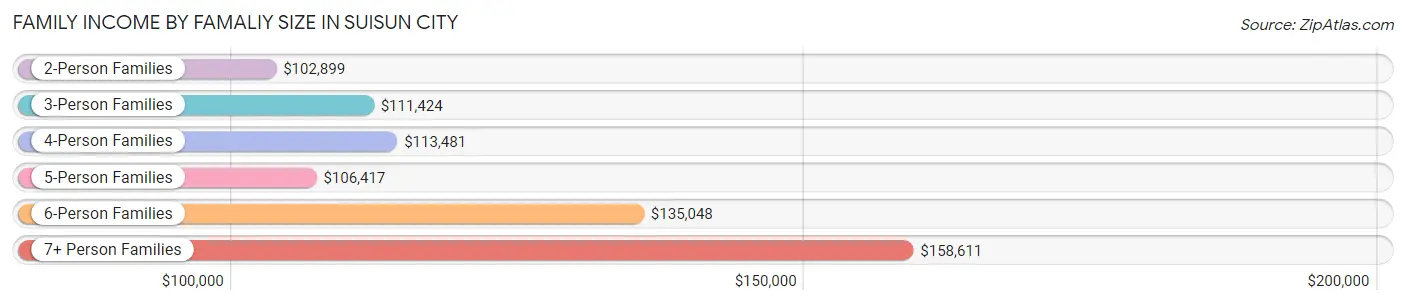
| Income Bracket | # Families | Median Income |
| 2-Person Families | 2,230 (31.8%) | $102,899 |
| 3-Person Families | 1,711 (24.4%) | $111,424 |
| 4-Person Families | 1,894 (27.0%) | $113,481 |
| 5-Person Families | 717 (10.2%) | $106,417 |
| 6-Person Families | 217 (3.1%) | $135,048 |
| 7+ Person Families | 254 (3.6%) | $158,611 |
| Total | 7,023 (100.0%) | $108,848 |
Family Income by Number of Earners in Suisun City
The median family income in Suisun City is $108,848, with families comprising 3+ earners (1,357) having the highest median family income of $150,295, while families with no earners (728) have the lowest median family income of $56,290, accounting for 19.3% and 10.4% of families, respectively.
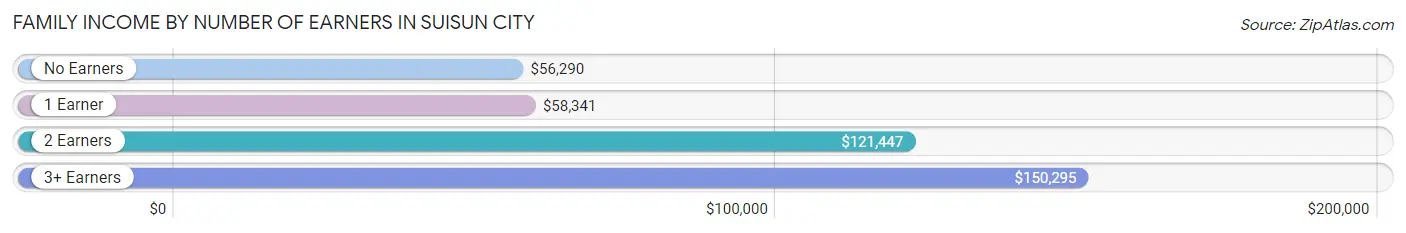
| Number of Earners | # Families | Median Income |
| No Earners | 728 (10.4%) | $56,290 |
| 1 Earner | 1,851 (26.4%) | $58,341 |
| 2 Earners | 3,087 (44.0%) | $121,447 |
| 3+ Earners | 1,357 (19.3%) | $150,295 |
| Total | 7,023 (100.0%) | $108,848 |
Household Income in Suisun City
Household Income Brackets in Suisun City
With 2,288 households falling in the category, the $100,000 to $149,999 income range is the most frequent in Suisun City, accounting for 23.7% of all households. In contrast, only 299 households (3.1%) fall into the $10,000 to $14,999 income bracket, making it the least populous group.
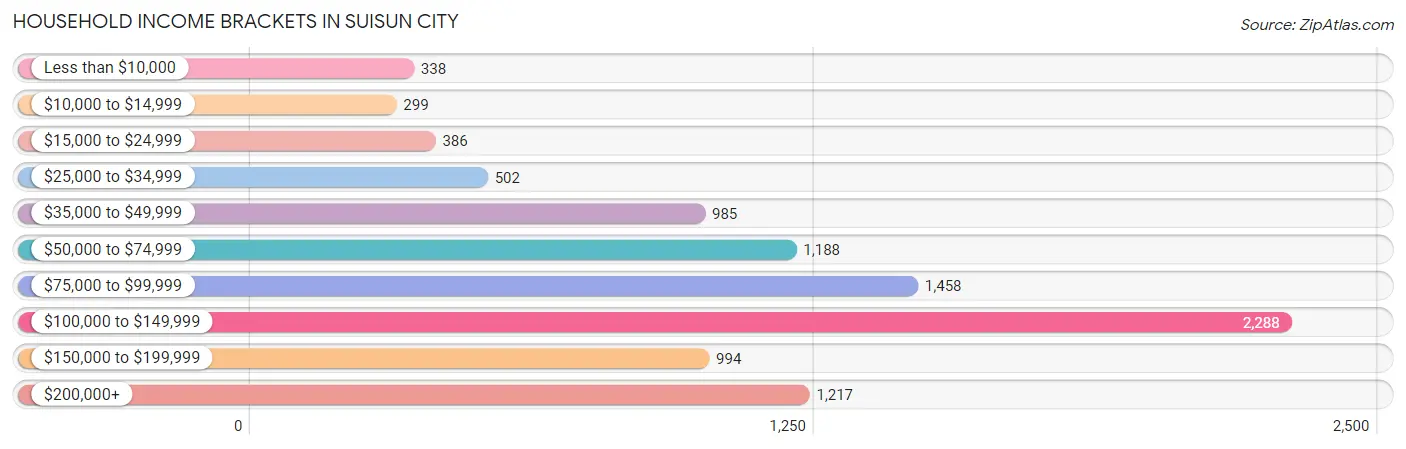
| Income Bracket | # Households | % Households |
| Less than $10,000 | 338 | 3.5% |
| $10,000 to $14,999 | 299 | 3.1% |
| $15,000 to $24,999 | 386 | 4.0% |
| $25,000 to $34,999 | 502 | 5.2% |
| $35,000 to $49,999 | 985 | 10.2% |
| $50,000 to $74,999 | 1,188 | 12.3% |
| $75,000 to $99,999 | 1,458 | 15.1% |
| $100,000 to $149,999 | 2,288 | 23.7% |
| $150,000 to $199,999 | 994 | 10.3% |
| $200,000+ | 1,217 | 12.6% |
Household Income by Householder Age in Suisun City
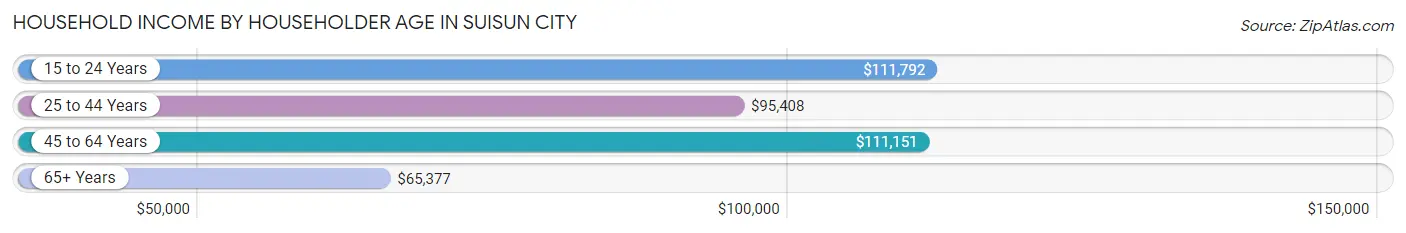
The median household income in Suisun City is $95,394, with the highest median household income of $111,792 found in the 15 to 24 years age bracket for the primary householder. A total of 117 households (1.2%) fall into this category. Meanwhile, the 65+ years age bracket for the primary householder has the lowest median household income of $65,377, with 2,017 households (20.9%) in this group.
| Income Bracket | # Households | Median Income |
| 15 to 24 Years | 117 (1.2%) | $111,792 |
| 25 to 44 Years | 3,338 (34.6%) | $95,408 |
| 45 to 64 Years | 4,183 (43.3%) | $111,151 |
| 65+ Years | 2,017 (20.9%) | $65,377 |
| Total | 9,655 (100.0%) | $95,394 |
Poverty in Suisun City
Income Below Poverty by Sex and Age in Suisun City
With 9.8% poverty level for males and 8.2% for females among the residents of Suisun City, 15 year old males and 16 and 17 year old females are the most vulnerable to poverty, with 34 males (20.7%) and 88 females (18.7%) in their respective age groups living below the poverty level.
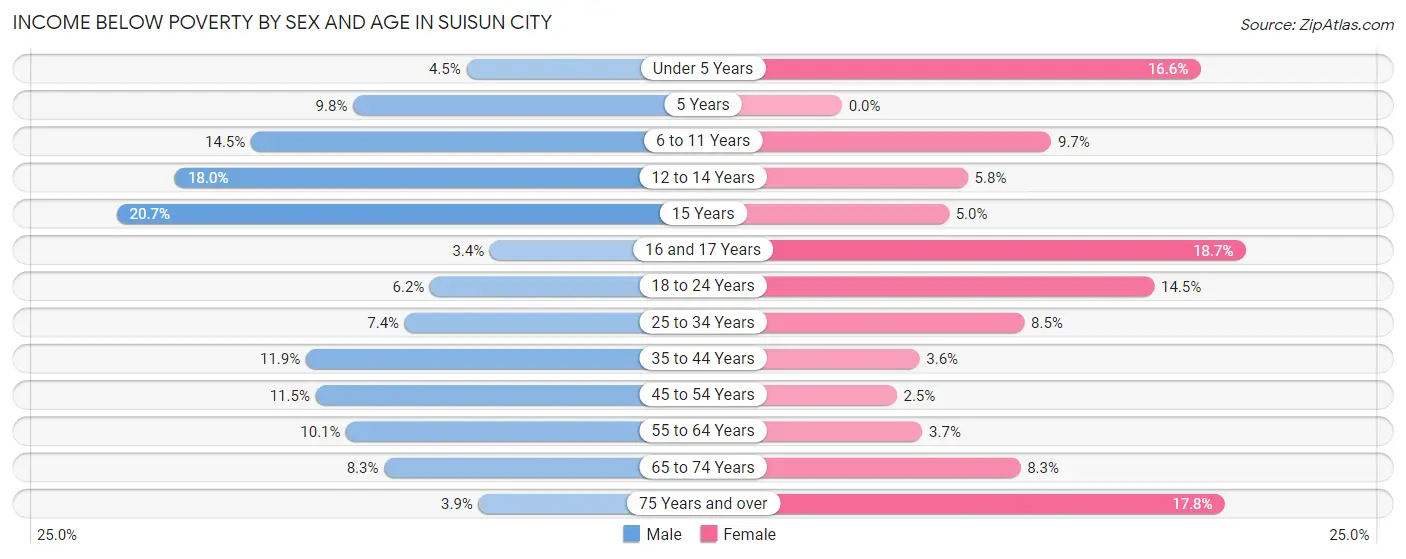
| Age Bracket | Male | Female |
| Under 5 Years | 39 (4.5%) | 117 (16.6%) |
| 5 Years | 27 (9.8%) | 0 (0.0%) |
| 6 to 11 Years | 215 (14.5%) | 100 (9.7%) |
| 12 to 14 Years | 149 (18.0%) | 30 (5.8%) |
| 15 Years | 34 (20.7%) | 7 (5.0%) |
| 16 and 17 Years | 14 (3.4%) | 88 (18.7%) |
| 18 to 24 Years | 103 (6.2%) | 193 (14.5%) |
| 25 to 34 Years | 145 (7.3%) | 183 (8.5%) |
| 35 to 44 Years | 215 (11.9%) | 72 (3.6%) |
| 45 to 54 Years | 223 (11.5%) | 46 (2.5%) |
| 55 to 64 Years | 174 (10.1%) | 71 (3.7%) |
| 65 to 74 Years | 103 (8.3%) | 110 (8.3%) |
| 75 Years and over | 21 (3.9%) | 155 (17.7%) |
| Total | 1,462 (9.8%) | 1,172 (8.2%) |
Income Above Poverty by Sex and Age in Suisun City
According to the poverty statistics in Suisun City, males aged 16 and 17 years and females aged 5 years are the age groups that are most secure financially, with 96.6% of males and 100.0% of females in these age groups living above the poverty line.
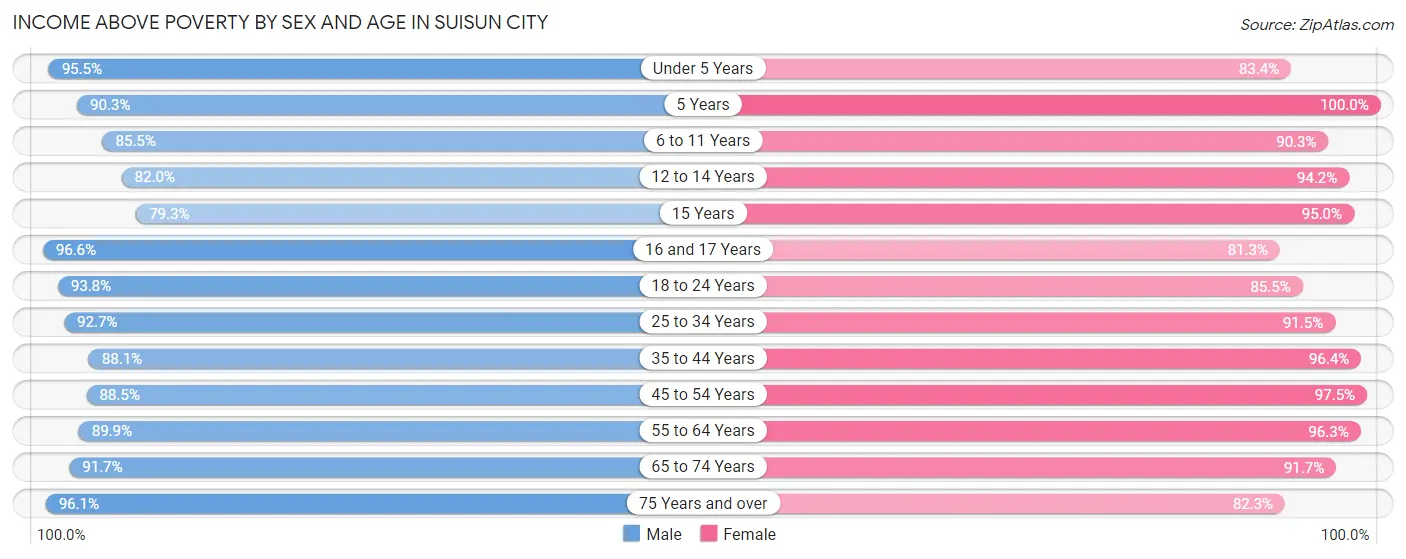
| Age Bracket | Male | Female |
| Under 5 Years | 830 (95.5%) | 587 (83.4%) |
| 5 Years | 250 (90.2%) | 61 (100.0%) |
| 6 to 11 Years | 1,269 (85.5%) | 930 (90.3%) |
| 12 to 14 Years | 678 (82.0%) | 484 (94.2%) |
| 15 Years | 130 (79.3%) | 134 (95.0%) |
| 16 and 17 Years | 398 (96.6%) | 382 (81.3%) |
| 18 to 24 Years | 1,564 (93.8%) | 1,139 (85.5%) |
| 25 to 34 Years | 1,828 (92.6%) | 1,981 (91.5%) |
| 35 to 44 Years | 1,585 (88.1%) | 1,928 (96.4%) |
| 45 to 54 Years | 1,717 (88.5%) | 1,768 (97.5%) |
| 55 to 64 Years | 1,554 (89.9%) | 1,831 (96.3%) |
| 65 to 74 Years | 1,136 (91.7%) | 1,218 (91.7%) |
| 75 Years and over | 514 (96.1%) | 718 (82.3%) |
| Total | 13,453 (90.2%) | 13,161 (91.8%) |
Income Below Poverty Among Married-Couple Families in Suisun City
The poverty statistics for married-couple families in Suisun City show that 1.7% or 82 of the total 4,851 families live below the poverty line. Families with 1 or 2 children have the highest poverty rate of 2.1%, comprising of 36 families. On the other hand, families with 3 or 4 children have the lowest poverty rate of 0.0%, which includes 0 families.
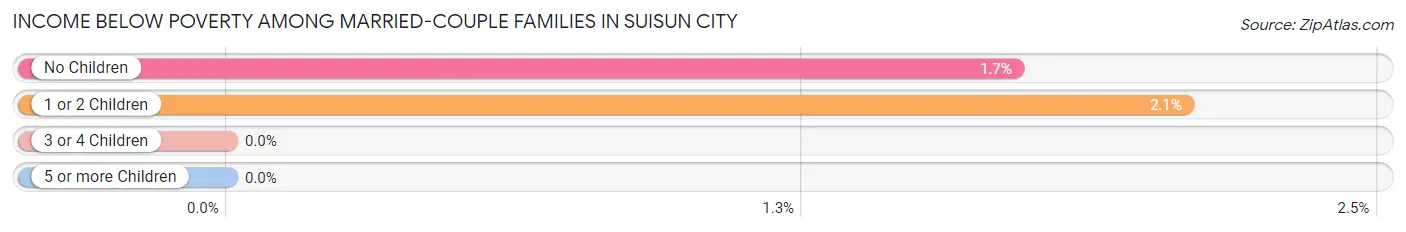
| Children | Above Poverty | Below Poverty |
| No Children | 2,651 (98.3%) | 46 (1.7%) |
| 1 or 2 Children | 1,695 (97.9%) | 36 (2.1%) |
| 3 or 4 Children | 363 (100.0%) | 0 (0.0%) |
| 5 or more Children | 60 (100.0%) | 0 (0.0%) |
| Total | 4,769 (98.3%) | 82 (1.7%) |
Income Below Poverty Among Single-Parent Households in Suisun City
According to the poverty data in Suisun City, 35.4% or 243 single-father households and 9.0% or 133 single-mother households are living below the poverty line. Among single-father households, those with 3 or 4 children have the highest poverty rate, with 145 households (100.0%) experiencing poverty. Likewise, among single-mother households, those with 3 or 4 children have the highest poverty rate, with 42 households (21.1%) falling below the poverty line.
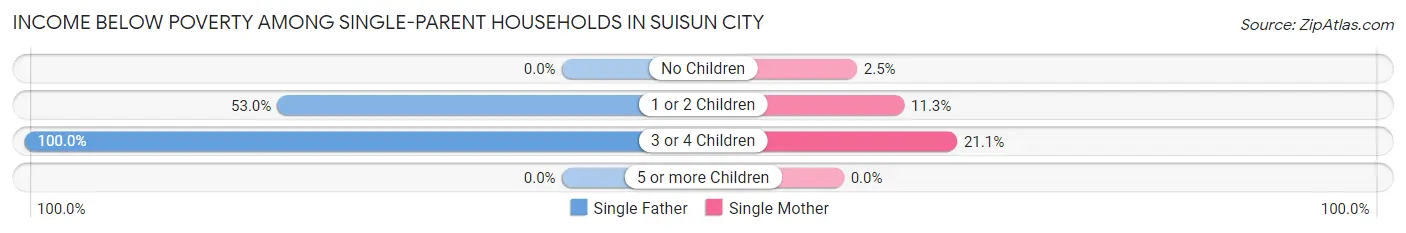
| Children | Single Father | Single Mother |
| No Children | 0 (0.0%) | 15 (2.5%) |
| 1 or 2 Children | 98 (53.0%) | 76 (11.3%) |
| 3 or 4 Children | 145 (100.0%) | 42 (21.1%) |
| 5 or more Children | 0 (0.0%) | 0 (0.0%) |
| Total | 243 (35.4%) | 133 (9.0%) |
Income Below Poverty Among Married-Couple vs Single-Parent Households in Suisun City
The poverty data for Suisun City shows that 82 of the married-couple family households (1.7%) and 376 of the single-parent households (17.3%) are living below the poverty level. Within the married-couple family households, those with 1 or 2 children have the highest poverty rate, with 36 households (2.1%) falling below the poverty line. Among the single-parent households, those with 3 or 4 children have the highest poverty rate, with 187 household (54.4%) living below poverty.
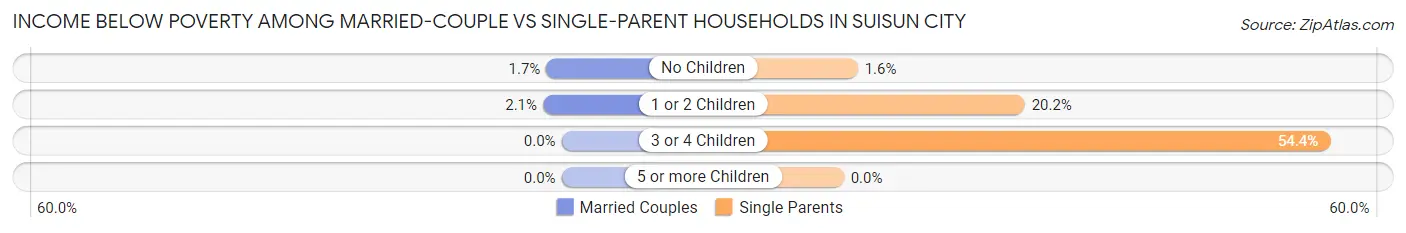
| Children | Married-Couple Families | Single-Parent Households |
| No Children | 46 (1.7%) | 15 (1.6%) |
| 1 or 2 Children | 36 (2.1%) | 174 (20.2%) |
| 3 or 4 Children | 0 (0.0%) | 187 (54.4%) |
| 5 or more Children | 0 (0.0%) | 0 (0.0%) |
| Total | 82 (1.7%) | 376 (17.3%) |
Race in Suisun City
The most populous races in Suisun City are White / Caucasian (9,436 | 32.2%), Hispanic or Latino (8,851 | 30.2%), and Black / African American (6,473 | 22.1%).
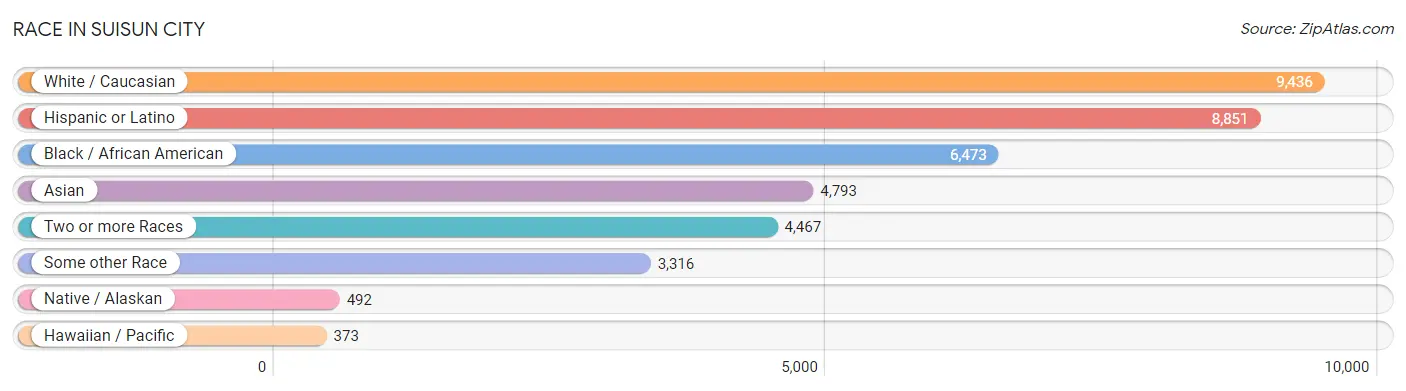
| Race | # Population | % Population |
| Asian | 4,793 | 16.3% |
| Black / African American | 6,473 | 22.1% |
| Hawaiian / Pacific | 373 | 1.3% |
| Hispanic or Latino | 8,851 | 30.2% |
| Native / Alaskan | 492 | 1.7% |
| White / Caucasian | 9,436 | 32.2% |
| Two or more Races | 4,467 | 15.2% |
| Some other Race | 3,316 | 11.3% |
| Total | 29,350 | 100.0% |
Ancestry in Suisun City
The most populous ancestries reported in Suisun City are Mexican (6,800 | 23.2%), Korean (4,801 | 16.4%), German (1,576 | 5.4%), European (1,423 | 4.9%), and Irish (1,355 | 4.6%), together accounting for 54.4% of all Suisun City residents.
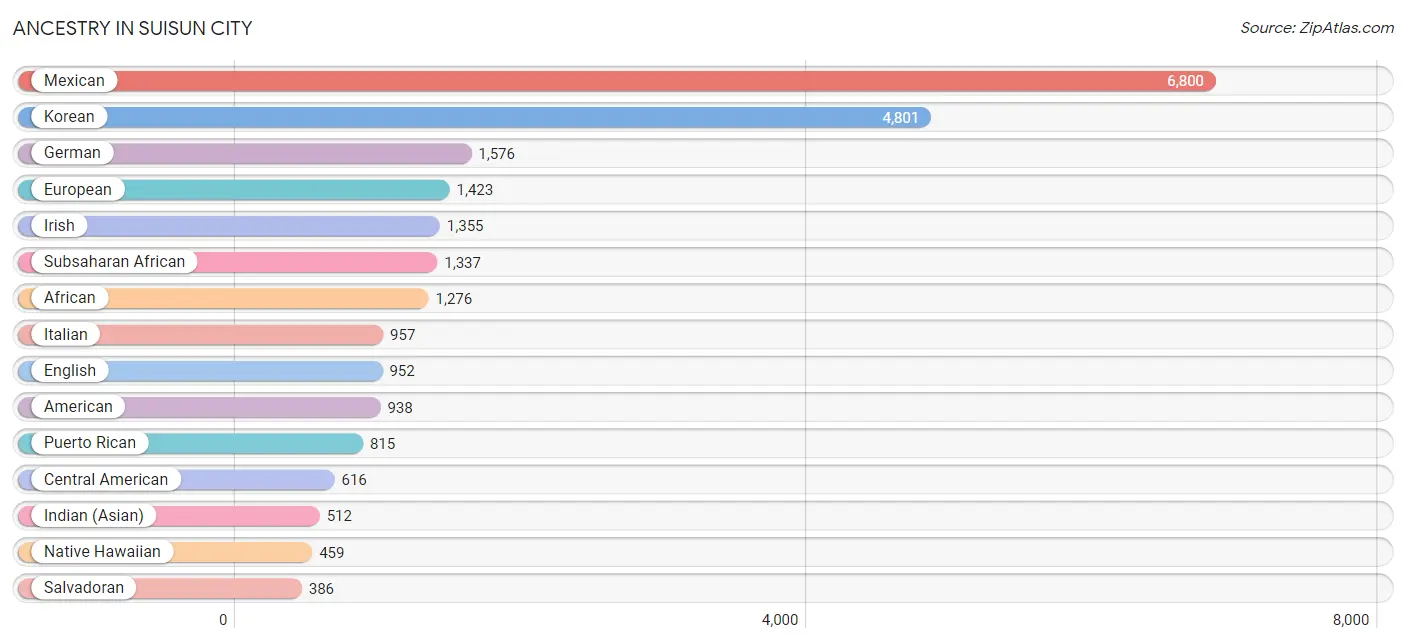
| Ancestry | # Population | % Population |
| African | 1,276 | 4.3% |
| American | 938 | 3.2% |
| Arab | 123 | 0.4% |
| Armenian | 8 | 0.0% |
| Assyrian / Chaldean / Syriac | 16 | 0.1% |
| Bangladeshi | 48 | 0.2% |
| Basque | 2 | 0.0% |
| Bhutanese | 262 | 0.9% |
| Blackfeet | 79 | 0.3% |
| Bolivian | 33 | 0.1% |
| British | 88 | 0.3% |
| Burmese | 223 | 0.8% |
| Canadian | 15 | 0.1% |
| Central American | 616 | 2.1% |
| Central American Indian | 53 | 0.2% |
| Cherokee | 192 | 0.6% |
| Chickasaw | 82 | 0.3% |
| Chilean | 27 | 0.1% |
| Chinese | 7 | 0.0% |
| Chippewa | 54 | 0.2% |
| Choctaw | 23 | 0.1% |
| Colombian | 35 | 0.1% |
| Czech | 44 | 0.2% |
| Czechoslovakian | 5 | 0.0% |
| Danish | 27 | 0.1% |
| Dutch | 217 | 0.7% |
| Eastern European | 12 | 0.0% |
| English | 952 | 3.2% |
| Ethiopian | 16 | 0.1% |
| European | 1,423 | 4.9% |
| Finnish | 11 | 0.0% |
| French | 175 | 0.6% |
| French Canadian | 49 | 0.2% |
| German | 1,576 | 5.4% |
| Greek | 35 | 0.1% |
| Guamanian / Chamorro | 220 | 0.7% |
| Guatemalan | 89 | 0.3% |
| Haitian | 1 | 0.0% |
| Indian (Asian) | 512 | 1.7% |
| Iranian | 10 | 0.0% |
| Irish | 1,355 | 4.6% |
| Israeli | 13 | 0.0% |
| Italian | 957 | 3.3% |
| Jamaican | 33 | 0.1% |
| Japanese | 60 | 0.2% |
| Korean | 4,801 | 16.4% |
| Lebanese | 7 | 0.0% |
| Lithuanian | 59 | 0.2% |
| Malaysian | 83 | 0.3% |
| Mexican | 6,800 | 23.2% |
| Mexican American Indian | 297 | 1.0% |
| Native Hawaiian | 459 | 1.6% |
| Nepalese | 75 | 0.3% |
| Nicaraguan | 111 | 0.4% |
| Nigerian | 33 | 0.1% |
| Northern European | 84 | 0.3% |
| Norwegian | 86 | 0.3% |
| Pakistani | 37 | 0.1% |
| Palestinian | 86 | 0.3% |
| Panamanian | 30 | 0.1% |
| Peruvian | 85 | 0.3% |
| Polish | 175 | 0.6% |
| Portuguese | 232 | 0.8% |
| Pueblo | 217 | 0.7% |
| Puerto Rican | 815 | 2.8% |
| Russian | 104 | 0.4% |
| Salvadoran | 386 | 1.3% |
| Samoan | 108 | 0.4% |
| Scandinavian | 25 | 0.1% |
| Scotch-Irish | 169 | 0.6% |
| Scottish | 93 | 0.3% |
| Slovak | 36 | 0.1% |
| South American | 218 | 0.7% |
| Spaniard | 192 | 0.6% |
| Spanish | 36 | 0.1% |
| Sri Lankan | 317 | 1.1% |
| Subsaharan African | 1,337 | 4.6% |
| Sudanese | 12 | 0.0% |
| Swedish | 119 | 0.4% |
| Swiss | 18 | 0.1% |
| Syrian | 24 | 0.1% |
| Thai | 122 | 0.4% |
| Trinidadian and Tobagonian | 23 | 0.1% |
| Ukrainian | 14 | 0.1% |
| Uruguayan | 9 | 0.0% |
| Venezuelan | 29 | 0.1% |
| West Indian | 47 | 0.2% | View All 87 Rows |
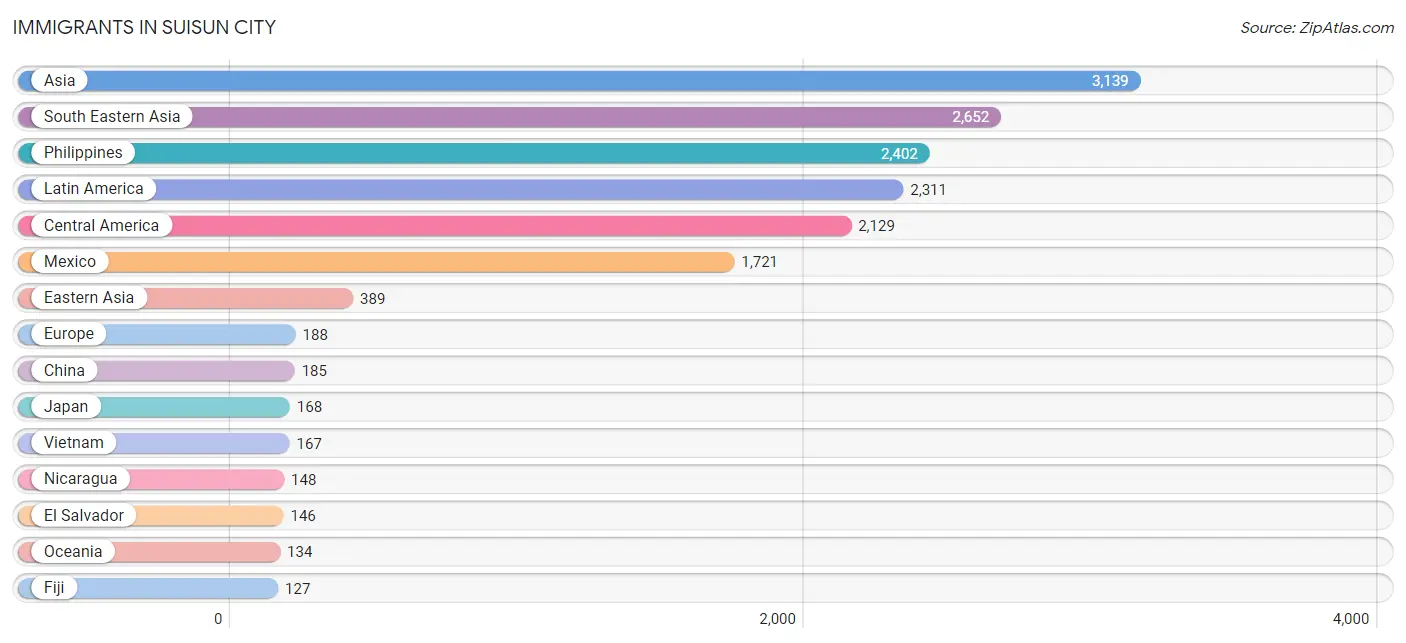
Immigrants in Suisun City
The most numerous immigrant groups reported in Suisun City came from Asia (3,139 | 10.7%), South Eastern Asia (2,652 | 9.0%), Philippines (2,402 | 8.2%), Latin America (2,311 | 7.9%), and Central America (2,129 | 7.2%), together accounting for 43.0% of all Suisun City residents.
| Immigration Origin | # Population | % Population |
| Africa | 30 | 0.1% |
| Asia | 3,139 | 10.7% |
| Bolivia | 35 | 0.1% |
| Brazil | 25 | 0.1% |
| Cambodia | 19 | 0.1% |
| Canada | 19 | 0.1% |
| Caribbean | 64 | 0.2% |
| Central America | 2,129 | 7.2% |
| Chile | 6 | 0.0% |
| China | 185 | 0.6% |
| Colombia | 35 | 0.1% |
| Costa Rica | 48 | 0.2% |
| Czechoslovakia | 11 | 0.0% |
| Eastern Asia | 389 | 1.3% |
| Eastern Europe | 77 | 0.3% |
| Egypt | 12 | 0.0% |
| El Salvador | 146 | 0.5% |
| England | 6 | 0.0% |
| Europe | 188 | 0.6% |
| Fiji | 127 | 0.4% |
| Germany | 81 | 0.3% |
| Guatemala | 36 | 0.1% |
| Hong Kong | 92 | 0.3% |
| India | 64 | 0.2% |
| Iran | 10 | 0.0% |
| Israel | 13 | 0.0% |
| Jamaica | 33 | 0.1% |
| Japan | 168 | 0.6% |
| Korea | 36 | 0.1% |
| Laos | 24 | 0.1% |
| Latin America | 2,311 | 7.9% |
| Lithuania | 42 | 0.1% |
| Mexico | 1,721 | 5.9% |
| Nicaragua | 148 | 0.5% |
| Nigeria | 7 | 0.0% |
| Northern Africa | 23 | 0.1% |
| Northern Europe | 14 | 0.1% |
| Oceania | 134 | 0.5% |
| Panama | 30 | 0.1% |
| Peru | 8 | 0.0% |
| Philippines | 2,402 | 8.2% |
| Portugal | 16 | 0.1% |
| Russia | 24 | 0.1% |
| South America | 118 | 0.4% |
| South Central Asia | 74 | 0.3% |
| South Eastern Asia | 2,652 | 9.0% |
| Southern Europe | 16 | 0.1% |
| Sudan | 11 | 0.0% |
| Taiwan | 35 | 0.1% |
| Thailand | 40 | 0.1% |
| Uruguay | 9 | 0.0% |
| Vietnam | 167 | 0.6% |
| West Indies | 31 | 0.1% |
| Western Africa | 7 | 0.0% |
| Western Asia | 24 | 0.1% |
| Western Europe | 81 | 0.3% | View All 56 Rows |
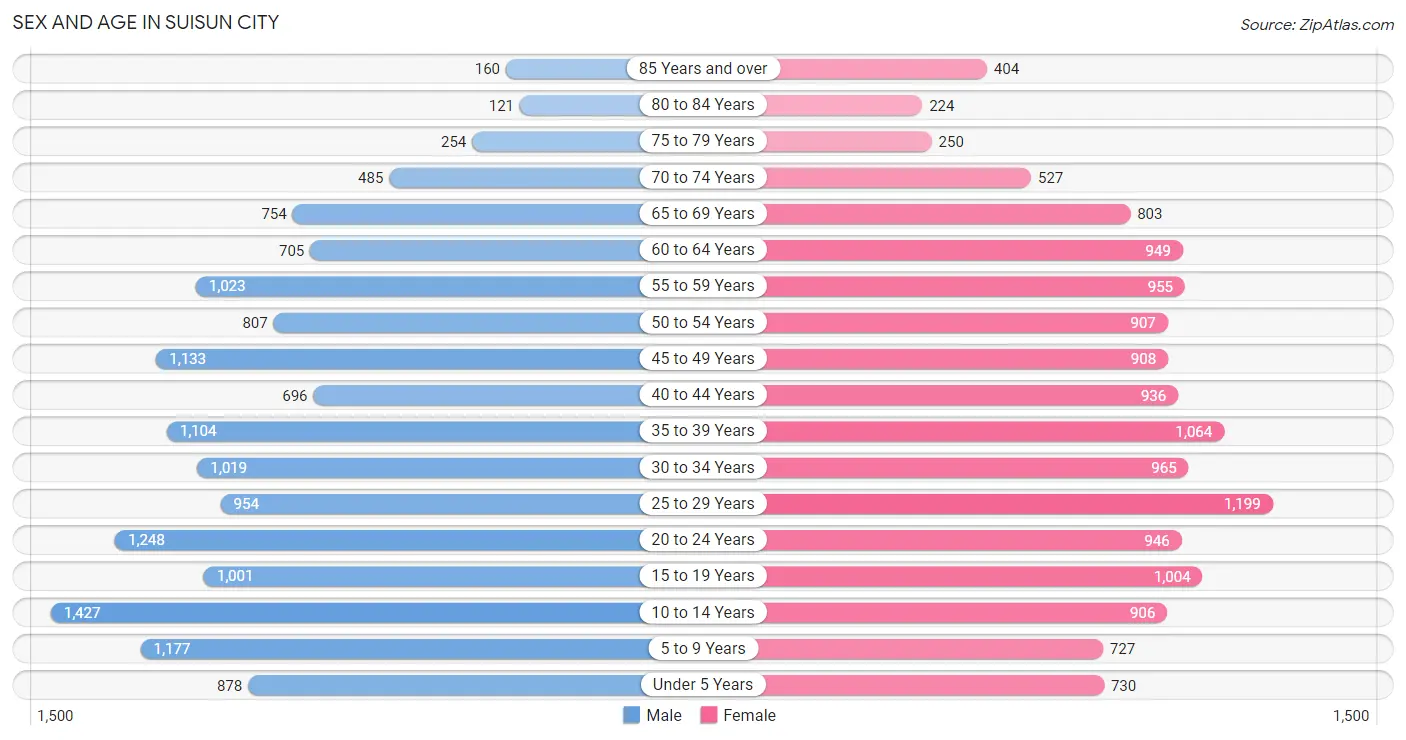
Sex and Age in Suisun City
Sex and Age in Suisun City
The most populous age groups in Suisun City are 10 to 14 Years (1,427 | 9.6%) for men and 25 to 29 Years (1,199 | 8.3%) for women.
| Age Bracket | Male | Female |
| Under 5 Years | 878 (5.9%) | 730 (5.1%) |
| 5 to 9 Years | 1,177 (7.9%) | 727 (5.1%) |
| 10 to 14 Years | 1,427 (9.6%) | 906 (6.3%) |
| 15 to 19 Years | 1,001 (6.7%) | 1,004 (7.0%) |
| 20 to 24 Years | 1,248 (8.4%) | 946 (6.6%) |
| 25 to 29 Years | 954 (6.4%) | 1,199 (8.3%) |
| 30 to 34 Years | 1,019 (6.8%) | 965 (6.7%) |
| 35 to 39 Years | 1,104 (7.4%) | 1,064 (7.4%) |
| 40 to 44 Years | 696 (4.7%) | 936 (6.5%) |
| 45 to 49 Years | 1,133 (7.6%) | 908 (6.3%) |
| 50 to 54 Years | 807 (5.4%) | 907 (6.3%) |
| 55 to 59 Years | 1,023 (6.8%) | 955 (6.6%) |
| 60 to 64 Years | 705 (4.7%) | 949 (6.6%) |
| 65 to 69 Years | 754 (5.0%) | 803 (5.6%) |
| 70 to 74 Years | 485 (3.3%) | 527 (3.7%) |
| 75 to 79 Years | 254 (1.7%) | 250 (1.7%) |
| 80 to 84 Years | 121 (0.8%) | 224 (1.6%) |
| 85 Years and over | 160 (1.1%) | 404 (2.8%) |
| Total | 14,946 (100.0%) | 14,404 (100.0%) |
Families and Households in Suisun City
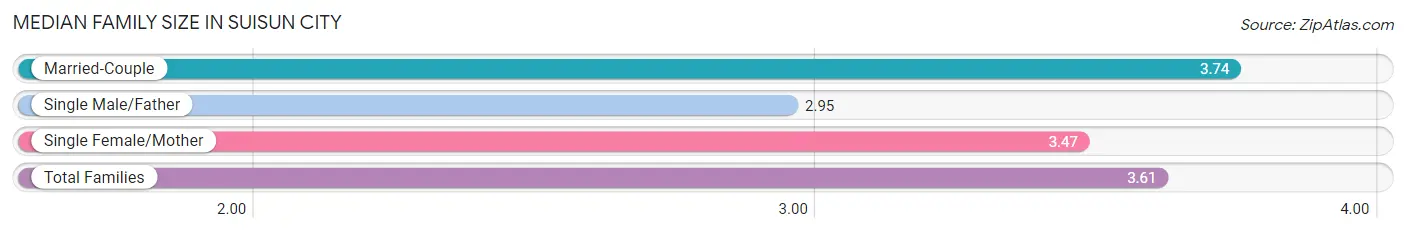
Median Family Size in Suisun City
The median family size in Suisun City is 3.61 persons per family, with married-couple families (4,851 | 69.1%) accounting for the largest median family size of 3.74 persons per family. On the other hand, single male/father families (687 | 9.8%) represent the smallest median family size with 2.95 persons per family.
| Family Type | # Families | Family Size |
| Married-Couple | 4,851 (69.1%) | 3.74 |
| Single Male/Father | 687 (9.8%) | 2.95 |
| Single Female/Mother | 1,485 (21.1%) | 3.47 |
| Total Families | 7,023 (100.0%) | 3.61 |
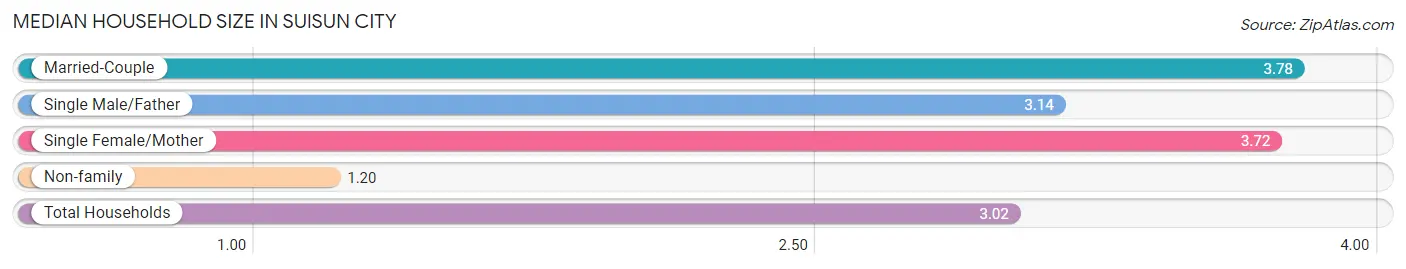
Median Household Size in Suisun City
The median household size in Suisun City is 3.02 persons per household, with married-couple households (4,851 | 50.2%) accounting for the largest median household size of 3.78 persons per household. non-family households (2,632 | 27.3%) represent the smallest median household size with 1.20 persons per household.
| Household Type | # Households | Household Size |
| Married-Couple | 4,851 (50.2%) | 3.78 |
| Single Male/Father | 687 (7.1%) | 3.14 |
| Single Female/Mother | 1,485 (15.4%) | 3.72 |
| Non-family | 2,632 (27.3%) | 1.20 |
| Total Households | 9,655 (100.0%) | 3.02 |
Household Size by Marriage Status in Suisun City
Out of a total of 9,655 households in Suisun City, 7,023 (72.7%) are family households, while 2,632 (27.3%) are nonfamily households. The most numerous type of family households are 2-person households, comprising 2,092, and the most common type of nonfamily households are 1-person households, comprising 2,237.
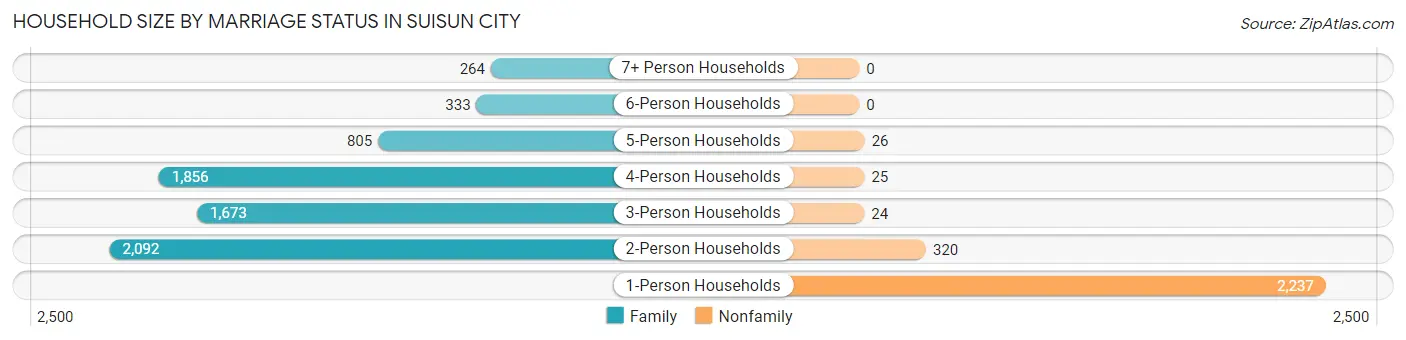
| Household Size | Family Households | Nonfamily Households |
| 1-Person Households | - | 2,237 (23.2%) |
| 2-Person Households | 2,092 (21.7%) | 320 (3.3%) |
| 3-Person Households | 1,673 (17.3%) | 24 (0.3%) |
| 4-Person Households | 1,856 (19.2%) | 25 (0.3%) |
| 5-Person Households | 805 (8.3%) | 26 (0.3%) |
| 6-Person Households | 333 (3.5%) | 0 (0.0%) |
| 7+ Person Households | 264 (2.7%) | 0 (0.0%) |
| Total | 7,023 (72.7%) | 2,632 (27.3%) |
Female Fertility in Suisun City
Fertility by Age in Suisun City
Average fertility rate in Suisun City is 39.0 births per 1,000 women. Women in the age bracket of 20 to 34 years have the highest fertility rate with 59.0 births per 1,000 women. Women in the age bracket of 20 to 34 years acount for 65.2% of all women with births.
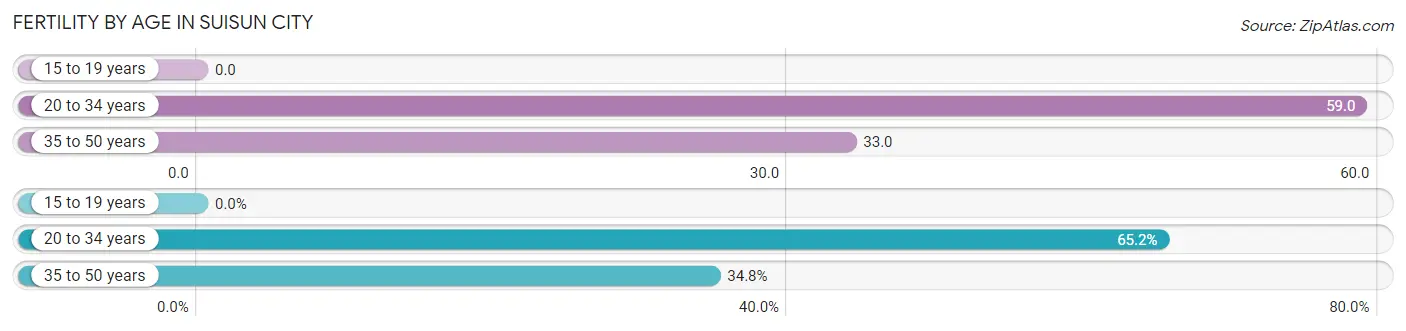
| Age Bracket | Women with Births | Births / 1,000 Women |
| 15 to 19 years | 0 (0.0%) | 0.0 |
| 20 to 34 years | 182 (65.2%) | 59.0 |
| 35 to 50 years | 97 (34.8%) | 33.0 |
| Total | 279 (100.0%) | 39.0 |
Fertility by Age by Marriage Status in Suisun City
58.1% of women with births (279) in Suisun City are married. The highest percentage of unmarried women with births falls into 35 to 50 years age bracket with 69.1% of them unmarried at the time of birth, while the lowest percentage of unmarried women with births belong to 20 to 34 years age bracket with 27.5% of them unmarried.
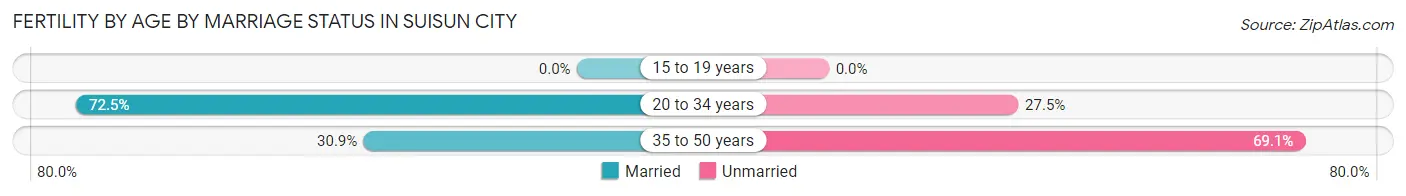
| Age Bracket | Married | Unmarried |
| 15 to 19 years | 0 (0.0%) | 0 (0.0%) |
| 20 to 34 years | 132 (72.5%) | 50 (27.5%) |
| 35 to 50 years | 30 (30.9%) | 67 (69.1%) |
| Total | 162 (58.1%) | 117 (41.9%) |
Fertility by Education in Suisun City
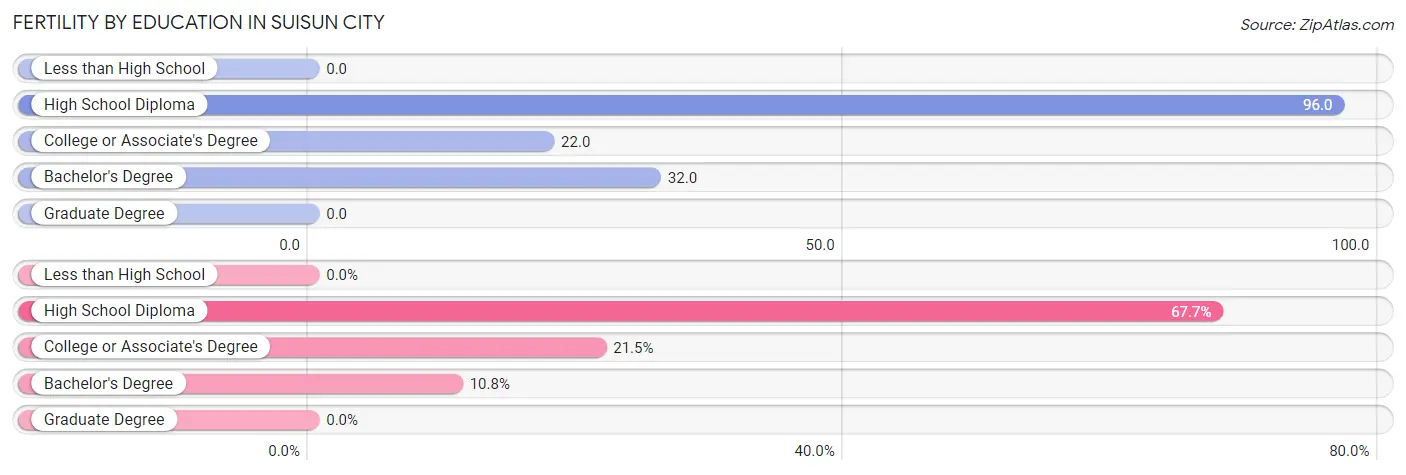
| Educational Attainment | Women with Births | Births / 1,000 Women |
| Less than High School | 0 (0.0%) | 0.0 |
| High School Diploma | 189 (67.7%) | 96.0 |
| College or Associate's Degree | 60 (21.5%) | 22.0 |
| Bachelor's Degree | 30 (10.7%) | 32.0 |
| Graduate Degree | 0 (0.0%) | 0.0 |
| Total | 279 (100.0%) | 39.0 |
Fertility by Education by Marriage Status in Suisun City
41.9% of women with births in Suisun City are unmarried. Women with the educational attainment of bachelor's degree are most likely to be married with 100.0% of them married at childbirth, while women with the educational attainment of high school diploma are least likely to be married with 50.3% of them unmarried at childbirth.
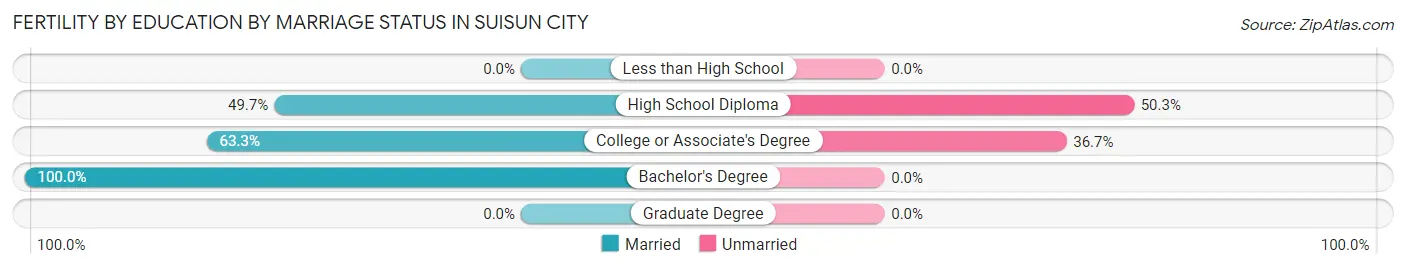
| Educational Attainment | Married | Unmarried |
| Less than High School | 0 (0.0%) | 0 (0.0%) |
| High School Diploma | 94 (49.7%) | 95 (50.3%) |
| College or Associate's Degree | 38 (63.3%) | 22 (36.7%) |
| Bachelor's Degree | 30 (100.0%) | 0 (0.0%) |
| Graduate Degree | 0 (0.0%) | 0 (0.0%) |
| Total | 162 (58.1%) | 117 (41.9%) |
Employment Characteristics in Suisun City
Employment by Class of Employer in Suisun City
Among the 13,932 employed individuals in Suisun City, private company employees (9,287 | 66.7%), local government employees (1,918 | 13.8%), and not-for-profit organizations (842 | 6.0%) make up the most common classes of employment.
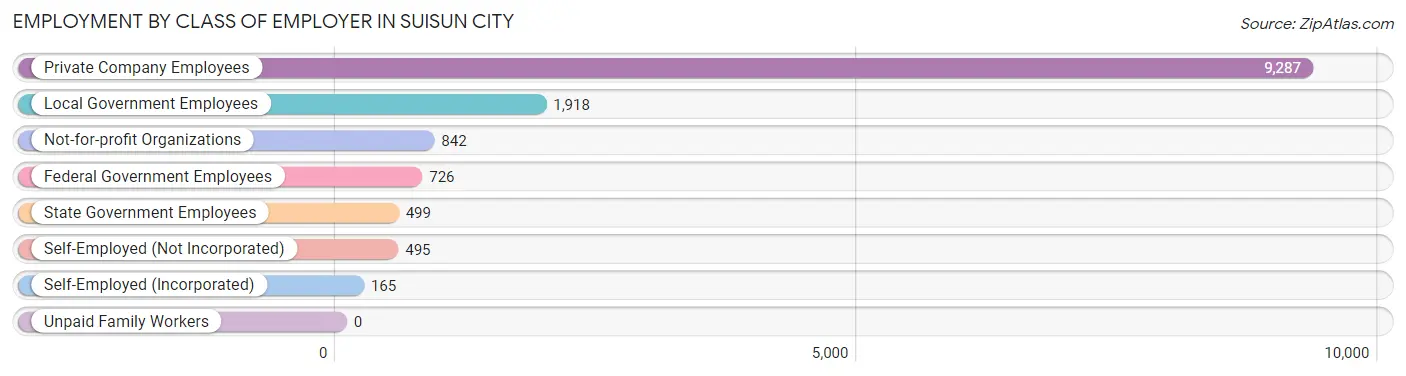
| Employer Class | # Employees | % Employees |
| Private Company Employees | 9,287 | 66.7% |
| Self-Employed (Incorporated) | 165 | 1.2% |
| Self-Employed (Not Incorporated) | 495 | 3.5% |
| Not-for-profit Organizations | 842 | 6.0% |
| Local Government Employees | 1,918 | 13.8% |
| State Government Employees | 499 | 3.6% |
| Federal Government Employees | 726 | 5.2% |
| Unpaid Family Workers | 0 | 0.0% |
| Total | 13,932 | 100.0% |
Employment Status by Age in Suisun City
According to the labor force statistics for Suisun City, out of the total population over 16 years of age (23,200), 66.9% or 15,521 individuals are in the labor force, with 6.9% or 1,071 of them unemployed. The age group with the highest labor force participation rate is 45 to 54 years, with 86.7% or 3,256 individuals in the labor force. Within the labor force, the 16 to 19 years age range has the highest percentage of unemployed individuals, with 19.0% or 140 of them being unemployed.
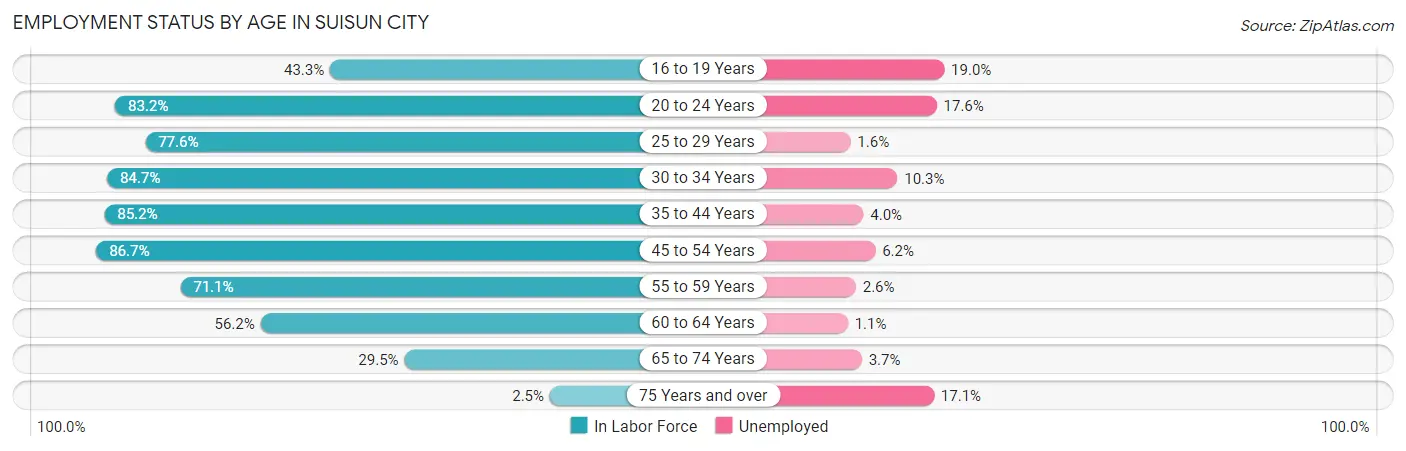
| Age Bracket | In Labor Force | Unemployed |
| 16 to 19 Years | 736 (43.3%) | 140 (19.0%) |
| 20 to 24 Years | 1,825 (83.2%) | 321 (17.6%) |
| 25 to 29 Years | 1,671 (77.6%) | 27 (1.6%) |
| 30 to 34 Years | 1,680 (84.7%) | 173 (10.3%) |
| 35 to 44 Years | 3,238 (85.2%) | 130 (4.0%) |
| 45 to 54 Years | 3,256 (86.7%) | 202 (6.2%) |
| 55 to 59 Years | 1,406 (71.1%) | 37 (2.6%) |
| 60 to 64 Years | 930 (56.2%) | 10 (1.1%) |
| 65 to 74 Years | 758 (29.5%) | 28 (3.7%) |
| 75 Years and over | 35 (2.5%) | 6 (17.1%) |
| Total | 15,521 (66.9%) | 1,071 (6.9%) |
Employment Status by Educational Attainment in Suisun City
According to labor force statistics for Suisun City, 79.5% of individuals (12,183) out of the total population between 25 and 64 years of age (15,324) are in the labor force, with 4.7% or 573 of them being unemployed. The group with the highest labor force participation rate are those with the educational attainment of bachelor's degree or higher, with 92.3% or 3,030 individuals in the labor force. Within the labor force, individuals with less than high school education have the highest percentage of unemployment, with 7.7% or 81 of them being unemployed.
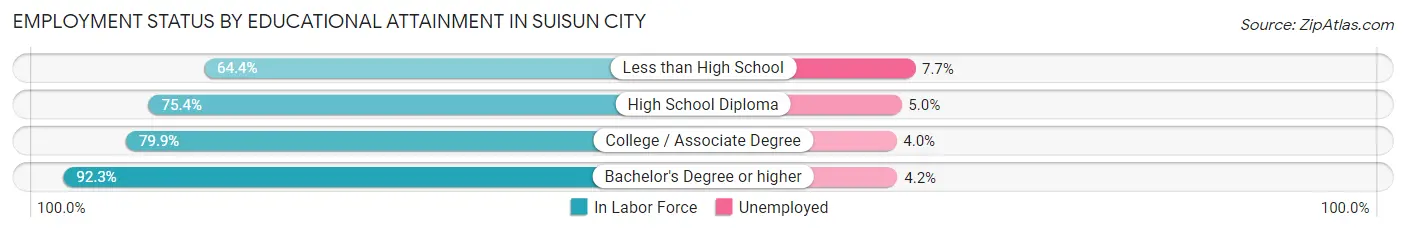
| Educational Attainment | In Labor Force | Unemployed |
| Less than High School | 1,057 (64.4%) | 126 (7.7%) |
| High School Diploma | 3,594 (75.4%) | 238 (5.0%) |
| College / Associate Degree | 4,501 (79.9%) | 225 (4.0%) |
| Bachelor's Degree or higher | 3,030 (92.3%) | 138 (4.2%) |
| Total | 12,183 (79.5%) | 720 (4.7%) |
Employment Occupations by Sex in Suisun City
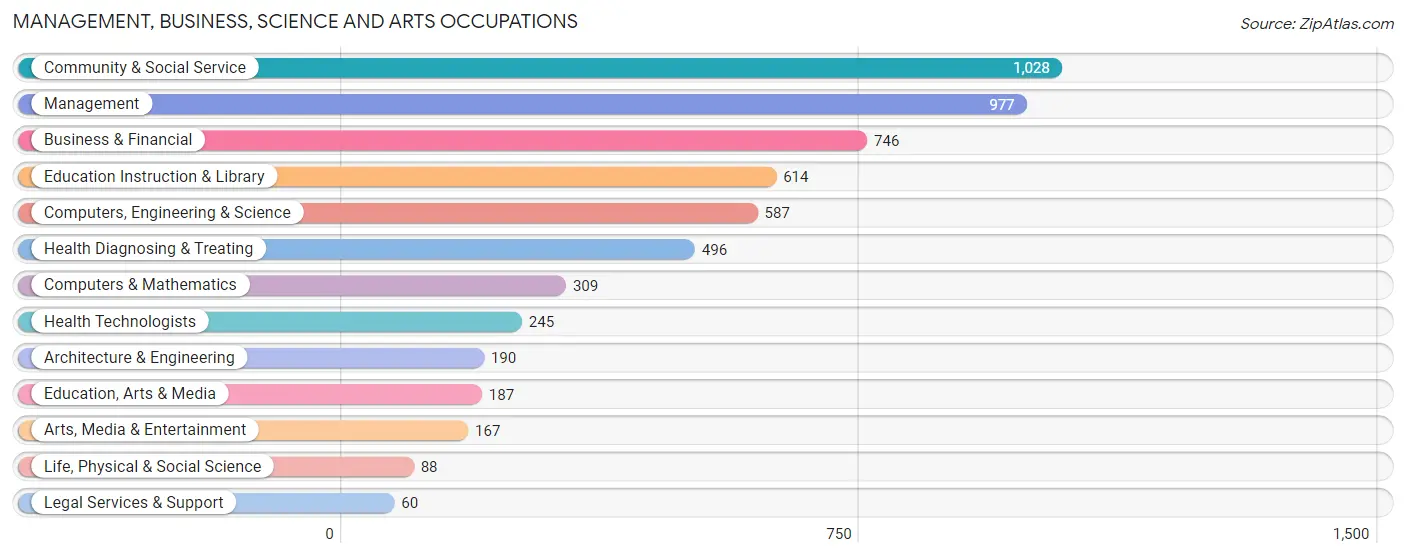
Management, Business, Science and Arts Occupations
The most common Management, Business, Science and Arts occupations in Suisun City are Community & Social Service (1,028 | 7.2%), Management (977 | 6.9%), Business & Financial (746 | 5.3%), Education Instruction & Library (614 | 4.3%), and Computers, Engineering & Science (587 | 4.1%).
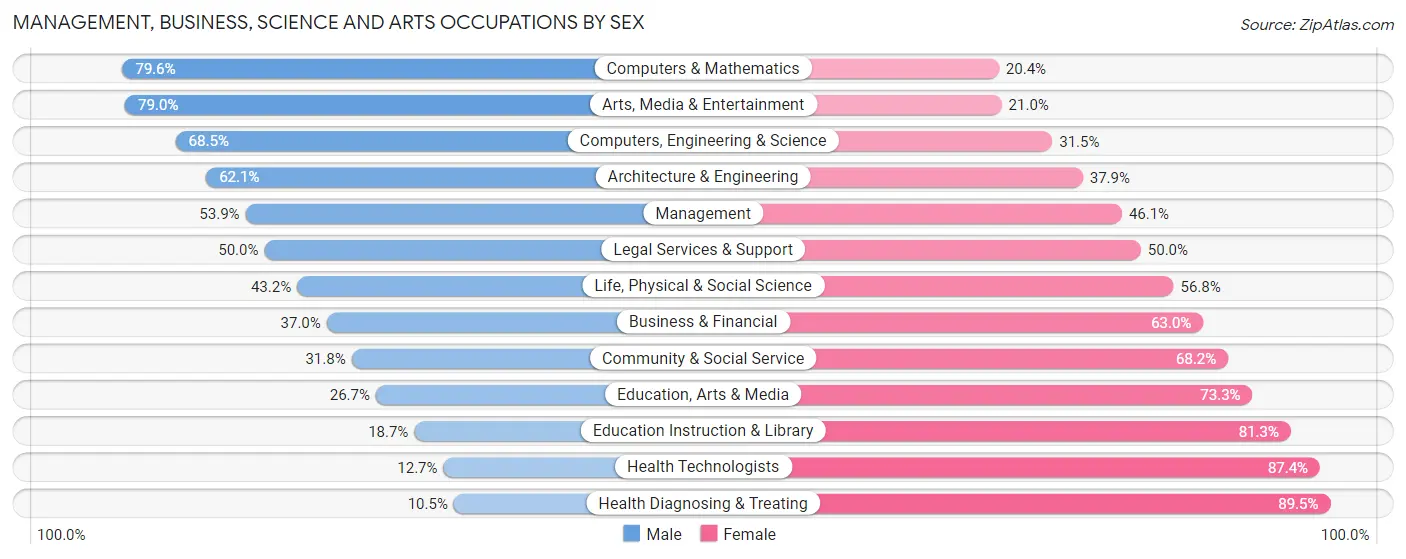
Management, Business, Science and Arts Occupations by Sex
Within the Management, Business, Science and Arts occupations in Suisun City, the most male-oriented occupations are Computers & Mathematics (79.6%), Arts, Media & Entertainment (79.0%), and Computers, Engineering & Science (68.5%), while the most female-oriented occupations are Health Diagnosing & Treating (89.5%), Health Technologists (87.4%), and Education Instruction & Library (81.3%).
| Occupation | Male | Female |
| Management | 527 (53.9%) | 450 (46.1%) |
| Business & Financial | 276 (37.0%) | 470 (63.0%) |
| Computers, Engineering & Science | 402 (68.5%) | 185 (31.5%) |
| Computers & Mathematics | 246 (79.6%) | 63 (20.4%) |
| Architecture & Engineering | 118 (62.1%) | 72 (37.9%) |
| Life, Physical & Social Science | 38 (43.2%) | 50 (56.8%) |
| Community & Social Service | 327 (31.8%) | 701 (68.2%) |
| Education, Arts & Media | 50 (26.7%) | 137 (73.3%) |
| Legal Services & Support | 30 (50.0%) | 30 (50.0%) |
| Education Instruction & Library | 115 (18.7%) | 499 (81.3%) |
| Arts, Media & Entertainment | 132 (79.0%) | 35 (21.0%) |
| Health Diagnosing & Treating | 52 (10.5%) | 444 (89.5%) |
| Health Technologists | 31 (12.7%) | 214 (87.4%) |
| Total (Category) | 1,584 (41.3%) | 2,250 (58.7%) |
| Total (Overall) | 7,257 (51.2%) | 6,919 (48.8%) |
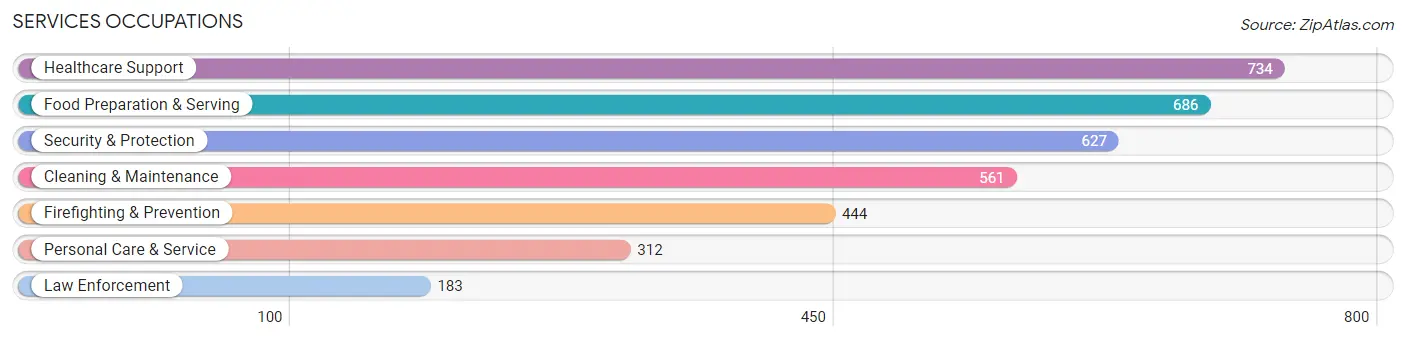
Services Occupations
The most common Services occupations in Suisun City are Healthcare Support (734 | 5.2%), Food Preparation & Serving (686 | 4.8%), Security & Protection (627 | 4.4%), Cleaning & Maintenance (561 | 4.0%), and Firefighting & Prevention (444 | 3.1%).
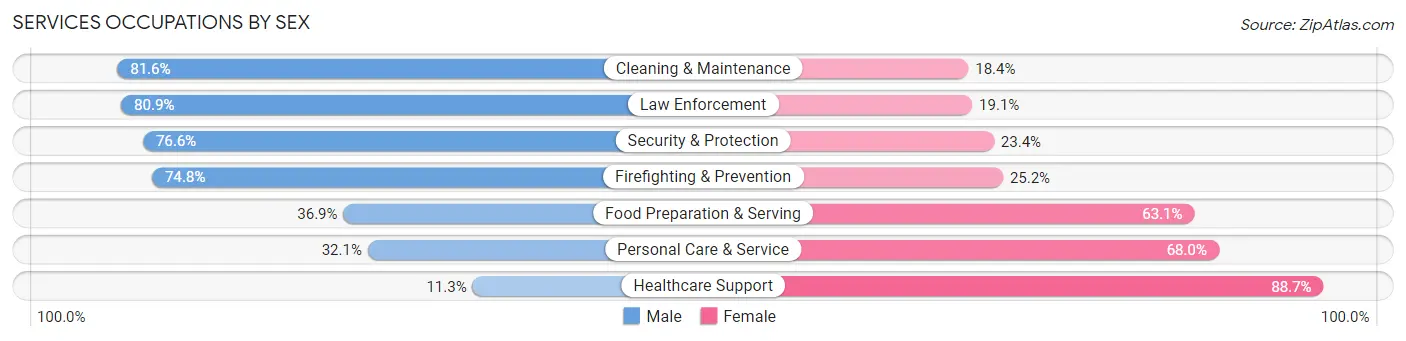
Services Occupations by Sex
Within the Services occupations in Suisun City, the most male-oriented occupations are Cleaning & Maintenance (81.6%), Law Enforcement (80.9%), and Security & Protection (76.6%), while the most female-oriented occupations are Healthcare Support (88.7%), Personal Care & Service (67.9%), and Food Preparation & Serving (63.1%).
| Occupation | Male | Female |
| Healthcare Support | 83 (11.3%) | 651 (88.7%) |
| Security & Protection | 480 (76.6%) | 147 (23.4%) |
| Firefighting & Prevention | 332 (74.8%) | 112 (25.2%) |
| Law Enforcement | 148 (80.9%) | 35 (19.1%) |
| Food Preparation & Serving | 253 (36.9%) | 433 (63.1%) |
| Cleaning & Maintenance | 458 (81.6%) | 103 (18.4%) |
| Personal Care & Service | 100 (32.1%) | 212 (67.9%) |
| Total (Category) | 1,374 (47.0%) | 1,546 (52.9%) |
| Total (Overall) | 7,257 (51.2%) | 6,919 (48.8%) |
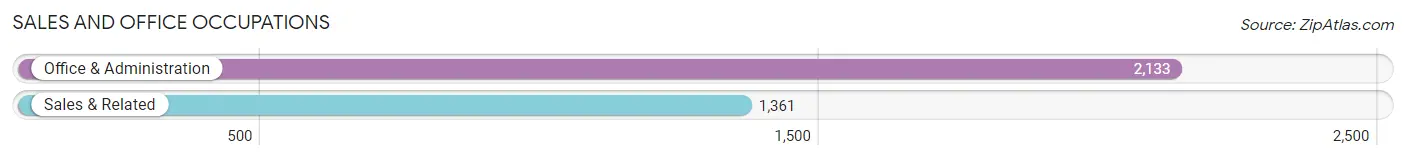
Sales and Office Occupations
The most common Sales and Office occupations in Suisun City are Office & Administration (2,133 | 15.0%), and Sales & Related (1,361 | 9.6%).
Sales and Office Occupations by Sex
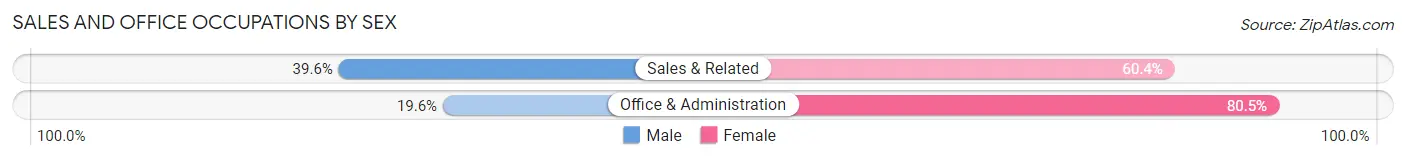
| Occupation | Male | Female |
| Sales & Related | 539 (39.6%) | 822 (60.4%) |
| Office & Administration | 417 (19.6%) | 1,716 (80.4%) |
| Total (Category) | 956 (27.4%) | 2,538 (72.6%) |
| Total (Overall) | 7,257 (51.2%) | 6,919 (48.8%) |
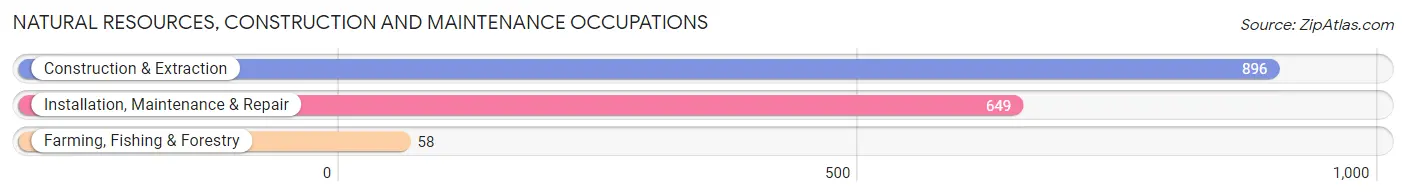
Natural Resources, Construction and Maintenance Occupations
The most common Natural Resources, Construction and Maintenance occupations in Suisun City are Construction & Extraction (896 | 6.3%), Installation, Maintenance & Repair (649 | 4.6%), and Farming, Fishing & Forestry (58 | 0.4%).
Natural Resources, Construction and Maintenance Occupations by Sex
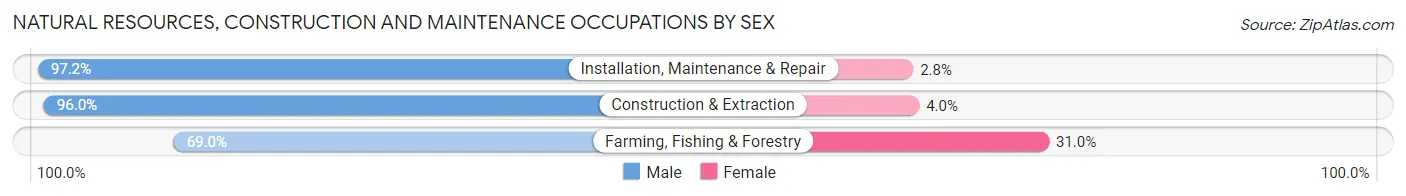
| Occupation | Male | Female |
| Farming, Fishing & Forestry | 40 (69.0%) | 18 (31.0%) |
| Construction & Extraction | 860 (96.0%) | 36 (4.0%) |
| Installation, Maintenance & Repair | 631 (97.2%) | 18 (2.8%) |
| Total (Category) | 1,531 (95.5%) | 72 (4.5%) |
| Total (Overall) | 7,257 (51.2%) | 6,919 (48.8%) |
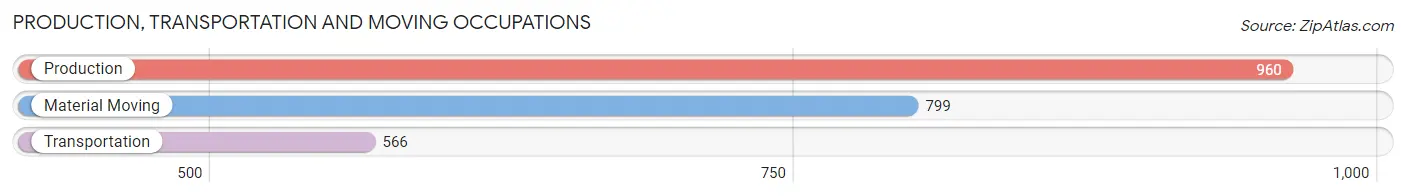
Production, Transportation and Moving Occupations
The most common Production, Transportation and Moving occupations in Suisun City are Production (960 | 6.8%), Material Moving (799 | 5.6%), and Transportation (566 | 4.0%).
Production, Transportation and Moving Occupations by Sex
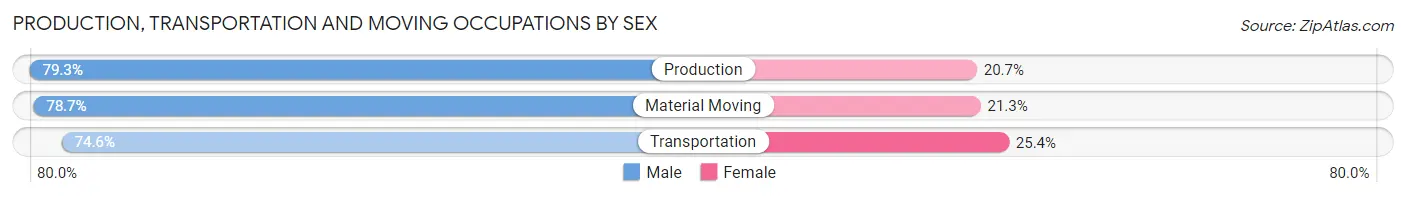
| Occupation | Male | Female |
| Production | 761 (79.3%) | 199 (20.7%) |
| Transportation | 422 (74.6%) | 144 (25.4%) |
| Material Moving | 629 (78.7%) | 170 (21.3%) |
| Total (Category) | 1,812 (77.9%) | 513 (22.1%) |
| Total (Overall) | 7,257 (51.2%) | 6,919 (48.8%) |
Employment Industries by Sex in Suisun City
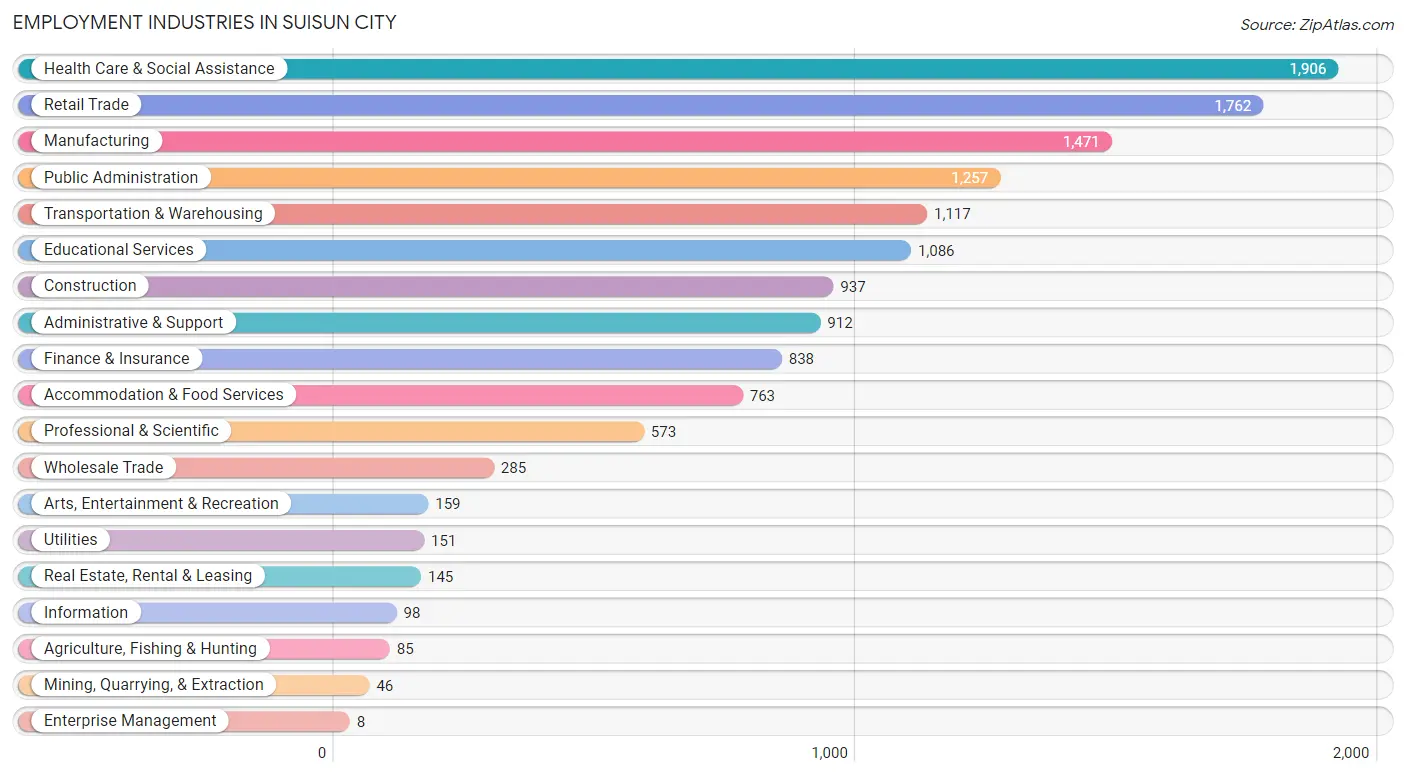
Employment Industries in Suisun City
The major employment industries in Suisun City include Health Care & Social Assistance (1,906 | 13.5%), Retail Trade (1,762 | 12.4%), Manufacturing (1,471 | 10.4%), Public Administration (1,257 | 8.9%), and Transportation & Warehousing (1,117 | 7.9%).
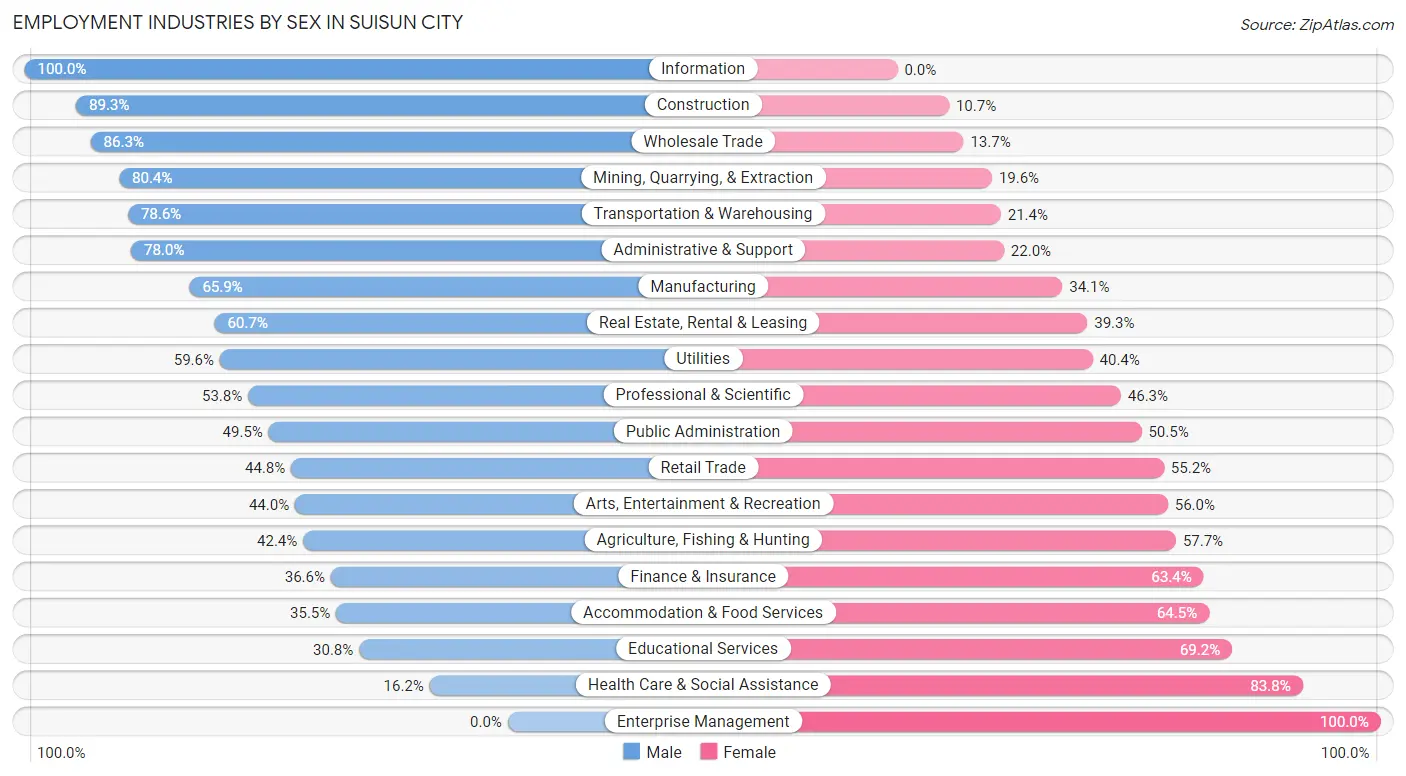
Employment Industries by Sex in Suisun City
The Suisun City industries that see more men than women are Information (100.0%), Construction (89.3%), and Wholesale Trade (86.3%), whereas the industries that tend to have a higher number of women are Enterprise Management (100.0%), Health Care & Social Assistance (83.8%), and Educational Services (69.2%).
| Industry | Male | Female |
| Agriculture, Fishing & Hunting | 36 (42.3%) | 49 (57.7%) |
| Mining, Quarrying, & Extraction | 37 (80.4%) | 9 (19.6%) |
| Construction | 837 (89.3%) | 100 (10.7%) |
| Manufacturing | 969 (65.9%) | 502 (34.1%) |
| Wholesale Trade | 246 (86.3%) | 39 (13.7%) |
| Retail Trade | 790 (44.8%) | 972 (55.2%) |
| Transportation & Warehousing | 878 (78.6%) | 239 (21.4%) |
| Utilities | 90 (59.6%) | 61 (40.4%) |
| Information | 98 (100.0%) | 0 (0.0%) |
| Finance & Insurance | 307 (36.6%) | 531 (63.4%) |
| Real Estate, Rental & Leasing | 88 (60.7%) | 57 (39.3%) |
| Professional & Scientific | 308 (53.7%) | 265 (46.3%) |
| Enterprise Management | 0 (0.0%) | 8 (100.0%) |
| Administrative & Support | 711 (78.0%) | 201 (22.0%) |
| Educational Services | 334 (30.8%) | 752 (69.2%) |
| Health Care & Social Assistance | 308 (16.2%) | 1,598 (83.8%) |
| Arts, Entertainment & Recreation | 70 (44.0%) | 89 (56.0%) |
| Accommodation & Food Services | 271 (35.5%) | 492 (64.5%) |
| Public Administration | 622 (49.5%) | 635 (50.5%) |
| Total | 7,257 (51.2%) | 6,919 (48.8%) |
Education in Suisun City
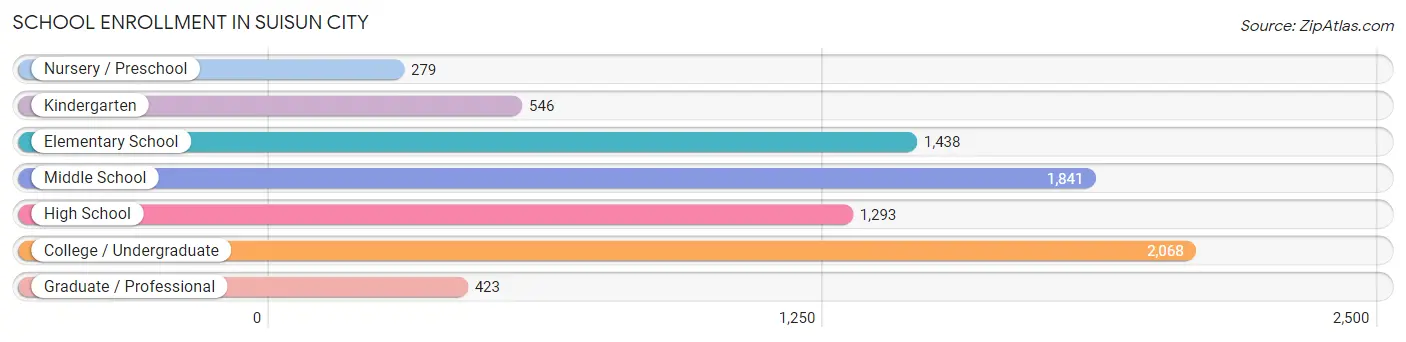
School Enrollment in Suisun City
The most common levels of schooling among the 7,888 students in Suisun City are college / undergraduate (2,068 | 26.2%), middle school (1,841 | 23.3%), and elementary school (1,438 | 18.2%).
| School Level | # Students | % Students |
| Nursery / Preschool | 279 | 3.5% |
| Kindergarten | 546 | 6.9% |
| Elementary School | 1,438 | 18.2% |
| Middle School | 1,841 | 23.3% |
| High School | 1,293 | 16.4% |
| College / Undergraduate | 2,068 | 26.2% |
| Graduate / Professional | 423 | 5.4% |
| Total | 7,888 | 100.0% |
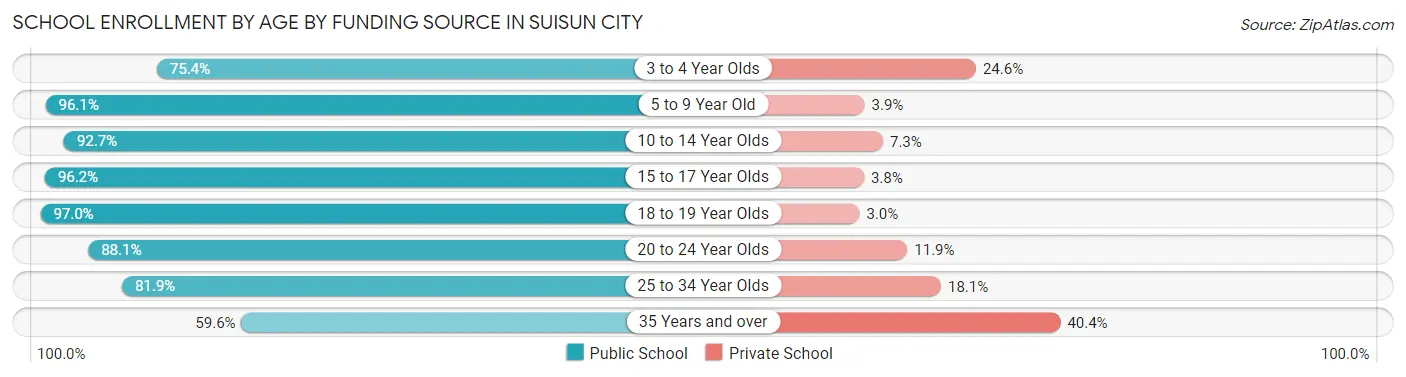
School Enrollment by Age by Funding Source in Suisun City
Out of a total of 7,888 students who are enrolled in schools in Suisun City, 828 (10.5%) attend a private institution, while the remaining 7,060 (89.5%) are enrolled in public schools. The age group of 35 years and over has the highest likelihood of being enrolled in private schools, with 258 (40.4% in the age bracket) enrolled. Conversely, the age group of 18 to 19 year olds has the lowest likelihood of being enrolled in a private school, with 394 (97.0% in the age bracket) attending a public institution.
| Age Bracket | Public School | Private School |
| 3 to 4 Year Olds | 208 (75.4%) | 68 (24.6%) |
| 5 to 9 Year Old | 1,701 (96.1%) | 69 (3.9%) |
| 10 to 14 Year Olds | 1,973 (92.7%) | 156 (7.3%) |
| 15 to 17 Year Olds | 1,068 (96.2%) | 42 (3.8%) |
| 18 to 19 Year Olds | 394 (97.0%) | 12 (3.0%) |
| 20 to 24 Year Olds | 795 (88.1%) | 107 (11.9%) |
| 25 to 34 Year Olds | 537 (81.9%) | 119 (18.1%) |
| 35 Years and over | 381 (59.6%) | 258 (40.4%) |
| Total | 7,060 (89.5%) | 828 (10.5%) |
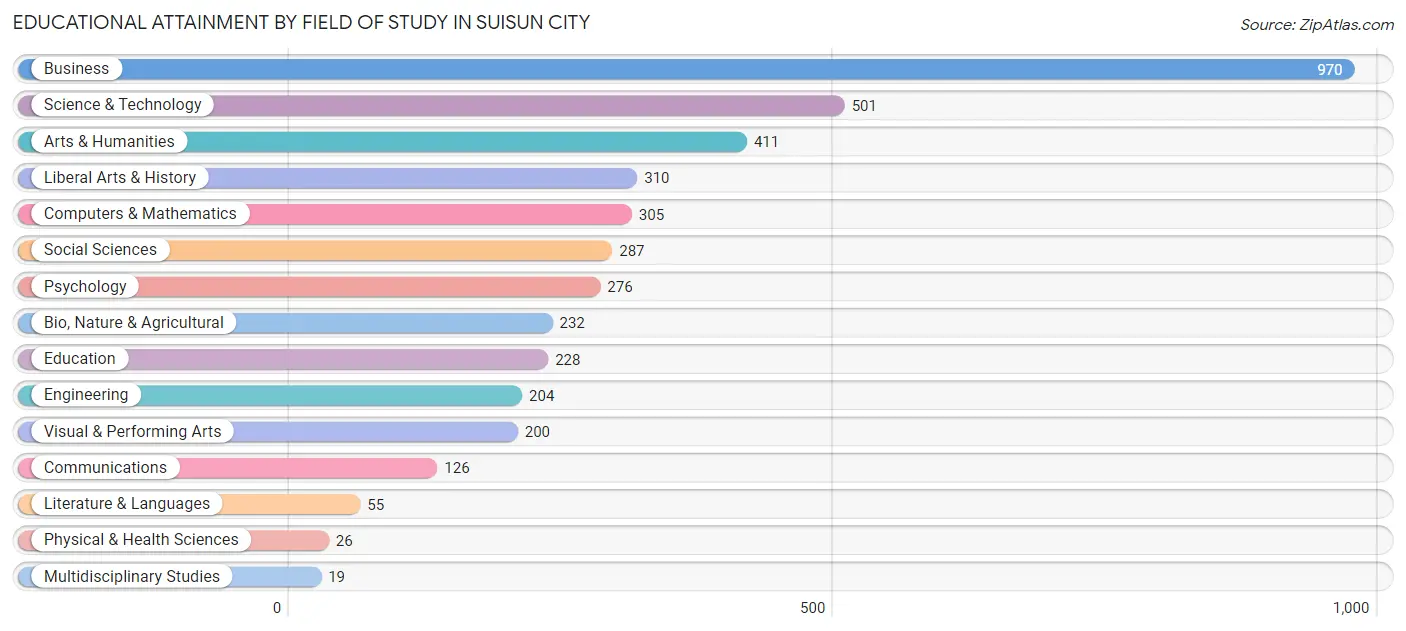
Educational Attainment by Field of Study in Suisun City
Business (970 | 23.4%), science & technology (501 | 12.1%), arts & humanities (411 | 9.9%), liberal arts & history (310 | 7.5%), and computers & mathematics (305 | 7.3%) are the most common fields of study among 4,150 individuals in Suisun City who have obtained a bachelor's degree or higher.
| Field of Study | # Graduates | % Graduates |
| Computers & Mathematics | 305 | 7.3% |
| Bio, Nature & Agricultural | 232 | 5.6% |
| Physical & Health Sciences | 26 | 0.6% |
| Psychology | 276 | 6.7% |
| Social Sciences | 287 | 6.9% |
| Engineering | 204 | 4.9% |
| Multidisciplinary Studies | 19 | 0.5% |
| Science & Technology | 501 | 12.1% |
| Business | 970 | 23.4% |
| Education | 228 | 5.5% |
| Literature & Languages | 55 | 1.3% |
| Liberal Arts & History | 310 | 7.5% |
| Visual & Performing Arts | 200 | 4.8% |
| Communications | 126 | 3.0% |
| Arts & Humanities | 411 | 9.9% |
| Total | 4,150 | 100.0% |
Transportation & Commute in Suisun City
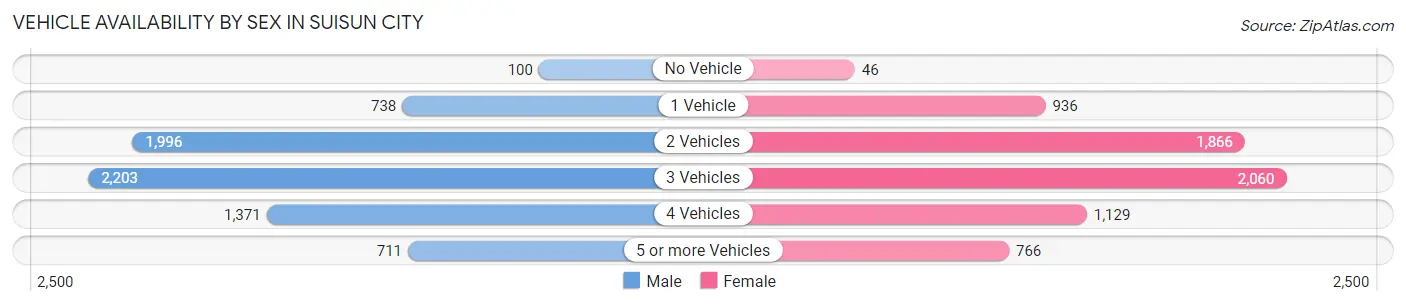
Vehicle Availability by Sex in Suisun City
The most prevalent vehicle ownership categories in Suisun City are males with 3 vehicles (2,203, accounting for 30.9%) and females with 3 vehicles (2,060, making up 32.4%).
| Vehicles Available | Male | Female |
| No Vehicle | 100 (1.4%) | 46 (0.7%) |
| 1 Vehicle | 738 (10.4%) | 936 (13.8%) |
| 2 Vehicles | 1,996 (28.0%) | 1,866 (27.4%) |
| 3 Vehicles | 2,203 (30.9%) | 2,060 (30.3%) |
| 4 Vehicles | 1,371 (19.3%) | 1,129 (16.6%) |
| 5 or more Vehicles | 711 (10.0%) | 766 (11.3%) |
| Total | 7,119 (100.0%) | 6,803 (100.0%) |
Commute Time in Suisun City
The most frequently occuring commute durations in Suisun City are 15 to 19 minutes (1,883 commuters, 14.3%), 60 to 89 minutes (1,836 commuters, 14.0%), and 10 to 14 minutes (1,760 commuters, 13.4%).
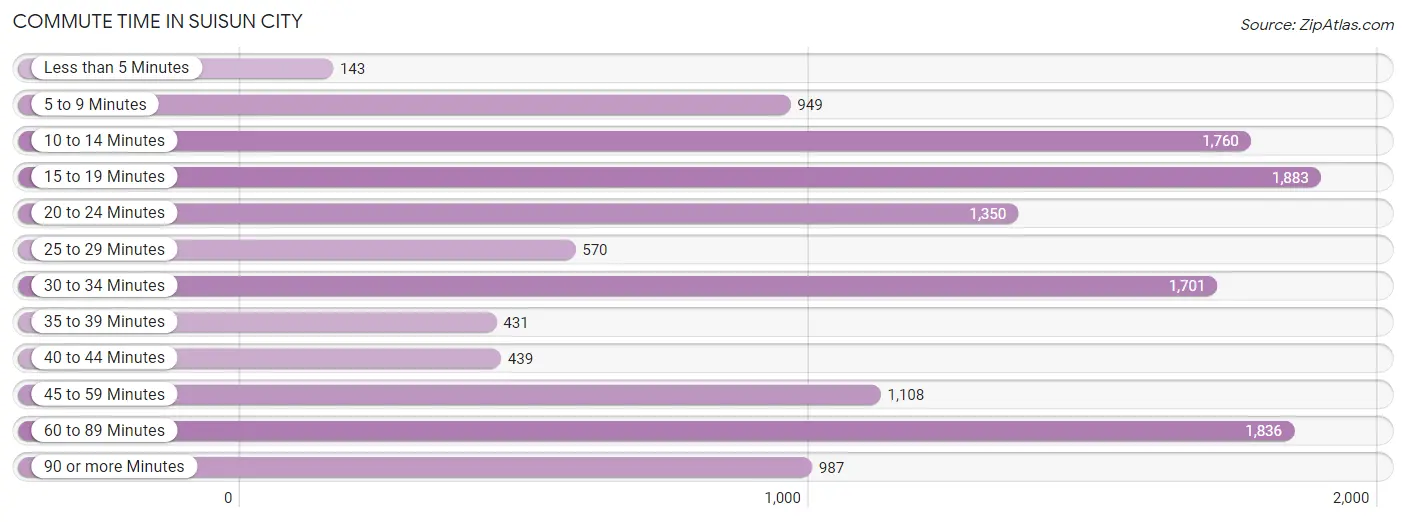
| Commute Time | # Commuters | % Commuters |
| Less than 5 Minutes | 143 | 1.1% |
| 5 to 9 Minutes | 949 | 7.2% |
| 10 to 14 Minutes | 1,760 | 13.4% |
| 15 to 19 Minutes | 1,883 | 14.3% |
| 20 to 24 Minutes | 1,350 | 10.3% |
| 25 to 29 Minutes | 570 | 4.3% |
| 30 to 34 Minutes | 1,701 | 12.9% |
| 35 to 39 Minutes | 431 | 3.3% |
| 40 to 44 Minutes | 439 | 3.3% |
| 45 to 59 Minutes | 1,108 | 8.4% |
| 60 to 89 Minutes | 1,836 | 14.0% |
| 90 or more Minutes | 987 | 7.5% |
Commute Time by Sex in Suisun City
The most common commute times in Suisun City are 60 to 89 minutes (1,119 commuters, 16.2%) for males and 10 to 14 minutes (1,142 commuters, 18.3%) for females.
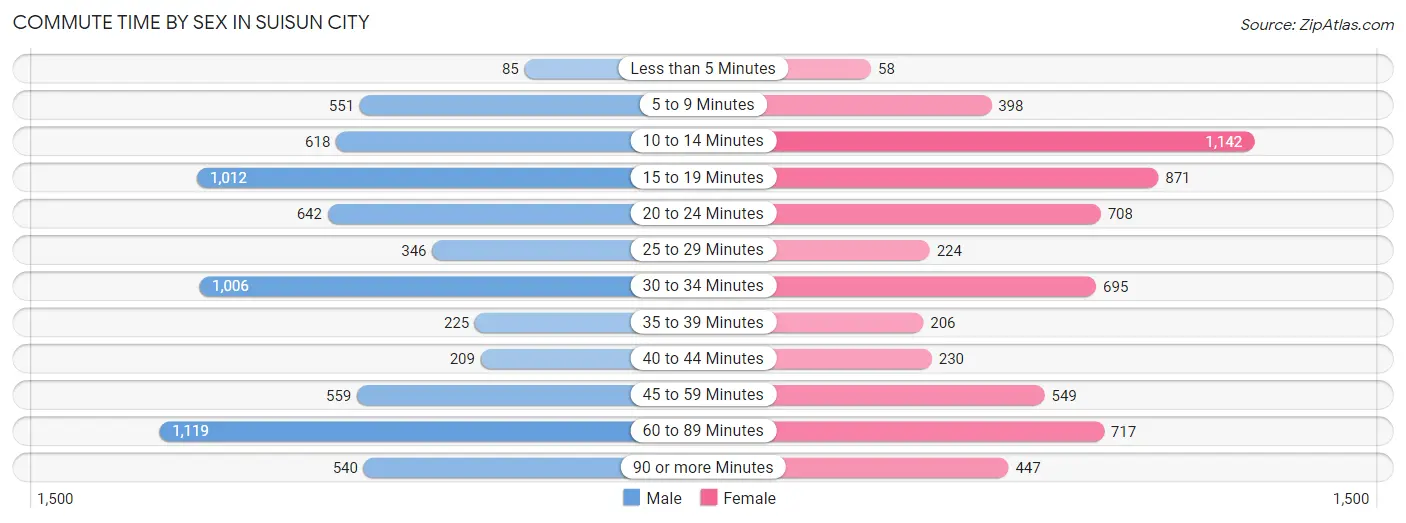
| Commute Time | Male | Female |
| Less than 5 Minutes | 85 (1.2%) | 58 (0.9%) |
| 5 to 9 Minutes | 551 (8.0%) | 398 (6.4%) |
| 10 to 14 Minutes | 618 (8.9%) | 1,142 (18.3%) |
| 15 to 19 Minutes | 1,012 (14.6%) | 871 (14.0%) |
| 20 to 24 Minutes | 642 (9.3%) | 708 (11.3%) |
| 25 to 29 Minutes | 346 (5.0%) | 224 (3.6%) |
| 30 to 34 Minutes | 1,006 (14.5%) | 695 (11.1%) |
| 35 to 39 Minutes | 225 (3.3%) | 206 (3.3%) |
| 40 to 44 Minutes | 209 (3.0%) | 230 (3.7%) |
| 45 to 59 Minutes | 559 (8.1%) | 549 (8.8%) |
| 60 to 89 Minutes | 1,119 (16.2%) | 717 (11.5%) |
| 90 or more Minutes | 540 (7.8%) | 447 (7.2%) |
Time of Departure to Work by Sex in Suisun City
The most frequent times of departure to work in Suisun City are 12:00 AM to 4:59 AM (932, 13.5%) for males and 7:00 AM to 7:29 AM (1,349, 21.6%) for females.
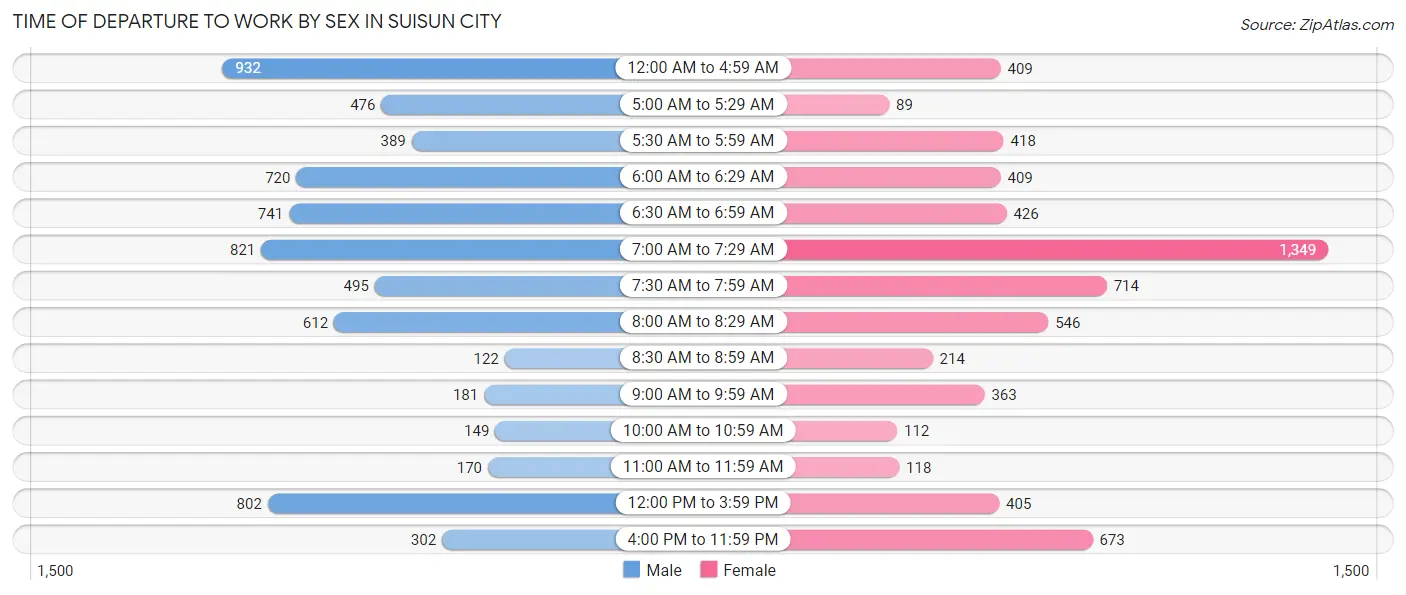
| Time of Departure | Male | Female |
| 12:00 AM to 4:59 AM | 932 (13.5%) | 409 (6.6%) |
| 5:00 AM to 5:29 AM | 476 (6.9%) | 89 (1.4%) |
| 5:30 AM to 5:59 AM | 389 (5.6%) | 418 (6.7%) |
| 6:00 AM to 6:29 AM | 720 (10.4%) | 409 (6.6%) |
| 6:30 AM to 6:59 AM | 741 (10.7%) | 426 (6.8%) |
| 7:00 AM to 7:29 AM | 821 (11.9%) | 1,349 (21.6%) |
| 7:30 AM to 7:59 AM | 495 (7.2%) | 714 (11.4%) |
| 8:00 AM to 8:29 AM | 612 (8.8%) | 546 (8.7%) |
| 8:30 AM to 8:59 AM | 122 (1.8%) | 214 (3.4%) |
| 9:00 AM to 9:59 AM | 181 (2.6%) | 363 (5.8%) |
| 10:00 AM to 10:59 AM | 149 (2.2%) | 112 (1.8%) |
| 11:00 AM to 11:59 AM | 170 (2.5%) | 118 (1.9%) |
| 12:00 PM to 3:59 PM | 802 (11.6%) | 405 (6.5%) |
| 4:00 PM to 11:59 PM | 302 (4.4%) | 673 (10.8%) |
| Total | 6,912 (100.0%) | 6,245 (100.0%) |
Housing Occupancy in Suisun City
Occupancy by Ownership in Suisun City
Of the total 9,655 dwellings in Suisun City, owner-occupied units account for 5,992 (62.1%), while renter-occupied units make up 3,663 (37.9%).
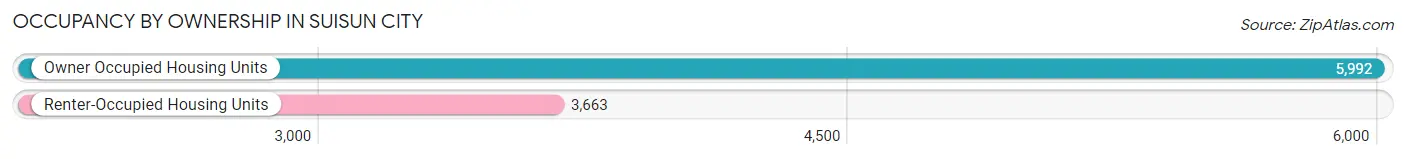
| Occupancy | # Housing Units | % Housing Units |
| Owner Occupied Housing Units | 5,992 | 62.1% |
| Renter-Occupied Housing Units | 3,663 | 37.9% |
| Total Occupied Housing Units | 9,655 | 100.0% |
Occupancy by Household Size in Suisun City
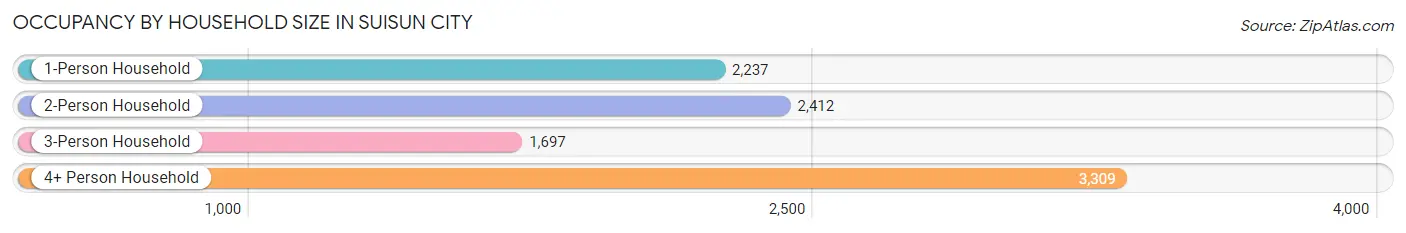
| Household Size | # Housing Units | % Housing Units |
| 1-Person Household | 2,237 | 23.2% |
| 2-Person Household | 2,412 | 25.0% |
| 3-Person Household | 1,697 | 17.6% |
| 4+ Person Household | 3,309 | 34.3% |
| Total Housing Units | 9,655 | 100.0% |
Occupancy by Ownership by Household Size in Suisun City
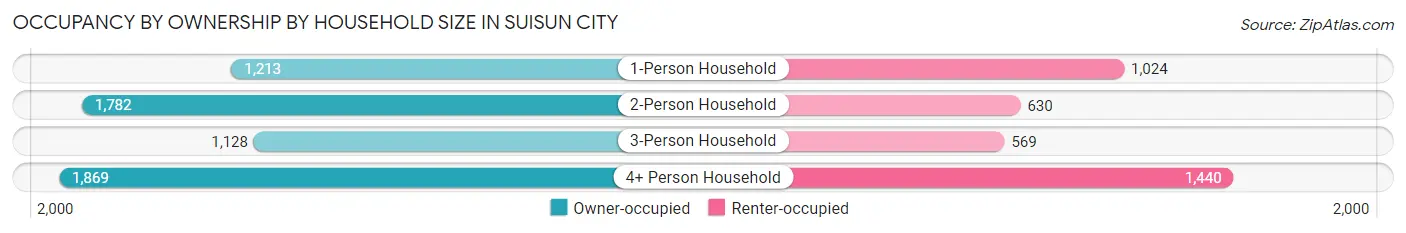
| Household Size | Owner-occupied | Renter-occupied |
| 1-Person Household | 1,213 (54.2%) | 1,024 (45.8%) |
| 2-Person Household | 1,782 (73.9%) | 630 (26.1%) |
| 3-Person Household | 1,128 (66.5%) | 569 (33.5%) |
| 4+ Person Household | 1,869 (56.5%) | 1,440 (43.5%) |
| Total Housing Units | 5,992 (62.1%) | 3,663 (37.9%) |
Occupancy by Educational Attainment in Suisun City
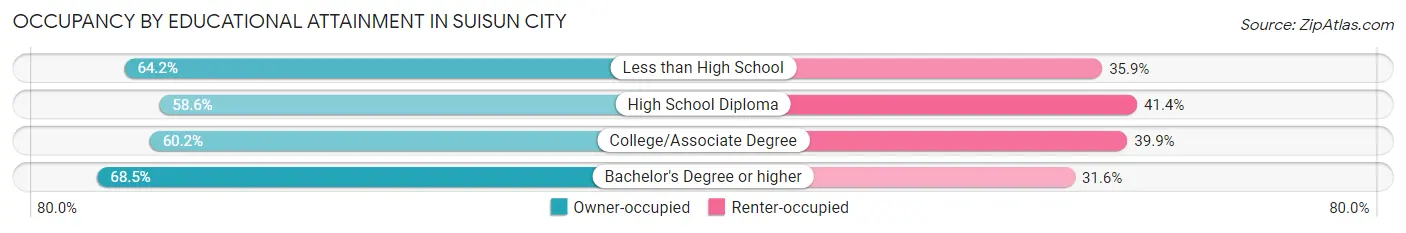
| Household Size | Owner-occupied | Renter-occupied |
| Less than High School | 383 (64.1%) | 214 (35.8%) |
| High School Diploma | 1,491 (58.6%) | 1,053 (41.4%) |
| College/Associate Degree | 2,471 (60.2%) | 1,637 (39.9%) |
| Bachelor's Degree or higher | 1,647 (68.4%) | 759 (31.6%) |
Occupancy by Age of Householder in Suisun City
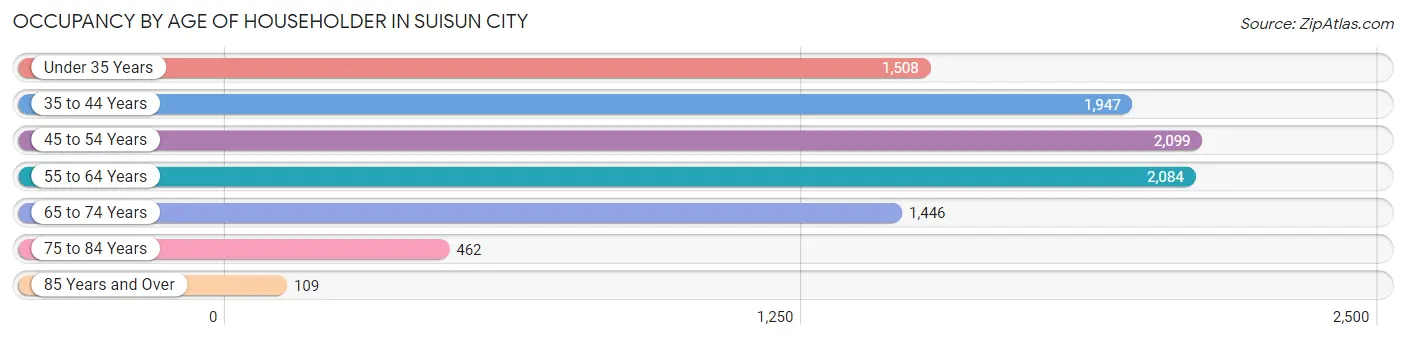
| Age Bracket | # Households | % Households |
| Under 35 Years | 1,508 | 15.6% |
| 35 to 44 Years | 1,947 | 20.2% |
| 45 to 54 Years | 2,099 | 21.7% |
| 55 to 64 Years | 2,084 | 21.6% |
| 65 to 74 Years | 1,446 | 15.0% |
| 75 to 84 Years | 462 | 4.8% |
| 85 Years and Over | 109 | 1.1% |
| Total | 9,655 | 100.0% |
Housing Finances in Suisun City
Median Income by Occupancy in Suisun City
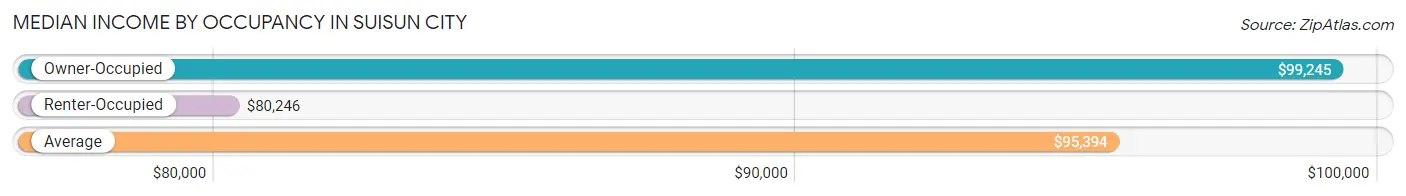
| Occupancy Type | # Households | Median Income |
| Owner-Occupied | 5,992 (62.1%) | $99,245 |
| Renter-Occupied | 3,663 (37.9%) | $80,246 |
| Average | 9,655 (100.0%) | $95,394 |
Occupancy by Householder Income Bracket in Suisun City
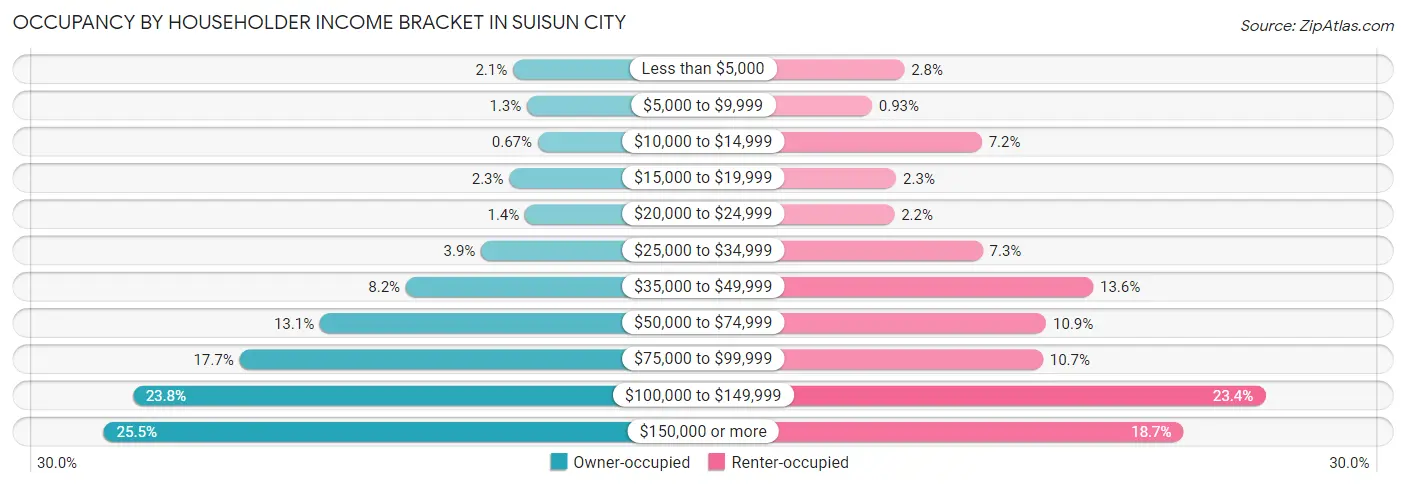
| Income Bracket | Owner-occupied | Renter-occupied |
| Less than $5,000 | 125 (2.1%) | 102 (2.8%) |
| $5,000 to $9,999 | 77 (1.3%) | 34 (0.9%) |
| $10,000 to $14,999 | 40 (0.7%) | 264 (7.2%) |
| $15,000 to $19,999 | 138 (2.3%) | 85 (2.3%) |
| $20,000 to $24,999 | 84 (1.4%) | 81 (2.2%) |
| $25,000 to $34,999 | 234 (3.9%) | 266 (7.3%) |
| $35,000 to $49,999 | 492 (8.2%) | 497 (13.6%) |
| $50,000 to $74,999 | 786 (13.1%) | 399 (10.9%) |
| $75,000 to $99,999 | 1,062 (17.7%) | 392 (10.7%) |
| $100,000 to $149,999 | 1,427 (23.8%) | 857 (23.4%) |
| $150,000 or more | 1,527 (25.5%) | 686 (18.7%) |
| Total | 5,992 (100.0%) | 3,663 (100.0%) |
Monthly Housing Cost Tiers in Suisun City
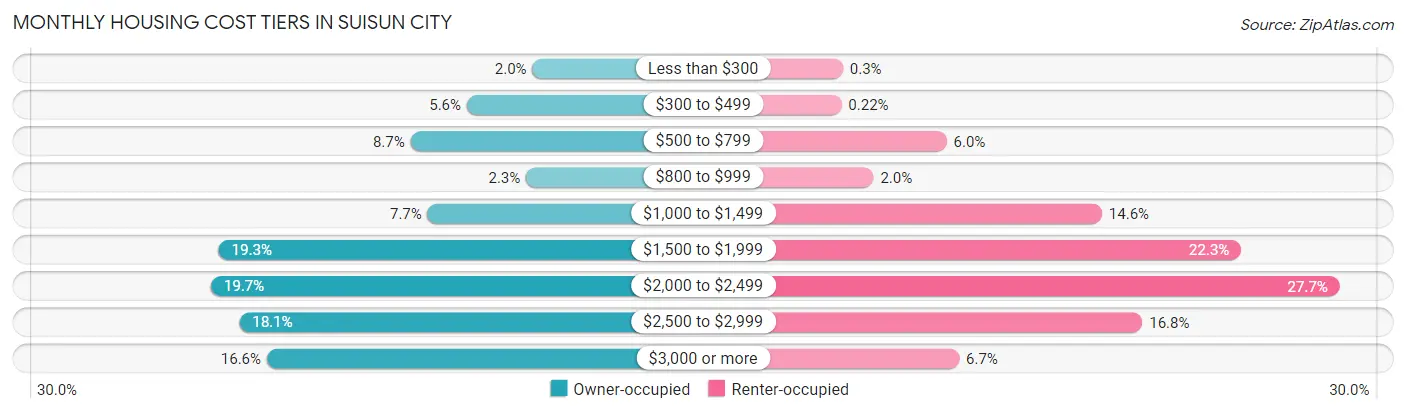
| Monthly Cost | Owner-occupied | Renter-occupied |
| Less than $300 | 117 (1.9%) | 11 (0.3%) |
| $300 to $499 | 334 (5.6%) | 8 (0.2%) |
| $500 to $799 | 520 (8.7%) | 221 (6.0%) |
| $800 to $999 | 138 (2.3%) | 73 (2.0%) |
| $1,000 to $1,499 | 464 (7.7%) | 535 (14.6%) |
| $1,500 to $1,999 | 1,155 (19.3%) | 817 (22.3%) |
| $2,000 to $2,499 | 1,181 (19.7%) | 1,016 (27.7%) |
| $2,500 to $2,999 | 1,087 (18.1%) | 617 (16.8%) |
| $3,000 or more | 996 (16.6%) | 246 (6.7%) |
| Total | 5,992 (100.0%) | 3,663 (100.0%) |
Physical Housing Characteristics in Suisun City
Housing Structures in Suisun City
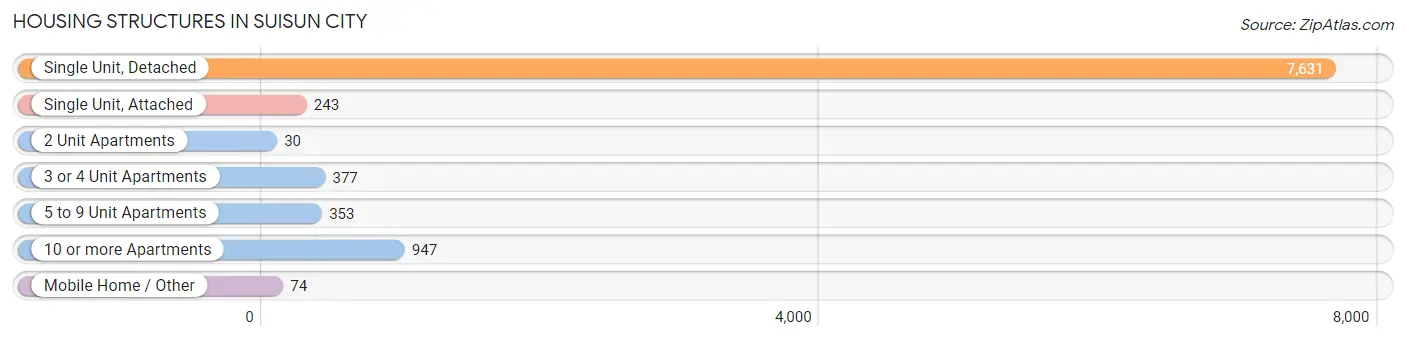
| Structure Type | # Housing Units | % Housing Units |
| Single Unit, Detached | 7,631 | 79.0% |
| Single Unit, Attached | 243 | 2.5% |
| 2 Unit Apartments | 30 | 0.3% |
| 3 or 4 Unit Apartments | 377 | 3.9% |
| 5 to 9 Unit Apartments | 353 | 3.7% |
| 10 or more Apartments | 947 | 9.8% |
| Mobile Home / Other | 74 | 0.8% |
| Total | 9,655 | 100.0% |
Housing Structures by Occupancy in Suisun City
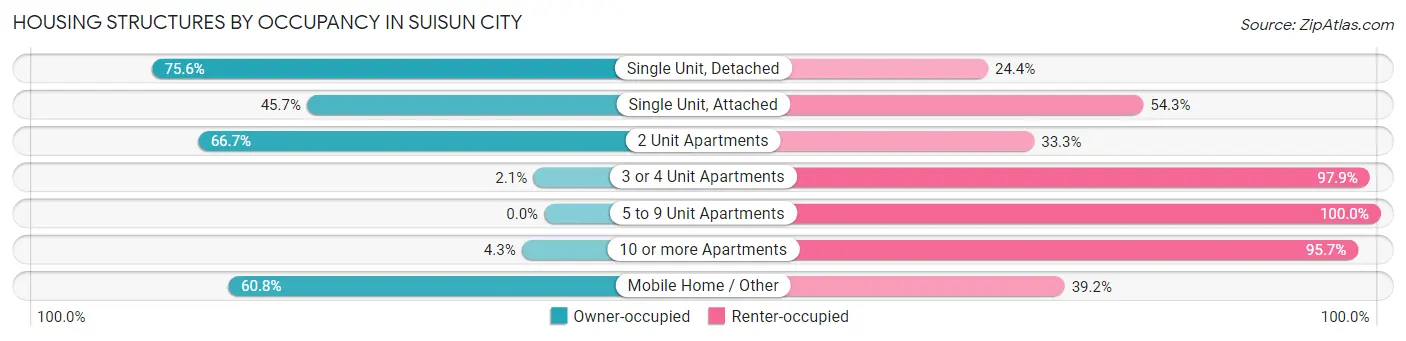
| Structure Type | Owner-occupied | Renter-occupied |
| Single Unit, Detached | 5,767 (75.6%) | 1,864 (24.4%) |
| Single Unit, Attached | 111 (45.7%) | 132 (54.3%) |
| 2 Unit Apartments | 20 (66.7%) | 10 (33.3%) |
| 3 or 4 Unit Apartments | 8 (2.1%) | 369 (97.9%) |
| 5 to 9 Unit Apartments | 0 (0.0%) | 353 (100.0%) |
| 10 or more Apartments | 41 (4.3%) | 906 (95.7%) |
| Mobile Home / Other | 45 (60.8%) | 29 (39.2%) |
| Total | 5,992 (62.1%) | 3,663 (37.9%) |
Housing Structures by Number of Rooms in Suisun City
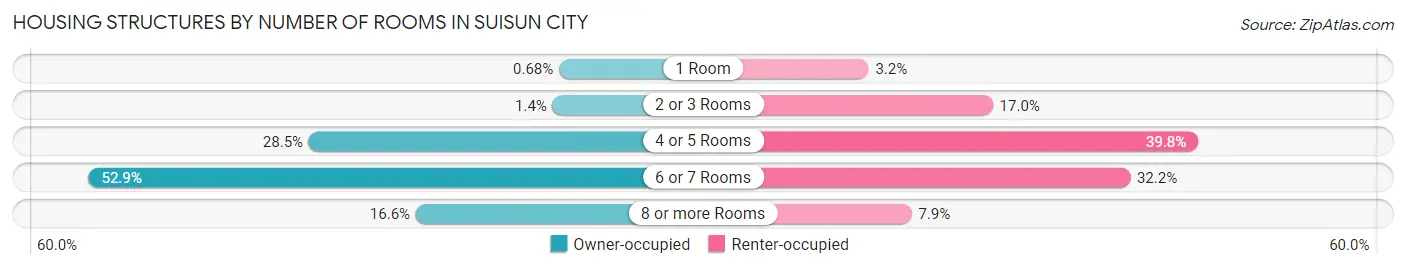
| Number of Rooms | Owner-occupied | Renter-occupied |
| 1 Room | 41 (0.7%) | 116 (3.2%) |
| 2 or 3 Rooms | 83 (1.4%) | 621 (17.0%) |
| 4 or 5 Rooms | 1,705 (28.4%) | 1,456 (39.8%) |
| 6 or 7 Rooms | 3,170 (52.9%) | 1,179 (32.2%) |
| 8 or more Rooms | 993 (16.6%) | 291 (7.9%) |
| Total | 5,992 (100.0%) | 3,663 (100.0%) |
Housing Structure by Heating Type in Suisun City
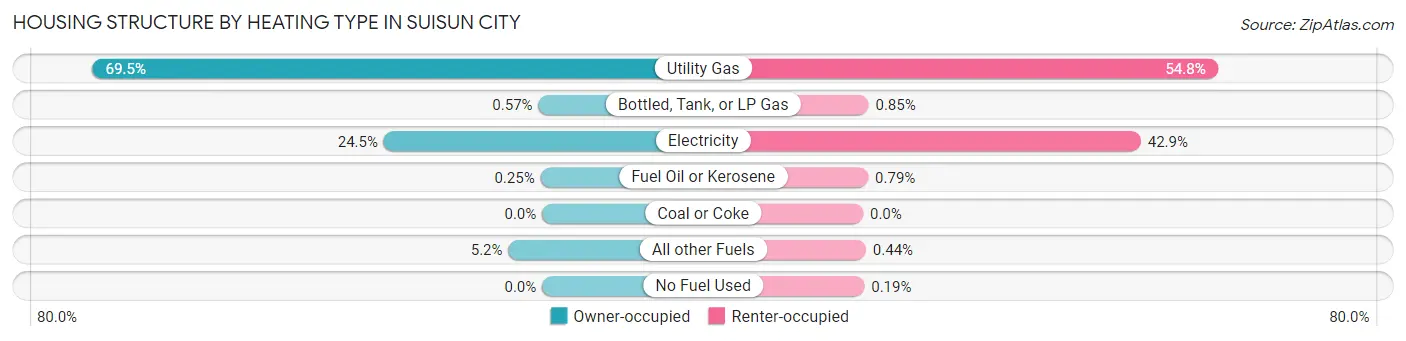
| Heating Type | Owner-occupied | Renter-occupied |
| Utility Gas | 4,164 (69.5%) | 2,007 (54.8%) |
| Bottled, Tank, or LP Gas | 34 (0.6%) | 31 (0.9%) |
| Electricity | 1,466 (24.5%) | 1,573 (42.9%) |
| Fuel Oil or Kerosene | 15 (0.3%) | 29 (0.8%) |
| Coal or Coke | 0 (0.0%) | 0 (0.0%) |
| All other Fuels | 313 (5.2%) | 16 (0.4%) |
| No Fuel Used | 0 (0.0%) | 7 (0.2%) |
| Total | 5,992 (100.0%) | 3,663 (100.0%) |
Household Vehicle Usage in Suisun City
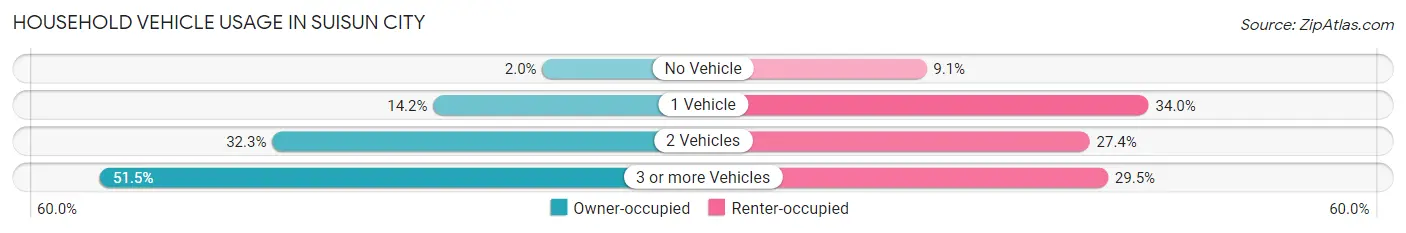
| Vehicles per Household | Owner-occupied | Renter-occupied |
| No Vehicle | 119 (2.0%) | 334 (9.1%) |
| 1 Vehicle | 852 (14.2%) | 1,246 (34.0%) |
| 2 Vehicles | 1,933 (32.3%) | 1,004 (27.4%) |
| 3 or more Vehicles | 3,088 (51.5%) | 1,079 (29.5%) |
| Total | 5,992 (100.0%) | 3,663 (100.0%) |
Real Estate & Mortgages in Suisun City
Real Estate and Mortgage Overview in Suisun City
| Characteristic | Without Mortgage | With Mortgage |
| Housing Units | 1,179 | 4,813 |
| Median Property Value | $467,100 | $489,800 |
| Median Household Income | $81,914 | $1,263 |
| Monthly Housing Costs | $551 | $996 |
| Real Estate Taxes | $2,682 | $115 |
Property Value by Mortgage Status in Suisun City
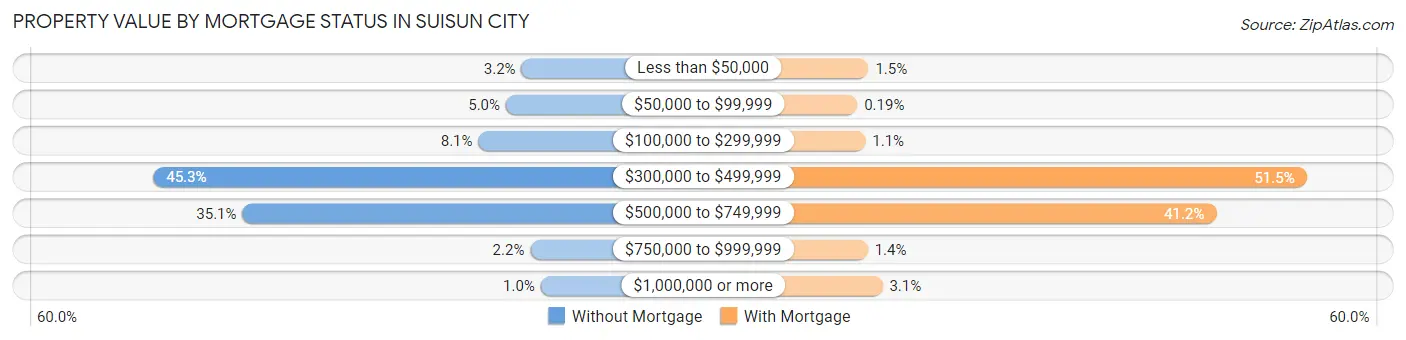
| Property Value | Without Mortgage | With Mortgage |
| Less than $50,000 | 38 (3.2%) | 71 (1.5%) |
| $50,000 to $99,999 | 59 (5.0%) | 9 (0.2%) |
| $100,000 to $299,999 | 96 (8.1%) | 54 (1.1%) |
| $300,000 to $499,999 | 534 (45.3%) | 2,480 (51.5%) |
| $500,000 to $749,999 | 414 (35.1%) | 1,984 (41.2%) |
| $750,000 to $999,999 | 26 (2.2%) | 67 (1.4%) |
| $1,000,000 or more | 12 (1.0%) | 148 (3.1%) |
| Total | 1,179 (100.0%) | 4,813 (100.0%) |
Household Income by Mortgage Status in Suisun City
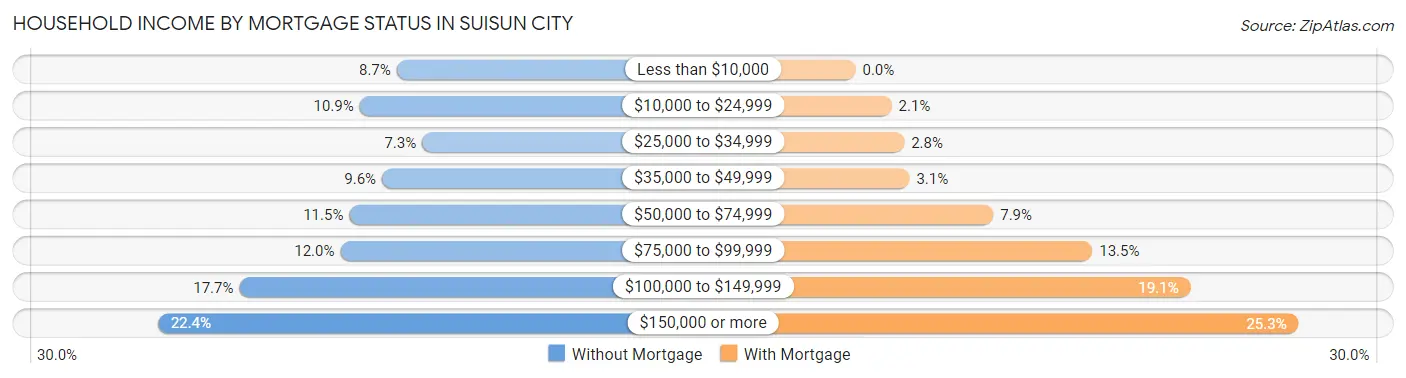
| Household Income | Without Mortgage | With Mortgage |
| Less than $10,000 | 103 (8.7%) | 0 (0.0%) |
| $10,000 to $24,999 | 128 (10.9%) | 99 (2.1%) |
| $25,000 to $34,999 | 86 (7.3%) | 134 (2.8%) |
| $35,000 to $49,999 | 113 (9.6%) | 148 (3.1%) |
| $50,000 to $74,999 | 135 (11.5%) | 379 (7.9%) |
| $75,000 to $99,999 | 141 (12.0%) | 651 (13.5%) |
| $100,000 to $149,999 | 209 (17.7%) | 921 (19.1%) |
| $150,000 or more | 264 (22.4%) | 1,218 (25.3%) |
| Total | 1,179 (100.0%) | 4,813 (100.0%) |
Property Value to Household Income Ratio in Suisun City
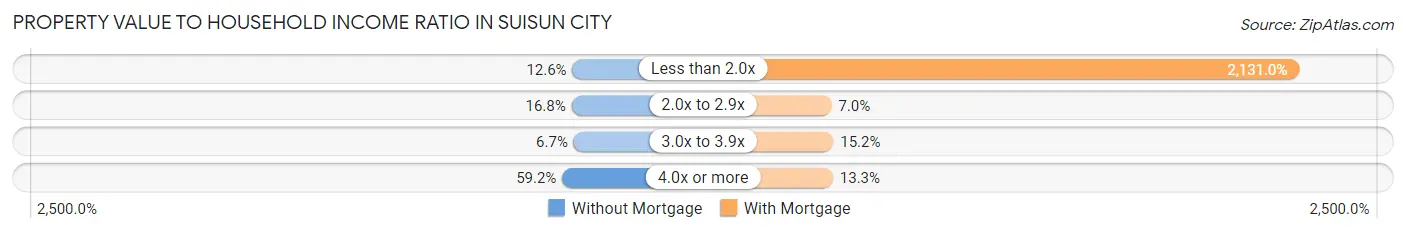
| Value-to-Income Ratio | Without Mortgage | With Mortgage |
| Less than 2.0x | 149 (12.6%) | 102,564 (2,131.0%) |
| 2.0x to 2.9x | 198 (16.8%) | 339 (7.0%) |
| 3.0x to 3.9x | 79 (6.7%) | 731 (15.2%) |
| 4.0x or more | 698 (59.2%) | 642 (13.3%) |
| Total | 1,179 (100.0%) | 4,813 (100.0%) |
Real Estate Taxes by Mortgage Status in Suisun City
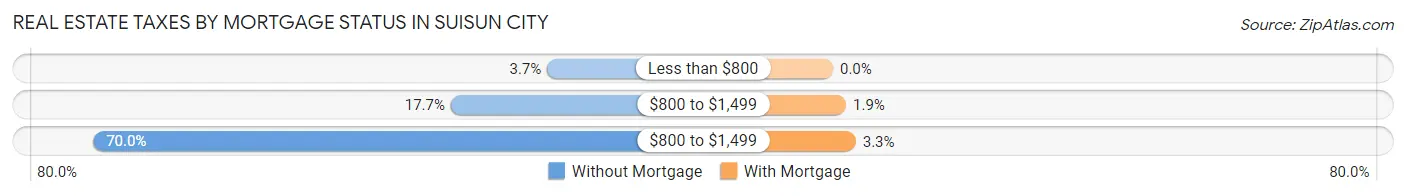
| Property Taxes | Without Mortgage | With Mortgage |
| Less than $800 | 43 (3.6%) | 0 (0.0%) |
| $800 to $1,499 | 209 (17.7%) | 92 (1.9%) |
| $800 to $1,499 | 825 (70.0%) | 160 (3.3%) |
| Total | 1,179 (100.0%) | 4,813 (100.0%) |
Health & Disability in Suisun City
Health Insurance Coverage by Age in Suisun City
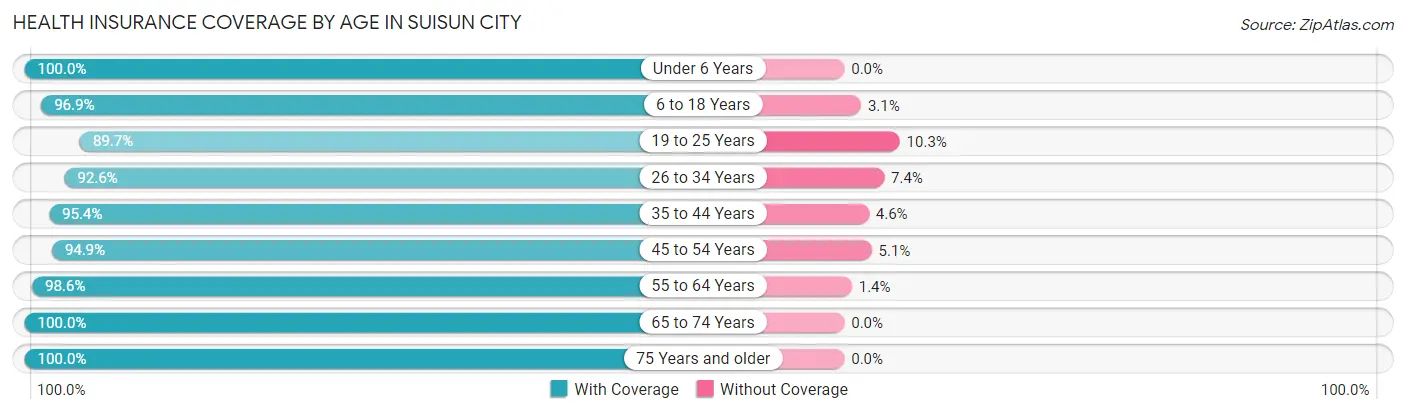
| Age Bracket | With Coverage | Without Coverage |
| Under 6 Years | 1,946 (100.0%) | 0 (0.0%) |
| 6 to 18 Years | 5,293 (96.9%) | 170 (3.1%) |
| 19 to 25 Years | 2,676 (89.7%) | 308 (10.3%) |
| 26 to 34 Years | 3,304 (92.6%) | 265 (7.4%) |
| 35 to 44 Years | 3,543 (95.4%) | 170 (4.6%) |
| 45 to 54 Years | 3,545 (94.9%) | 190 (5.1%) |
| 55 to 64 Years | 3,579 (98.6%) | 51 (1.4%) |
| 65 to 74 Years | 2,567 (100.0%) | 0 (0.0%) |
| 75 Years and older | 1,408 (100.0%) | 0 (0.0%) |
| Total | 27,861 (96.0%) | 1,154 (4.0%) |
Health Insurance Coverage by Citizenship Status in Suisun City
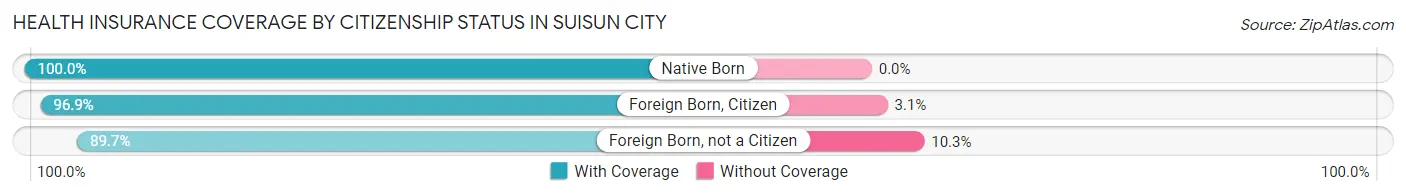
| Citizenship Status | With Coverage | Without Coverage |
| Native Born | 1,946 (100.0%) | 0 (0.0%) |
| Foreign Born, Citizen | 5,293 (96.9%) | 170 (3.1%) |
| Foreign Born, not a Citizen | 2,676 (89.7%) | 308 (10.3%) |
Health Insurance Coverage by Household Income in Suisun City
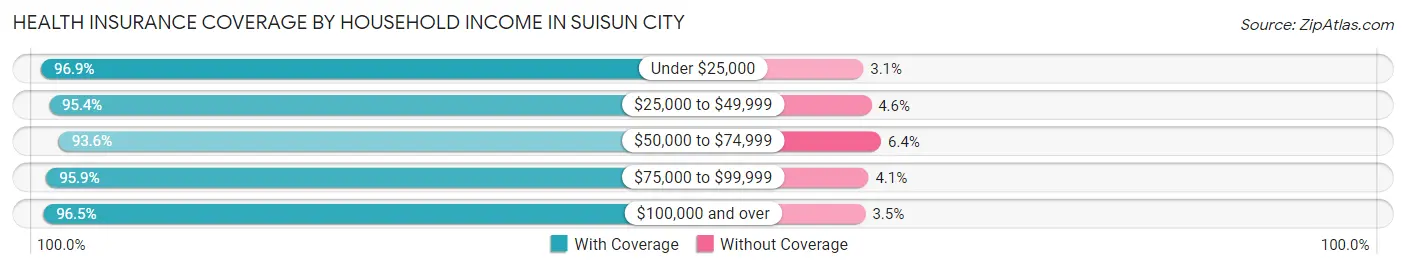
| Household Income | With Coverage | Without Coverage |
| Under $25,000 | 1,633 (96.9%) | 52 (3.1%) |
| $25,000 to $49,999 | 3,464 (95.4%) | 166 (4.6%) |
| $50,000 to $74,999 | 2,724 (93.6%) | 187 (6.4%) |
| $75,000 to $99,999 | 4,514 (95.9%) | 191 (4.1%) |
| $100,000 and over | 15,405 (96.5%) | 558 (3.5%) |
Public vs Private Health Insurance Coverage by Age in Suisun City
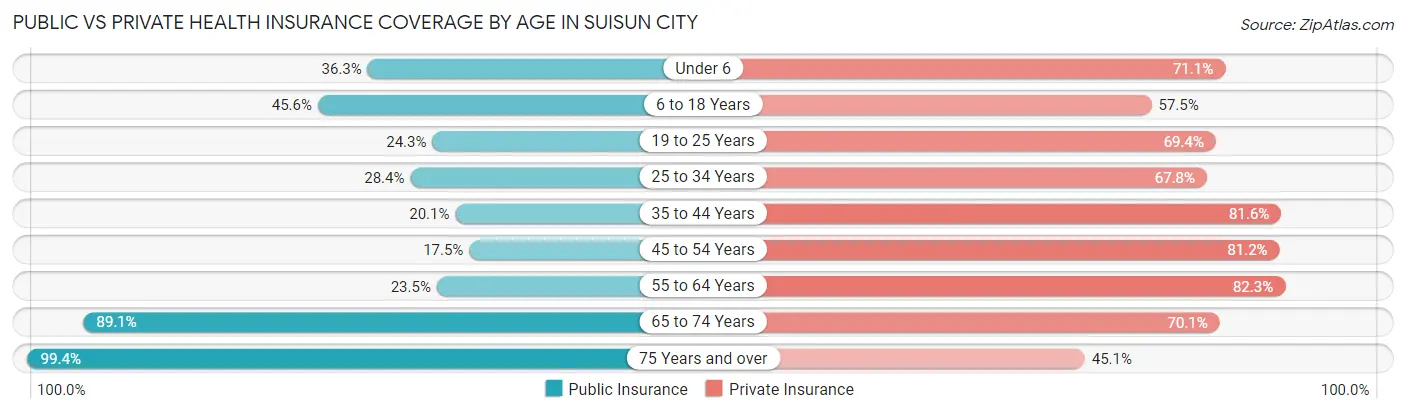
| Age Bracket | Public Insurance | Private Insurance |
| Under 6 | 707 (36.3%) | 1,384 (71.1%) |
| 6 to 18 Years | 2,490 (45.6%) | 3,141 (57.5%) |
| 19 to 25 Years | 726 (24.3%) | 2,071 (69.4%) |
| 25 to 34 Years | 1,014 (28.4%) | 2,418 (67.7%) |
| 35 to 44 Years | 745 (20.1%) | 3,028 (81.6%) |
| 45 to 54 Years | 653 (17.5%) | 3,034 (81.2%) |
| 55 to 64 Years | 853 (23.5%) | 2,986 (82.3%) |
| 65 to 74 Years | 2,287 (89.1%) | 1,800 (70.1%) |
| 75 Years and over | 1,400 (99.4%) | 635 (45.1%) |
| Total | 10,875 (37.5%) | 20,497 (70.6%) |
Disability Status by Sex by Age in Suisun City
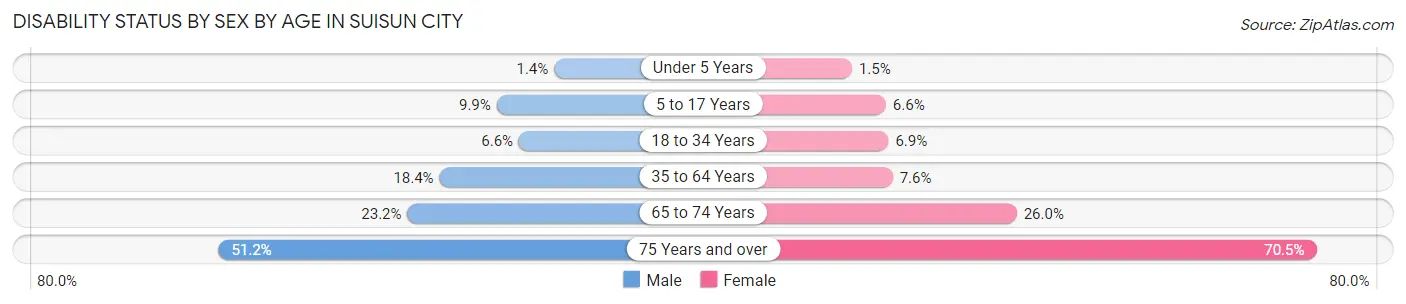
| Age Bracket | Male | Female |
| Under 5 Years | 12 (1.4%) | 11 (1.5%) |
| 5 to 17 Years | 315 (9.9%) | 147 (6.6%) |
| 18 to 34 Years | 230 (6.6%) | 239 (6.9%) |
| 35 to 64 Years | 999 (18.4%) | 427 (7.6%) |
| 65 to 74 Years | 287 (23.2%) | 345 (26.0%) |
| 75 Years and over | 274 (51.2%) | 615 (70.5%) |
Disability Class by Sex by Age in Suisun City
Disability Class: Hearing Difficulty
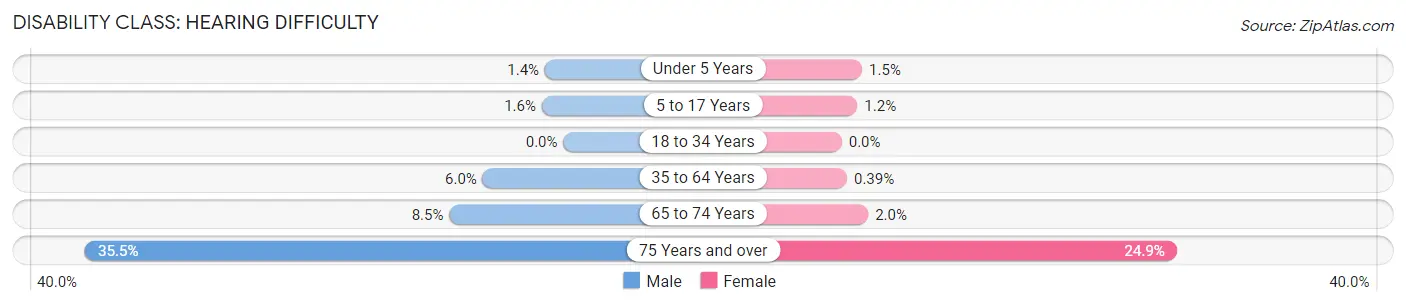
| Age Bracket | Male | Female |
| Under 5 Years | 12 (1.4%) | 11 (1.5%) |
| 5 to 17 Years | 51 (1.6%) | 26 (1.2%) |
| 18 to 34 Years | 0 (0.0%) | 0 (0.0%) |
| 35 to 64 Years | 325 (6.0%) | 22 (0.4%) |
| 65 to 74 Years | 105 (8.5%) | 26 (2.0%) |
| 75 Years and over | 190 (35.5%) | 217 (24.9%) |
Disability Class: Vision Difficulty
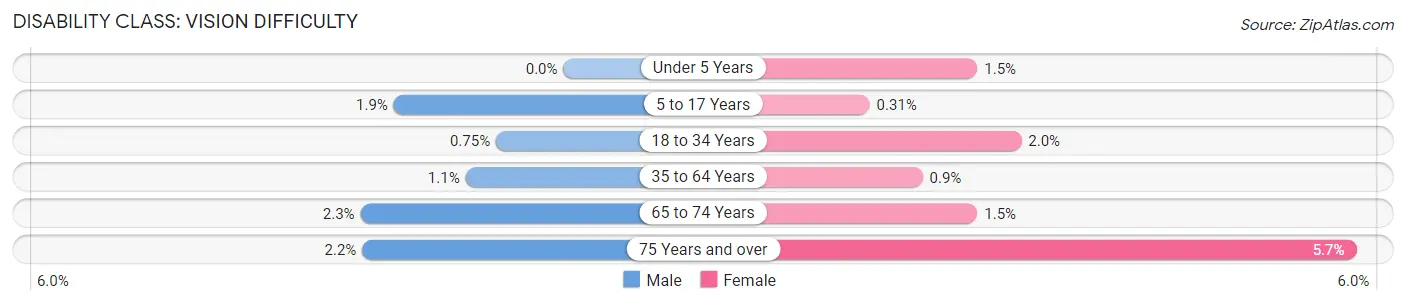
| Age Bracket | Male | Female |
| Under 5 Years | 0 (0.0%) | 11 (1.5%) |
| 5 to 17 Years | 60 (1.9%) | 7 (0.3%) |
| 18 to 34 Years | 26 (0.7%) | 69 (2.0%) |
| 35 to 64 Years | 59 (1.1%) | 51 (0.9%) |
| 65 to 74 Years | 28 (2.3%) | 20 (1.5%) |
| 75 Years and over | 12 (2.2%) | 50 (5.7%) |
Disability Class: Cognitive Difficulty
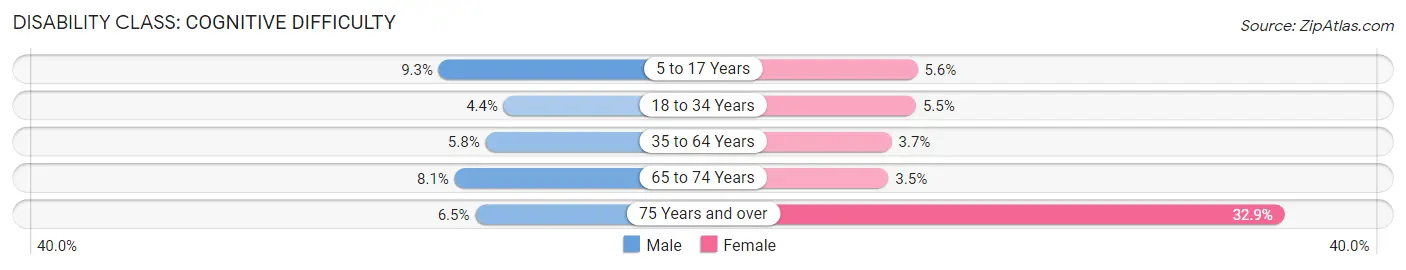
| Age Bracket | Male | Female |
| 5 to 17 Years | 294 (9.2%) | 126 (5.6%) |
| 18 to 34 Years | 154 (4.4%) | 190 (5.5%) |
| 35 to 64 Years | 314 (5.8%) | 209 (3.7%) |
| 65 to 74 Years | 100 (8.1%) | 46 (3.5%) |
| 75 Years and over | 35 (6.5%) | 287 (32.9%) |
Disability Class: Ambulatory Difficulty
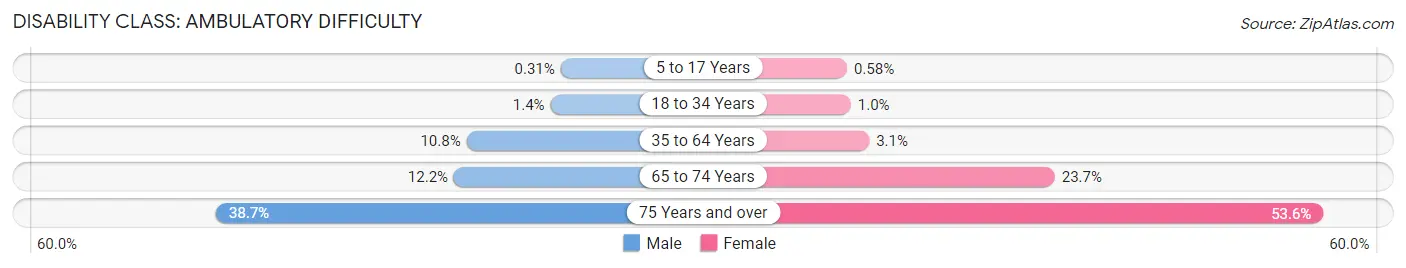
| Age Bracket | Male | Female |
| 5 to 17 Years | 10 (0.3%) | 13 (0.6%) |
| 18 to 34 Years | 50 (1.4%) | 35 (1.0%) |
| 35 to 64 Years | 586 (10.8%) | 172 (3.0%) |
| 65 to 74 Years | 151 (12.2%) | 315 (23.7%) |
| 75 Years and over | 207 (38.7%) | 468 (53.6%) |
Disability Class: Self-Care Difficulty
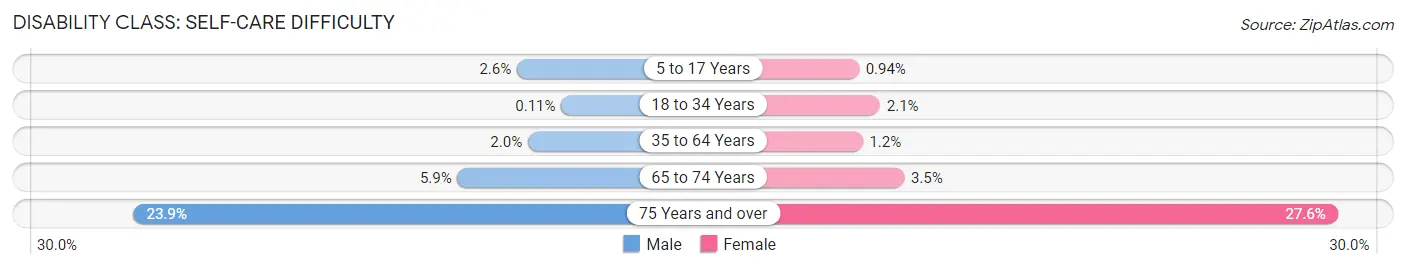
| Age Bracket | Male | Female |
| 5 to 17 Years | 82 (2.6%) | 21 (0.9%) |
| 18 to 34 Years | 4 (0.1%) | 73 (2.1%) |
| 35 to 64 Years | 107 (2.0%) | 65 (1.1%) |
| 65 to 74 Years | 73 (5.9%) | 46 (3.5%) |
| 75 Years and over | 128 (23.9%) | 241 (27.6%) |
Technology Access in Suisun City
Computing Device Access in Suisun City
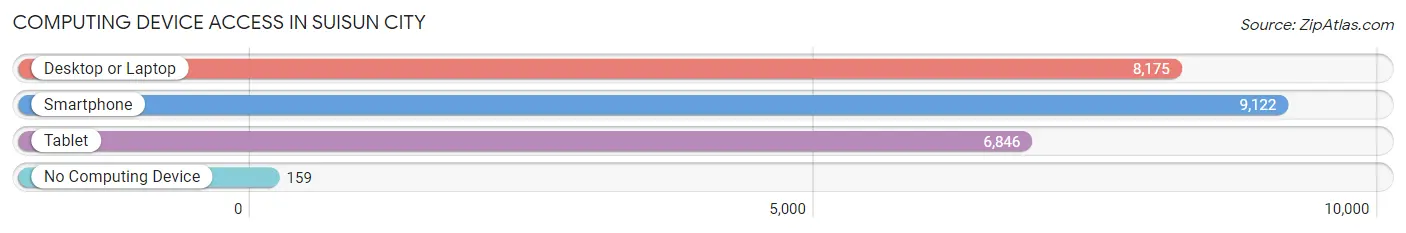
| Device Type | # Households | % Households |
| Desktop or Laptop | 8,175 | 84.7% |
| Smartphone | 9,122 | 94.5% |
| Tablet | 6,846 | 70.9% |
| No Computing Device | 159 | 1.7% |
| Total | 9,655 | 100.0% |
Internet Access in Suisun City
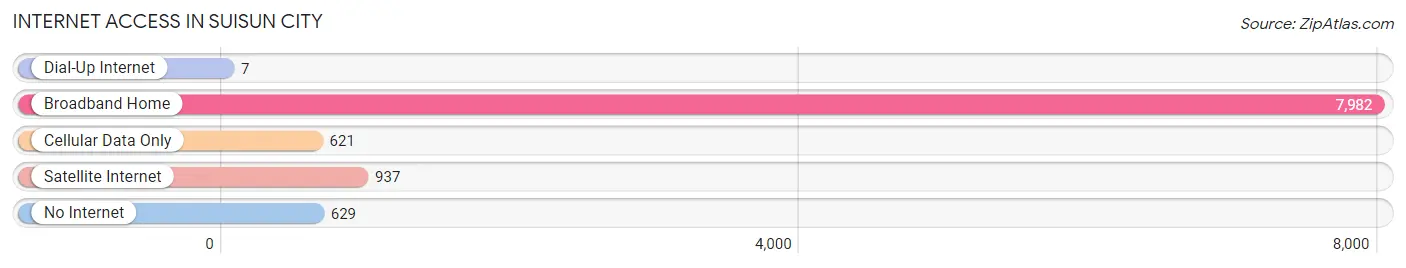
| Internet Type | # Households | % Households |
| Dial-Up Internet | 7 | 0.1% |
| Broadband Home | 7,982 | 82.7% |
| Cellular Data Only | 621 | 6.4% |
| Satellite Internet | 937 | 9.7% |
| No Internet | 629 | 6.5% |
| Total | 9,655 | 100.0% |
Suisun City Summary
Suisun City is a city located in Solano County, California, United States. It is located in the San Francisco Bay Area, about 30 miles northeast of San Francisco. The population was 28,111 at the 2010 census. The city takes its name from the adjacent Suisun Bay, which in turn is named for the Suisunes, an indigenous tribe of Native Americans.
History
The Suisun City area was first inhabited by the Suisunes, a Native American tribe of the Patwin people. The Suisunes lived in the area for thousands of years, and were known for their fishing and hunting skills. The first European settlers arrived in the area in the late 1700s, and the area was eventually incorporated as Suisun City in 1868.
The city was originally a small fishing village, but it grew rapidly in the late 1800s and early 1900s due to the growth of the nearby port of San Francisco. The city was also a major stop on the transcontinental railroad, and it became a popular destination for travelers.
In the early 1900s, the city was home to a large Chinese population, and it was also a major center for the canning industry. The city was also home to a large Japanese population, and it was the site of a major internment camp during World War II.
Geography
Suisun City is located in the northern part of Solano County, in the San Francisco Bay Area. It is situated on the eastern shore of Suisun Bay, which is part of the San Francisco Bay. The city is bordered by the cities of Fairfield to the north, Vacaville to the east, and Benicia to the south.
The city has a total area of 8.3 square miles, of which 8.2 square miles is land and 0.1 square miles is water. The city is located at an elevation of 30 feet above sea level.
Economy
The economy of Suisun City is largely based on the service industry, with many residents employed in retail, hospitality, and healthcare. The city is also home to a number of manufacturing and industrial businesses, including a large canning plant.
The city is home to Travis Air Force Base, which is a major employer in the area. The base is home to the 60th Air Mobility Wing, which is responsible for airlift operations in the western United States.
Demographics
As of the 2010 census, there were 28,111 people, 9,845 households, and 6,845 families residing in the city. The population density was 3,400.3 people per square mile. The racial makeup of the city was 57.2% White, 16.3% African American, 0.7% Native American, 11.2% Asian, 0.4% Pacific Islander, 9.3% from other races, and 5.1% from two or more races. Hispanic or Latino of any race were 20.6% of the population.
The median income for a household in the city was $60,945, and the median income for a family was $71,817. The per capita income for the city was $25,898. About 8.2% of families and 10.3% of the population were below the poverty line, including 14.2% of those under age 18 and 6.8% of those age 65 or over.
Common Questions
What is Per Capita Income in Suisun City?
Per Capita income in Suisun City is $36,348.
What is the Median Family Income in Suisun City?
Median Family Income in Suisun City is $108,848.
What is the Median Household income in Suisun City?
Median Household Income in Suisun City is $95,394.
What is Income or Wage Gap in Suisun City?
Income or Wage Gap in Suisun City is 22.4%.
Women in Suisun City earn 77.6 cents for every dollar earned by a man.
What is Family Income Deficit in Suisun City?
Family Income Deficit in Suisun City is $8,643.
Families that are below poverty line in Suisun City earn $8,643 less on average than the poverty threshold level.
What is Inequality or Gini Index in Suisun City?
Inequality or Gini Index in Suisun City is 0.38.
What is the Total Population of Suisun City?
Total Population of Suisun City is 29,350.
What is the Total Male Population of Suisun City?
Total Male Population of Suisun City is 14,946.
What is the Total Female Population of Suisun City?
Total Female Population of Suisun City is 14,404.
What is the Ratio of Males per 100 Females in Suisun City?
There are 103.76 Males per 100 Females in Suisun City.
What is the Ratio of Females per 100 Males in Suisun City?
There are 96.37 Females per 100 Males in Suisun City.
What is the Median Population Age in Suisun City?
Median Population Age in Suisun City is 36.0 Years.
What is the Average Family Size in Suisun City
Average Family Size in Suisun City is 3.6 People.
What is the Average Household Size in Suisun City
Average Household Size in Suisun City is 3.0 People.
How Large is the Labor Force in Suisun City?
There are 15,521 People in the Labor Forcein in Suisun City.
What is the Percentage of People in the Labor Force in Suisun City?
66.9% of People are in the Labor Force in Suisun City.
What is the Unemployment Rate in Suisun City?
Unemployment Rate in Suisun City is 6.9%.