Cities with the Highest Percentage of Black / African American Population in Utah
RELATED REPORTS & OPTIONS
Black / African American
Utah
Compare Cities
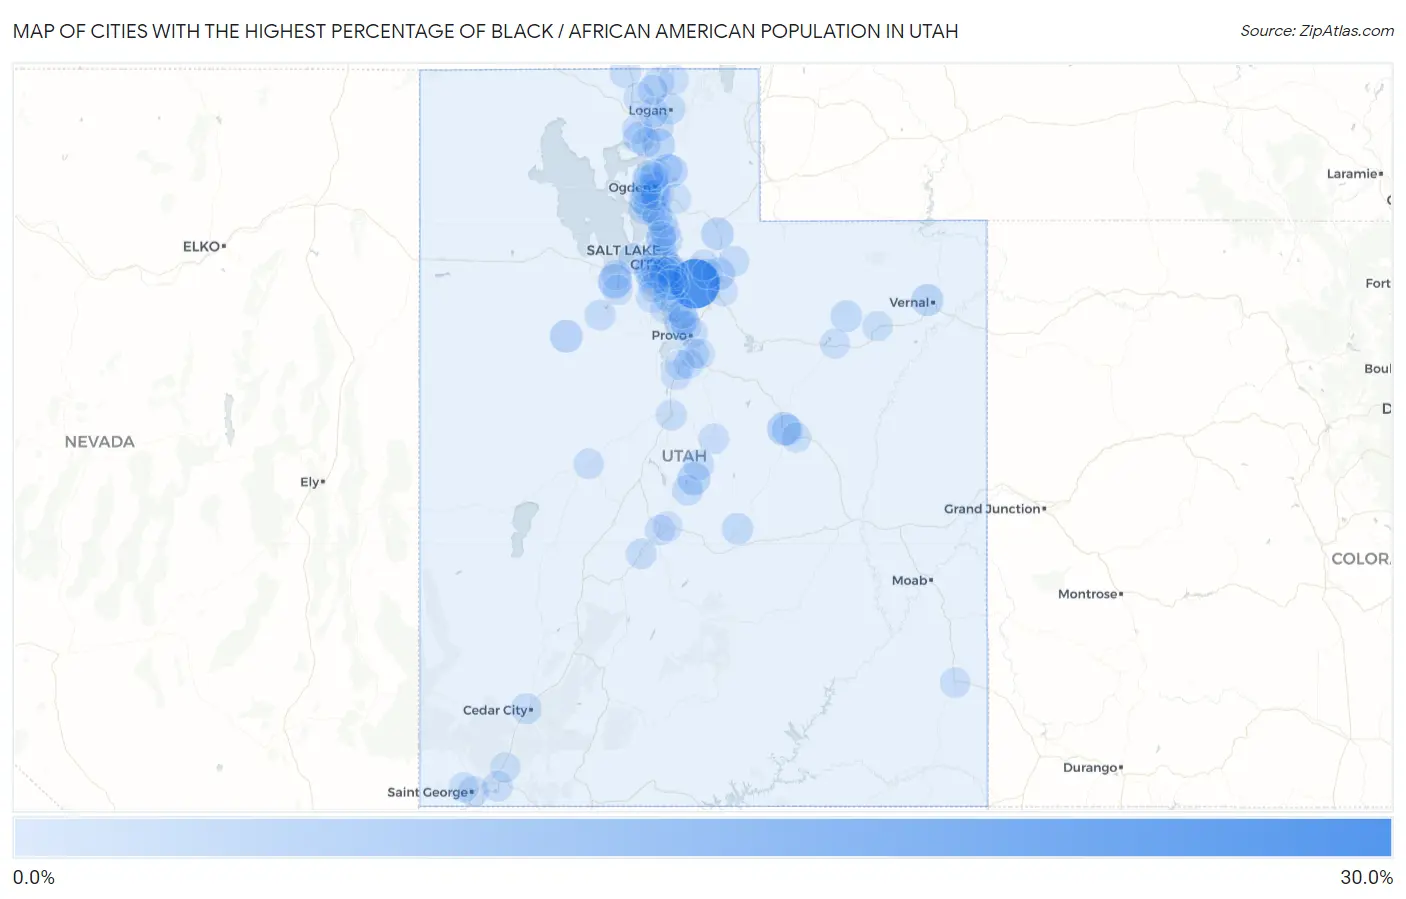
Map of Cities with the Highest Percentage of Black / African American Population in Utah
0.0%
30.0%
Cities with the Highest Percentage of Black / African American Population in Utah
| City | Black / African American | vs State | vs National | |
| 1. | Alta | 26.6% | 1.1%(+25.4)#1 | 12.5%(+14.1)#2,603 |
| 2. | Erda | 5.6% | 1.1%(+4.45)#2 | 12.5%(-6.87)#7,308 |
| 3. | South Salt Lake | 4.9% | 1.1%(+3.70)#3 | 12.5%(-7.62)#7,805 |
| 4. | West Wood | 4.6% | 1.1%(+3.40)#4 | 12.5%(-7.92)#8,046 |
| 5. | Manti | 4.0% | 1.1%(+2.85)#5 | 12.5%(-8.47)#8,556 |
| 6. | Dugway | 3.8% | 1.1%(+2.66)#6 | 12.5%(-8.66)#8,764 |
| 7. | Coalville | 3.6% | 1.1%(+2.43)#7 | 12.5%(-8.90)#9,000 |
| 8. | Wolf Creek | 3.5% | 1.1%(+2.32)#8 | 12.5%(-9.00)#9,114 |
| 9. | Mantua | 3.4% | 1.1%(+2.26)#9 | 12.5%(-9.06)#9,167 |
| 10. | Hideout | 3.4% | 1.1%(+2.23)#10 | 12.5%(-9.09)#9,209 |
| 11. | Clearfield | 3.2% | 1.1%(+2.06)#11 | 12.5%(-9.26)#9,414 |
| 12. | Maeser | 3.1% | 1.1%(+1.98)#12 | 12.5%(-9.34)#9,523 |
| 13. | Salt Lake City | 3.0% | 1.1%(+1.89)#13 | 12.5%(-9.43)#9,634 |
| 14. | Midvale | 2.9% | 1.1%(+1.72)#14 | 12.5%(-9.61)#9,870 |
| 15. | West Valley City | 2.5% | 1.1%(+1.35)#15 | 12.5%(-9.98)#10,398 |
| 16. | Millcreek | 2.4% | 1.1%(+1.29)#16 | 12.5%(-10.0)#10,492 |
| 17. | Kearns | 2.4% | 1.1%(+1.20)#17 | 12.5%(-10.1)#10,643 |
| 18. | Altamont | 2.3% | 1.1%(+1.16)#18 | 12.5%(-10.2)#10,715 |
| 19. | Marriott Slaterville | 2.2% | 1.1%(+1.06)#19 | 12.5%(-10.3)#10,899 |
| 20. | Corinne | 2.2% | 1.1%(+1.04)#20 | 12.5%(-10.3)#10,928 |
| 21. | Emery | 2.1% | 1.1%(+0.996)#21 | 12.5%(-10.3)#10,991 |
| 22. | Draper | 2.0% | 1.1%(+0.823)#22 | 12.5%(-10.5)#11,331 |
| 23. | Highland | 1.9% | 1.1%(+0.788)#23 | 12.5%(-10.5)#11,399 |
| 24. | Price | 1.8% | 1.1%(+0.650)#24 | 12.5%(-10.7)#11,663 |
| 25. | South Ogden | 1.8% | 1.1%(+0.648)#25 | 12.5%(-10.7)#11,666 |
| 26. | Layton | 1.8% | 1.1%(+0.632)#26 | 12.5%(-10.7)#11,702 |
| 27. | Ogden | 1.8% | 1.1%(+0.603)#27 | 12.5%(-10.7)#11,772 |
| 28. | Vineyard | 1.7% | 1.1%(+0.565)#28 | 12.5%(-10.8)#11,859 |
| 29. | Sterling | 1.7% | 1.1%(+0.542)#29 | 12.5%(-10.8)#11,918 |
| 30. | Holladay | 1.7% | 1.1%(+0.512)#30 | 12.5%(-10.8)#12,002 |
| 31. | Logan | 1.6% | 1.1%(+0.414)#31 | 12.5%(-10.9)#12,248 |
| 32. | Magna | 1.5% | 1.1%(+0.337)#32 | 12.5%(-11.0)#12,441 |
| 33. | Snyderville | 1.4% | 1.1%(+0.300)#33 | 12.5%(-11.0)#12,531 |
| 34. | Taylorsville | 1.4% | 1.1%(+0.296)#34 | 12.5%(-11.0)#12,541 |
| 35. | Portage | 1.4% | 1.1%(+0.287)#35 | 12.5%(-11.0)#12,570 |
| 36. | Granite | 1.4% | 1.1%(+0.274)#36 | 12.5%(-11.0)#12,608 |
| 37. | Syracuse | 1.4% | 1.1%(+0.251)#37 | 12.5%(-11.1)#12,655 |
| 38. | Murray | 1.4% | 1.1%(+0.250)#38 | 12.5%(-11.1)#12,660 |
| 39. | Rush Valley | 1.4% | 1.1%(+0.225)#39 | 12.5%(-11.1)#12,721 |
| 40. | West Jordan | 1.3% | 1.1%(+0.142)#40 | 12.5%(-11.2)#12,933 |
| 41. | Bountiful | 1.2% | 1.1%(+0.084)#41 | 12.5%(-11.2)#13,119 |
| 42. | Cedar City | 1.2% | 1.1%(+0.058)#42 | 12.5%(-11.3)#13,190 |
| 43. | Oakley | 1.2% | 1.1%(+0.056)#43 | 12.5%(-11.3)#13,197 |
| 44. | Nephi | 1.2% | 1.1%(+0.020)#44 | 12.5%(-11.3)#13,311 |
| 45. | Richfield | 1.1% | 1.1%(-0.004)#45 | 12.5%(-11.3)#13,381 |
| 46. | Ephraim | 1.1% | 1.1%(-0.033)#46 | 12.5%(-11.4)#13,491 |
| 47. | Woods Cross | 1.1% | 1.1%(-0.081)#47 | 12.5%(-11.4)#13,644 |
| 48. | Trenton | 1.1% | 1.1%(-0.090)#48 | 12.5%(-11.4)#13,674 |
| 49. | Hurricane | 1.1% | 1.1%(-0.095)#49 | 12.5%(-11.4)#13,693 |
| 50. | White | 1.0% | 1.1%(-0.124)#50 | 12.5%(-11.4)#13,798 |
| 51. | Mount Pleasant | 1.0% | 1.1%(-0.142)#51 | 12.5%(-11.5)#13,860 |
| 52. | Provo | 0.92% | 1.1%(-0.233)#52 | 12.5%(-11.6)#14,173 |
| 53. | Roy | 0.91% | 1.1%(-0.242)#53 | 12.5%(-11.6)#14,212 |
| 54. | Centerville | 0.90% | 1.1%(-0.246)#54 | 12.5%(-11.6)#14,229 |
| 55. | Bear River City | 0.90% | 1.1%(-0.250)#55 | 12.5%(-11.6)#14,241 |
| 56. | Sandy | 0.86% | 1.1%(-0.289)#56 | 12.5%(-11.6)#14,377 |
| 57. | Delta | 0.85% | 1.1%(-0.296)#57 | 12.5%(-11.6)#14,412 |
| 58. | Park City | 0.85% | 1.1%(-0.301)#58 | 12.5%(-11.6)#14,430 |
| 59. | Washington Terrace | 0.85% | 1.1%(-0.302)#59 | 12.5%(-11.6)#14,432 |
| 60. | Aurora | 0.78% | 1.1%(-0.369)#60 | 12.5%(-11.7)#14,672 |
| 61. | North Ogden | 0.78% | 1.1%(-0.370)#61 | 12.5%(-11.7)#14,683 |
| 62. | Fielding | 0.76% | 1.1%(-0.389)#62 | 12.5%(-11.7)#14,761 |
| 63. | Brigham City | 0.75% | 1.1%(-0.398)#63 | 12.5%(-11.7)#14,796 |
| 64. | Stansbury Park | 0.74% | 1.1%(-0.406)#64 | 12.5%(-11.7)#14,823 |
| 65. | Wellsville | 0.74% | 1.1%(-0.413)#65 | 12.5%(-11.7)#14,853 |
| 66. | Heber | 0.71% | 1.1%(-0.434)#66 | 12.5%(-11.8)#14,934 |
| 67. | Santaquin | 0.71% | 1.1%(-0.436)#67 | 12.5%(-11.8)#14,941 |
| 68. | Orem | 0.71% | 1.1%(-0.442)#68 | 12.5%(-11.8)#14,964 |
| 69. | St George | 0.70% | 1.1%(-0.452)#69 | 12.5%(-11.8)#15,007 |
| 70. | Mendon | 0.68% | 1.1%(-0.470)#70 | 12.5%(-11.8)#15,081 |
| 71. | Clinton | 0.68% | 1.1%(-0.473)#71 | 12.5%(-11.8)#15,093 |
| 72. | Tooele | 0.67% | 1.1%(-0.474)#72 | 12.5%(-11.8)#15,097 |
| 73. | Monticello | 0.67% | 1.1%(-0.480)#73 | 12.5%(-11.8)#15,118 |
| 74. | Newton | 0.67% | 1.1%(-0.482)#74 | 12.5%(-11.8)#15,127 |
| 75. | Farmington | 0.65% | 1.1%(-0.498)#75 | 12.5%(-11.8)#15,210 |
| 76. | Salem | 0.63% | 1.1%(-0.515)#76 | 12.5%(-11.8)#15,274 |
| 77. | Herriman | 0.63% | 1.1%(-0.516)#77 | 12.5%(-11.8)#15,281 |
| 78. | West Haven | 0.63% | 1.1%(-0.521)#78 | 12.5%(-11.8)#15,305 |
| 79. | Roosevelt | 0.60% | 1.1%(-0.553)#79 | 12.5%(-11.9)#15,438 |
| 80. | Spanish Fork | 0.59% | 1.1%(-0.558)#80 | 12.5%(-11.9)#15,465 |
| 81. | Liberty | 0.58% | 1.1%(-0.573)#81 | 12.5%(-11.9)#15,536 |
| 82. | Cottonwood Heights | 0.56% | 1.1%(-0.592)#82 | 12.5%(-11.9)#15,632 |
| 83. | Mapleton | 0.53% | 1.1%(-0.621)#83 | 12.5%(-11.9)#15,765 |
| 84. | Santa Clara | 0.51% | 1.1%(-0.637)#84 | 12.5%(-12.0)#15,841 |
| 85. | Harrisville | 0.49% | 1.1%(-0.656)#85 | 12.5%(-12.0)#15,916 |
| 86. | Lehi | 0.48% | 1.1%(-0.666)#86 | 12.5%(-12.0)#15,963 |
| 87. | Richmond | 0.48% | 1.1%(-0.670)#87 | 12.5%(-12.0)#15,975 |
| 88. | Payson | 0.48% | 1.1%(-0.670)#88 | 12.5%(-12.0)#15,976 |
| 89. | Duchesne | 0.48% | 1.1%(-0.670)#89 | 12.5%(-12.0)#15,979 |
| 90. | South Jordan | 0.47% | 1.1%(-0.681)#90 | 12.5%(-12.0)#16,022 |
| 91. | Toquerville | 0.44% | 1.1%(-0.706)#91 | 12.5%(-12.0)#16,132 |
| 92. | Farr West | 0.44% | 1.1%(-0.710)#92 | 12.5%(-12.0)#16,150 |
| 93. | Lindon | 0.44% | 1.1%(-0.713)#93 | 12.5%(-12.0)#16,167 |
| 94. | Kaysville | 0.42% | 1.1%(-0.733)#94 | 12.5%(-12.1)#16,269 |
| 95. | Mountain Green | 0.41% | 1.1%(-0.737)#95 | 12.5%(-12.1)#16,297 |
| 96. | Wellington | 0.40% | 1.1%(-0.750)#96 | 12.5%(-12.1)#16,369 |
| 97. | West Bountiful | 0.39% | 1.1%(-0.759)#97 | 12.5%(-12.1)#16,406 |
| 98. | Pleasant Grove | 0.38% | 1.1%(-0.767)#98 | 12.5%(-12.1)#16,453 |
| 99. | Salina | 0.36% | 1.1%(-0.788)#99 | 12.5%(-12.1)#16,557 |
| 100. | East Basin | 0.36% | 1.1%(-0.792)#100 | 12.5%(-12.1)#16,574 |
Common Questions
What are the Top 10 Cities with the Highest Percentage of Black / African American Population in Utah?
Top 10 Cities with the Highest Percentage of Black / African American Population in Utah are:
#1
26.6%
#2
5.6%
#3
4.9%
#4
4.6%
#5
4.0%
#6
3.8%
#7
3.6%
#8
3.5%
#9
3.4%
#10
3.4%
What city has the Highest Percentage of Black / African American Population in Utah?
Alta has the Highest Percentage of Black / African American Population in Utah with 26.6%.
What is the Percentage of Black / African American Population in the State of Utah?
Percentage of Black / African American Population in Utah is 1.1%.
What is the Percentage of Black / African American Population in the United States?
Percentage of Black / African American Population in the United States is 12.5%.