Cities with the Highest Percentage of Black / African American Population in Connecticut
RELATED REPORTS & OPTIONS
Black / African American
Connecticut
Compare Cities
Map of Cities with the Highest Percentage of Black / African American Population in Connecticut
0.0%
100.0%
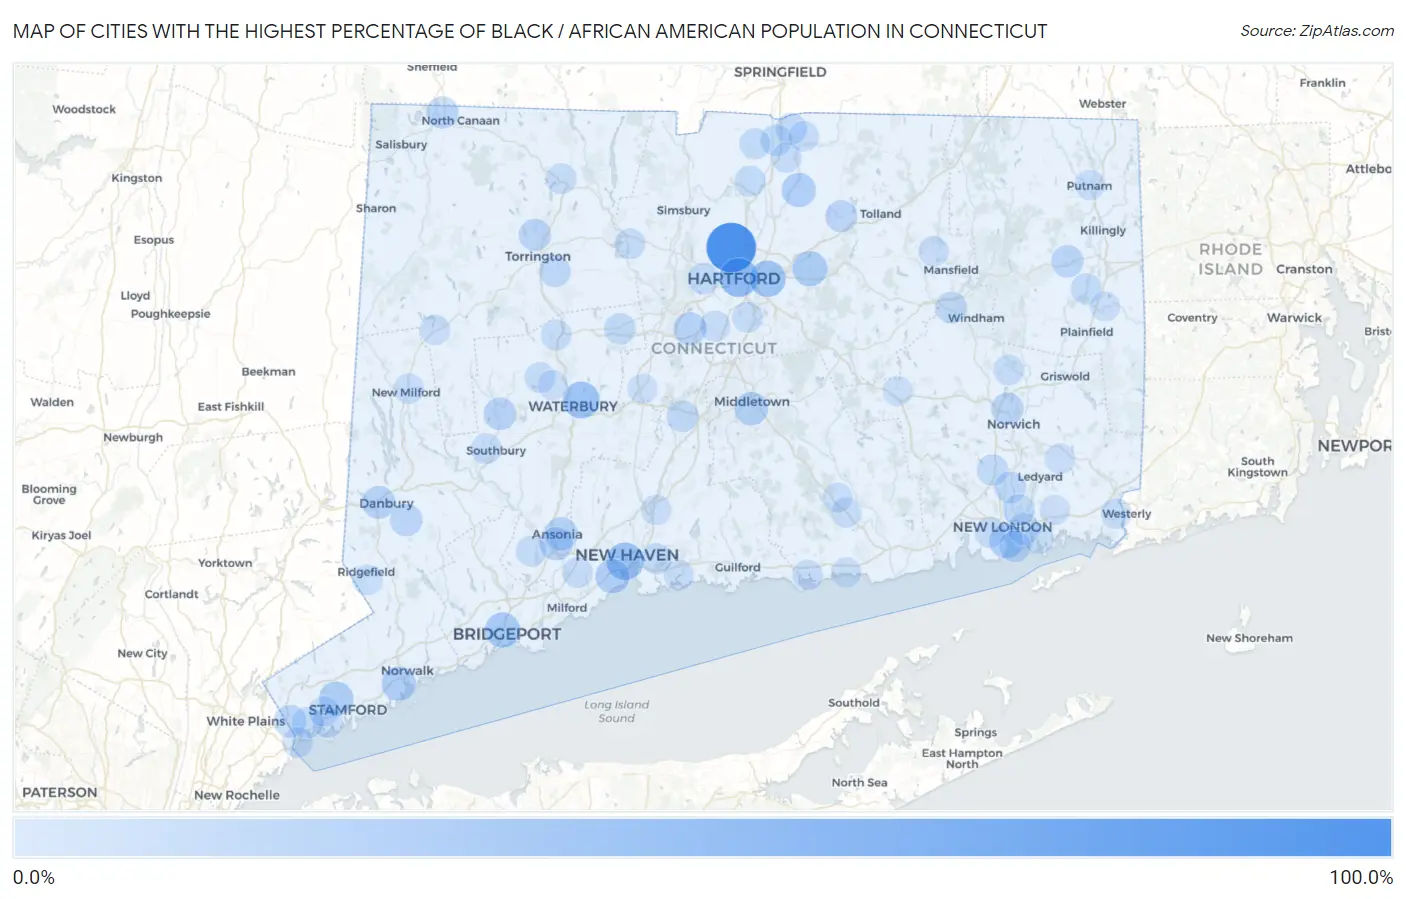
Cities with the Highest Percentage of Black / African American Population in Connecticut
| City | Black / African American | vs State | vs National | |
| 1. | Blue Hills | 80.2% | 10.7%(+69.5)#1 | 12.5%(+67.7)#388 |
| 2. | Hartford | 36.1% | 10.7%(+25.5)#2 | 12.5%(+23.7)#1,966 |
| 3. | New Haven | 29.9% | 10.7%(+19.2)#3 | 12.5%(+17.4)#2,362 |
| 4. | Waterbury | 28.0% | 10.7%(+17.3)#4 | 12.5%(+15.5)#2,510 |
| 5. | East Hartford | 26.3% | 10.7%(+15.6)#5 | 12.5%(+13.8)#2,621 |
| 6. | Bridgeport | 21.7% | 10.7%(+11.0)#6 | 12.5%(+9.21)#3,102 |
| 7. | Manchester | 20.7% | 10.7%(+10.0)#7 | 12.5%(+8.22)#3,224 |
| 8. | Stamford | 18.6% | 10.7%(+7.94)#8 | 12.5%(+6.14)#3,485 |
| 9. | Norwalk | 17.9% | 10.7%(+7.26)#9 | 12.5%(+5.46)#3,587 |
| 10. | West Haven | 17.7% | 10.7%(+7.08)#10 | 12.5%(+5.28)#3,612 |
| 11. | Broad Brook | 17.7% | 10.7%(+7.05)#11 | 12.5%(+5.25)#3,613 |
| 12. | New London | 17.0% | 10.7%(+6.34)#12 | 12.5%(+4.54)#3,740 |
| 13. | Middletown | 15.0% | 10.7%(+4.29)#13 | 12.5%(+2.49)#4,107 |
| 14. | Ansonia | 14.0% | 10.7%(+3.36)#14 | 12.5%(+1.56)#4,293 |
| 15. | Derby | 13.8% | 10.7%(+3.14)#15 | 12.5%(+1.34)#4,332 |
| 16. | Danbury | 13.3% | 10.7%(+2.64)#16 | 12.5%(+0.845)#4,443 |
| 17. | New Britain | 13.3% | 10.7%(+2.64)#17 | 12.5%(+0.843)#4,444 |
| 18. | Naugatuck Borough | 12.7% | 10.7%(+2.07)#18 | 12.5%(+0.271)#4,572 |
| 19. | Woodbury Center | 12.0% | 10.7%(+1.30)#19 | 12.5%(-0.498)#4,765 |
| 20. | Brooklyn | 11.4% | 10.7%(+0.727)#20 | 12.5%(-1.07)#4,901 |
| 21. | Stratford Downtown | 11.4% | 10.7%(+0.718)#21 | 12.5%(-1.08)#4,906 |
| 22. | Glenville | 10.9% | 10.7%(+0.221)#22 | 12.5%(-1.58)#5,048 |
| 23. | Cornwall | 10.8% | 10.7%(+0.171)#23 | 12.5%(-1.63)#5,064 |
| 24. | Bethel | 10.8% | 10.7%(+0.123)#24 | 12.5%(-1.67)#5,080 |
| 25. | Norwich | 10.8% | 10.7%(+0.123)#25 | 12.5%(-1.67)#5,081 |
| 26. | Torrington | 10.4% | 10.7%(-0.261)#26 | 12.5%(-2.06)#5,180 |
| 27. | Canaan | 10.3% | 10.7%(-0.399)#27 | 12.5%(-2.20)#5,234 |
| 28. | Rockville | 9.8% | 10.7%(-0.904)#28 | 12.5%(-2.70)#5,400 |
| 29. | Compo | 8.8% | 10.7%(-1.90)#29 | 12.5%(-3.70)#5,726 |
| 30. | Long Hill | 8.8% | 10.7%(-1.91)#30 | 12.5%(-3.71)#5,729 |
| 31. | Northwest Harwinton | 8.7% | 10.7%(-2.02)#31 | 12.5%(-3.82)#5,780 |
| 32. | Quinnipiac University | 8.6% | 10.7%(-2.02)#32 | 12.5%(-3.82)#5,782 |
| 33. | South Wilton | 8.4% | 10.7%(-2.27)#33 | 12.5%(-4.07)#5,886 |
| 34. | Gales Ferry | 8.2% | 10.7%(-2.50)#34 | 12.5%(-4.29)#5,968 |
| 35. | Meriden | 8.2% | 10.7%(-2.51)#35 | 12.5%(-4.30)#5,970 |
| 36. | Willimantic | 8.1% | 10.7%(-2.54)#36 | 12.5%(-4.34)#5,989 |
| 37. | Groton | 8.0% | 10.7%(-2.67)#37 | 12.5%(-4.47)#6,051 |
| 38. | West Hartford | 7.6% | 10.7%(-3.03)#38 | 12.5%(-4.83)#6,216 |
| 39. | Bristol | 7.6% | 10.7%(-3.05)#39 | 12.5%(-4.85)#6,222 |
| 40. | Conning Towers Nautilus Park | 7.3% | 10.7%(-3.33)#40 | 12.5%(-5.12)#6,348 |
| 41. | Oxoboxo River | 7.0% | 10.7%(-3.67)#41 | 12.5%(-5.47)#6,514 |
| 42. | Sherwood Manor | 6.7% | 10.7%(-3.94)#42 | 12.5%(-5.73)#6,650 |
| 43. | Thompsonville | 6.6% | 10.7%(-4.06)#43 | 12.5%(-5.86)#6,706 |
| 44. | Greenwich | 6.4% | 10.7%(-4.22)#44 | 12.5%(-6.02)#6,800 |
| 45. | Windsor Locks | 6.3% | 10.7%(-4.38)#45 | 12.5%(-6.18)#6,881 |
| 46. | Botsford | 6.1% | 10.7%(-4.54)#46 | 12.5%(-6.34)#6,983 |
| 47. | Suffield Depot | 5.8% | 10.7%(-4.84)#47 | 12.5%(-6.64)#7,155 |
| 48. | Ridgebury | 5.4% | 10.7%(-5.28)#48 | 12.5%(-7.07)#7,435 |
| 49. | Wauregan | 5.3% | 10.7%(-5.37)#49 | 12.5%(-7.17)#7,504 |
| 50. | East Haven | 5.2% | 10.7%(-5.48)#50 | 12.5%(-7.28)#7,587 |
| 51. | Thomaston | 5.1% | 10.7%(-5.55)#51 | 12.5%(-7.34)#7,624 |
| 52. | Winsted | 4.9% | 10.7%(-5.74)#52 | 12.5%(-7.54)#7,757 |
| 53. | Byram | 4.9% | 10.7%(-5.77)#53 | 12.5%(-7.57)#7,775 |
| 54. | Baltic | 4.9% | 10.7%(-5.80)#54 | 12.5%(-7.60)#7,796 |
| 55. | Watertown | 4.8% | 10.7%(-5.89)#55 | 12.5%(-7.69)#7,866 |
| 56. | Newington | 4.8% | 10.7%(-5.90)#56 | 12.5%(-7.70)#7,876 |
| 57. | Shelton | 4.7% | 10.7%(-5.93)#57 | 12.5%(-7.73)#7,907 |
| 58. | Danielson Borough | 4.7% | 10.7%(-6.01)#58 | 12.5%(-7.81)#7,960 |
| 59. | Collinsville | 4.4% | 10.7%(-6.25)#59 | 12.5%(-8.04)#8,174 |
| 60. | Riverside | 4.4% | 10.7%(-6.25)#60 | 12.5%(-8.05)#8,184 |
| 61. | Orange | 4.3% | 10.7%(-6.35)#61 | 12.5%(-8.15)#8,267 |
| 62. | Wethersfield | 4.3% | 10.7%(-6.37)#62 | 12.5%(-8.17)#8,284 |
| 63. | Heritage Village | 4.2% | 10.7%(-6.48)#63 | 12.5%(-8.28)#8,383 |
| 64. | Waterford | 4.2% | 10.7%(-6.49)#64 | 12.5%(-8.29)#8,394 |
| 65. | Southwood Acres | 4.1% | 10.7%(-6.53)#65 | 12.5%(-8.33)#8,440 |
| 66. | Pawcatuck | 4.1% | 10.7%(-6.60)#66 | 12.5%(-8.39)#8,491 |
| 67. | Bigelow Corners | 4.0% | 10.7%(-6.72)#67 | 12.5%(-8.52)#8,607 |
| 68. | Clinton | 3.9% | 10.7%(-6.75)#68 | 12.5%(-8.55)#8,643 |
| 69. | Route 7 Gateway | 3.9% | 10.7%(-6.81)#69 | 12.5%(-8.60)#8,708 |
| 70. | Mashantucket | 3.8% | 10.7%(-6.83)#70 | 12.5%(-8.62)#8,726 |
| 71. | Storrs | 3.8% | 10.7%(-6.86)#71 | 12.5%(-8.65)#8,752 |
| 72. | Fairfield University | 3.8% | 10.7%(-6.92)#72 | 12.5%(-8.72)#8,813 |
| 73. | Ridgefield | 3.7% | 10.7%(-7.01)#73 | 12.5%(-8.81)#8,907 |
| 74. | New Milford | 3.6% | 10.7%(-7.04)#74 | 12.5%(-8.83)#8,927 |
| 75. | Hazardville | 3.6% | 10.7%(-7.10)#75 | 12.5%(-8.89)#8,999 |
| 76. | Branford Center | 3.3% | 10.7%(-7.37)#76 | 12.5%(-9.16)#9,307 |
| 77. | North Haven | 3.3% | 10.7%(-7.39)#77 | 12.5%(-9.19)#9,334 |
| 78. | New Preston | 3.1% | 10.7%(-7.55)#78 | 12.5%(-9.35)#9,541 |
| 79. | Cos Cob | 3.0% | 10.7%(-7.66)#79 | 12.5%(-9.46)#9,673 |
| 80. | Sandy Hook | 3.0% | 10.7%(-7.69)#80 | 12.5%(-9.49)#9,719 |
| 81. | Weston | 2.9% | 10.7%(-7.79)#81 | 12.5%(-9.58)#9,847 |
| 82. | Litchfield Borough | 2.9% | 10.7%(-7.79)#82 | 12.5%(-9.59)#9,855 |
| 83. | Sacred Heart University | 2.8% | 10.7%(-7.91)#83 | 12.5%(-9.71)#10,003 |
| 84. | Trumbull Center | 2.7% | 10.7%(-8.01)#84 | 12.5%(-9.81)#10,147 |
| 85. | Putnam | 2.7% | 10.7%(-8.02)#85 | 12.5%(-9.82)#10,162 |
| 86. | Deep River Center | 2.6% | 10.7%(-8.08)#86 | 12.5%(-9.88)#10,258 |
| 87. | East | 2.6% | 10.7%(-8.09)#87 | 12.5%(-9.89)#10,285 |
| 88. | Colchester | 2.5% | 10.7%(-8.19)#88 | 12.5%(-9.98)#10,414 |
| 89. | Poquonock Bridge | 2.4% | 10.7%(-8.23)#89 | 12.5%(-10.0)#10,479 |
| 90. | Chester Center | 2.4% | 10.7%(-8.30)#90 | 12.5%(-10.1)#10,596 |
| 91. | Westbrook Center | 2.3% | 10.7%(-8.34)#91 | 12.5%(-10.1)#10,675 |
| 92. | Old Mystic | 2.3% | 10.7%(-8.37)#92 | 12.5%(-10.2)#10,714 |
| 93. | Moosup | 2.3% | 10.7%(-8.37)#93 | 12.5%(-10.2)#10,724 |
| 94. | Oakville | 2.3% | 10.7%(-8.40)#94 | 12.5%(-10.2)#10,784 |
| 95. | Witches Woods | 2.3% | 10.7%(-8.41)#95 | 12.5%(-10.2)#10,788 |
| 96. | Lordship | 2.3% | 10.7%(-8.41)#96 | 12.5%(-10.2)#10,797 |
| 97. | Plantsville | 2.2% | 10.7%(-8.46)#97 | 12.5%(-10.3)#10,896 |
| 98. | Inglenook | 2.1% | 10.7%(-8.55)#98 | 12.5%(-10.3)#11,024 |
| 99. | New Canaan | 2.1% | 10.7%(-8.57)#99 | 12.5%(-10.4)#11,072 |
| 100. | Noroton Heights | 1.9% | 10.7%(-8.78)#100 | 12.5%(-10.6)#11,478 |
Common Questions
What are the Top 10 Cities with the Highest Percentage of Black / African American Population in Connecticut?
Top 10 Cities with the Highest Percentage of Black / African American Population in Connecticut are:
#1
80.2%
#2
36.1%
#3
29.9%
#4
28.0%
#5
26.3%
#6
21.7%
#7
20.7%
#8
18.6%
#9
17.9%
#10
17.7%
What city has the Highest Percentage of Black / African American Population in Connecticut?
Blue Hills has the Highest Percentage of Black / African American Population in Connecticut with 80.2%.
What is the Percentage of Black / African American Population in the State of Connecticut?
Percentage of Black / African American Population in Connecticut is 10.7%.
What is the Percentage of Black / African American Population in the United States?
Percentage of Black / African American Population in the United States is 12.5%.