Marin City, CA Map & Demographics
Marin City Map
Marin City Overview
$66,053
PER CAPITA INCOME
$100,268
AVG FAMILY INCOME
$80,793
AVG HOUSEHOLD INCOME
33.0%
WAGE / INCOME GAP [ % ]
67.0¢/ $1
WAGE / INCOME GAP [ $ ]
0.55
INEQUALITY / GINI INDEX
3,419
TOTAL POPULATION
1,677
MALE POPULATION
1,742
FEMALE POPULATION
96.27
MALES / 100 FEMALES
103.88
FEMALES / 100 MALES
40.6
MEDIAN AGE
3.1
AVG FAMILY SIZE
2.4
AVG HOUSEHOLD SIZE
1,794
LABOR FORCE [ PEOPLE ]
64.8%
PERCENT IN LABOR FORCE
6.2%
UNEMPLOYMENT RATE
Income in Marin City
Income Overview in Marin City
Per Capita Income in Marin City is $66,053, while median incomes of families and households are $100,268 and $80,793 respectively.
| Characteristic | Number | Measure |
| Per Capita Income | 3,419 | $66,053 |
| Median Family Income | 847 | $100,268 |
| Mean Family Income | 847 | $175,390 |
| Median Household Income | 1,412 | $80,793 |
| Mean Household Income | 1,412 | $141,947 |
| Income Deficit | 847 | $0 |
| Wage / Income Gap (%) | 3,419 | 33.01% |
| Wage / Income Gap ($) | 3,419 | 66.99¢ per $1 |
| Gini / Inequality Index | 3,419 | 0.55 |
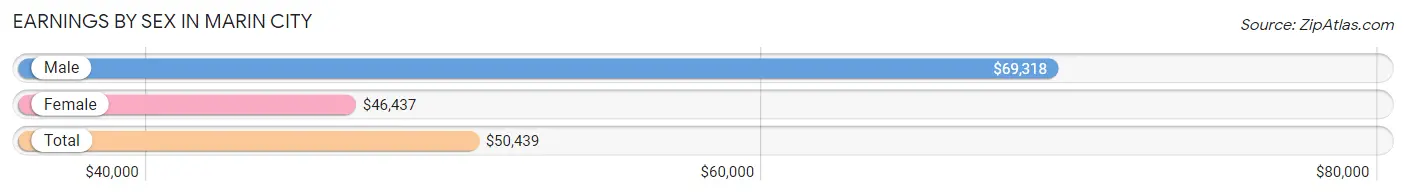
Earnings by Sex in Marin City
Average Earnings in Marin City are $50,439, $69,318 for men and $46,437 for women, a difference of 33.0%.
| Sex | Number | Average Earnings |
| Male | 892 (46.6%) | $69,318 |
| Female | 1,023 (53.4%) | $46,437 |
| Total | 1,915 (100.0%) | $50,439 |
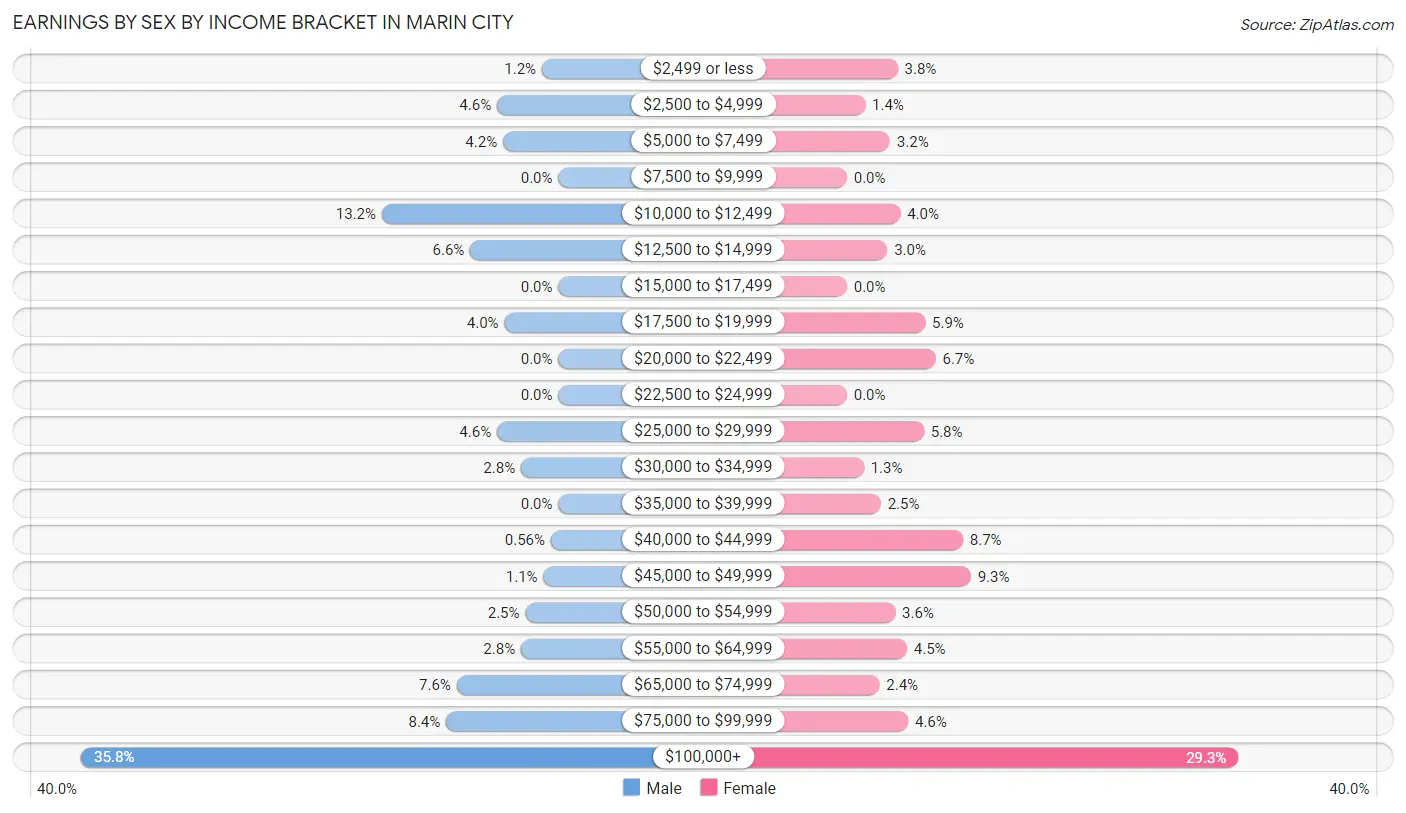
Earnings by Sex by Income Bracket in Marin City
The most common earnings brackets in Marin City are $100,000+ for men (319 | 35.8%) and $100,000+ for women (300 | 29.3%).
| Income | Male | Female |
| $2,499 or less | 11 (1.2%) | 39 (3.8%) |
| $2,500 to $4,999 | 41 (4.6%) | 14 (1.4%) |
| $5,000 to $7,499 | 37 (4.2%) | 33 (3.2%) |
| $7,500 to $9,999 | 0 (0.0%) | 0 (0.0%) |
| $10,000 to $12,499 | 118 (13.2%) | 41 (4.0%) |
| $12,500 to $14,999 | 59 (6.6%) | 31 (3.0%) |
| $15,000 to $17,499 | 0 (0.0%) | 0 (0.0%) |
| $17,500 to $19,999 | 36 (4.0%) | 60 (5.9%) |
| $20,000 to $22,499 | 0 (0.0%) | 68 (6.7%) |
| $22,500 to $24,999 | 0 (0.0%) | 0 (0.0%) |
| $25,000 to $29,999 | 41 (4.6%) | 59 (5.8%) |
| $30,000 to $34,999 | 25 (2.8%) | 13 (1.3%) |
| $35,000 to $39,999 | 0 (0.0%) | 26 (2.5%) |
| $40,000 to $44,999 | 5 (0.6%) | 89 (8.7%) |
| $45,000 to $49,999 | 10 (1.1%) | 95 (9.3%) |
| $50,000 to $54,999 | 22 (2.5%) | 37 (3.6%) |
| $55,000 to $64,999 | 25 (2.8%) | 46 (4.5%) |
| $65,000 to $74,999 | 68 (7.6%) | 25 (2.4%) |
| $75,000 to $99,999 | 75 (8.4%) | 47 (4.6%) |
| $100,000+ | 319 (35.8%) | 300 (29.3%) |
| Total | 892 (100.0%) | 1,023 (100.0%) |
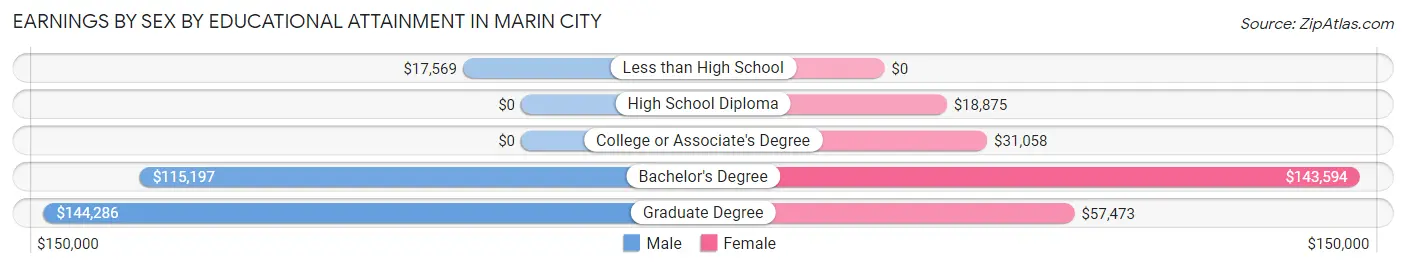
Earnings by Sex by Educational Attainment in Marin City
Average earnings in Marin City are $80,833 for men and $48,438 for women, a difference of 40.1%. Men with an educational attainment of graduate degree enjoy the highest average annual earnings of $144,286, while those with less than high school education earn the least with $17,569. Women with an educational attainment of bachelor's degree earn the most with the average annual earnings of $143,594, while those with high school diploma education have the smallest earnings of $18,875.
| Educational Attainment | Male Income | Female Income |
| Less than High School | $17,569 | $0 |
| High School Diploma | - | - |
| College or Associate's Degree | - | - |
| Bachelor's Degree | $115,197 | $143,594 |
| Graduate Degree | $144,286 | $57,473 |
| Total | $80,833 | $48,438 |
Family Income in Marin City
Family Income Brackets in Marin City
According to the Marin City family income data, there are 238 families falling into the $200,000+ income range, which is the most common income bracket and makes up 28.1% of all families.
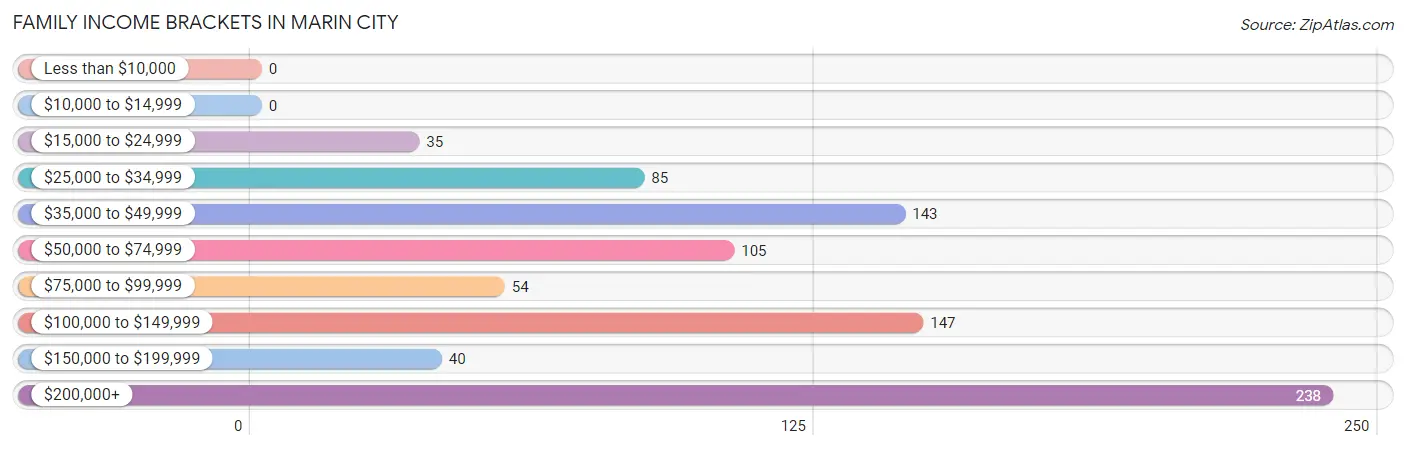
| Income Bracket | # Families | % Families |
| Less than $10,000 | 0 | 0.0% |
| $10,000 to $14,999 | 0 | 0.0% |
| $15,000 to $24,999 | 35 | 4.1% |
| $25,000 to $34,999 | 85 | 10.0% |
| $35,000 to $49,999 | 143 | 16.9% |
| $50,000 to $74,999 | 105 | 12.4% |
| $75,000 to $99,999 | 54 | 6.4% |
| $100,000 to $149,999 | 147 | 17.4% |
| $150,000 to $199,999 | 40 | 4.7% |
| $200,000+ | 238 | 28.1% |
Family Income by Famaliy Size in Marin City
3-person families (229 | 27.0%) account for the highest median family income in Marin City with $138,558 per family, while 2-person families (411 | 48.5%) have the highest median income of $50,848 per family member.
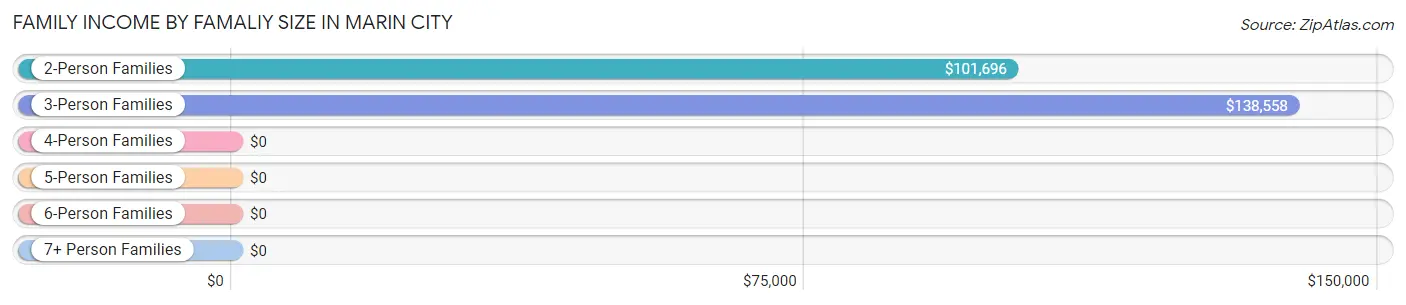
| Income Bracket | # Families | Median Income |
| 2-Person Families | 411 (48.5%) | $101,696 |
| 3-Person Families | 229 (27.0%) | $138,558 |
| 4-Person Families | 143 (16.9%) | $0 |
| 5-Person Families | 64 (7.6%) | $0 |
| 6-Person Families | 0 (0.0%) | $0 |
| 7+ Person Families | 0 (0.0%) | $0 |
| Total | 847 (100.0%) | $100,268 |
Family Income by Number of Earners in Marin City
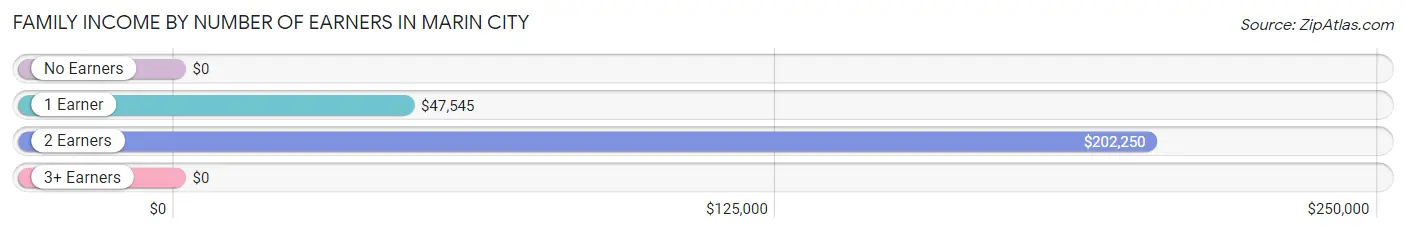
| Number of Earners | # Families | Median Income |
| No Earners | 25 (2.9%) | $0 |
| 1 Earner | 373 (44.0%) | $47,545 |
| 2 Earners | 418 (49.3%) | $202,250 |
| 3+ Earners | 31 (3.7%) | $0 |
| Total | 847 (100.0%) | $100,268 |
Household Income in Marin City
Household Income Brackets in Marin City
With 342 households falling in the category, the $200,000+ income range is the most frequent in Marin City, accounting for 24.2% of all households. In contrast, only 31 households (2.2%) fall into the less than $10,000 income bracket, making it the least populous group.
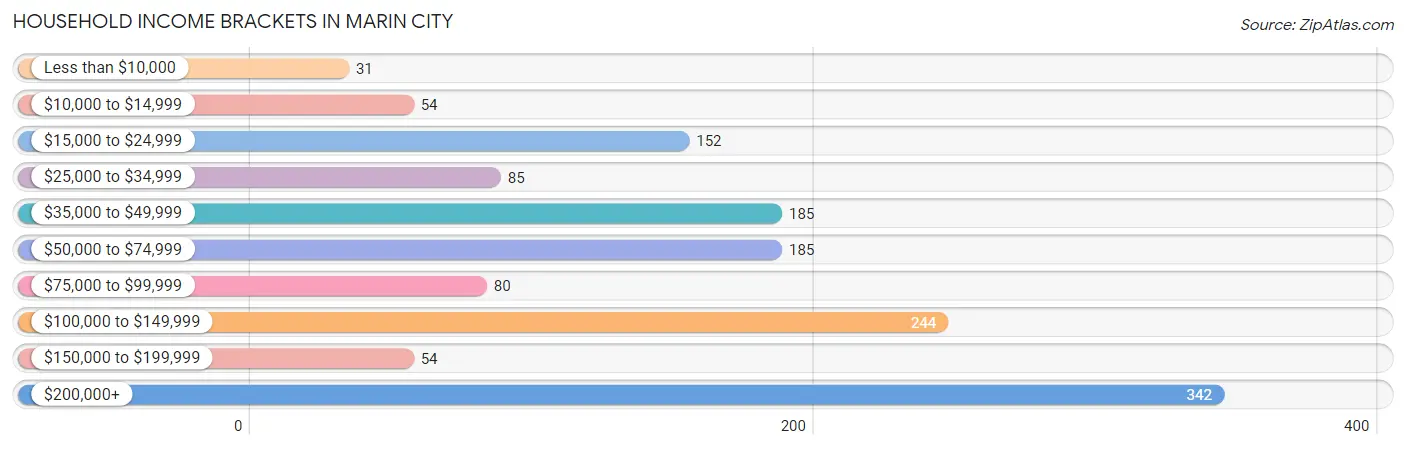
| Income Bracket | # Households | % Households |
| Less than $10,000 | 31 | 2.2% |
| $10,000 to $14,999 | 54 | 3.8% |
| $15,000 to $24,999 | 152 | 10.8% |
| $25,000 to $34,999 | 85 | 6.0% |
| $35,000 to $49,999 | 185 | 13.1% |
| $50,000 to $74,999 | 185 | 13.1% |
| $75,000 to $99,999 | 80 | 5.7% |
| $100,000 to $149,999 | 244 | 17.3% |
| $150,000 to $199,999 | 54 | 3.8% |
| $200,000+ | 342 | 24.2% |
Household Income by Householder Age in Marin City
The median household income in Marin City is $80,793, with the highest median household income of $110,365 found in the 25 to 44 years age bracket for the primary householder. A total of 473 households (33.5%) fall into this category. Meanwhile, the 15 to 24 years age bracket for the primary householder has the lowest median household income of $28,375, with 60 households (4.3%) in this group.
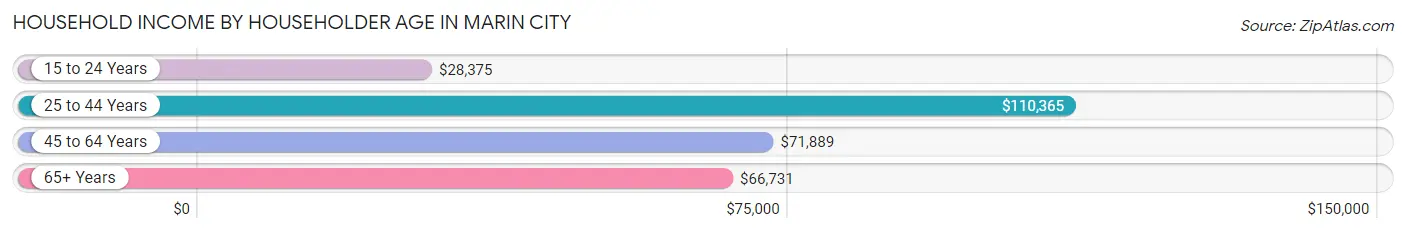
| Income Bracket | # Households | Median Income |
| 15 to 24 Years | 60 (4.3%) | $28,375 |
| 25 to 44 Years | 473 (33.5%) | $110,365 |
| 45 to 64 Years | 563 (39.9%) | $71,889 |
| 65+ Years | 316 (22.4%) | $66,731 |
| Total | 1,412 (100.0%) | $80,793 |
Poverty in Marin City
Income Below Poverty by Sex and Age in Marin City
With 6.8% poverty level for males and 11.4% for females among the residents of Marin City, 16 and 17 year old males and 6 to 11 year old females are the most vulnerable to poverty, with 26 males (30.9%) and 75 females (42.6%) in their respective age groups living below the poverty level.
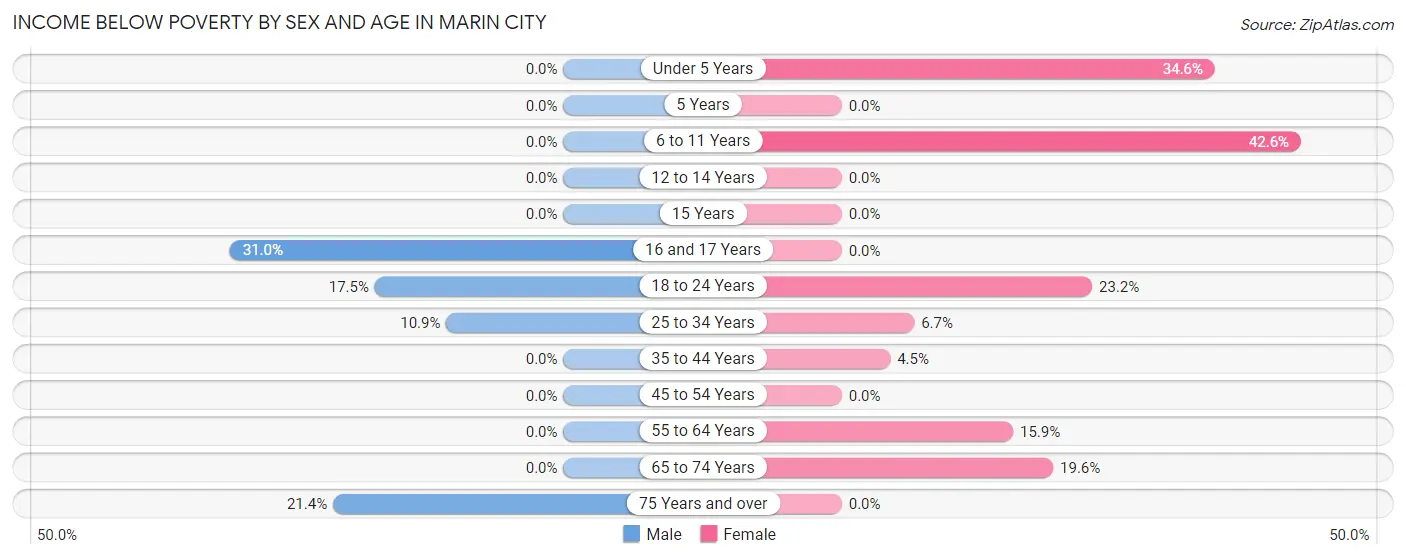
| Age Bracket | Male | Female |
| Under 5 Years | 0 (0.0%) | 18 (34.6%) |
| 5 Years | 0 (0.0%) | 0 (0.0%) |
| 6 to 11 Years | 0 (0.0%) | 75 (42.6%) |
| 12 to 14 Years | 0 (0.0%) | 0 (0.0%) |
| 15 Years | 0 (0.0%) | 0 (0.0%) |
| 16 and 17 Years | 26 (30.9%) | 0 (0.0%) |
| 18 to 24 Years | 28 (17.5%) | 23 (23.2%) |
| 25 to 34 Years | 29 (10.9%) | 17 (6.7%) |
| 35 to 44 Years | 0 (0.0%) | 12 (4.5%) |
| 45 to 54 Years | 0 (0.0%) | 0 (0.0%) |
| 55 to 64 Years | 0 (0.0%) | 34 (15.9%) |
| 65 to 74 Years | 0 (0.0%) | 20 (19.6%) |
| 75 Years and over | 31 (21.4%) | 0 (0.0%) |
| Total | 114 (6.8%) | 199 (11.4%) |
Income Above Poverty by Sex and Age in Marin City
According to the poverty statistics in Marin City, males aged under 5 years and females aged 5 years are the age groups that are most secure financially, with 100.0% of males and 100.0% of females in these age groups living above the poverty line.
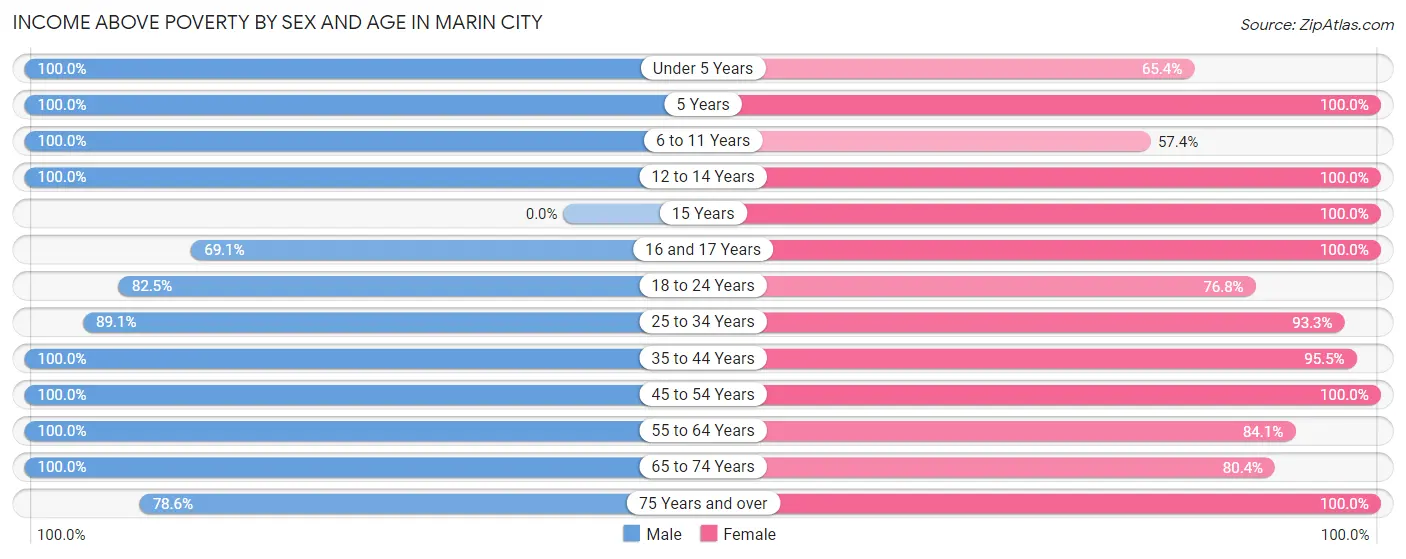
| Age Bracket | Male | Female |
| Under 5 Years | 159 (100.0%) | 34 (65.4%) |
| 5 Years | 22 (100.0%) | 20 (100.0%) |
| 6 to 11 Years | 127 (100.0%) | 101 (57.4%) |
| 12 to 14 Years | 48 (100.0%) | 32 (100.0%) |
| 15 Years | 0 (0.0%) | 14 (100.0%) |
| 16 and 17 Years | 58 (69.1%) | 24 (100.0%) |
| 18 to 24 Years | 132 (82.5%) | 76 (76.8%) |
| 25 to 34 Years | 238 (89.1%) | 236 (93.3%) |
| 35 to 44 Years | 118 (100.0%) | 255 (95.5%) |
| 45 to 54 Years | 330 (100.0%) | 304 (100.0%) |
| 55 to 64 Years | 61 (100.0%) | 180 (84.1%) |
| 65 to 74 Years | 156 (100.0%) | 82 (80.4%) |
| 75 Years and over | 114 (78.6%) | 185 (100.0%) |
| Total | 1,563 (93.2%) | 1,543 (88.6%) |
Income Below Poverty Among Married-Couple Families in Marin City
The poverty statistics for married-couple families in Marin City show that 3.4% or 14 of the total 407 families live below the poverty line. Families with 1 or 2 children have the highest poverty rate of 6.9%, comprising of 14 families. On the other hand, families with no children have the lowest poverty rate of 0.0%, which includes 0 families.
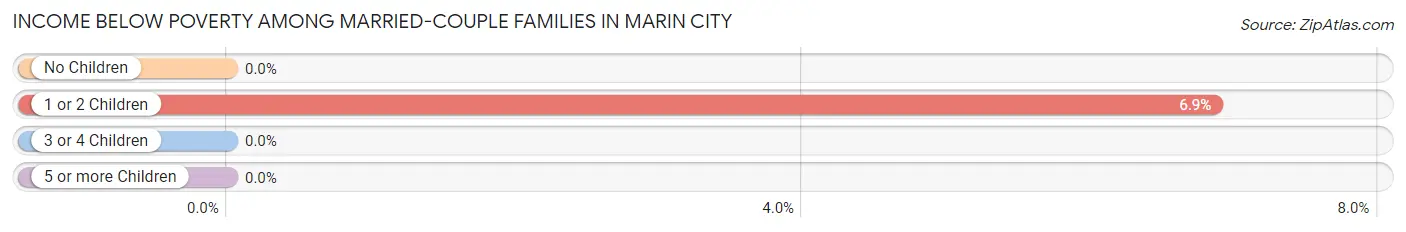
| Children | Above Poverty | Below Poverty |
| No Children | 203 (100.0%) | 0 (0.0%) |
| 1 or 2 Children | 190 (93.1%) | 14 (6.9%) |
| 3 or 4 Children | 0 (0.0%) | 0 (0.0%) |
| 5 or more Children | 0 (0.0%) | 0 (0.0%) |
| Total | 393 (96.6%) | 14 (3.4%) |
Income Below Poverty Among Single-Parent Households in Marin City
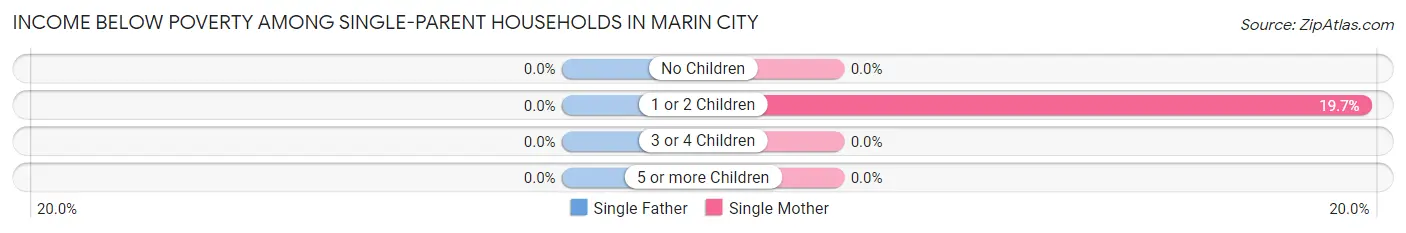
| Children | Single Father | Single Mother |
| No Children | 0 (0.0%) | 0 (0.0%) |
| 1 or 2 Children | 0 (0.0%) | 35 (19.7%) |
| 3 or 4 Children | 0 (0.0%) | 0 (0.0%) |
| 5 or more Children | 0 (0.0%) | 0 (0.0%) |
| Total | 0 (0.0%) | 35 (11.3%) |
Income Below Poverty Among Married-Couple vs Single-Parent Households in Marin City
The poverty data for Marin City shows that 14 of the married-couple family households (3.4%) and 35 of the single-parent households (8.0%) are living below the poverty level. Within the married-couple family households, those with 1 or 2 children have the highest poverty rate, with 14 households (6.9%) falling below the poverty line. Among the single-parent households, those with 1 or 2 children have the highest poverty rate, with 35 household (16.3%) living below poverty.
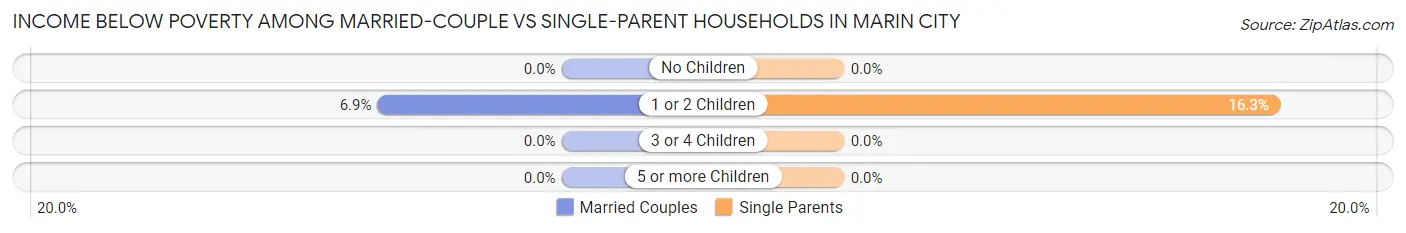
| Children | Married-Couple Families | Single-Parent Households |
| No Children | 0 (0.0%) | 0 (0.0%) |
| 1 or 2 Children | 14 (6.9%) | 35 (16.3%) |
| 3 or 4 Children | 0 (0.0%) | 0 (0.0%) |
| 5 or more Children | 0 (0.0%) | 0 (0.0%) |
| Total | 14 (3.4%) | 35 (8.0%) |
Race in Marin City
The most populous races in Marin City are White / Caucasian (1,412 | 41.3%), Black / African American (822 | 24.0%), and Asian (599 | 17.5%).
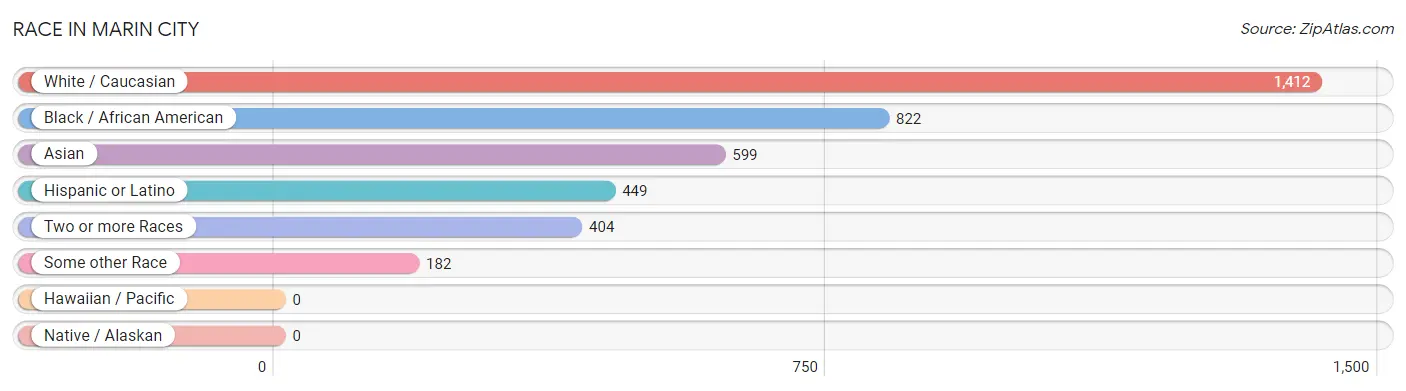
| Race | # Population | % Population |
| Asian | 599 | 17.5% |
| Black / African American | 822 | 24.0% |
| Hawaiian / Pacific | 0 | 0.0% |
| Hispanic or Latino | 449 | 13.1% |
| Native / Alaskan | 0 | 0.0% |
| White / Caucasian | 1,412 | 41.3% |
| Two or more Races | 404 | 11.8% |
| Some other Race | 182 | 5.3% |
| Total | 3,419 | 100.0% |
Ancestry in Marin City
The most populous ancestries reported in Marin City are Irish (372 | 10.9%), German (360 | 10.5%), Indian (Asian) (359 | 10.5%), Mexican (199 | 5.8%), and English (146 | 4.3%), together accounting for 42.0% of all Marin City residents.
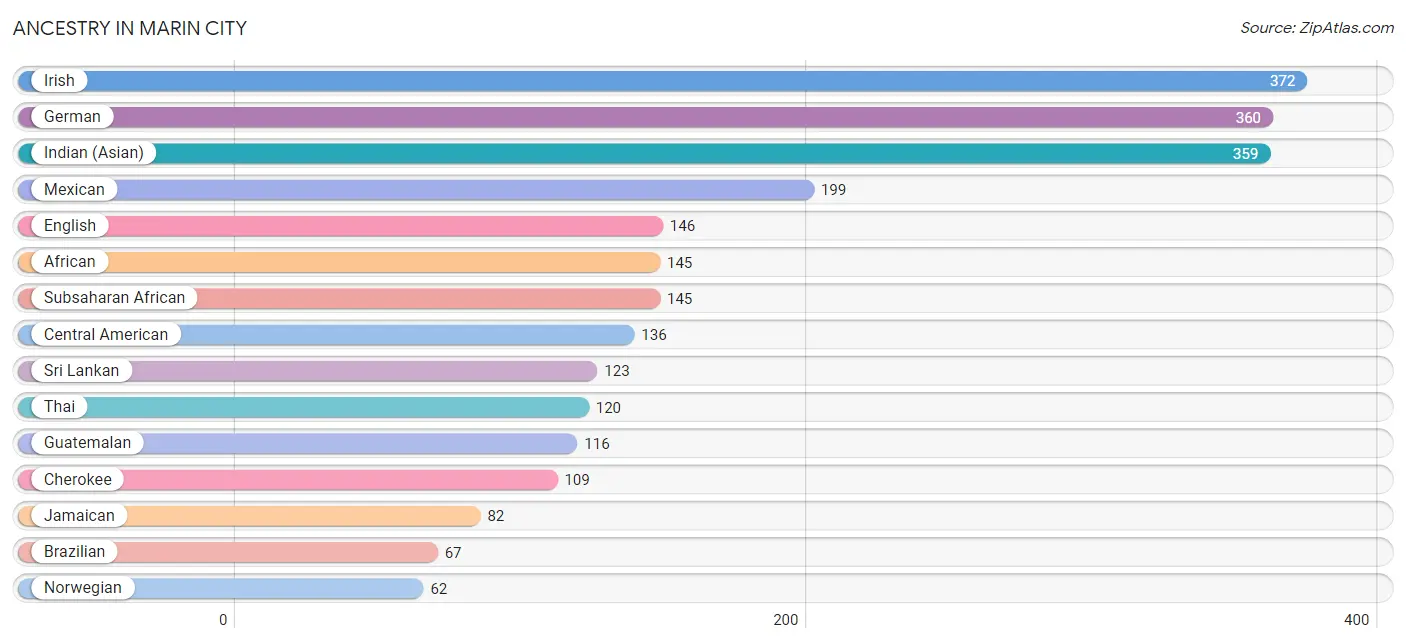
| Ancestry | # Population | % Population |
| African | 145 | 4.2% |
| Arab | 11 | 0.3% |
| Argentinean | 38 | 1.1% |
| Brazilian | 67 | 2.0% |
| British | 34 | 1.0% |
| Burmese | 60 | 1.8% |
| Central American | 136 | 4.0% |
| Cherokee | 109 | 3.2% |
| Dutch | 34 | 1.0% |
| Eastern European | 15 | 0.4% |
| English | 146 | 4.3% |
| European | 17 | 0.5% |
| French | 47 | 1.4% |
| German | 360 | 10.5% |
| Guatemalan | 116 | 3.4% |
| Hungarian | 13 | 0.4% |
| Indian (Asian) | 359 | 10.5% |
| Iranian | 27 | 0.8% |
| Irish | 372 | 10.9% |
| Italian | 30 | 0.9% |
| Jamaican | 82 | 2.4% |
| Korean | 38 | 1.1% |
| Lithuanian | 45 | 1.3% |
| Mexican | 199 | 5.8% |
| Norwegian | 62 | 1.8% |
| Polish | 47 | 1.4% |
| Portuguese | 15 | 0.4% |
| Russian | 13 | 0.4% |
| Salvadoran | 20 | 0.6% |
| Scandinavian | 14 | 0.4% |
| Scottish | 46 | 1.3% |
| South American | 38 | 1.1% |
| Sri Lankan | 123 | 3.6% |
| Subsaharan African | 145 | 4.2% |
| Swedish | 36 | 1.1% |
| Swiss | 17 | 0.5% |
| Syrian | 11 | 0.3% |
| Thai | 120 | 3.5% |
| Welsh | 16 | 0.5% | View All 39 Rows |
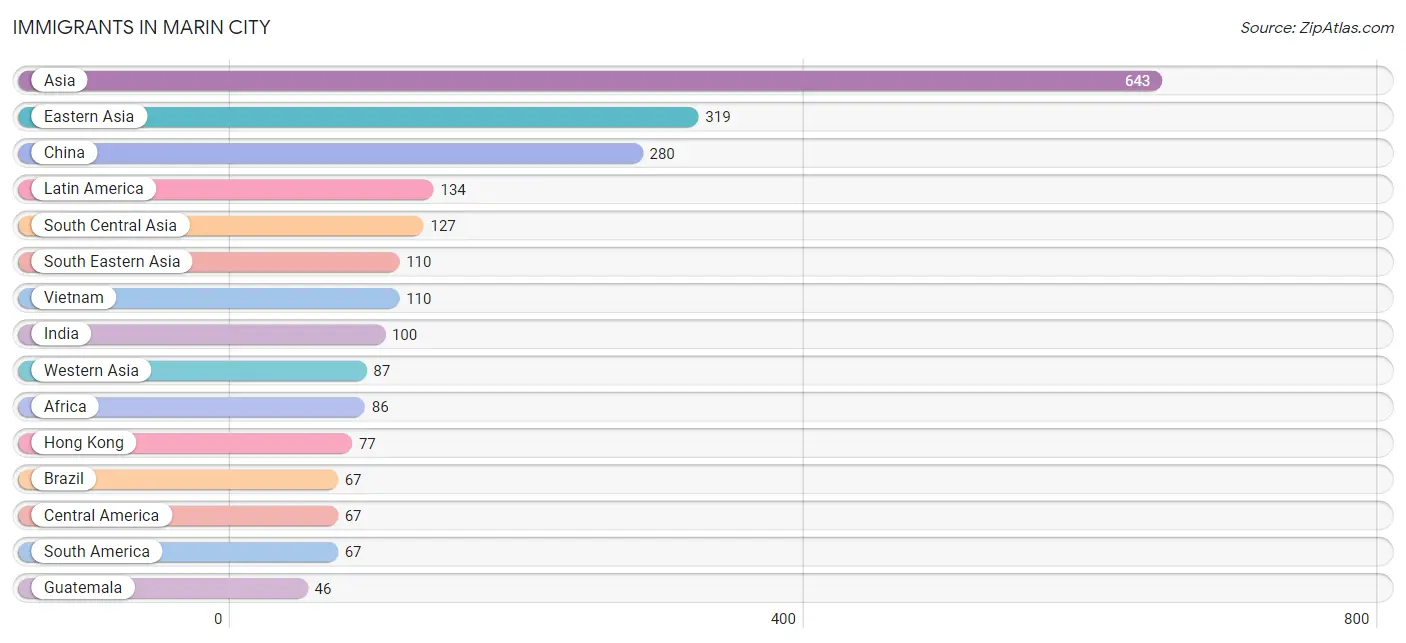
Immigrants in Marin City
The most numerous immigrant groups reported in Marin City came from Asia (643 | 18.8%), Eastern Asia (319 | 9.3%), China (280 | 8.2%), Latin America (134 | 3.9%), and South Central Asia (127 | 3.7%), together accounting for 44.0% of all Marin City residents.
| Immigration Origin | # Population | % Population |
| Africa | 86 | 2.5% |
| Asia | 643 | 18.8% |
| Brazil | 67 | 2.0% |
| Central America | 67 | 2.0% |
| China | 280 | 8.2% |
| Eastern Asia | 319 | 9.3% |
| Eastern Europe | 16 | 0.5% |
| Europe | 32 | 0.9% |
| Germany | 16 | 0.5% |
| Guatemala | 46 | 1.3% |
| Hong Kong | 77 | 2.2% |
| India | 100 | 2.9% |
| Iran | 27 | 0.8% |
| Korea | 39 | 1.1% |
| Kuwait | 44 | 1.3% |
| Latin America | 134 | 3.9% |
| Mexico | 21 | 0.6% |
| Nigeria | 40 | 1.2% |
| Northern Africa | 24 | 0.7% |
| South Africa | 22 | 0.6% |
| South America | 67 | 2.0% |
| South Central Asia | 127 | 3.7% |
| South Eastern Asia | 110 | 3.2% |
| Sudan | 24 | 0.7% |
| Vietnam | 110 | 3.2% |
| Western Africa | 40 | 1.2% |
| Western Asia | 87 | 2.5% |
| Western Europe | 16 | 0.5% | View All 28 Rows |
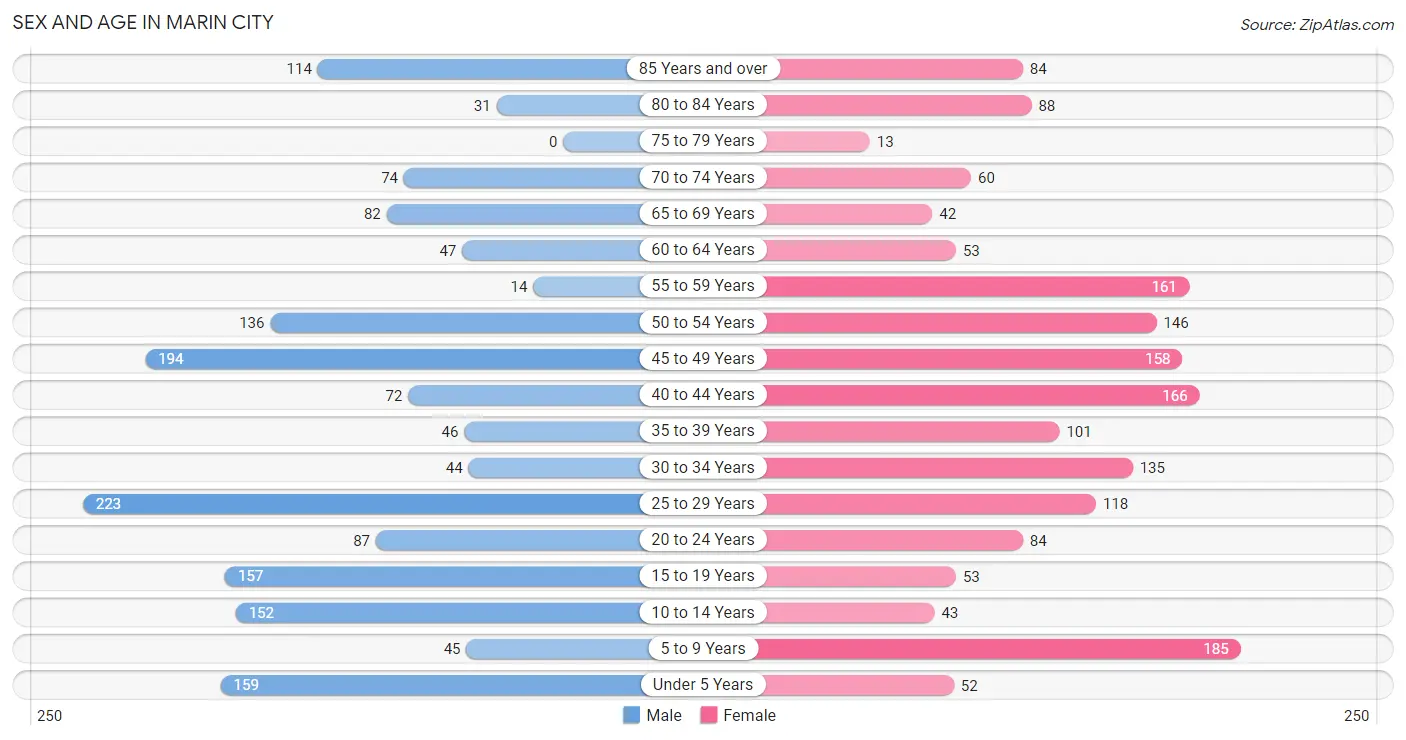
Sex and Age in Marin City
Sex and Age in Marin City
The most populous age groups in Marin City are 25 to 29 Years (223 | 13.3%) for men and 5 to 9 Years (185 | 10.6%) for women.
| Age Bracket | Male | Female |
| Under 5 Years | 159 (9.5%) | 52 (3.0%) |
| 5 to 9 Years | 45 (2.7%) | 185 (10.6%) |
| 10 to 14 Years | 152 (9.1%) | 43 (2.5%) |
| 15 to 19 Years | 157 (9.4%) | 53 (3.0%) |
| 20 to 24 Years | 87 (5.2%) | 84 (4.8%) |
| 25 to 29 Years | 223 (13.3%) | 118 (6.8%) |
| 30 to 34 Years | 44 (2.6%) | 135 (7.7%) |
| 35 to 39 Years | 46 (2.7%) | 101 (5.8%) |
| 40 to 44 Years | 72 (4.3%) | 166 (9.5%) |
| 45 to 49 Years | 194 (11.6%) | 158 (9.1%) |
| 50 to 54 Years | 136 (8.1%) | 146 (8.4%) |
| 55 to 59 Years | 14 (0.8%) | 161 (9.2%) |
| 60 to 64 Years | 47 (2.8%) | 53 (3.0%) |
| 65 to 69 Years | 82 (4.9%) | 42 (2.4%) |
| 70 to 74 Years | 74 (4.4%) | 60 (3.4%) |
| 75 to 79 Years | 0 (0.0%) | 13 (0.7%) |
| 80 to 84 Years | 31 (1.8%) | 88 (5.1%) |
| 85 Years and over | 114 (6.8%) | 84 (4.8%) |
| Total | 1,677 (100.0%) | 1,742 (100.0%) |
Families and Households in Marin City
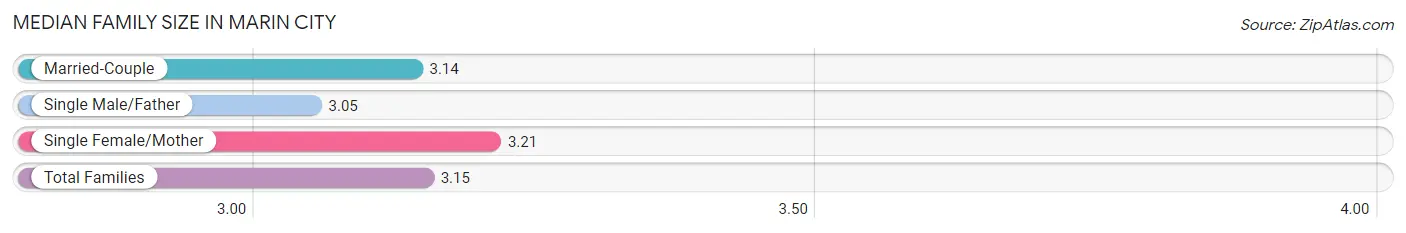
Median Family Size in Marin City
The median family size in Marin City is 3.15 persons per family, with single female/mother families (310 | 36.6%) accounting for the largest median family size of 3.21 persons per family. On the other hand, single male/father families (130 | 15.3%) represent the smallest median family size with 3.05 persons per family.
| Family Type | # Families | Family Size |
| Married-Couple | 407 (48.0%) | 3.14 |
| Single Male/Father | 130 (15.3%) | 3.05 |
| Single Female/Mother | 310 (36.6%) | 3.21 |
| Total Families | 847 (100.0%) | 3.15 |
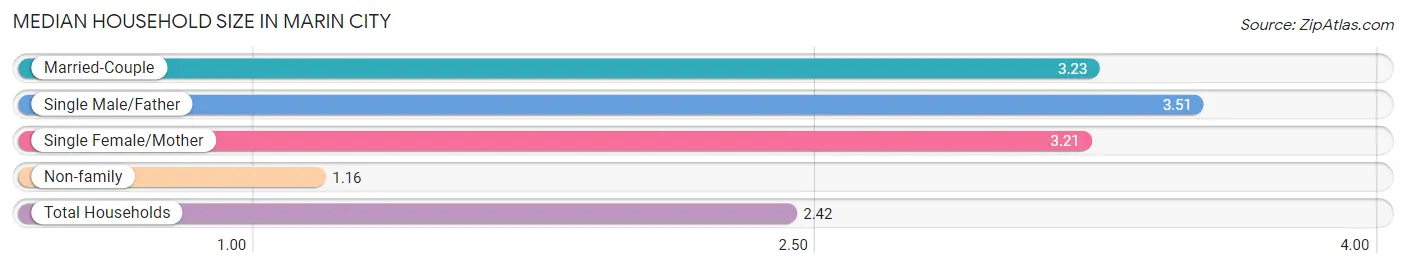
Median Household Size in Marin City
The median household size in Marin City is 2.42 persons per household, with single male/father households (130 | 9.2%) accounting for the largest median household size of 3.51 persons per household. non-family households (565 | 40.0%) represent the smallest median household size with 1.16 persons per household.
| Household Type | # Households | Household Size |
| Married-Couple | 407 (28.8%) | 3.23 |
| Single Male/Father | 130 (9.2%) | 3.51 |
| Single Female/Mother | 310 (22.0%) | 3.21 |
| Non-family | 565 (40.0%) | 1.16 |
| Total Households | 1,412 (100.0%) | 2.42 |
Household Size by Marriage Status in Marin City
Out of a total of 1,412 households in Marin City, 847 (60.0%) are family households, while 565 (40.0%) are nonfamily households. The most numerous type of family households are 2-person households, comprising 397, and the most common type of nonfamily households are 1-person households, comprising 489.
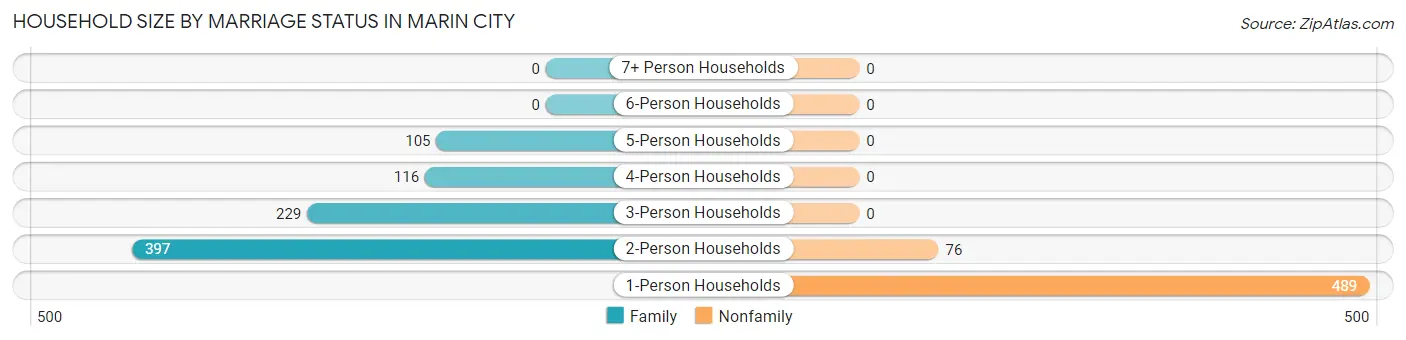
| Household Size | Family Households | Nonfamily Households |
| 1-Person Households | - | 489 (34.6%) |
| 2-Person Households | 397 (28.1%) | 76 (5.4%) |
| 3-Person Households | 229 (16.2%) | 0 (0.0%) |
| 4-Person Households | 116 (8.2%) | 0 (0.0%) |
| 5-Person Households | 105 (7.4%) | 0 (0.0%) |
| 6-Person Households | 0 (0.0%) | 0 (0.0%) |
| 7+ Person Households | 0 (0.0%) | 0 (0.0%) |
| Total | 847 (60.0%) | 565 (40.0%) |
Female Fertility in Marin City
Fertility by Age in Marin City
Average fertility rate in Marin City is 12.0 births per 1,000 women. Women in the age bracket of 20 to 34 years have the highest fertility rate with 30.0 births per 1,000 women. Women in the age bracket of 20 to 34 years acount for 100.0% of all women with births.
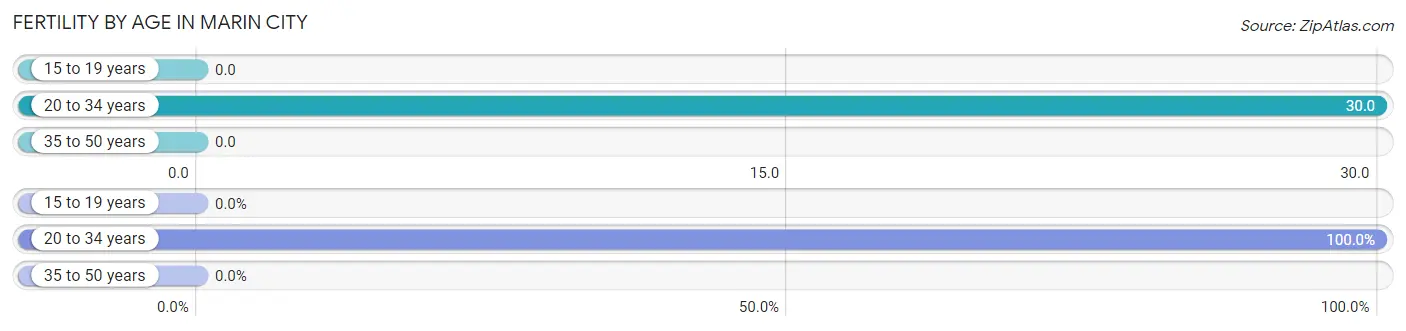
| Age Bracket | Women with Births | Births / 1,000 Women |
| 15 to 19 years | 0 (0.0%) | 0.0 |
| 20 to 34 years | 10 (100.0%) | 30.0 |
| 35 to 50 years | 0 (0.0%) | 0.0 |
| Total | 10 (100.0%) | 12.0 |
Fertility by Age by Marriage Status in Marin City
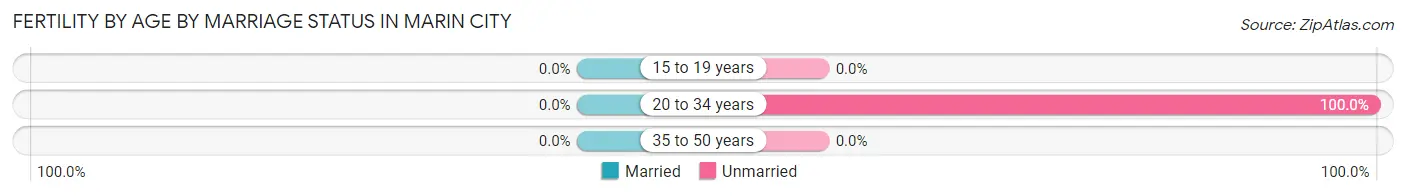
| Age Bracket | Married | Unmarried |
| 15 to 19 years | 0 (0.0%) | 0 (0.0%) |
| 20 to 34 years | 0 (0.0%) | 10 (100.0%) |
| 35 to 50 years | 0 (0.0%) | 0 (0.0%) |
| Total | 0 (0.0%) | 10 (100.0%) |
Fertility by Education in Marin City
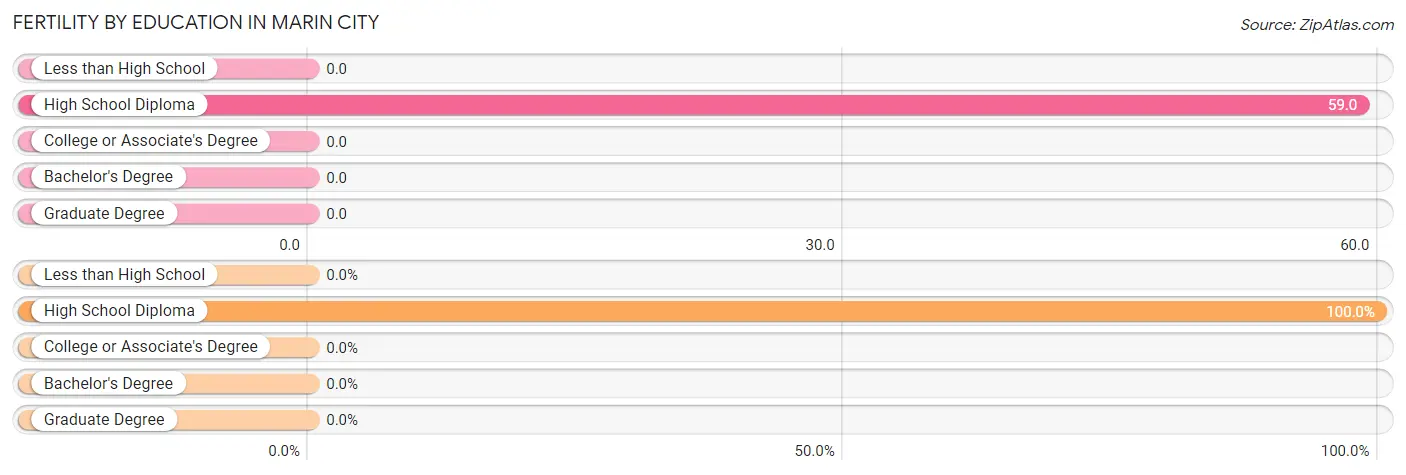
| Educational Attainment | Women with Births | Births / 1,000 Women |
| Less than High School | 0 (0.0%) | 0.0 |
| High School Diploma | 10 (100.0%) | 59.0 |
| College or Associate's Degree | 0 (0.0%) | 0.0 |
| Bachelor's Degree | 0 (0.0%) | 0.0 |
| Graduate Degree | 0 (0.0%) | 0.0 |
| Total | 10 (100.0%) | 12.0 |
Fertility by Education by Marriage Status in Marin City
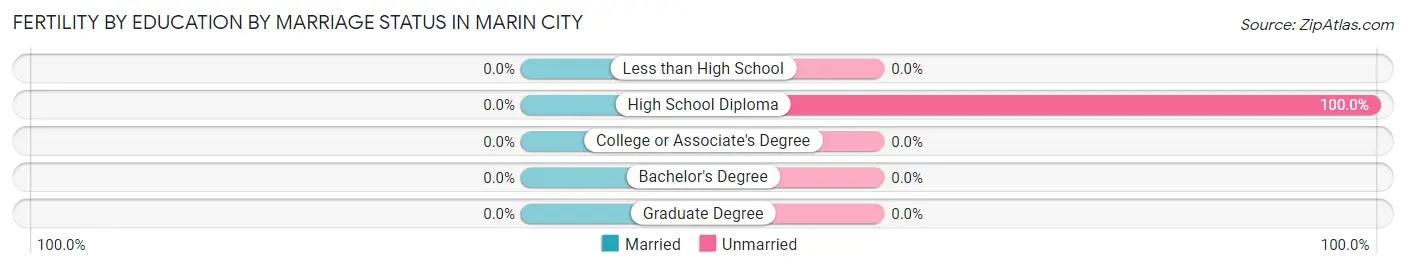
| Educational Attainment | Married | Unmarried |
| Less than High School | 0 (0.0%) | 0 (0.0%) |
| High School Diploma | 0 (0.0%) | 10 (100.0%) |
| College or Associate's Degree | 0 (0.0%) | 0 (0.0%) |
| Bachelor's Degree | 0 (0.0%) | 0 (0.0%) |
| Graduate Degree | 0 (0.0%) | 0 (0.0%) |
| Total | 0 (0.0%) | 10 (100.0%) |
Employment Characteristics in Marin City
Employment by Class of Employer in Marin City
Among the 1,622 employed individuals in Marin City, private company employees (949 | 58.5%), self-employed (incorporated) (182 | 11.2%), and not-for-profit organizations (176 | 10.8%) make up the most common classes of employment.
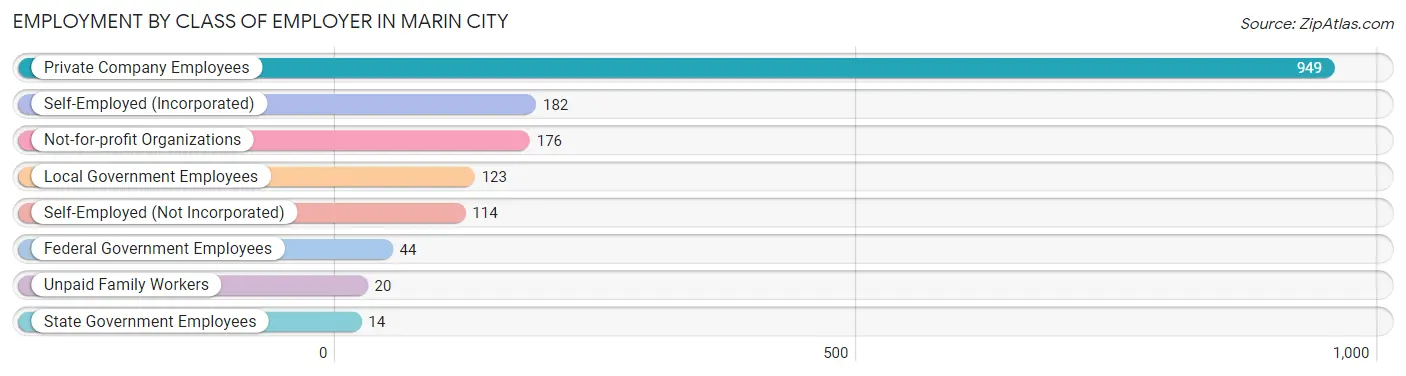
| Employer Class | # Employees | % Employees |
| Private Company Employees | 949 | 58.5% |
| Self-Employed (Incorporated) | 182 | 11.2% |
| Self-Employed (Not Incorporated) | 114 | 7.0% |
| Not-for-profit Organizations | 176 | 10.8% |
| Local Government Employees | 123 | 7.6% |
| State Government Employees | 14 | 0.9% |
| Federal Government Employees | 44 | 2.7% |
| Unpaid Family Workers | 20 | 1.2% |
| Total | 1,622 | 100.0% |
Employment Status by Age in Marin City
According to the labor force statistics for Marin City, out of the total population over 16 years of age (2,769), 64.8% or 1,794 individuals are in the labor force, with 6.2% or 111 of them unemployed. The age group with the highest labor force participation rate is 45 to 54 years, with 95.1% or 603 individuals in the labor force. Within the labor force, the 20 to 24 years age range has the highest percentage of unemployed individuals, with 20.5% or 31 of them being unemployed.
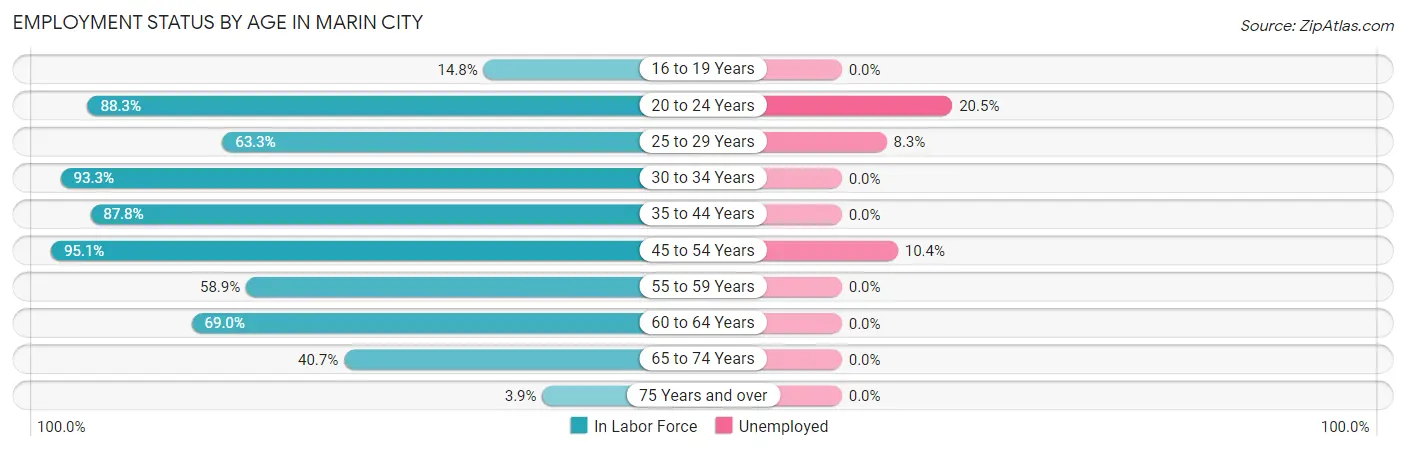
| Age Bracket | In Labor Force | Unemployed |
| 16 to 19 Years | 29 (14.8%) | 0 (0.0%) |
| 20 to 24 Years | 151 (88.3%) | 31 (20.5%) |
| 25 to 29 Years | 216 (63.3%) | 18 (8.3%) |
| 30 to 34 Years | 167 (93.3%) | 0 (0.0%) |
| 35 to 44 Years | 338 (87.8%) | 0 (0.0%) |
| 45 to 54 Years | 603 (95.1%) | 63 (10.4%) |
| 55 to 59 Years | 103 (58.9%) | 0 (0.0%) |
| 60 to 64 Years | 69 (69.0%) | 0 (0.0%) |
| 65 to 74 Years | 105 (40.7%) | 0 (0.0%) |
| 75 Years and over | 13 (3.9%) | 0 (0.0%) |
| Total | 1,794 (64.8%) | 111 (6.2%) |
Employment Status by Educational Attainment in Marin City
According to labor force statistics for Marin City, 82.5% of individuals (1,497) out of the total population between 25 and 64 years of age (1,814) are in the labor force, with 5.4% or 81 of them being unemployed. The group with the highest labor force participation rate are those with the educational attainment of bachelor's degree or higher, with 94.9% or 867 individuals in the labor force. Within the labor force, individuals with less than high school education have the highest percentage of unemployment, with 39.2% or 47 of them being unemployed.
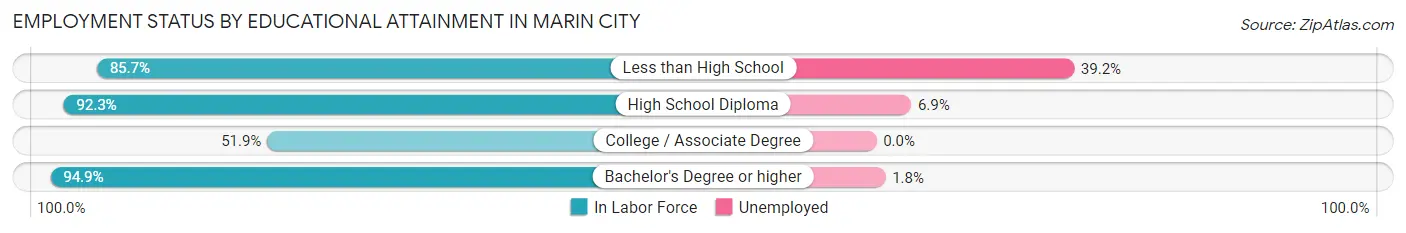
| Educational Attainment | In Labor Force | Unemployed |
| Less than High School | 120 (85.7%) | 55 (39.2%) |
| High School Diploma | 262 (92.3%) | 20 (6.9%) |
| College / Associate Degree | 247 (51.9%) | 0 (0.0%) |
| Bachelor's Degree or higher | 867 (94.9%) | 16 (1.8%) |
| Total | 1,497 (82.5%) | 98 (5.4%) |
Employment Occupations by Sex in Marin City
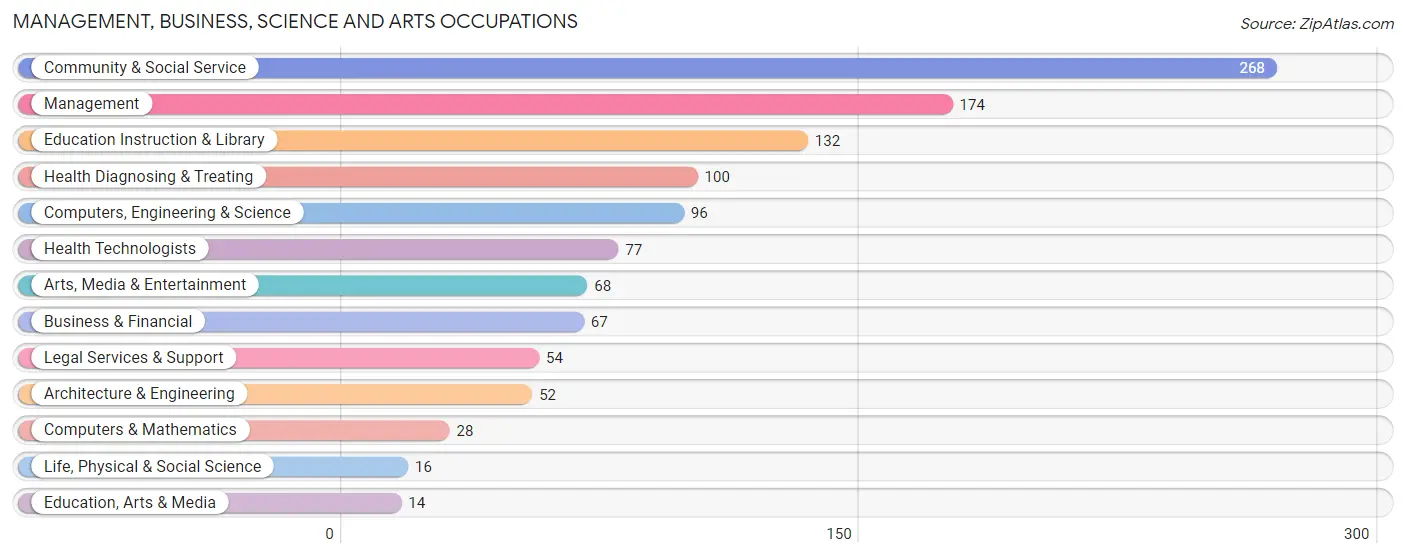
Management, Business, Science and Arts Occupations
The most common Management, Business, Science and Arts occupations in Marin City are Community & Social Service (268 | 15.9%), Management (174 | 10.3%), Education Instruction & Library (132 | 7.9%), Health Diagnosing & Treating (100 | 5.9%), and Computers, Engineering & Science (96 | 5.7%).
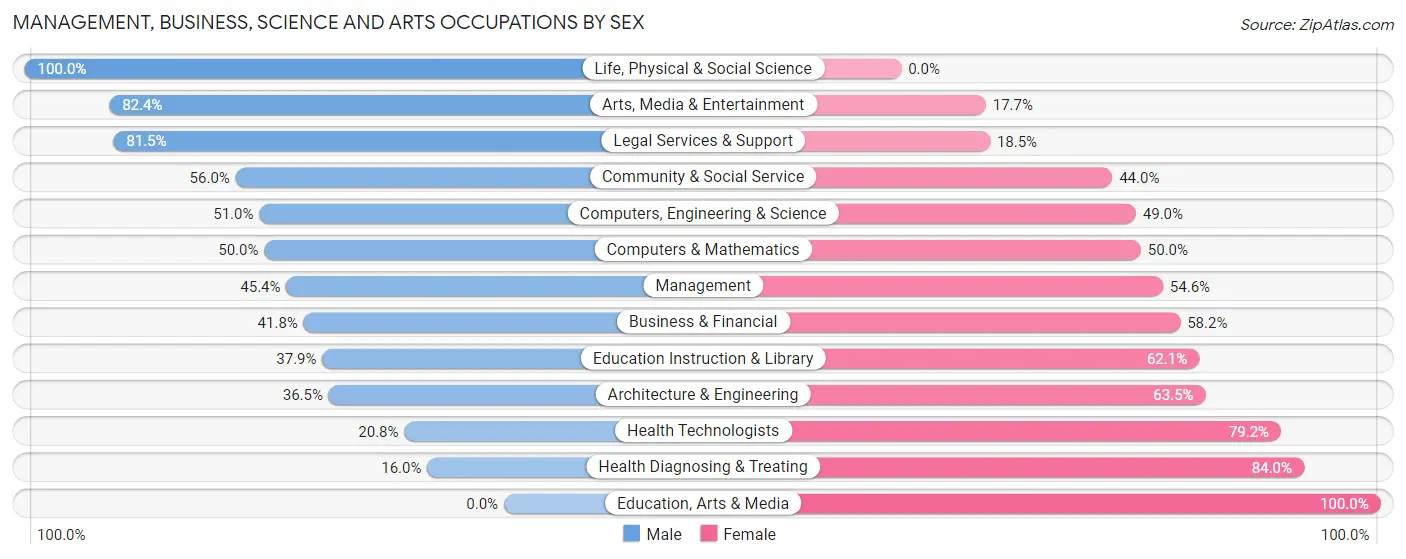
Management, Business, Science and Arts Occupations by Sex
Within the Management, Business, Science and Arts occupations in Marin City, the most male-oriented occupations are Life, Physical & Social Science (100.0%), Arts, Media & Entertainment (82.4%), and Legal Services & Support (81.5%), while the most female-oriented occupations are Education, Arts & Media (100.0%), Health Diagnosing & Treating (84.0%), and Health Technologists (79.2%).
| Occupation | Male | Female |
| Management | 79 (45.4%) | 95 (54.6%) |
| Business & Financial | 28 (41.8%) | 39 (58.2%) |
| Computers, Engineering & Science | 49 (51.0%) | 47 (49.0%) |
| Computers & Mathematics | 14 (50.0%) | 14 (50.0%) |
| Architecture & Engineering | 19 (36.5%) | 33 (63.5%) |
| Life, Physical & Social Science | 16 (100.0%) | 0 (0.0%) |
| Community & Social Service | 150 (56.0%) | 118 (44.0%) |
| Education, Arts & Media | 0 (0.0%) | 14 (100.0%) |
| Legal Services & Support | 44 (81.5%) | 10 (18.5%) |
| Education Instruction & Library | 50 (37.9%) | 82 (62.1%) |
| Arts, Media & Entertainment | 56 (82.4%) | 12 (17.6%) |
| Health Diagnosing & Treating | 16 (16.0%) | 84 (84.0%) |
| Health Technologists | 16 (20.8%) | 61 (79.2%) |
| Total (Category) | 322 (45.7%) | 383 (54.3%) |
| Total (Overall) | 707 (42.0%) | 975 (58.0%) |
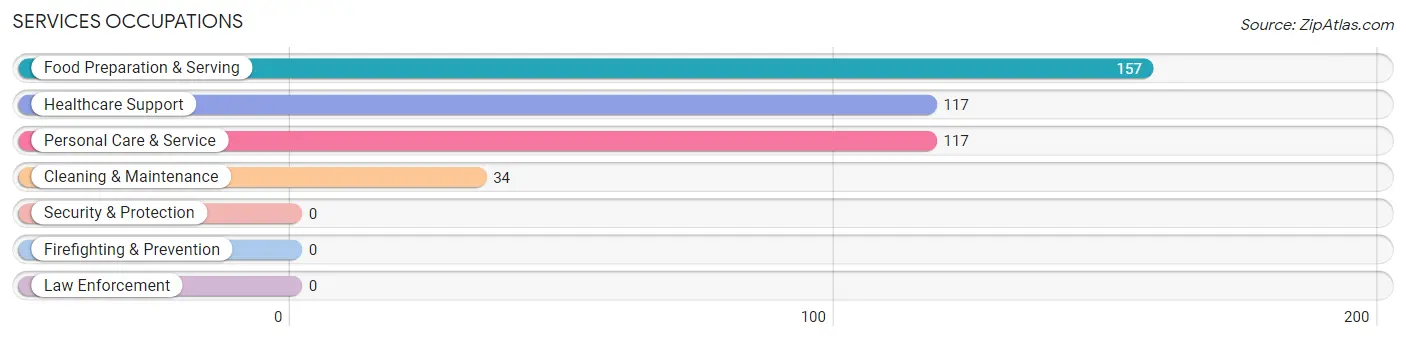
Services Occupations
The most common Services occupations in Marin City are Food Preparation & Serving (157 | 9.3%), Healthcare Support (117 | 7.0%), Personal Care & Service (117 | 7.0%), and Cleaning & Maintenance (34 | 2.0%).
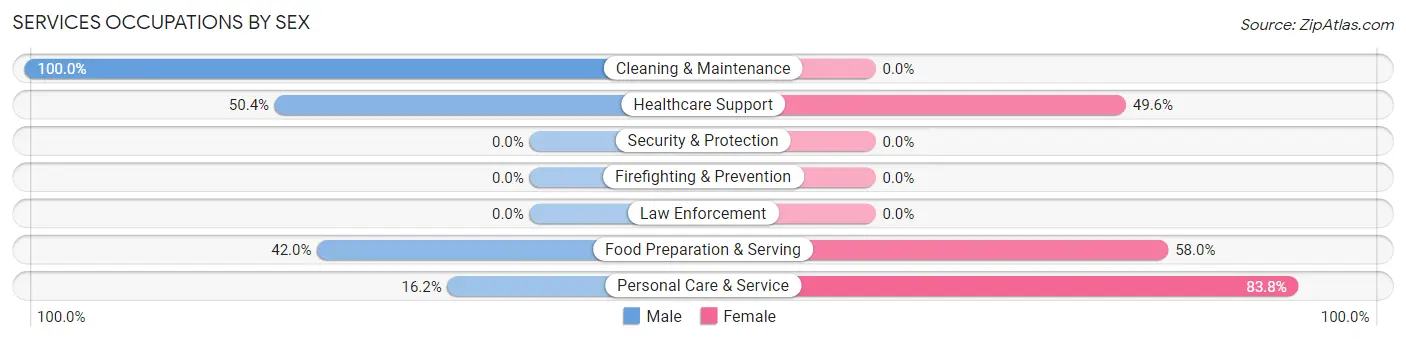
Services Occupations by Sex
Within the Services occupations in Marin City, the most male-oriented occupations are Cleaning & Maintenance (100.0%), Healthcare Support (50.4%), and Food Preparation & Serving (42.0%), while the most female-oriented occupations are Personal Care & Service (83.8%), Food Preparation & Serving (58.0%), and Healthcare Support (49.6%).
| Occupation | Male | Female |
| Healthcare Support | 59 (50.4%) | 58 (49.6%) |
| Security & Protection | 0 (0.0%) | 0 (0.0%) |
| Firefighting & Prevention | 0 (0.0%) | 0 (0.0%) |
| Law Enforcement | 0 (0.0%) | 0 (0.0%) |
| Food Preparation & Serving | 66 (42.0%) | 91 (58.0%) |
| Cleaning & Maintenance | 34 (100.0%) | 0 (0.0%) |
| Personal Care & Service | 19 (16.2%) | 98 (83.8%) |
| Total (Category) | 178 (41.9%) | 247 (58.1%) |
| Total (Overall) | 707 (42.0%) | 975 (58.0%) |
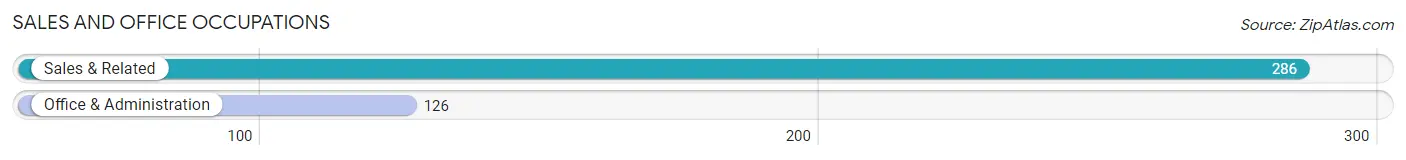
Sales and Office Occupations
The most common Sales and Office occupations in Marin City are Sales & Related (286 | 17.0%), and Office & Administration (126 | 7.5%).
Sales and Office Occupations by Sex
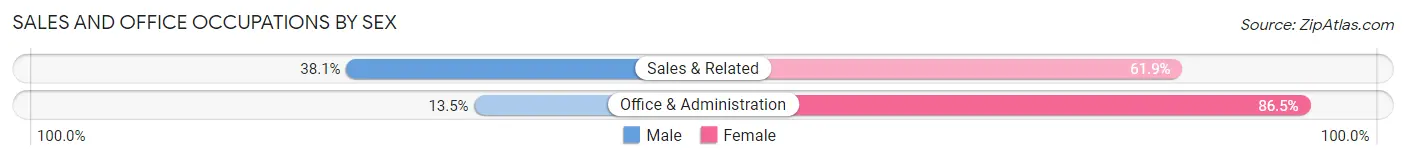
| Occupation | Male | Female |
| Sales & Related | 109 (38.1%) | 177 (61.9%) |
| Office & Administration | 17 (13.5%) | 109 (86.5%) |
| Total (Category) | 126 (30.6%) | 286 (69.4%) |
| Total (Overall) | 707 (42.0%) | 975 (58.0%) |
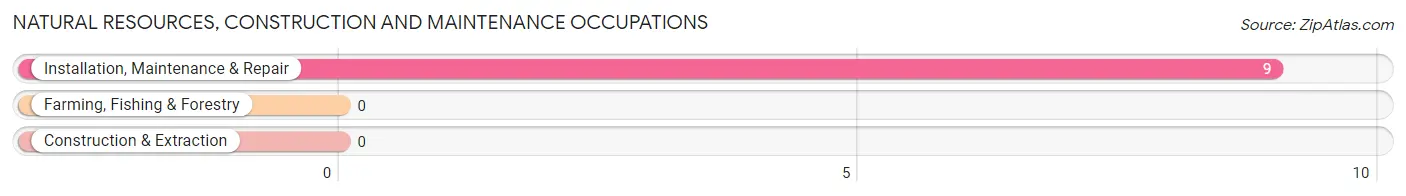
Natural Resources, Construction and Maintenance Occupations
The most common Natural Resources, Construction and Maintenance occupations in Marin City are , and Installation, Maintenance & Repair (9 | 0.5%).
Natural Resources, Construction and Maintenance Occupations by Sex
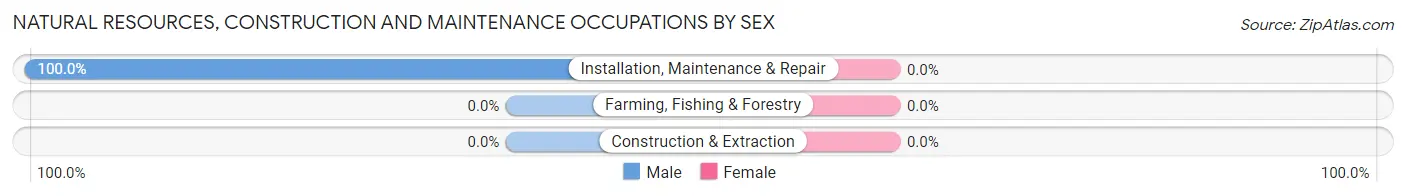
| Occupation | Male | Female |
| Farming, Fishing & Forestry | 0 (0.0%) | 0 (0.0%) |
| Construction & Extraction | 0 (0.0%) | 0 (0.0%) |
| Installation, Maintenance & Repair | 9 (100.0%) | 0 (0.0%) |
| Total (Category) | 9 (100.0%) | 0 (0.0%) |
| Total (Overall) | 707 (42.0%) | 975 (58.0%) |
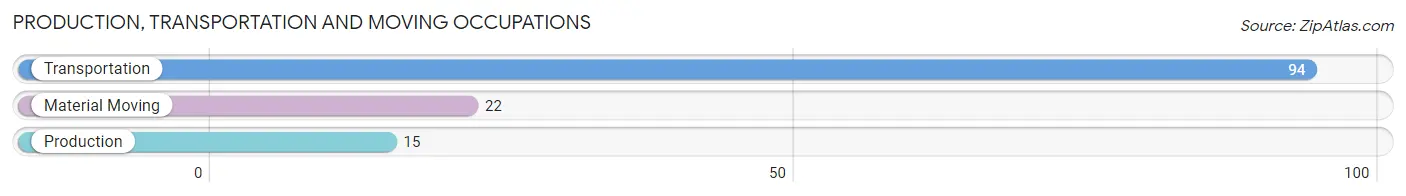
Production, Transportation and Moving Occupations
The most common Production, Transportation and Moving occupations in Marin City are Transportation (94 | 5.6%), Material Moving (22 | 1.3%), and Production (15 | 0.9%).
Production, Transportation and Moving Occupations by Sex
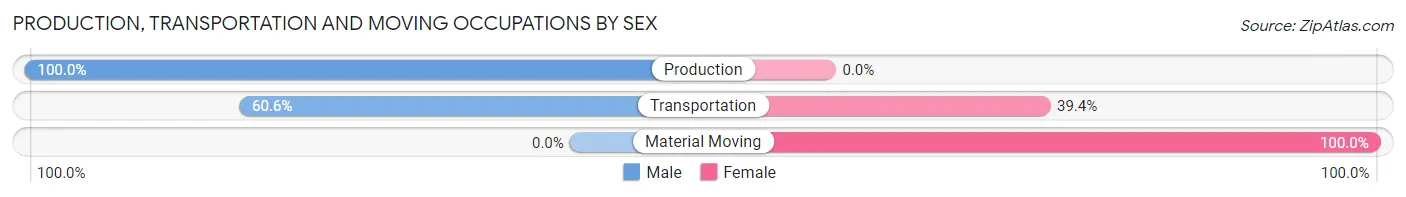
| Occupation | Male | Female |
| Production | 15 (100.0%) | 0 (0.0%) |
| Transportation | 57 (60.6%) | 37 (39.4%) |
| Material Moving | 0 (0.0%) | 22 (100.0%) |
| Total (Category) | 72 (55.0%) | 59 (45.0%) |
| Total (Overall) | 707 (42.0%) | 975 (58.0%) |
Employment Industries by Sex in Marin City
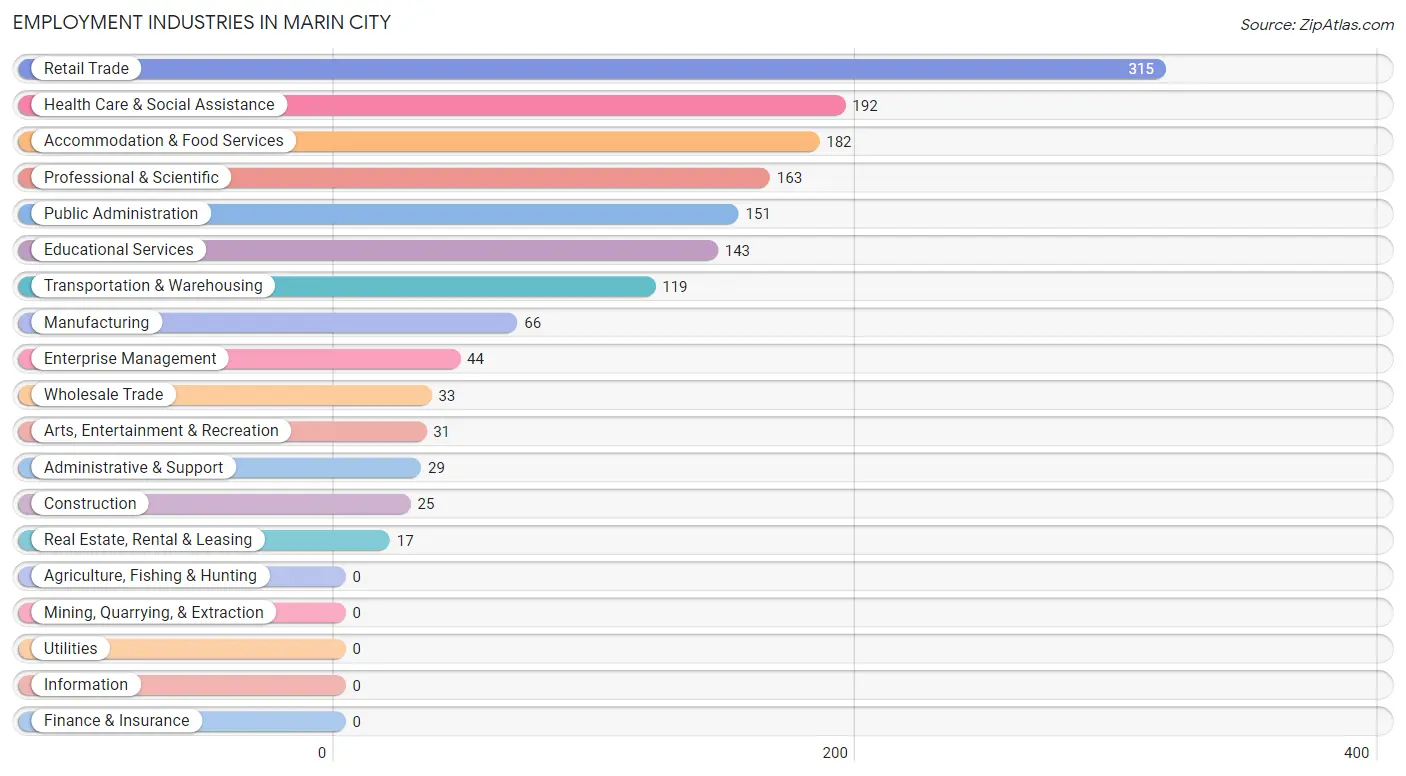
Employment Industries in Marin City
The major employment industries in Marin City include Retail Trade (315 | 18.7%), Health Care & Social Assistance (192 | 11.4%), Accommodation & Food Services (182 | 10.8%), Professional & Scientific (163 | 9.7%), and Public Administration (151 | 9.0%).
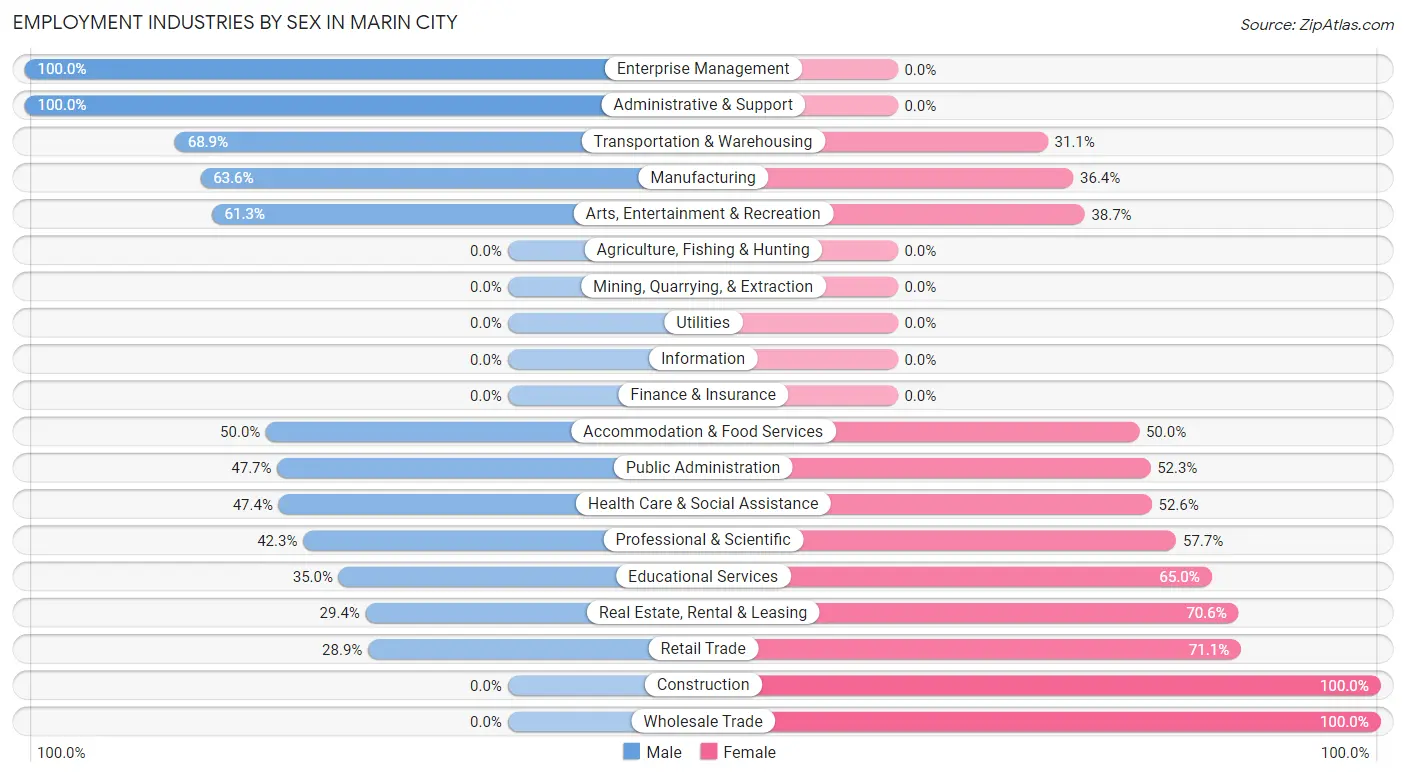
Employment Industries by Sex in Marin City
The Marin City industries that see more men than women are Enterprise Management (100.0%), Administrative & Support (100.0%), and Transportation & Warehousing (68.9%), whereas the industries that tend to have a higher number of women are Construction (100.0%), Wholesale Trade (100.0%), and Retail Trade (71.1%).
| Industry | Male | Female |
| Agriculture, Fishing & Hunting | 0 (0.0%) | 0 (0.0%) |
| Mining, Quarrying, & Extraction | 0 (0.0%) | 0 (0.0%) |
| Construction | 0 (0.0%) | 25 (100.0%) |
| Manufacturing | 42 (63.6%) | 24 (36.4%) |
| Wholesale Trade | 0 (0.0%) | 33 (100.0%) |
| Retail Trade | 91 (28.9%) | 224 (71.1%) |
| Transportation & Warehousing | 82 (68.9%) | 37 (31.1%) |
| Utilities | 0 (0.0%) | 0 (0.0%) |
| Information | 0 (0.0%) | 0 (0.0%) |
| Finance & Insurance | 0 (0.0%) | 0 (0.0%) |
| Real Estate, Rental & Leasing | 5 (29.4%) | 12 (70.6%) |
| Professional & Scientific | 69 (42.3%) | 94 (57.7%) |
| Enterprise Management | 44 (100.0%) | 0 (0.0%) |
| Administrative & Support | 29 (100.0%) | 0 (0.0%) |
| Educational Services | 50 (35.0%) | 93 (65.0%) |
| Health Care & Social Assistance | 91 (47.4%) | 101 (52.6%) |
| Arts, Entertainment & Recreation | 19 (61.3%) | 12 (38.7%) |
| Accommodation & Food Services | 91 (50.0%) | 91 (50.0%) |
| Public Administration | 72 (47.7%) | 79 (52.3%) |
| Total | 707 (42.0%) | 975 (58.0%) |
Education in Marin City
School Enrollment in Marin City
The most common levels of schooling among the 836 students in Marin City are middle school (178 | 21.3%), college / undergraduate (164 | 19.6%), and high school (155 | 18.5%).
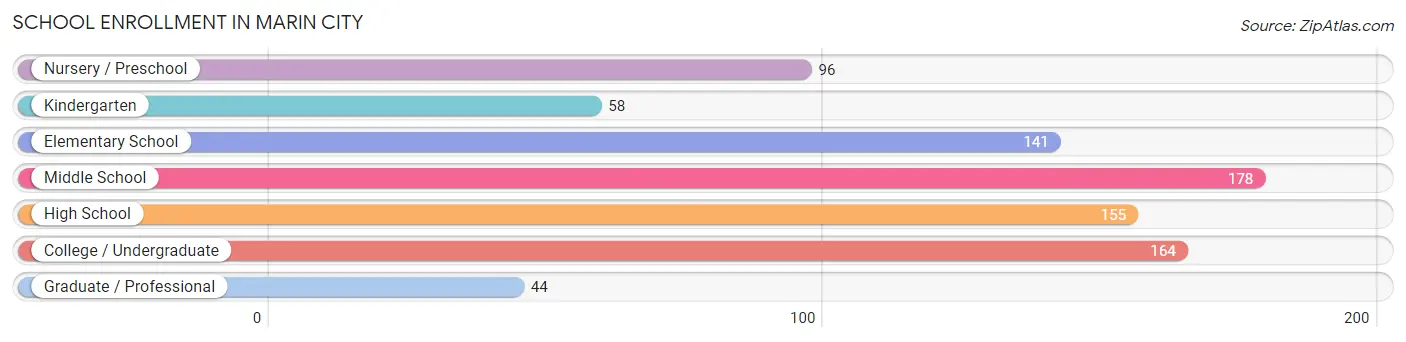
| School Level | # Students | % Students |
| Nursery / Preschool | 96 | 11.5% |
| Kindergarten | 58 | 6.9% |
| Elementary School | 141 | 16.9% |
| Middle School | 178 | 21.3% |
| High School | 155 | 18.5% |
| College / Undergraduate | 164 | 19.6% |
| Graduate / Professional | 44 | 5.3% |
| Total | 836 | 100.0% |
School Enrollment by Age by Funding Source in Marin City
Out of a total of 836 students who are enrolled in schools in Marin City, 142 (17.0%) attend a private institution, while the remaining 694 (83.0%) are enrolled in public schools. The age group of 3 to 4 year olds has the highest likelihood of being enrolled in private schools, with 67 (78.8% in the age bracket) enrolled. Conversely, the age group of 10 to 14 year olds has the lowest likelihood of being enrolled in a private school, with 195 (100.0% in the age bracket) attending a public institution.
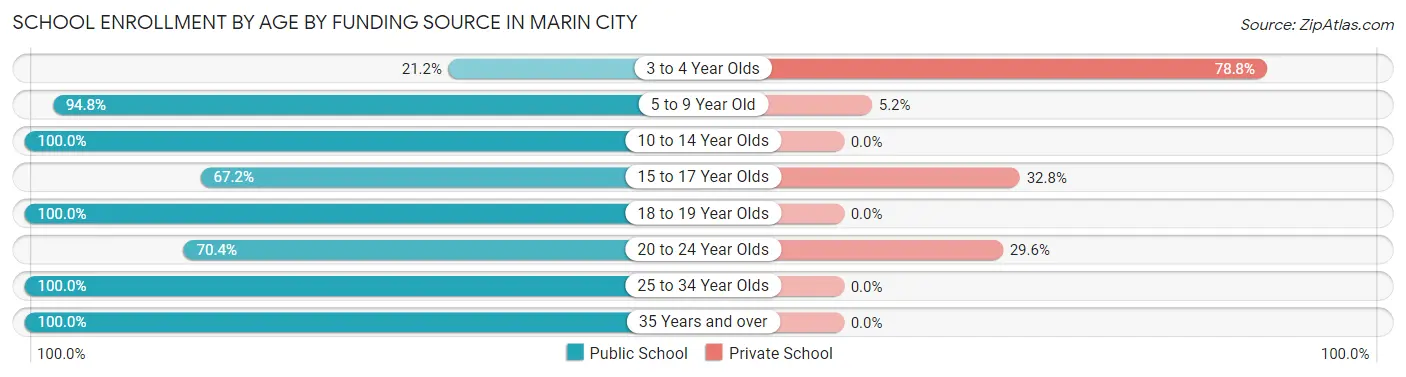
| Age Bracket | Public School | Private School |
| 3 to 4 Year Olds | 18 (21.2%) | 67 (78.8%) |
| 5 to 9 Year Old | 199 (94.8%) | 11 (5.2%) |
| 10 to 14 Year Olds | 195 (100.0%) | 0 (0.0%) |
| 15 to 17 Year Olds | 82 (67.2%) | 40 (32.8%) |
| 18 to 19 Year Olds | 31 (100.0%) | 0 (0.0%) |
| 20 to 24 Year Olds | 57 (70.4%) | 24 (29.6%) |
| 25 to 34 Year Olds | 103 (100.0%) | 0 (0.0%) |
| 35 Years and over | 9 (100.0%) | 0 (0.0%) |
| Total | 694 (83.0%) | 142 (17.0%) |
Educational Attainment by Field of Study in Marin City
Business (201 | 15.0%), social sciences (168 | 12.6%), liberal arts & history (164 | 12.3%), psychology (153 | 11.4%), and literature & languages (149 | 11.1%) are the most common fields of study among 1,337 individuals in Marin City who have obtained a bachelor's degree or higher.
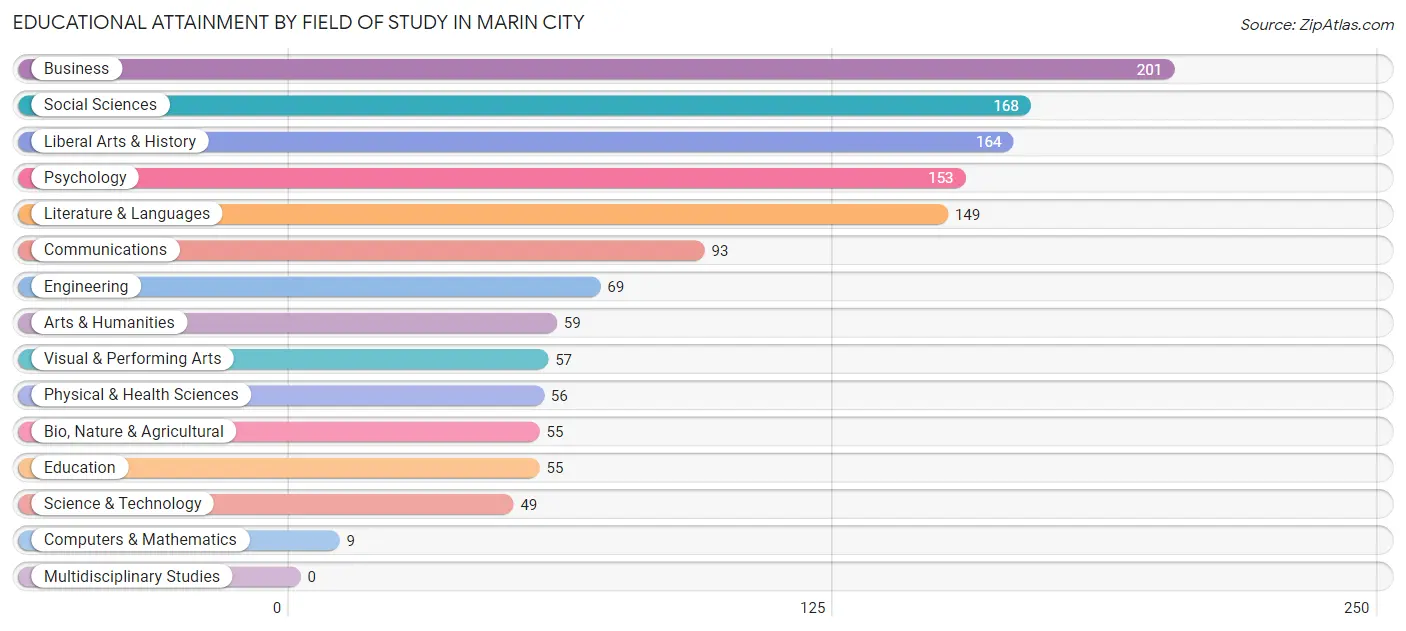
| Field of Study | # Graduates | % Graduates |
| Computers & Mathematics | 9 | 0.7% |
| Bio, Nature & Agricultural | 55 | 4.1% |
| Physical & Health Sciences | 56 | 4.2% |
| Psychology | 153 | 11.4% |
| Social Sciences | 168 | 12.6% |
| Engineering | 69 | 5.2% |
| Multidisciplinary Studies | 0 | 0.0% |
| Science & Technology | 49 | 3.7% |
| Business | 201 | 15.0% |
| Education | 55 | 4.1% |
| Literature & Languages | 149 | 11.1% |
| Liberal Arts & History | 164 | 12.3% |
| Visual & Performing Arts | 57 | 4.3% |
| Communications | 93 | 7.0% |
| Arts & Humanities | 59 | 4.4% |
| Total | 1,337 | 100.0% |
Transportation & Commute in Marin City
Vehicle Availability by Sex in Marin City
The most prevalent vehicle ownership categories in Marin City are males with 1 vehicle (272, accounting for 38.5%) and females with 1 vehicle (455, making up 29.7%).
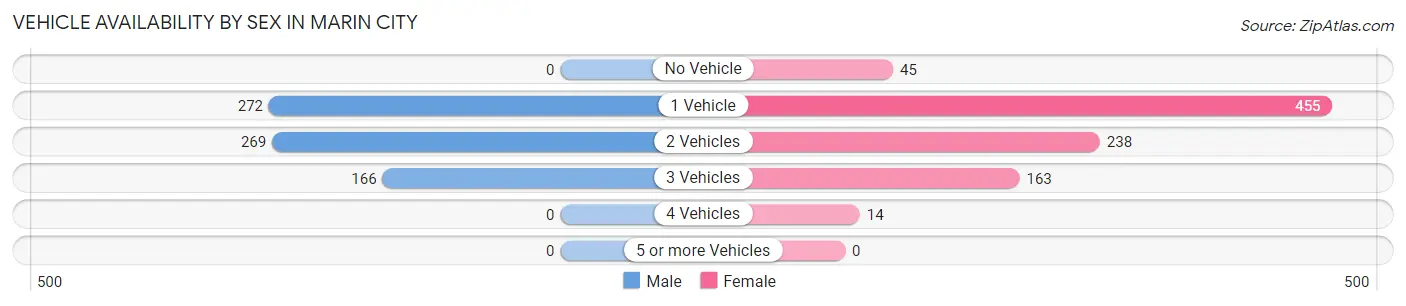
| Vehicles Available | Male | Female |
| No Vehicle | 0 (0.0%) | 45 (4.9%) |
| 1 Vehicle | 272 (38.5%) | 455 (49.7%) |
| 2 Vehicles | 269 (38.1%) | 238 (26.0%) |
| 3 Vehicles | 166 (23.5%) | 163 (17.8%) |
| 4 Vehicles | 0 (0.0%) | 14 (1.5%) |
| 5 or more Vehicles | 0 (0.0%) | 0 (0.0%) |
| Total | 707 (100.0%) | 915 (100.0%) |
Commute Time in Marin City
The most frequently occuring commute durations in Marin City are 30 to 34 minutes (201 commuters, 15.2%), 5 to 9 minutes (195 commuters, 14.7%), and 25 to 29 minutes (192 commuters, 14.5%).
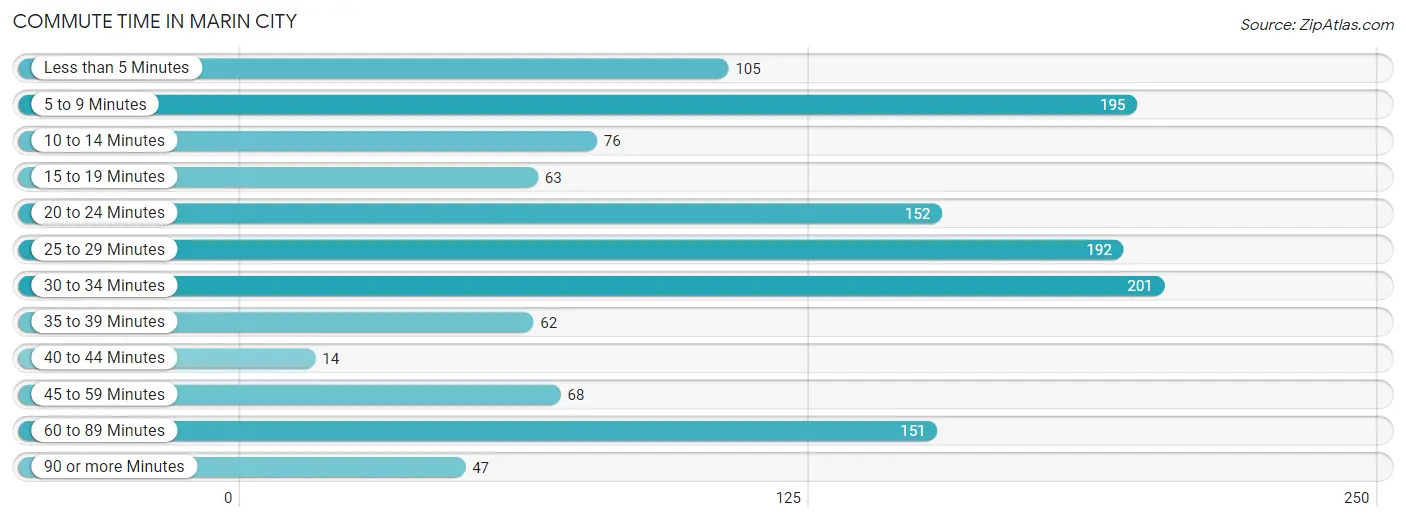
| Commute Time | # Commuters | % Commuters |
| Less than 5 Minutes | 105 | 7.9% |
| 5 to 9 Minutes | 195 | 14.7% |
| 10 to 14 Minutes | 76 | 5.7% |
| 15 to 19 Minutes | 63 | 4.8% |
| 20 to 24 Minutes | 152 | 11.5% |
| 25 to 29 Minutes | 192 | 14.5% |
| 30 to 34 Minutes | 201 | 15.2% |
| 35 to 39 Minutes | 62 | 4.7% |
| 40 to 44 Minutes | 14 | 1.1% |
| 45 to 59 Minutes | 68 | 5.1% |
| 60 to 89 Minutes | 151 | 11.4% |
| 90 or more Minutes | 47 | 3.5% |
Commute Time by Sex in Marin City
The most common commute times in Marin City are 5 to 9 minutes (135 commuters, 20.9%) for males and 25 to 29 minutes (138 commuters, 20.3%) for females.
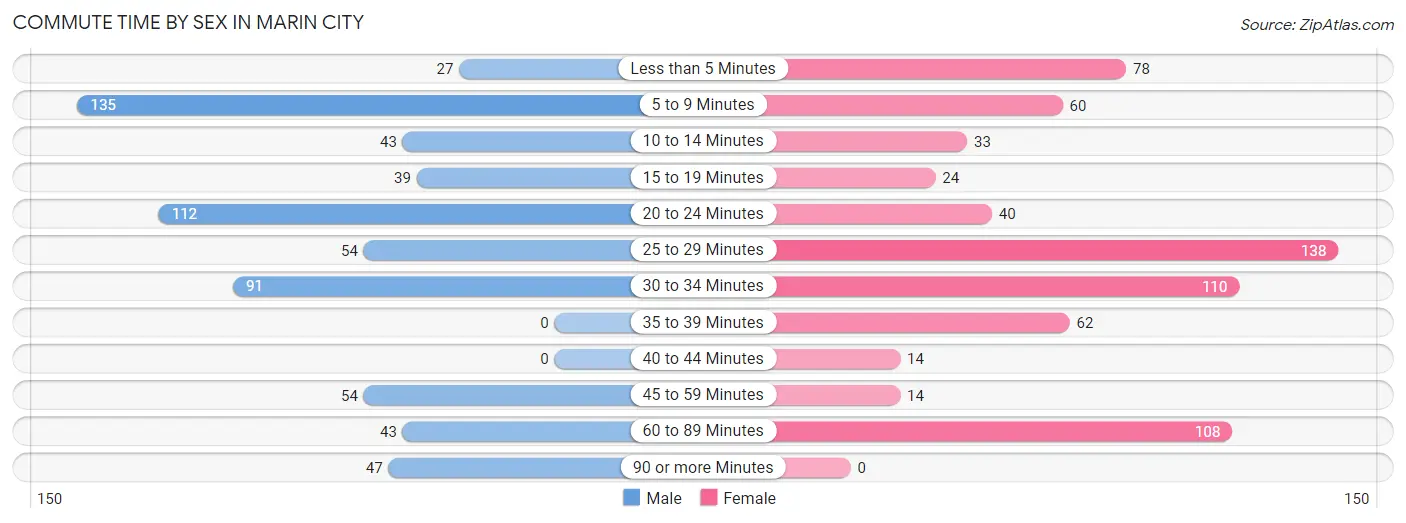
| Commute Time | Male | Female |
| Less than 5 Minutes | 27 (4.2%) | 78 (11.5%) |
| 5 to 9 Minutes | 135 (20.9%) | 60 (8.8%) |
| 10 to 14 Minutes | 43 (6.7%) | 33 (4.9%) |
| 15 to 19 Minutes | 39 (6.0%) | 24 (3.5%) |
| 20 to 24 Minutes | 112 (17.4%) | 40 (5.9%) |
| 25 to 29 Minutes | 54 (8.4%) | 138 (20.3%) |
| 30 to 34 Minutes | 91 (14.1%) | 110 (16.2%) |
| 35 to 39 Minutes | 0 (0.0%) | 62 (9.1%) |
| 40 to 44 Minutes | 0 (0.0%) | 14 (2.1%) |
| 45 to 59 Minutes | 54 (8.4%) | 14 (2.1%) |
| 60 to 89 Minutes | 43 (6.7%) | 108 (15.9%) |
| 90 or more Minutes | 47 (7.3%) | 0 (0.0%) |
Time of Departure to Work by Sex in Marin City
The most frequent times of departure to work in Marin City are 7:00 AM to 7:29 AM (168, 26.1%) for males and 7:30 AM to 7:59 AM (134, 19.7%) for females.
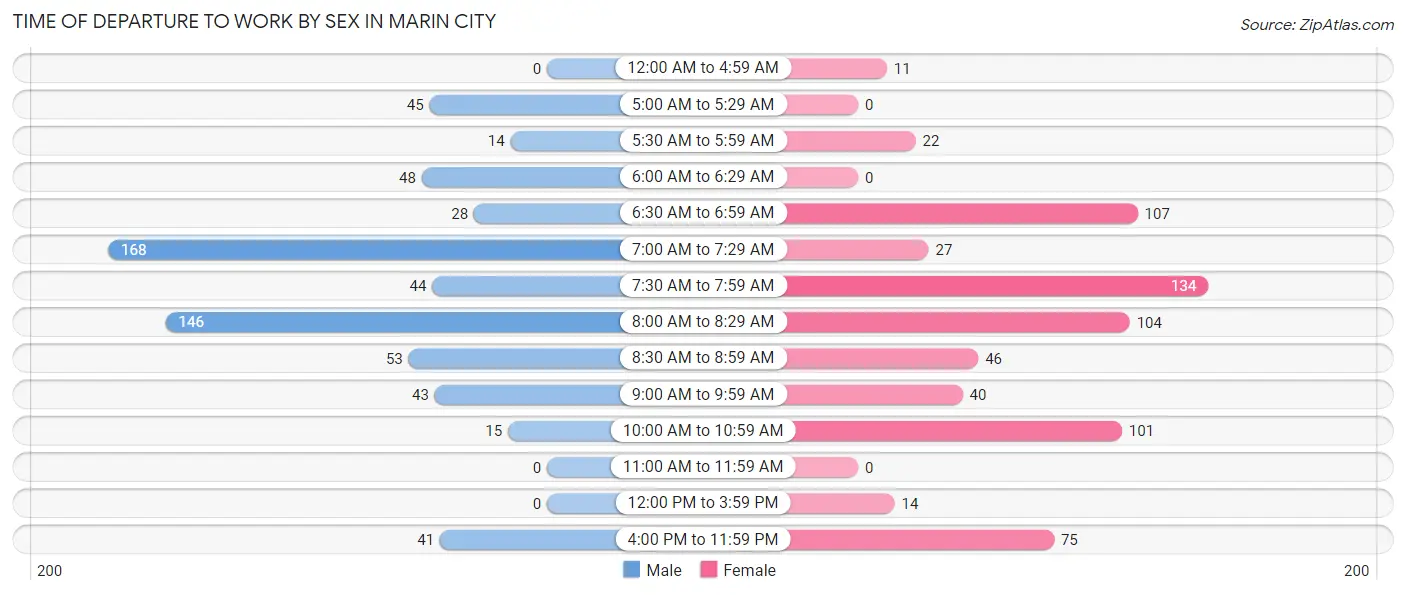
| Time of Departure | Male | Female |
| 12:00 AM to 4:59 AM | 0 (0.0%) | 11 (1.6%) |
| 5:00 AM to 5:29 AM | 45 (7.0%) | 0 (0.0%) |
| 5:30 AM to 5:59 AM | 14 (2.2%) | 22 (3.2%) |
| 6:00 AM to 6:29 AM | 48 (7.4%) | 0 (0.0%) |
| 6:30 AM to 6:59 AM | 28 (4.3%) | 107 (15.7%) |
| 7:00 AM to 7:29 AM | 168 (26.1%) | 27 (4.0%) |
| 7:30 AM to 7:59 AM | 44 (6.8%) | 134 (19.7%) |
| 8:00 AM to 8:29 AM | 146 (22.6%) | 104 (15.3%) |
| 8:30 AM to 8:59 AM | 53 (8.2%) | 46 (6.8%) |
| 9:00 AM to 9:59 AM | 43 (6.7%) | 40 (5.9%) |
| 10:00 AM to 10:59 AM | 15 (2.3%) | 101 (14.8%) |
| 11:00 AM to 11:59 AM | 0 (0.0%) | 0 (0.0%) |
| 12:00 PM to 3:59 PM | 0 (0.0%) | 14 (2.1%) |
| 4:00 PM to 11:59 PM | 41 (6.4%) | 75 (11.0%) |
| Total | 645 (100.0%) | 681 (100.0%) |
Housing Occupancy in Marin City
Occupancy by Ownership in Marin City
Of the total 1,412 dwellings in Marin City, owner-occupied units account for 564 (39.9%), while renter-occupied units make up 848 (60.1%).
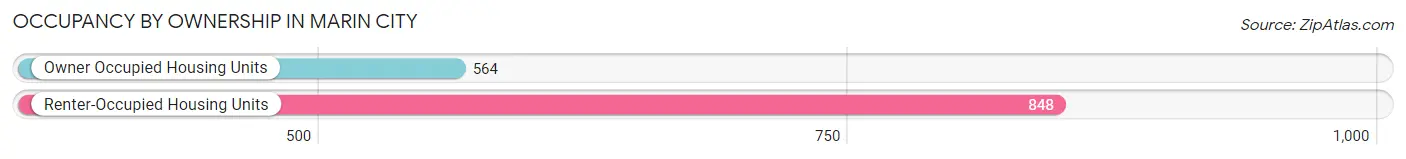
| Occupancy | # Housing Units | % Housing Units |
| Owner Occupied Housing Units | 564 | 39.9% |
| Renter-Occupied Housing Units | 848 | 60.1% |
| Total Occupied Housing Units | 1,412 | 100.0% |
Occupancy by Household Size in Marin City
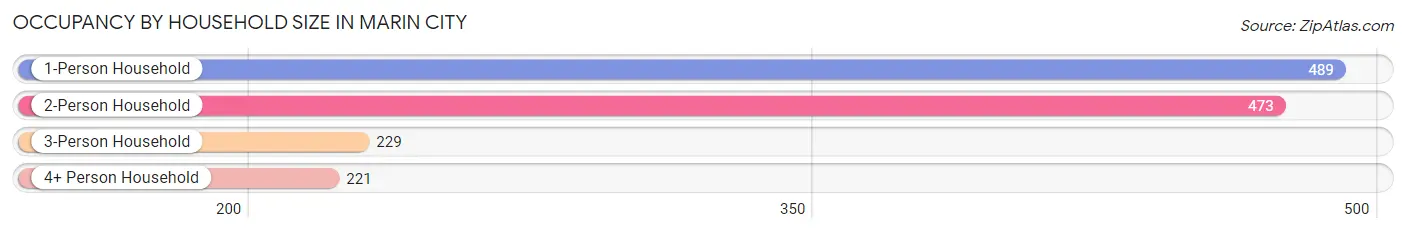
| Household Size | # Housing Units | % Housing Units |
| 1-Person Household | 489 | 34.6% |
| 2-Person Household | 473 | 33.5% |
| 3-Person Household | 229 | 16.2% |
| 4+ Person Household | 221 | 15.7% |
| Total Housing Units | 1,412 | 100.0% |
Occupancy by Ownership by Household Size in Marin City
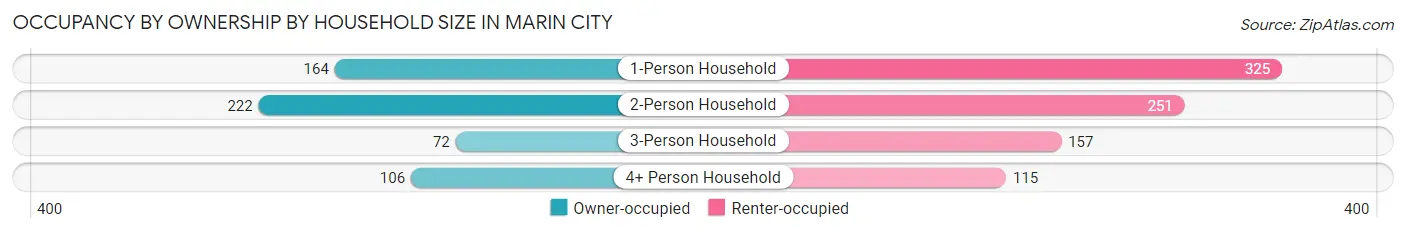
| Household Size | Owner-occupied | Renter-occupied |
| 1-Person Household | 164 (33.5%) | 325 (66.5%) |
| 2-Person Household | 222 (46.9%) | 251 (53.1%) |
| 3-Person Household | 72 (31.4%) | 157 (68.6%) |
| 4+ Person Household | 106 (48.0%) | 115 (52.0%) |
| Total Housing Units | 564 (39.9%) | 848 (60.1%) |
Occupancy by Educational Attainment in Marin City
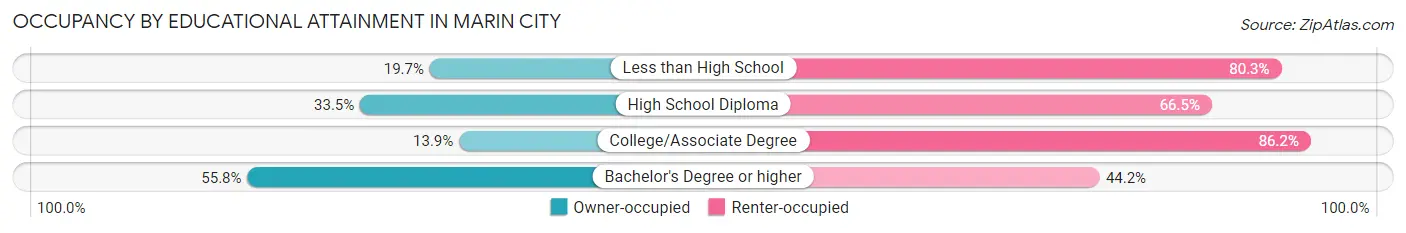
| Household Size | Owner-occupied | Renter-occupied |
| Less than High School | 12 (19.7%) | 49 (80.3%) |
| High School Diploma | 76 (33.5%) | 151 (66.5%) |
| College/Associate Degree | 50 (13.9%) | 311 (86.2%) |
| Bachelor's Degree or higher | 426 (55.8%) | 337 (44.2%) |
Occupancy by Age of Householder in Marin City
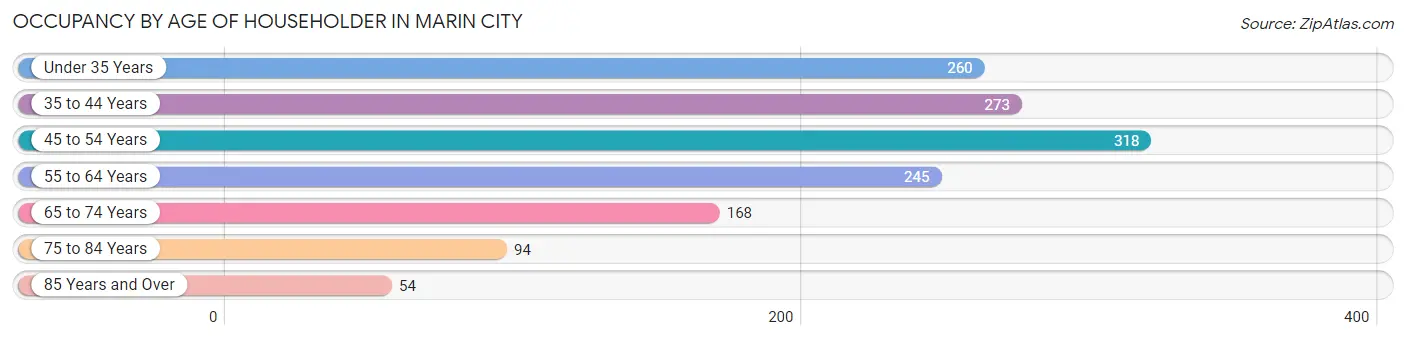
| Age Bracket | # Households | % Households |
| Under 35 Years | 260 | 18.4% |
| 35 to 44 Years | 273 | 19.3% |
| 45 to 54 Years | 318 | 22.5% |
| 55 to 64 Years | 245 | 17.3% |
| 65 to 74 Years | 168 | 11.9% |
| 75 to 84 Years | 94 | 6.7% |
| 85 Years and Over | 54 | 3.8% |
| Total | 1,412 | 100.0% |
Housing Finances in Marin City
Median Income by Occupancy in Marin City
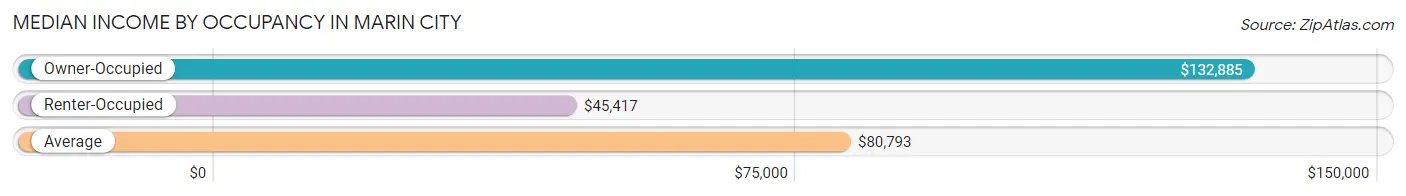
| Occupancy Type | # Households | Median Income |
| Owner-Occupied | 564 (39.9%) | $132,885 |
| Renter-Occupied | 848 (60.1%) | $45,417 |
| Average | 1,412 (100.0%) | $80,793 |
Occupancy by Householder Income Bracket in Marin City
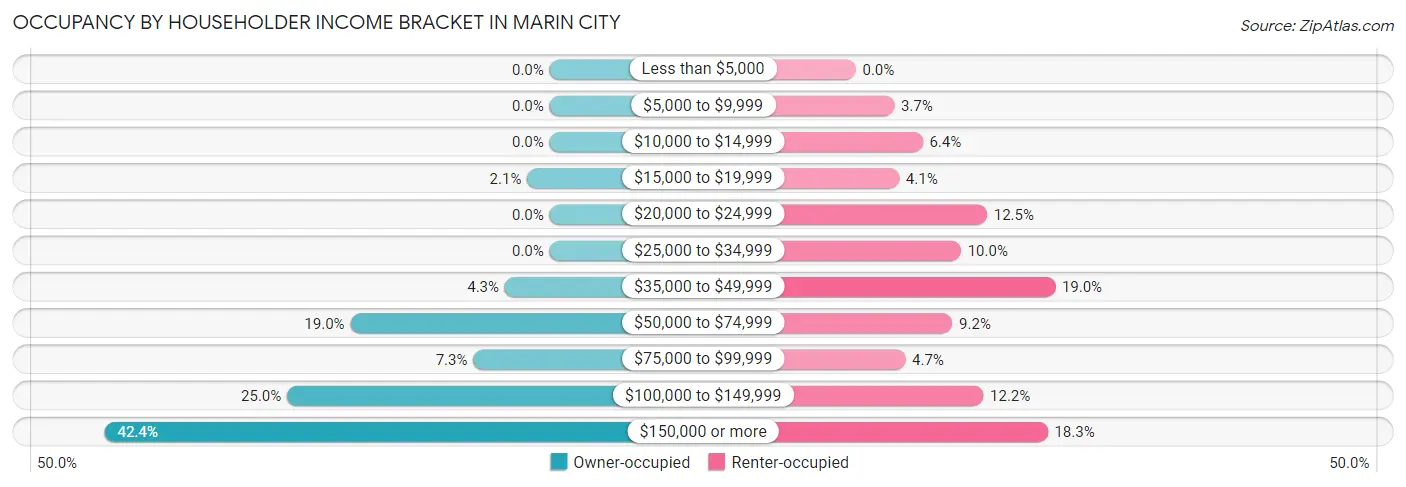
| Income Bracket | Owner-occupied | Renter-occupied |
| Less than $5,000 | 0 (0.0%) | 0 (0.0%) |
| $5,000 to $9,999 | 0 (0.0%) | 31 (3.7%) |
| $10,000 to $14,999 | 0 (0.0%) | 54 (6.4%) |
| $15,000 to $19,999 | 12 (2.1%) | 35 (4.1%) |
| $20,000 to $24,999 | 0 (0.0%) | 106 (12.5%) |
| $25,000 to $34,999 | 0 (0.0%) | 85 (10.0%) |
| $35,000 to $49,999 | 24 (4.3%) | 161 (19.0%) |
| $50,000 to $74,999 | 107 (19.0%) | 78 (9.2%) |
| $75,000 to $99,999 | 41 (7.3%) | 40 (4.7%) |
| $100,000 to $149,999 | 141 (25.0%) | 103 (12.1%) |
| $150,000 or more | 239 (42.4%) | 155 (18.3%) |
| Total | 564 (100.0%) | 848 (100.0%) |
Monthly Housing Cost Tiers in Marin City
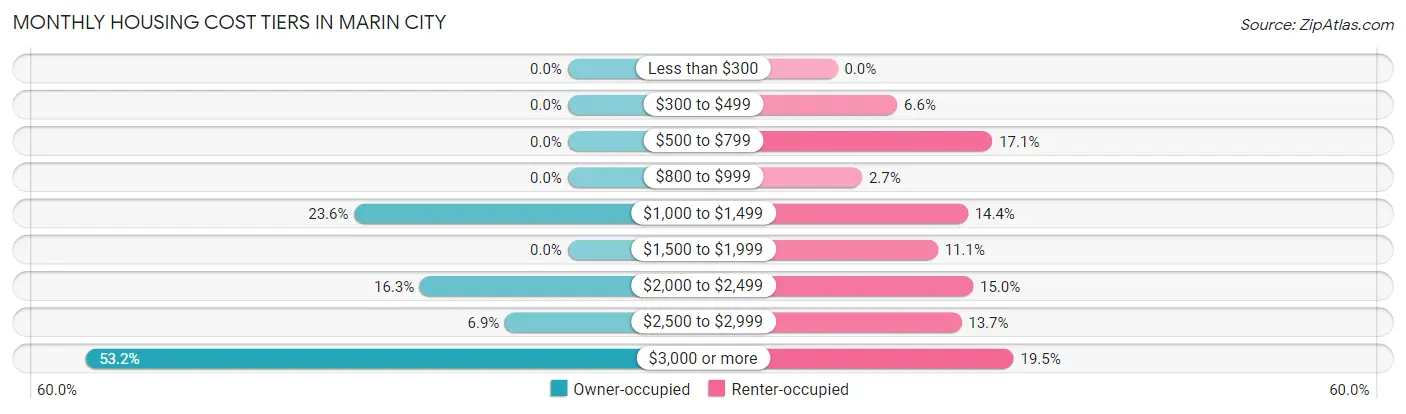
| Monthly Cost | Owner-occupied | Renter-occupied |
| Less than $300 | 0 (0.0%) | 0 (0.0%) |
| $300 to $499 | 0 (0.0%) | 56 (6.6%) |
| $500 to $799 | 0 (0.0%) | 145 (17.1%) |
| $800 to $999 | 0 (0.0%) | 23 (2.7%) |
| $1,000 to $1,499 | 133 (23.6%) | 122 (14.4%) |
| $1,500 to $1,999 | 0 (0.0%) | 94 (11.1%) |
| $2,000 to $2,499 | 92 (16.3%) | 127 (15.0%) |
| $2,500 to $2,999 | 39 (6.9%) | 116 (13.7%) |
| $3,000 or more | 300 (53.2%) | 165 (19.5%) |
| Total | 564 (100.0%) | 848 (100.0%) |
Physical Housing Characteristics in Marin City
Housing Structures in Marin City
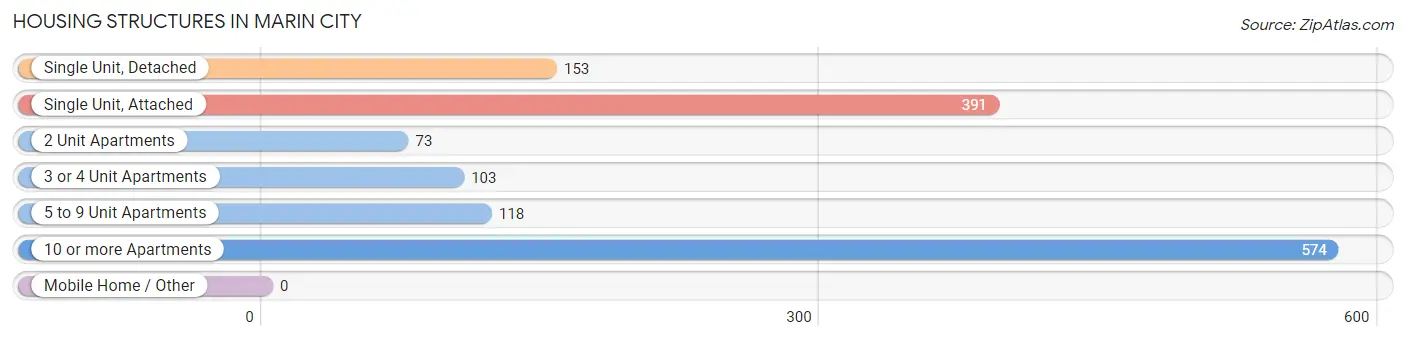
| Structure Type | # Housing Units | % Housing Units |
| Single Unit, Detached | 153 | 10.8% |
| Single Unit, Attached | 391 | 27.7% |
| 2 Unit Apartments | 73 | 5.2% |
| 3 or 4 Unit Apartments | 103 | 7.3% |
| 5 to 9 Unit Apartments | 118 | 8.4% |
| 10 or more Apartments | 574 | 40.6% |
| Mobile Home / Other | 0 | 0.0% |
| Total | 1,412 | 100.0% |
Housing Structures by Occupancy in Marin City
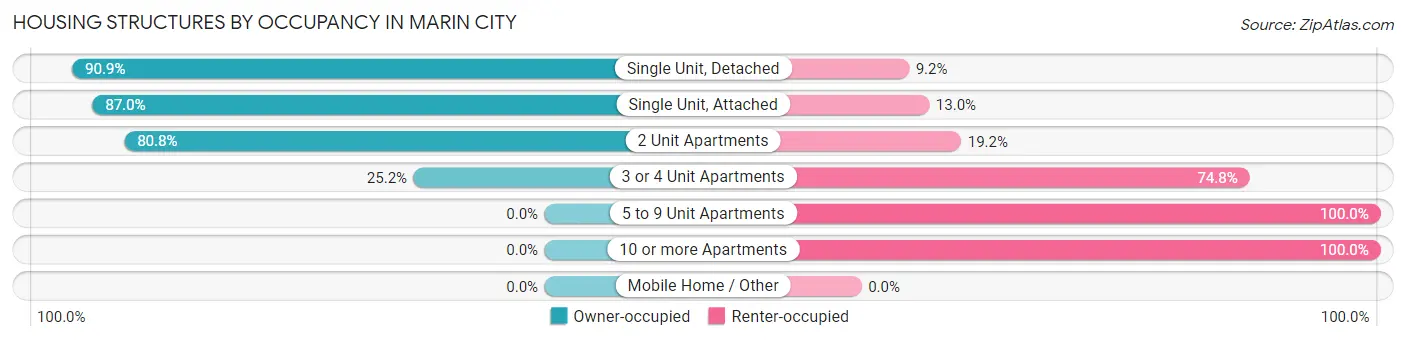
| Structure Type | Owner-occupied | Renter-occupied |
| Single Unit, Detached | 139 (90.8%) | 14 (9.1%) |
| Single Unit, Attached | 340 (87.0%) | 51 (13.0%) |
| 2 Unit Apartments | 59 (80.8%) | 14 (19.2%) |
| 3 or 4 Unit Apartments | 26 (25.2%) | 77 (74.8%) |
| 5 to 9 Unit Apartments | 0 (0.0%) | 118 (100.0%) |
| 10 or more Apartments | 0 (0.0%) | 574 (100.0%) |
| Mobile Home / Other | 0 (0.0%) | 0 (0.0%) |
| Total | 564 (39.9%) | 848 (60.1%) |
Housing Structures by Number of Rooms in Marin City
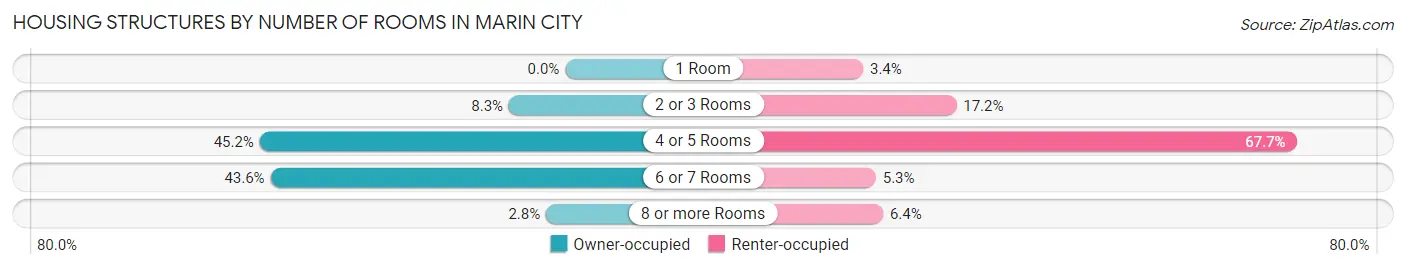
| Number of Rooms | Owner-occupied | Renter-occupied |
| 1 Room | 0 (0.0%) | 29 (3.4%) |
| 2 or 3 Rooms | 47 (8.3%) | 146 (17.2%) |
| 4 or 5 Rooms | 255 (45.2%) | 574 (67.7%) |
| 6 or 7 Rooms | 246 (43.6%) | 45 (5.3%) |
| 8 or more Rooms | 16 (2.8%) | 54 (6.4%) |
| Total | 564 (100.0%) | 848 (100.0%) |
Housing Structure by Heating Type in Marin City
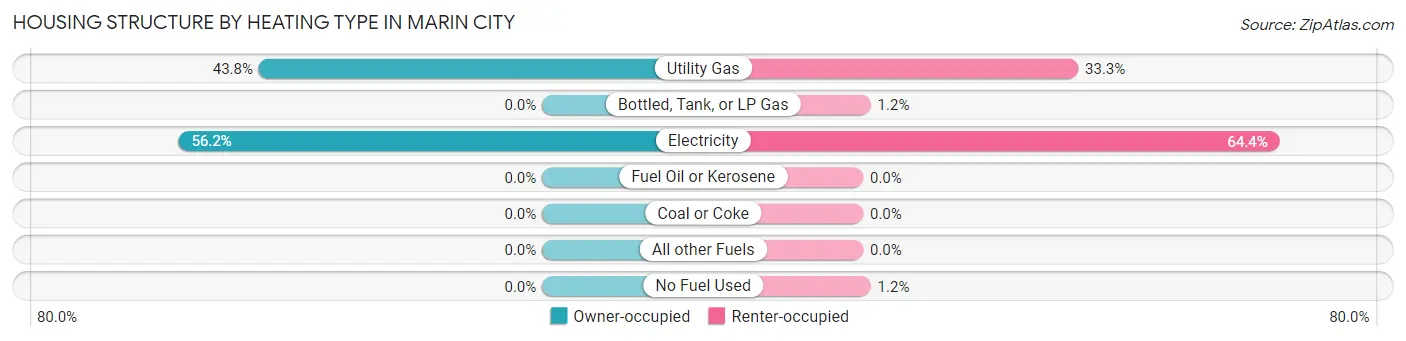
| Heating Type | Owner-occupied | Renter-occupied |
| Utility Gas | 247 (43.8%) | 282 (33.3%) |
| Bottled, Tank, or LP Gas | 0 (0.0%) | 10 (1.2%) |
| Electricity | 317 (56.2%) | 546 (64.4%) |
| Fuel Oil or Kerosene | 0 (0.0%) | 0 (0.0%) |
| Coal or Coke | 0 (0.0%) | 0 (0.0%) |
| All other Fuels | 0 (0.0%) | 0 (0.0%) |
| No Fuel Used | 0 (0.0%) | 10 (1.2%) |
| Total | 564 (100.0%) | 848 (100.0%) |
Household Vehicle Usage in Marin City
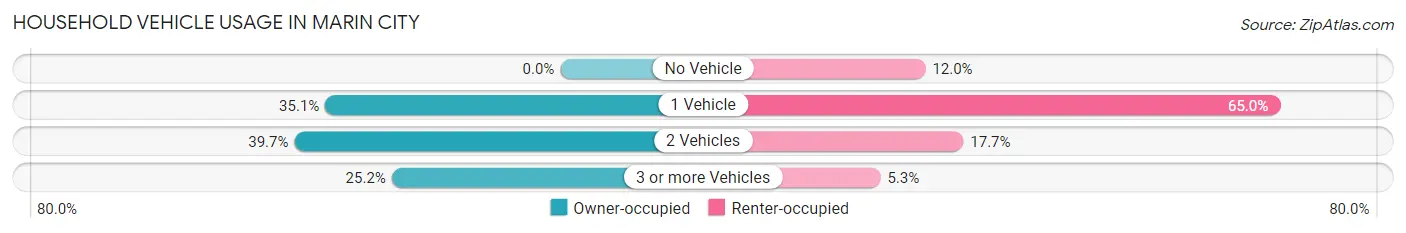
| Vehicles per Household | Owner-occupied | Renter-occupied |
| No Vehicle | 0 (0.0%) | 102 (12.0%) |
| 1 Vehicle | 198 (35.1%) | 551 (65.0%) |
| 2 Vehicles | 224 (39.7%) | 150 (17.7%) |
| 3 or more Vehicles | 142 (25.2%) | 45 (5.3%) |
| Total | 564 (100.0%) | 848 (100.0%) |
Real Estate & Mortgages in Marin City
Real Estate and Mortgage Overview in Marin City
| Characteristic | Without Mortgage | With Mortgage |
| Housing Units | 135 | 429 |
| Median Property Value | - | - |
| Median Household Income | $112,996 | $239 |
| Monthly Housing Costs | $1,099 | $287 |
| Real Estate Taxes | $5,506 | $0 |
Property Value by Mortgage Status in Marin City
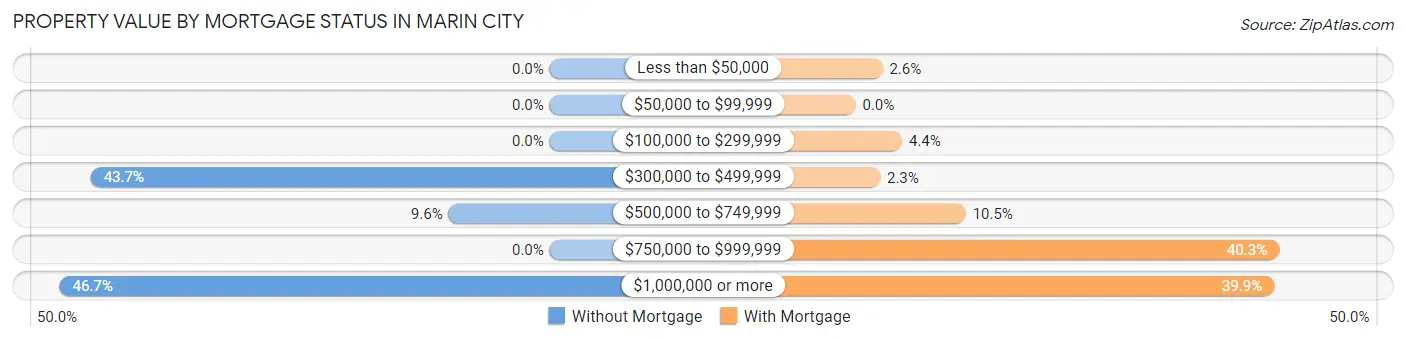
| Property Value | Without Mortgage | With Mortgage |
| Less than $50,000 | 0 (0.0%) | 11 (2.6%) |
| $50,000 to $99,999 | 0 (0.0%) | 0 (0.0%) |
| $100,000 to $299,999 | 0 (0.0%) | 19 (4.4%) |
| $300,000 to $499,999 | 59 (43.7%) | 10 (2.3%) |
| $500,000 to $749,999 | 13 (9.6%) | 45 (10.5%) |
| $750,000 to $999,999 | 0 (0.0%) | 173 (40.3%) |
| $1,000,000 or more | 63 (46.7%) | 171 (39.9%) |
| Total | 135 (100.0%) | 429 (100.0%) |
Household Income by Mortgage Status in Marin City
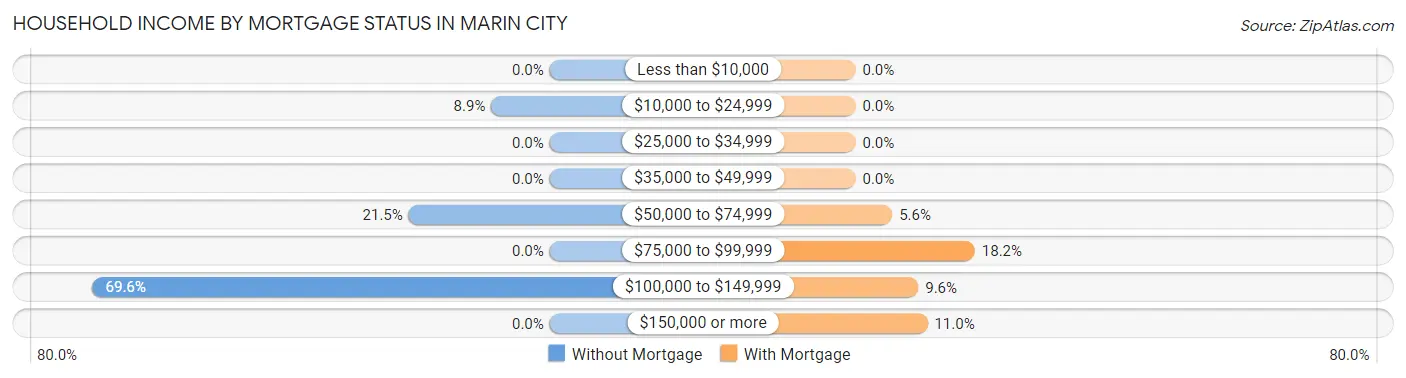
| Household Income | Without Mortgage | With Mortgage |
| Less than $10,000 | 0 (0.0%) | 0 (0.0%) |
| $10,000 to $24,999 | 12 (8.9%) | 0 (0.0%) |
| $25,000 to $34,999 | 0 (0.0%) | 0 (0.0%) |
| $35,000 to $49,999 | 0 (0.0%) | 0 (0.0%) |
| $50,000 to $74,999 | 29 (21.5%) | 24 (5.6%) |
| $75,000 to $99,999 | 0 (0.0%) | 78 (18.2%) |
| $100,000 to $149,999 | 94 (69.6%) | 41 (9.6%) |
| $150,000 or more | 0 (0.0%) | 47 (11.0%) |
| Total | 135 (100.0%) | 429 (100.0%) |
Property Value to Household Income Ratio in Marin City
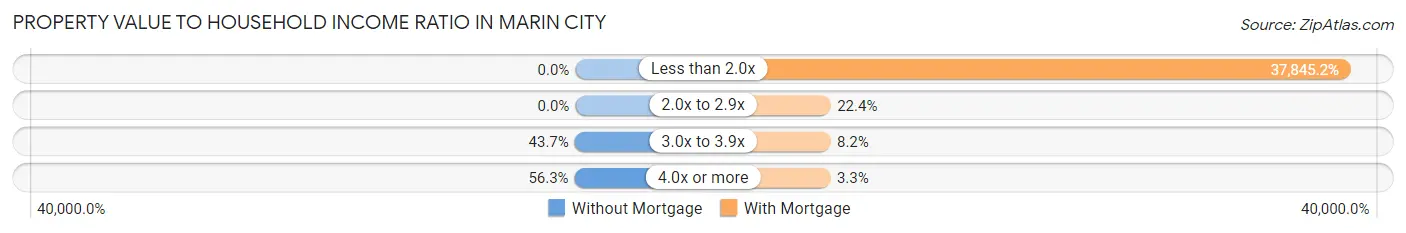
| Value-to-Income Ratio | Without Mortgage | With Mortgage |
| Less than 2.0x | 0 (0.0%) | 162,356 (37,845.2%) |
| 2.0x to 2.9x | 0 (0.0%) | 96 (22.4%) |
| 3.0x to 3.9x | 59 (43.7%) | 35 (8.2%) |
| 4.0x or more | 76 (56.3%) | 14 (3.3%) |
| Total | 135 (100.0%) | 429 (100.0%) |
Real Estate Taxes by Mortgage Status in Marin City
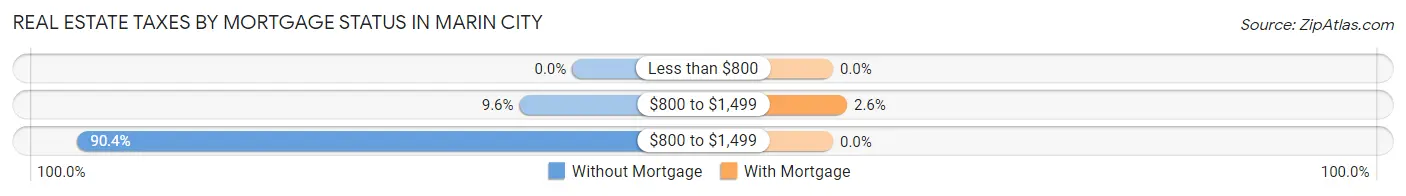
| Property Taxes | Without Mortgage | With Mortgage |
| Less than $800 | 0 (0.0%) | 0 (0.0%) |
| $800 to $1,499 | 13 (9.6%) | 11 (2.6%) |
| $800 to $1,499 | 122 (90.4%) | 0 (0.0%) |
| Total | 135 (100.0%) | 429 (100.0%) |
Health & Disability in Marin City
Health Insurance Coverage by Age in Marin City
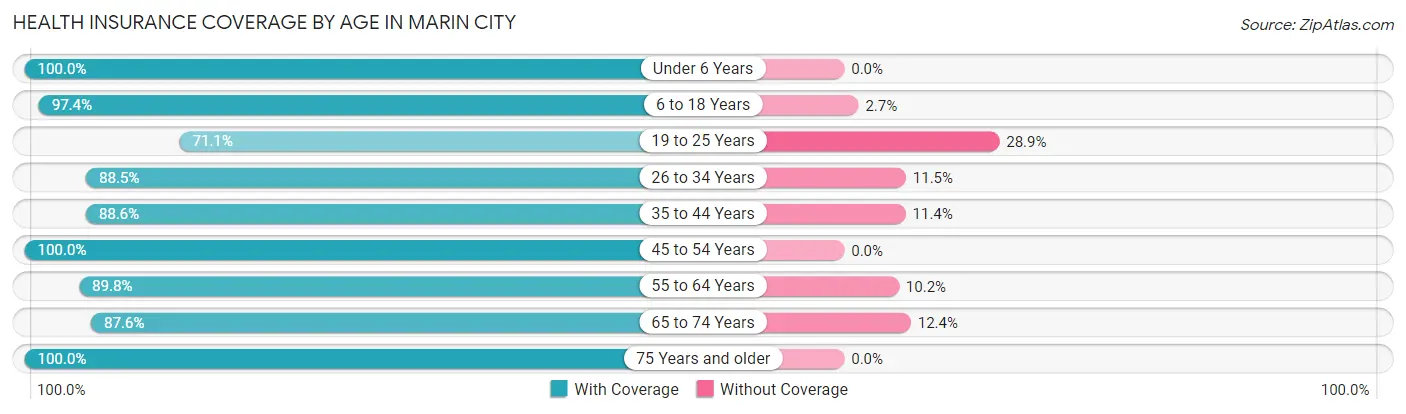
| Age Bracket | With Coverage | Without Coverage |
| Under 6 Years | 253 (100.0%) | 0 (0.0%) |
| 6 to 18 Years | 550 (97.4%) | 15 (2.6%) |
| 19 to 25 Years | 251 (71.1%) | 102 (28.9%) |
| 26 to 34 Years | 324 (88.5%) | 42 (11.5%) |
| 35 to 44 Years | 341 (88.6%) | 44 (11.4%) |
| 45 to 54 Years | 634 (100.0%) | 0 (0.0%) |
| 55 to 64 Years | 247 (89.8%) | 28 (10.2%) |
| 65 to 74 Years | 226 (87.6%) | 32 (12.4%) |
| 75 Years and older | 330 (100.0%) | 0 (0.0%) |
| Total | 3,156 (92.3%) | 263 (7.7%) |
Health Insurance Coverage by Citizenship Status in Marin City
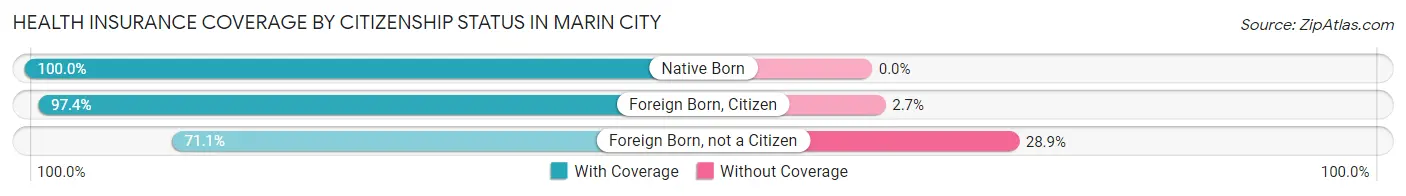
| Citizenship Status | With Coverage | Without Coverage |
| Native Born | 253 (100.0%) | 0 (0.0%) |
| Foreign Born, Citizen | 550 (97.4%) | 15 (2.6%) |
| Foreign Born, not a Citizen | 251 (71.1%) | 102 (28.9%) |
Health Insurance Coverage by Household Income in Marin City
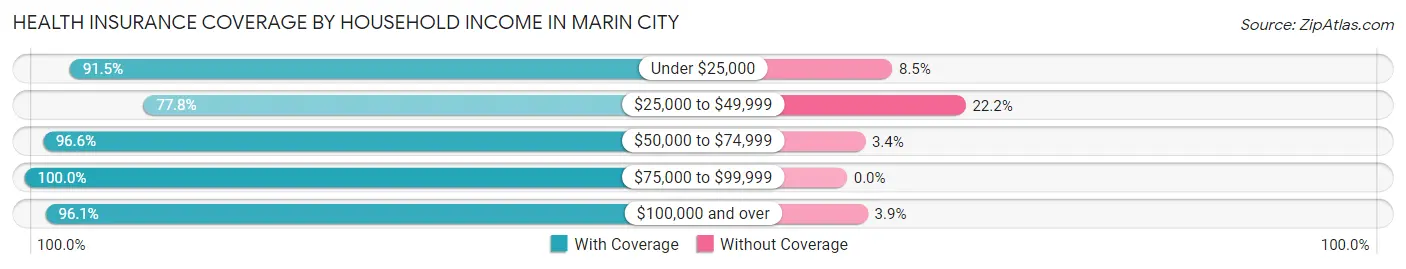
| Household Income | With Coverage | Without Coverage |
| Under $25,000 | 302 (91.5%) | 28 (8.5%) |
| $25,000 to $49,999 | 521 (77.8%) | 149 (22.2%) |
| $50,000 to $74,999 | 626 (96.6%) | 22 (3.4%) |
| $75,000 to $99,999 | 135 (100.0%) | 0 (0.0%) |
| $100,000 and over | 1,572 (96.1%) | 64 (3.9%) |
Public vs Private Health Insurance Coverage by Age in Marin City
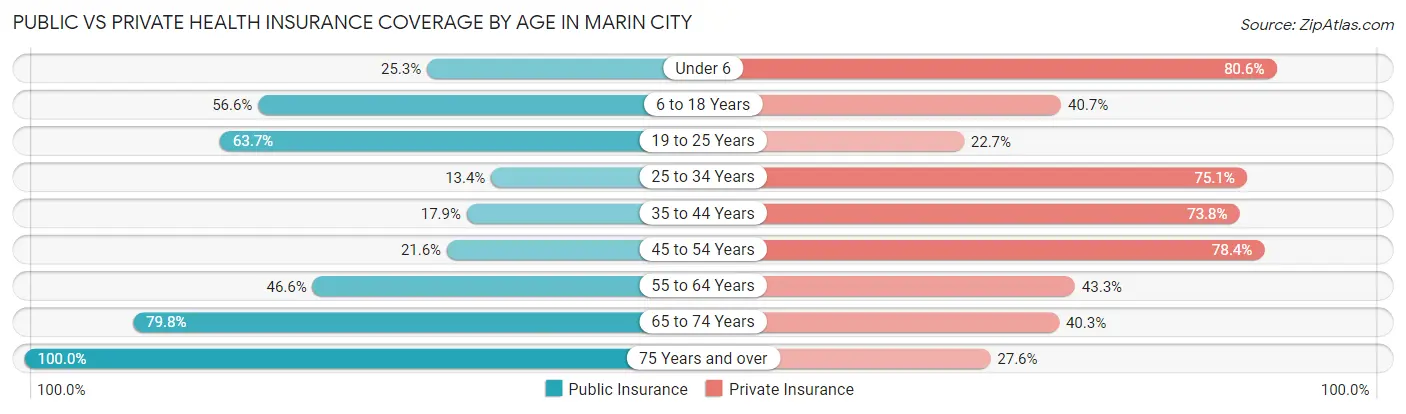
| Age Bracket | Public Insurance | Private Insurance |
| Under 6 | 64 (25.3%) | 204 (80.6%) |
| 6 to 18 Years | 320 (56.6%) | 230 (40.7%) |
| 19 to 25 Years | 225 (63.7%) | 80 (22.7%) |
| 25 to 34 Years | 49 (13.4%) | 275 (75.1%) |
| 35 to 44 Years | 69 (17.9%) | 284 (73.8%) |
| 45 to 54 Years | 137 (21.6%) | 497 (78.4%) |
| 55 to 64 Years | 128 (46.6%) | 119 (43.3%) |
| 65 to 74 Years | 206 (79.8%) | 104 (40.3%) |
| 75 Years and over | 330 (100.0%) | 91 (27.6%) |
| Total | 1,528 (44.7%) | 1,884 (55.1%) |
Disability Status by Sex by Age in Marin City
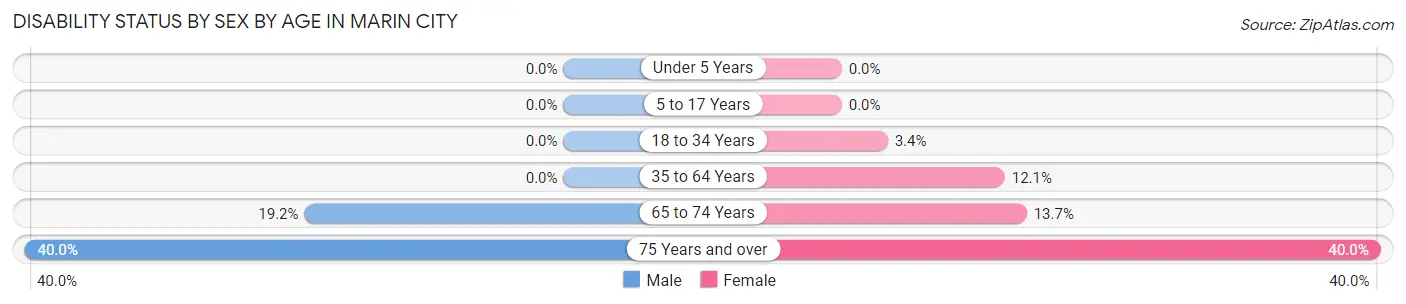
| Age Bracket | Male | Female |
| Under 5 Years | 0 (0.0%) | 0 (0.0%) |
| 5 to 17 Years | 0 (0.0%) | 0 (0.0%) |
| 18 to 34 Years | 0 (0.0%) | 12 (3.4%) |
| 35 to 64 Years | 0 (0.0%) | 95 (12.1%) |
| 65 to 74 Years | 30 (19.2%) | 14 (13.7%) |
| 75 Years and over | 58 (40.0%) | 74 (40.0%) |
Disability Class by Sex by Age in Marin City
Disability Class: Hearing Difficulty
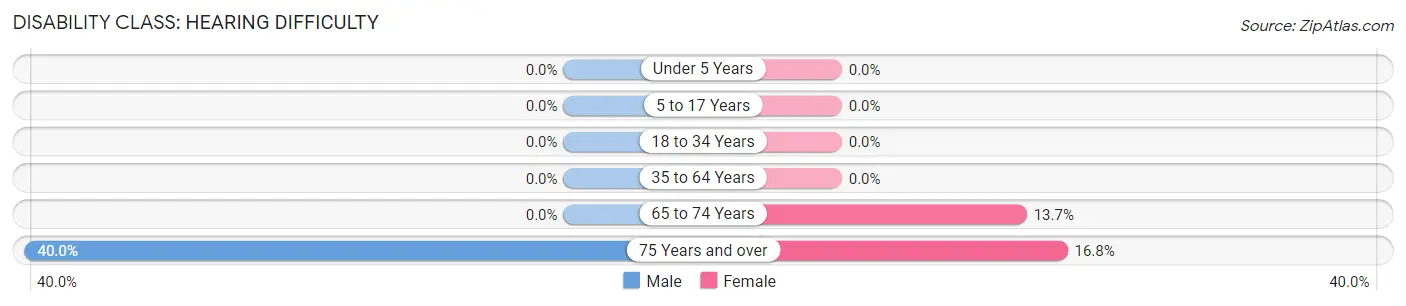
| Age Bracket | Male | Female |
| Under 5 Years | 0 (0.0%) | 0 (0.0%) |
| 5 to 17 Years | 0 (0.0%) | 0 (0.0%) |
| 18 to 34 Years | 0 (0.0%) | 0 (0.0%) |
| 35 to 64 Years | 0 (0.0%) | 0 (0.0%) |
| 65 to 74 Years | 0 (0.0%) | 14 (13.7%) |
| 75 Years and over | 58 (40.0%) | 31 (16.8%) |
Disability Class: Vision Difficulty
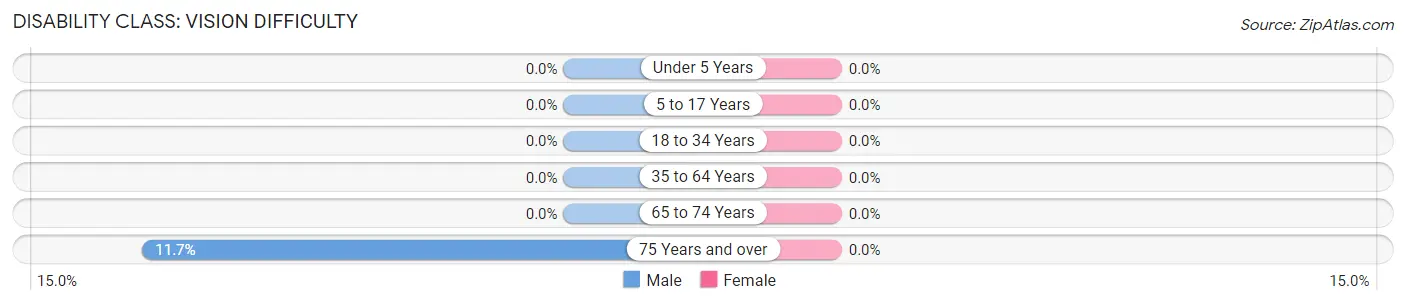
| Age Bracket | Male | Female |
| Under 5 Years | 0 (0.0%) | 0 (0.0%) |
| 5 to 17 Years | 0 (0.0%) | 0 (0.0%) |
| 18 to 34 Years | 0 (0.0%) | 0 (0.0%) |
| 35 to 64 Years | 0 (0.0%) | 0 (0.0%) |
| 65 to 74 Years | 0 (0.0%) | 0 (0.0%) |
| 75 Years and over | 17 (11.7%) | 0 (0.0%) |
Disability Class: Cognitive Difficulty
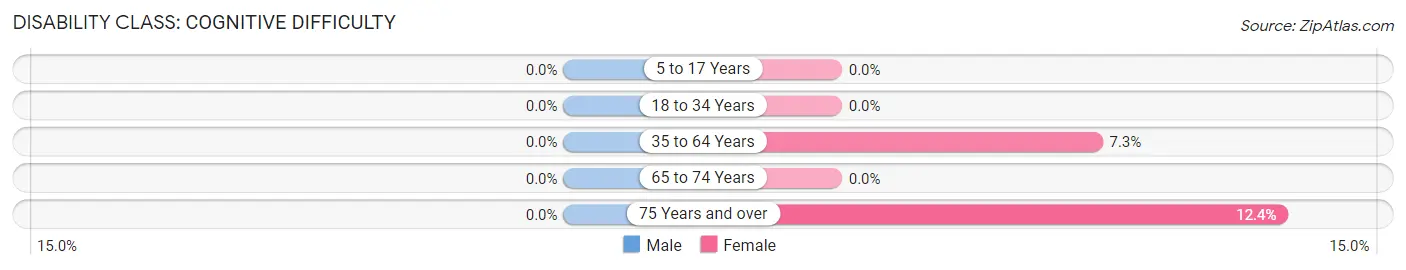
| Age Bracket | Male | Female |
| 5 to 17 Years | 0 (0.0%) | 0 (0.0%) |
| 18 to 34 Years | 0 (0.0%) | 0 (0.0%) |
| 35 to 64 Years | 0 (0.0%) | 57 (7.3%) |
| 65 to 74 Years | 0 (0.0%) | 0 (0.0%) |
| 75 Years and over | 0 (0.0%) | 23 (12.4%) |
Disability Class: Ambulatory Difficulty
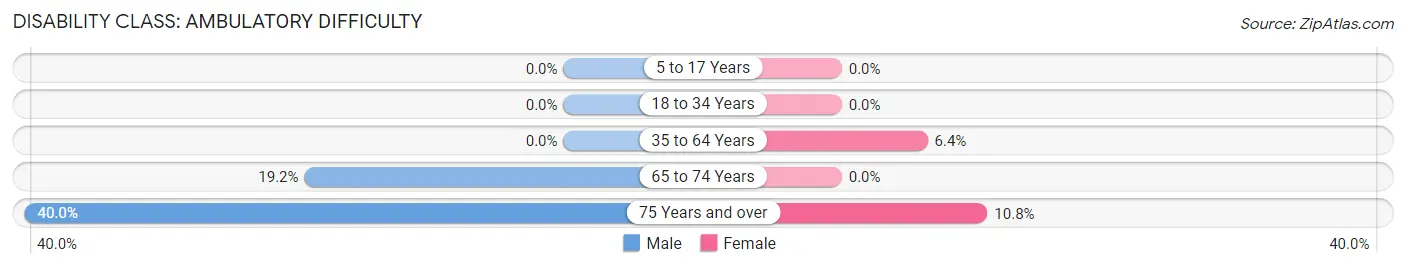
| Age Bracket | Male | Female |
| 5 to 17 Years | 0 (0.0%) | 0 (0.0%) |
| 18 to 34 Years | 0 (0.0%) | 0 (0.0%) |
| 35 to 64 Years | 0 (0.0%) | 50 (6.4%) |
| 65 to 74 Years | 30 (19.2%) | 0 (0.0%) |
| 75 Years and over | 58 (40.0%) | 20 (10.8%) |
Disability Class: Self-Care Difficulty
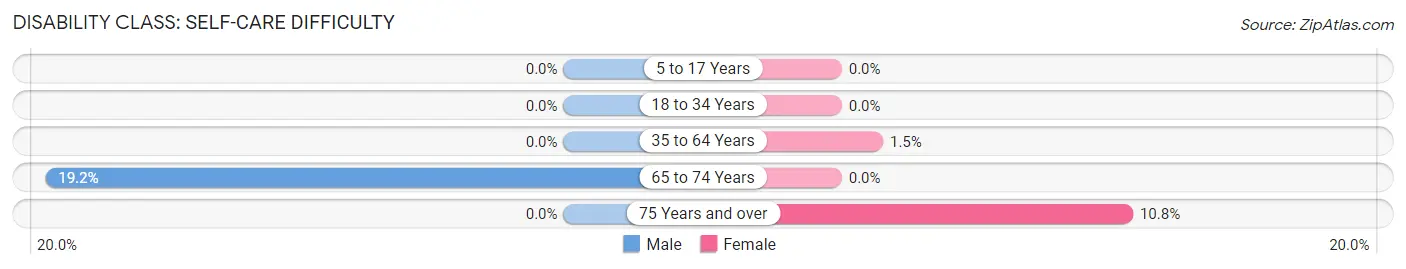
| Age Bracket | Male | Female |
| 5 to 17 Years | 0 (0.0%) | 0 (0.0%) |
| 18 to 34 Years | 0 (0.0%) | 0 (0.0%) |
| 35 to 64 Years | 0 (0.0%) | 12 (1.5%) |
| 65 to 74 Years | 30 (19.2%) | 0 (0.0%) |
| 75 Years and over | 0 (0.0%) | 20 (10.8%) |
Technology Access in Marin City
Computing Device Access in Marin City
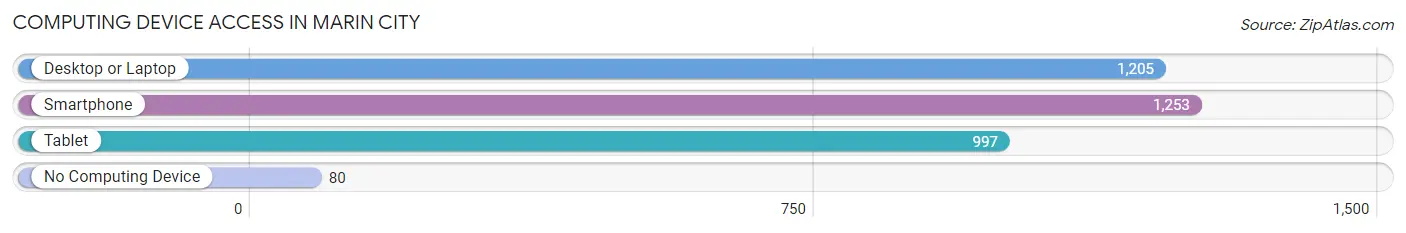
| Device Type | # Households | % Households |
| Desktop or Laptop | 1,205 | 85.3% |
| Smartphone | 1,253 | 88.7% |
| Tablet | 997 | 70.6% |
| No Computing Device | 80 | 5.7% |
| Total | 1,412 | 100.0% |
Internet Access in Marin City
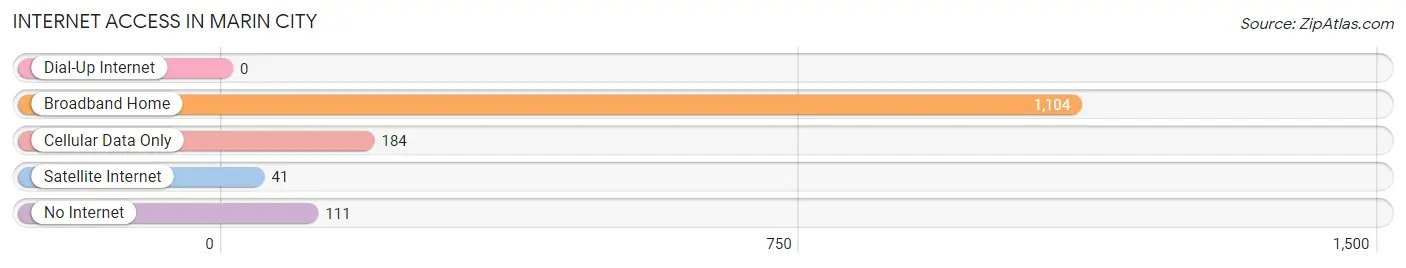
| Internet Type | # Households | % Households |
| Dial-Up Internet | 0 | 0.0% |
| Broadband Home | 1,104 | 78.2% |
| Cellular Data Only | 184 | 13.0% |
| Satellite Internet | 41 | 2.9% |
| No Internet | 111 | 7.9% |
| Total | 1,412 | 100.0% |
Marin City Summary
Marin City is a small unincorporated community located in Marin County, California. It is situated on the north side of the Golden Gate Bridge, just south of Sausalito. The population of Marin City was 2,666 at the 2010 census.
History
Marin City was originally inhabited by the Coast Miwok Native American tribe. The area was first settled by Europeans in the mid-1800s, when it was used as a ranching and farming community. In the early 1900s, the area was developed as a resort town, with the construction of a hotel and a golf course.
In the 1940s, Marin City was transformed into a military housing project. The government purchased the land and built hundreds of homes for military personnel and their families. This influx of people led to the development of a vibrant African American community.
Geography
Marin City is located in Marin County, California, on the north side of the Golden Gate Bridge. It is bordered by Sausalito to the north, Tamalpais-Homestead Valley to the east, and the San Francisco Bay to the south and west. The total area of Marin City is 0.9 square miles.
The terrain of Marin City is mostly flat, with some hills in the northern part of the community. The climate is mild, with temperatures ranging from the mid-50s to the mid-70s throughout the year.
Economy
Marin City has a diverse economy, with a mix of businesses and industries. The largest employers in the area are the Marin County government, the Marin County Sheriff’s Office, and the Marin County Fire Department. Other major employers include the Marin County Office of Education, Marin General Hospital, and the Marin County Public Library.
The community also has a number of small businesses, including restaurants, retail stores, and service providers. There are also several art galleries and cultural centers in Marin City.
Demographics
As of the 2010 census, the population of Marin City was 2,666. The racial makeup of the community was 57.3% African American, 24.3% White, 8.2% Hispanic or Latino, 6.2% Asian, and 4.0% other.
The median household income in Marin City was $50,945 in 2010, and the median family income was $58,945. The per capita income was $25,945. The unemployment rate was 8.2%.
Marin City is served by the Sausalito-Marin City School District. The community is also home to the Marin City Health and Wellness Center, which provides health care services to residents.
Common Questions
What is Per Capita Income in Marin City?
Per Capita income in Marin City is $66,053.
What is the Median Family Income in Marin City?
Median Family Income in Marin City is $100,268.
What is the Median Household income in Marin City?
Median Household Income in Marin City is $80,793.
What is Income or Wage Gap in Marin City?
Income or Wage Gap in Marin City is 33.0%.
Women in Marin City earn 67.0 cents for every dollar earned by a man.
What is Inequality or Gini Index in Marin City?
Inequality or Gini Index in Marin City is 0.55.
What is the Total Population of Marin City?
Total Population of Marin City is 3,419.
What is the Total Male Population of Marin City?
Total Male Population of Marin City is 1,677.
What is the Total Female Population of Marin City?
Total Female Population of Marin City is 1,742.
What is the Ratio of Males per 100 Females in Marin City?
There are 96.27 Males per 100 Females in Marin City.
What is the Ratio of Females per 100 Males in Marin City?
There are 103.88 Females per 100 Males in Marin City.
What is the Median Population Age in Marin City?
Median Population Age in Marin City is 40.6 Years.
What is the Average Family Size in Marin City
Average Family Size in Marin City is 3.1 People.
What is the Average Household Size in Marin City
Average Household Size in Marin City is 2.4 People.
How Large is the Labor Force in Marin City?
There are 1,794 People in the Labor Forcein in Marin City.
What is the Percentage of People in the Labor Force in Marin City?
64.8% of People are in the Labor Force in Marin City.
What is the Unemployment Rate in Marin City?
Unemployment Rate in Marin City is 6.2%.