Cities with the Highest Percentage of Black / African American Population in Delaware
RELATED REPORTS & OPTIONS
Black / African American
Delaware
Compare Cities
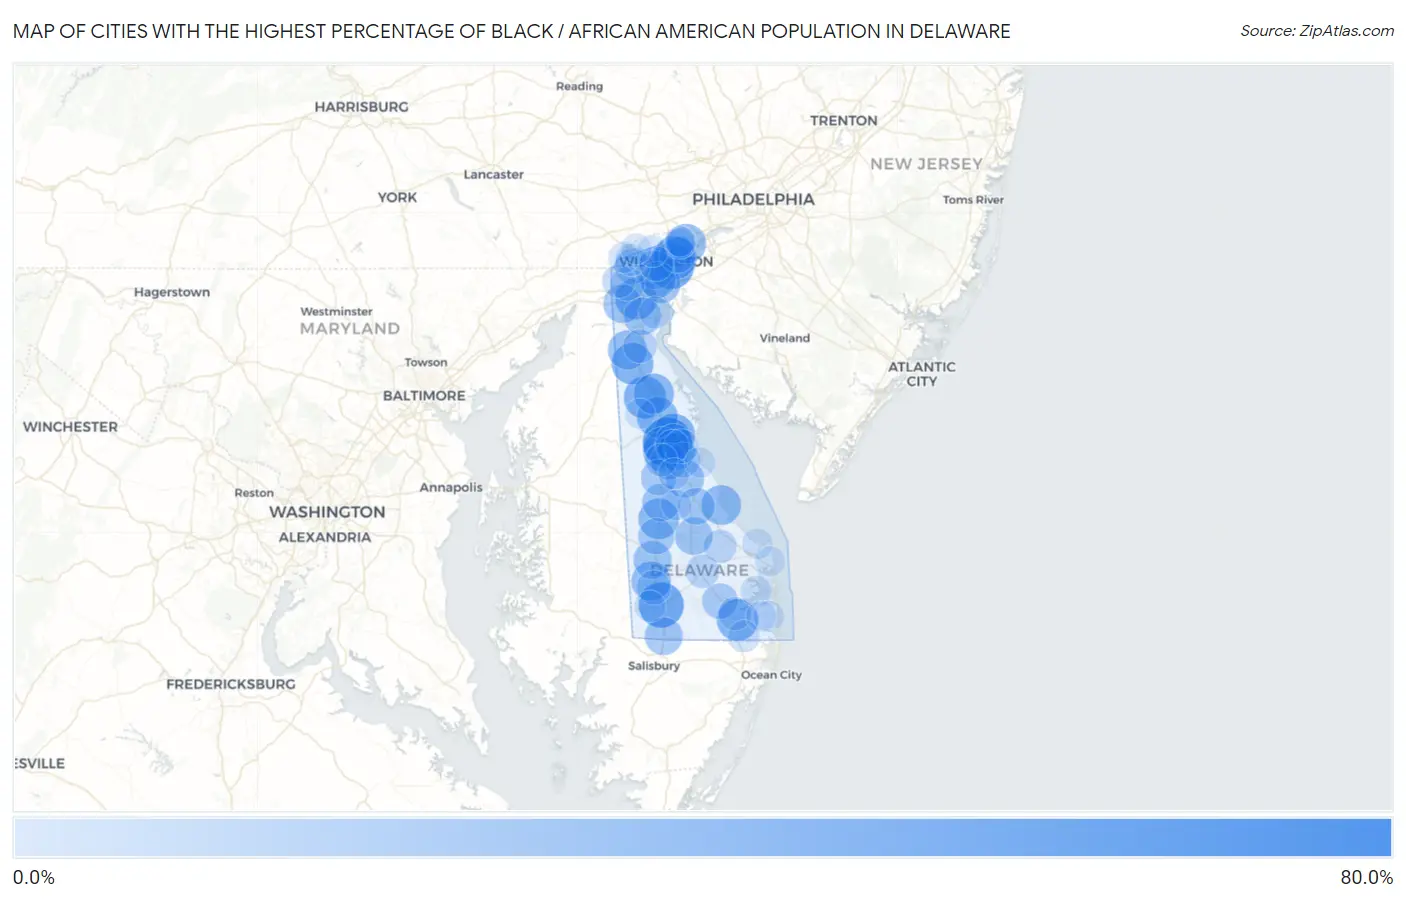
Map of Cities with the Highest Percentage of Black / African American Population in Delaware
0.0%
80.0%
Cities with the Highest Percentage of Black / African American Population in Delaware
| City | Black / African American | vs State | vs National | |
| 1. | Lincoln | 72.8% | 22.0%(+50.9)#1 | 12.5%(+60.4)#551 |
| 2. | Rodney Village | 66.8% | 22.0%(+44.8)#2 | 12.5%(+54.3)#693 |
| 3. | Wilmington | 53.7% | 22.0%(+31.7)#3 | 12.5%(+41.2)#1,120 |
| 4. | Laurel | 51.8% | 22.0%(+29.8)#4 | 12.5%(+39.3)#1,177 |
| 5. | Edgemoor | 44.8% | 22.0%(+22.8)#5 | 12.5%(+32.3)#1,477 |
| 6. | Dover | 42.2% | 22.0%(+20.3)#6 | 12.5%(+29.8)#1,615 |
| 7. | Clayton | 41.6% | 22.0%(+19.6)#7 | 12.5%(+29.1)#1,653 |
| 8. | Townsend | 39.7% | 22.0%(+17.7)#8 | 12.5%(+27.2)#1,758 |
| 9. | Frankford | 39.2% | 22.0%(+17.2)#9 | 12.5%(+26.7)#1,784 |
| 10. | Bear | 38.8% | 22.0%(+16.8)#10 | 12.5%(+26.3)#1,808 |
| 11. | Camden | 37.9% | 22.0%(+15.9)#11 | 12.5%(+25.4)#1,860 |
| 12. | Cheswold | 36.4% | 22.0%(+14.4)#12 | 12.5%(+23.9)#1,950 |
| 13. | Farmington | 35.9% | 22.0%(+13.9)#13 | 12.5%(+23.4)#1,980 |
| 14. | Smyrna | 34.8% | 22.0%(+12.8)#14 | 12.5%(+22.3)#2,043 |
| 15. | Slaughter Beach | 32.3% | 22.0%(+10.3)#15 | 12.5%(+19.8)#2,191 |
| 16. | Claymont | 32.3% | 22.0%(+10.3)#16 | 12.5%(+19.8)#2,192 |
| 17. | Seaford | 31.5% | 22.0%(+9.52)#17 | 12.5%(+19.0)#2,247 |
| 18. | Middletown | 30.4% | 22.0%(+8.46)#18 | 12.5%(+18.0)#2,329 |
| 19. | New Castle | 28.8% | 22.0%(+6.88)#19 | 12.5%(+16.4)#2,440 |
| 20. | Wyoming | 28.4% | 22.0%(+6.42)#20 | 12.5%(+15.9)#2,479 |
| 21. | Newport | 27.2% | 22.0%(+5.28)#21 | 12.5%(+14.8)#2,553 |
| 22. | Bridgeville | 26.9% | 22.0%(+4.94)#22 | 12.5%(+14.4)#2,579 |
| 23. | Glasgow | 26.9% | 22.0%(+4.89)#23 | 12.5%(+14.4)#2,583 |
| 24. | Delmar | 26.1% | 22.0%(+4.14)#24 | 12.5%(+13.6)#2,642 |
| 25. | Frederica | 26.1% | 22.0%(+4.11)#25 | 12.5%(+13.6)#2,648 |
| 26. | Harrington | 25.9% | 22.0%(+3.90)#26 | 12.5%(+13.4)#2,675 |
| 27. | St Georges | 25.3% | 22.0%(+3.34)#27 | 12.5%(+12.8)#2,738 |
| 28. | Ellendale | 25.3% | 22.0%(+3.32)#28 | 12.5%(+12.8)#2,739 |
| 29. | Rising Sun Lebanon | 25.2% | 22.0%(+3.26)#29 | 12.5%(+12.8)#2,745 |
| 30. | Kent Acres | 24.1% | 22.0%(+2.14)#30 | 12.5%(+11.6)#2,847 |
| 31. | Milford | 22.8% | 22.0%(+0.810)#31 | 12.5%(+10.3)#2,998 |
| 32. | Woodside East | 21.6% | 22.0%(-0.338)#32 | 12.5%(+9.16)#3,109 |
| 33. | Wilmington Manor | 21.3% | 22.0%(-0.659)#33 | 12.5%(+8.84)#3,151 |
| 34. | Greenwood | 20.8% | 22.0%(-1.14)#34 | 12.5%(+8.35)#3,206 |
| 35. | Felton | 19.5% | 22.0%(-2.51)#35 | 12.5%(+6.98)#3,370 |
| 36. | Millsboro | 19.3% | 22.0%(-2.64)#36 | 12.5%(+6.86)#3,387 |
| 37. | Bellefonte | 18.9% | 22.0%(-3.09)#37 | 12.5%(+6.40)#3,440 |
| 38. | Pike Creek Valley | 17.5% | 22.0%(-4.48)#38 | 12.5%(+5.02)#3,650 |
| 39. | Magnolia | 16.3% | 22.0%(-5.62)#39 | 12.5%(+3.88)#3,842 |
| 40. | Elsmere | 14.9% | 22.0%(-7.11)#40 | 12.5%(+2.38)#4,132 |
| 41. | Blades | 14.0% | 22.0%(-8.01)#41 | 12.5%(+1.49)#4,305 |
| 42. | Dover Base Housing | 13.4% | 22.0%(-8.57)#42 | 12.5%(+0.926)#4,417 |
| 43. | Brookside | 12.4% | 22.0%(-9.56)#43 | 12.5%(-0.064)#4,653 |
| 44. | Odessa | 11.6% | 22.0%(-10.4)#44 | 12.5%(-0.902)#4,859 |
| 45. | Georgetown | 10.9% | 22.0%(-11.0)#45 | 12.5%(-1.54)#5,036 |
| 46. | Milton | 10.4% | 22.0%(-11.6)#46 | 12.5%(-2.11)#5,202 |
| 47. | Highland Acres | 10.0% | 22.0%(-11.9)#47 | 12.5%(-2.45)#5,319 |
| 48. | Newark | 9.8% | 22.0%(-12.2)#48 | 12.5%(-2.69)#5,395 |
| 49. | Dagsboro | 9.7% | 22.0%(-12.3)#49 | 12.5%(-2.75)#5,416 |
| 50. | Woodside | 8.7% | 22.0%(-13.3)#50 | 12.5%(-3.77)#5,763 |
| 51. | Delaware City | 6.2% | 22.0%(-15.8)#51 | 12.5%(-6.31)#6,960 |
| 52. | Selbyville | 5.8% | 22.0%(-16.2)#52 | 12.5%(-6.66)#7,163 |
| 53. | Pike Creek | 5.4% | 22.0%(-16.5)#53 | 12.5%(-7.04)#7,413 |
| 54. | Greenville | 4.1% | 22.0%(-17.9)#54 | 12.5%(-8.40)#8,496 |
| 55. | Riverview | 3.2% | 22.0%(-18.8)#55 | 12.5%(-9.25)#9,411 |
| 56. | Bethel | 3.2% | 22.0%(-18.8)#56 | 12.5%(-9.28)#9,442 |
| 57. | Long Neck | 2.6% | 22.0%(-19.4)#57 | 12.5%(-9.86)#10,219 |
| 58. | North Star | 2.6% | 22.0%(-19.4)#58 | 12.5%(-9.88)#10,257 |
| 59. | Ocean View | 1.8% | 22.0%(-20.1)#59 | 12.5%(-10.6)#11,578 |
| 60. | Hockessin | 1.8% | 22.0%(-20.2)#60 | 12.5%(-10.7)#11,733 |
| 61. | Ardentown | 1.3% | 22.0%(-20.6)#61 | 12.5%(-11.1)#12,781 |
| 62. | Lewes | 1.1% | 22.0%(-20.8)#62 | 12.5%(-11.3)#13,404 |
| 63. | Millville | 1.1% | 22.0%(-20.9)#63 | 12.5%(-11.4)#13,628 |
| 64. | Houston | 0.94% | 22.0%(-21.0)#64 | 12.5%(-11.5)#14,094 |
| 65. | Bowers | 0.89% | 22.0%(-21.1)#65 | 12.5%(-11.6)#14,260 |
| 66. | Ardencroft | 0.53% | 22.0%(-21.4)#66 | 12.5%(-11.9)#15,772 |
| 67. | Arden | 0.46% | 22.0%(-21.5)#67 | 12.5%(-12.0)#16,046 |
| 68. | Kenton | 0.25% | 22.0%(-21.7)#68 | 12.5%(-12.2)#17,091 |
| 69. | Rehoboth Beach | 0.074% | 22.0%(-21.9)#69 | 12.5%(-12.4)#17,926 |
1
Common Questions
What are the Top 10 Cities with the Highest Percentage of Black / African American Population in Delaware?
Top 10 Cities with the Highest Percentage of Black / African American Population in Delaware are:
#1
66.8%
#2
53.7%
#3
51.8%
#4
44.8%
#5
42.2%
#6
41.6%
#7
39.7%
#8
39.2%
#9
38.8%
#10
37.9%
What city has the Highest Percentage of Black / African American Population in Delaware?
Rodney Village has the Highest Percentage of Black / African American Population in Delaware with 66.8%.
What is the Percentage of Black / African American Population in the State of Delaware?
Percentage of Black / African American Population in Delaware is 22.0%.
What is the Percentage of Black / African American Population in the United States?
Percentage of Black / African American Population in the United States is 12.5%.