Cities with the Highest Percentage of Black / African American Population in Arizona
RELATED REPORTS & OPTIONS
Black / African American
Arizona
Compare Cities
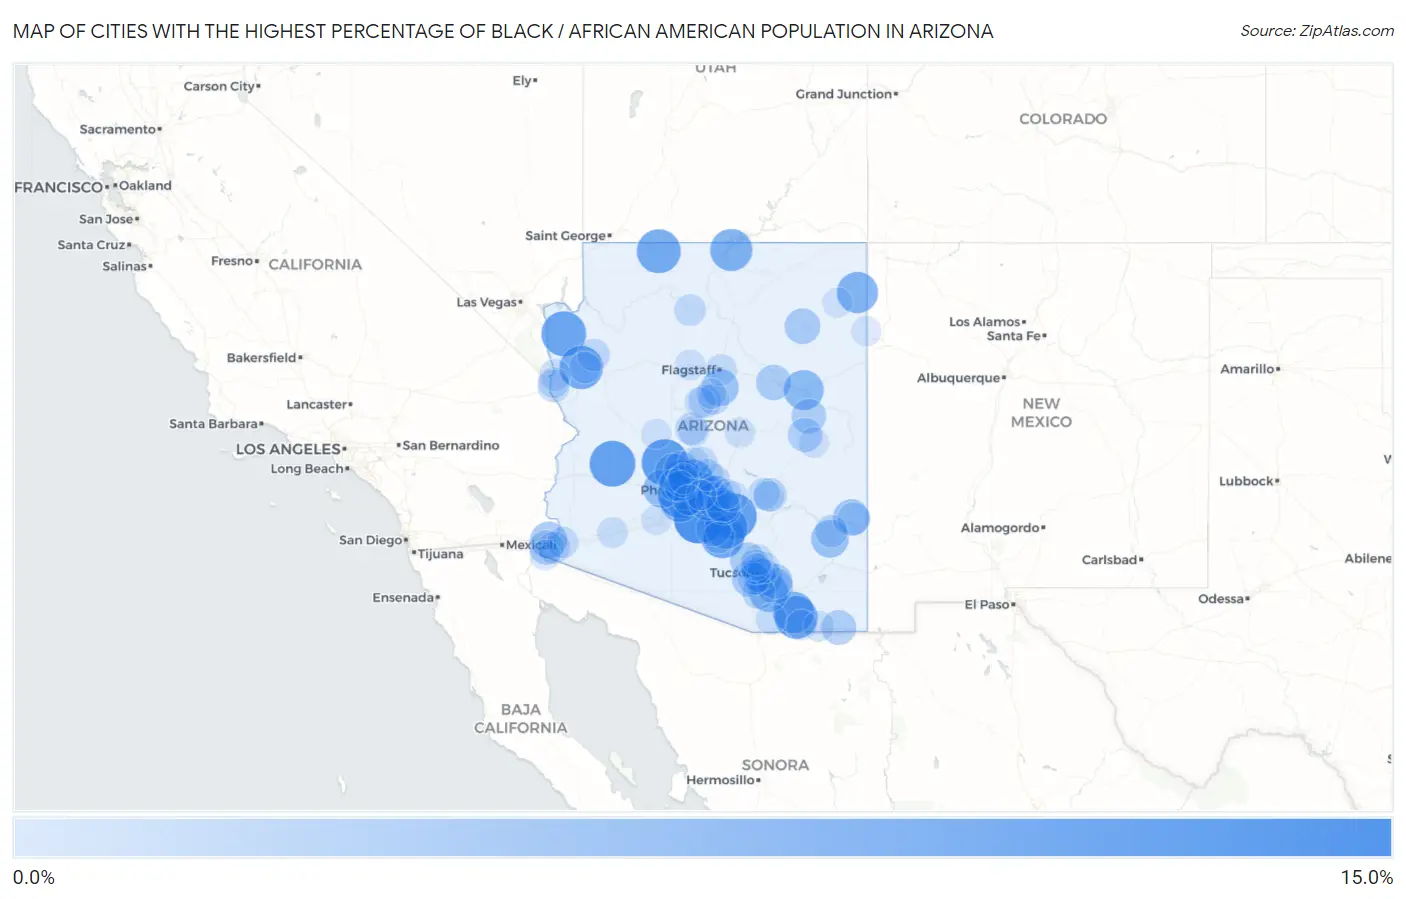
Map of Cities with the Highest Percentage of Black / African American Population in Arizona
0.0%
15.0%
Cities with the Highest Percentage of Black / African American Population in Arizona
| City | Black / African American | vs State | vs National | |
| 1. | Maricopa | 12.2% | 4.6%(+7.68)#1 | 12.5%(-0.231)#4,699 |
| 2. | Morristown | 10.5% | 4.6%(+5.94)#2 | 12.5%(-1.97)#5,151 |
| 3. | Avondale | 10.4% | 4.6%(+5.87)#3 | 12.5%(-2.04)#5,172 |
| 4. | Florence | 10.1% | 4.6%(+5.55)#4 | 12.5%(-2.36)#5,287 |
| 5. | Wenden | 10.0% | 4.6%(+5.46)#5 | 12.5%(-2.45)#5,317 |
| 6. | White Hills | 9.4% | 4.6%(+4.87)#6 | 12.5%(-3.04)#5,498 |
| 7. | Kaibab | 8.9% | 4.6%(+4.33)#7 | 12.5%(-3.58)#5,684 |
| 8. | Eloy | 8.8% | 4.6%(+4.25)#8 | 12.5%(-3.66)#5,715 |
| 9. | Clacks Canyon | 8.7% | 4.6%(+4.14)#9 | 12.5%(-3.77)#5,769 |
| 10. | Sierra Vista | 8.3% | 4.6%(+3.71)#10 | 12.5%(-4.20)#5,942 |
| 11. | Coolidge | 8.3% | 4.6%(+3.71)#11 | 12.5%(-4.20)#5,943 |
| 12. | Lechee | 7.9% | 4.6%(+3.35)#12 | 12.5%(-4.56)#6,086 |
| 13. | El Mirage | 7.6% | 4.6%(+3.02)#13 | 12.5%(-4.89)#6,243 |
| 14. | Huachuca City | 7.4% | 4.6%(+2.84)#14 | 12.5%(-5.07)#6,326 |
| 15. | Phoenix | 7.4% | 4.6%(+2.80)#15 | 12.5%(-5.11)#6,342 |
| 16. | Tsaile | 7.4% | 4.6%(+2.79)#16 | 12.5%(-5.12)#6,344 |
| 17. | Tempe | 7.3% | 4.6%(+2.76)#17 | 12.5%(-5.15)#6,362 |
| 18. | Glendale | 6.9% | 4.6%(+2.32)#18 | 12.5%(-5.59)#6,569 |
| 19. | Holbrook | 6.6% | 4.6%(+2.01)#19 | 12.5%(-5.90)#6,732 |
| 20. | Tolleson | 6.5% | 4.6%(+1.98)#20 | 12.5%(-5.93)#6,751 |
| 21. | Goodyear | 6.2% | 4.6%(+1.61)#21 | 12.5%(-6.30)#6,954 |
| 22. | Corona De Tucson | 6.0% | 4.6%(+1.48)#22 | 12.5%(-6.43)#7,047 |
| 23. | Chandler | 5.8% | 4.6%(+1.20)#23 | 12.5%(-6.71)#7,197 |
| 24. | Buckeye | 5.7% | 4.6%(+1.11)#24 | 12.5%(-6.80)#7,262 |
| 25. | Surprise | 5.4% | 4.6%(+0.798)#25 | 12.5%(-7.11)#7,469 |
| 26. | Swift Trail Junction | 5.3% | 4.6%(+0.737)#26 | 12.5%(-7.17)#7,506 |
| 27. | Munds Park | 5.1% | 4.6%(+0.492)#27 | 12.5%(-7.42)#7,679 |
| 28. | Avenue B And C | 4.8% | 4.6%(+0.245)#28 | 12.5%(-7.67)#7,850 |
| 29. | Tucson | 4.8% | 4.6%(+0.212)#29 | 12.5%(-7.70)#7,875 |
| 30. | Mesa | 4.6% | 4.6%(+0.083)#30 | 12.5%(-7.83)#7,973 |
| 31. | Morenci | 4.6% | 4.6%(+0.075)#31 | 12.5%(-7.83)#7,978 |
| 32. | Valencia West | 4.4% | 4.6%(-0.185)#32 | 12.5%(-8.10)#8,214 |
| 33. | Vail | 4.3% | 4.6%(-0.219)#33 | 12.5%(-8.13)#8,244 |
| 34. | Keams Canyon | 4.1% | 4.6%(-0.432)#34 | 12.5%(-8.34)#8,454 |
| 35. | Gilbert | 4.1% | 4.6%(-0.502)#35 | 12.5%(-8.41)#8,507 |
| 36. | Winslow | 4.0% | 4.6%(-0.602)#36 | 12.5%(-8.51)#8,600 |
| 37. | Marana | 3.8% | 4.6%(-0.720)#37 | 12.5%(-8.63)#8,730 |
| 38. | Rincon Valley | 3.7% | 4.6%(-0.814)#38 | 12.5%(-8.72)#8,820 |
| 39. | Casa Grande | 3.7% | 4.6%(-0.815)#39 | 12.5%(-8.72)#8,821 |
| 40. | Douglas | 3.7% | 4.6%(-0.892)#40 | 12.5%(-8.80)#8,893 |
| 41. | Snowflake | 3.6% | 4.6%(-0.959)#41 | 12.5%(-8.87)#8,977 |
| 42. | Peoria | 3.6% | 4.6%(-0.997)#42 | 12.5%(-8.91)#9,009 |
| 43. | San Tan Valley | 3.5% | 4.6%(-1.03)#43 | 12.5%(-8.94)#9,044 |
| 44. | Queen Creek | 3.4% | 4.6%(-1.12)#44 | 12.5%(-9.03)#9,133 |
| 45. | South Tucson | 3.4% | 4.6%(-1.16)#45 | 12.5%(-9.07)#9,178 |
| 46. | Somerton | 3.4% | 4.6%(-1.18)#46 | 12.5%(-9.09)#9,213 |
| 47. | Linden | 3.3% | 4.6%(-1.22)#47 | 12.5%(-9.13)#9,259 |
| 48. | Globe | 2.8% | 4.6%(-1.71)#48 | 12.5%(-9.62)#9,890 |
| 49. | Sahuarita | 2.7% | 4.6%(-1.87)#49 | 12.5%(-9.78)#10,110 |
| 50. | Clifton | 2.5% | 4.6%(-2.03)#50 | 12.5%(-9.94)#10,348 |
| 51. | Cornville | 2.5% | 4.6%(-2.08)#51 | 12.5%(-9.99)#10,415 |
| 52. | Safford | 2.4% | 4.6%(-2.12)#52 | 12.5%(-10.0)#10,481 |
| 53. | Drexel Heights | 2.3% | 4.6%(-2.22)#53 | 12.5%(-10.1)#10,657 |
| 54. | Citrus Park | 2.3% | 4.6%(-2.26)#54 | 12.5%(-10.2)#10,727 |
| 55. | Spring Valley | 2.2% | 4.6%(-2.31)#55 | 12.5%(-10.2)#10,826 |
| 56. | Valle Vista | 2.2% | 4.6%(-2.32)#56 | 12.5%(-10.2)#10,833 |
| 57. | Yuma | 2.2% | 4.6%(-2.32)#57 | 12.5%(-10.2)#10,847 |
| 58. | Mesquite Creek | 2.2% | 4.6%(-2.33)#58 | 12.5%(-10.2)#10,868 |
| 59. | Fountain Hills | 2.2% | 4.6%(-2.34)#59 | 12.5%(-10.3)#10,879 |
| 60. | Scottsdale | 2.1% | 4.6%(-2.46)#60 | 12.5%(-10.4)#11,064 |
| 61. | Youngtown | 2.1% | 4.6%(-2.47)#61 | 12.5%(-10.4)#11,091 |
| 62. | Cave Creek | 2.1% | 4.6%(-2.51)#62 | 12.5%(-10.4)#11,168 |
| 63. | Catalina Foothills | 2.0% | 4.6%(-2.53)#63 | 12.5%(-10.4)#11,204 |
| 64. | Kingman | 2.0% | 4.6%(-2.56)#64 | 12.5%(-10.5)#11,282 |
| 65. | Miami | 2.0% | 4.6%(-2.56)#65 | 12.5%(-10.5)#11,284 |
| 66. | Arizona City | 2.0% | 4.6%(-2.57)#66 | 12.5%(-10.5)#11,293 |
| 67. | Grand Canyon Village | 2.0% | 4.6%(-2.57)#67 | 12.5%(-10.5)#11,304 |
| 68. | Village Of Oak Creek Big Park | 1.9% | 4.6%(-2.63)#68 | 12.5%(-10.5)#11,416 |
| 69. | Oak Creek Canyon | 1.9% | 4.6%(-2.65)#69 | 12.5%(-10.6)#11,447 |
| 70. | Bullhead City | 1.9% | 4.6%(-2.67)#70 | 12.5%(-10.6)#11,481 |
| 71. | Flagstaff | 1.8% | 4.6%(-2.75)#71 | 12.5%(-10.7)#11,637 |
| 72. | Fortuna Foothills | 1.8% | 4.6%(-2.77)#72 | 12.5%(-10.7)#11,671 |
| 73. | Patagonia | 1.7% | 4.6%(-2.89)#73 | 12.5%(-10.8)#11,963 |
| 74. | Oro Valley | 1.7% | 4.6%(-2.89)#74 | 12.5%(-10.8)#11,969 |
| 75. | Casas Adobes | 1.6% | 4.6%(-2.94)#75 | 12.5%(-10.8)#12,112 |
| 76. | Litchfield Park | 1.6% | 4.6%(-2.94)#76 | 12.5%(-10.9)#12,116 |
| 77. | Timberline-Fernwood | 1.6% | 4.6%(-2.96)#77 | 12.5%(-10.9)#12,159 |
| 78. | Cordes Lakes | 1.5% | 4.6%(-3.02)#78 | 12.5%(-10.9)#12,299 |
| 79. | Flowing Wells | 1.5% | 4.6%(-3.02)#79 | 12.5%(-10.9)#12,320 |
| 80. | Verde Village | 1.5% | 4.6%(-3.08)#80 | 12.5%(-11.0)#12,449 |
| 81. | Dateland | 1.5% | 4.6%(-3.09)#81 | 12.5%(-11.0)#12,488 |
| 82. | Anthem | 1.5% | 4.6%(-3.11)#82 | 12.5%(-11.0)#12,518 |
| 83. | Gold Canyon | 1.5% | 4.6%(-3.11)#83 | 12.5%(-11.0)#12,521 |
| 84. | Sun City | 1.4% | 4.6%(-3.13)#84 | 12.5%(-11.0)#12,578 |
| 85. | Bisbee | 1.4% | 4.6%(-3.13)#85 | 12.5%(-11.0)#12,590 |
| 86. | Fort Mohave | 1.4% | 4.6%(-3.13)#86 | 12.5%(-11.0)#12,593 |
| 87. | Sierra Vista Southeast | 1.4% | 4.6%(-3.14)#87 | 12.5%(-11.1)#12,618 |
| 88. | Lake Of The Woods | 1.3% | 4.6%(-3.25)#88 | 12.5%(-11.2)#12,863 |
| 89. | San Luis | 1.3% | 4.6%(-3.30)#89 | 12.5%(-11.2)#13,031 |
| 90. | Mesa Del Caballo | 1.3% | 4.6%(-3.30)#90 | 12.5%(-11.2)#13,045 |
| 91. | St Johns | 1.3% | 4.6%(-3.31)#91 | 12.5%(-11.2)#13,048 |
| 92. | Williams | 1.3% | 4.6%(-3.31)#92 | 12.5%(-11.2)#13,057 |
| 93. | Apache Junction | 1.2% | 4.6%(-3.39)#93 | 12.5%(-11.3)#13,318 |
| 94. | Sedona | 1.1% | 4.6%(-3.42)#94 | 12.5%(-11.3)#13,398 |
| 95. | Six Shooter Canyon | 1.1% | 4.6%(-3.43)#95 | 12.5%(-11.3)#13,420 |
| 96. | Guadalupe | 1.1% | 4.6%(-3.44)#96 | 12.5%(-11.3)#13,450 |
| 97. | Gila Bend | 1.1% | 4.6%(-3.44)#97 | 12.5%(-11.3)#13,464 |
| 98. | Peeples Valley | 1.1% | 4.6%(-3.47)#98 | 12.5%(-11.4)#13,563 |
| 99. | Chinle | 1.1% | 4.6%(-3.48)#99 | 12.5%(-11.4)#13,604 |
| 100. | Fort Defiance | 1.1% | 4.6%(-3.48)#100 | 12.5%(-11.4)#13,609 |
Common Questions
What are the Top 10 Cities with the Highest Percentage of Black / African American Population in Arizona?
Top 10 Cities with the Highest Percentage of Black / African American Population in Arizona are:
#1
12.2%
#2
10.5%
#3
10.4%
#4
10.1%
#5
10.0%
#6
9.4%
#7
8.9%
#8
8.8%
#9
8.7%
#10
8.3%
What city has the Highest Percentage of Black / African American Population in Arizona?
Maricopa has the Highest Percentage of Black / African American Population in Arizona with 12.2%.
What is the Percentage of Black / African American Population in the State of Arizona?
Percentage of Black / African American Population in Arizona is 4.6%.
What is the Percentage of Black / African American Population in the United States?
Percentage of Black / African American Population in the United States is 12.5%.