Bellflower, CA Map & Demographics
Bellflower Map
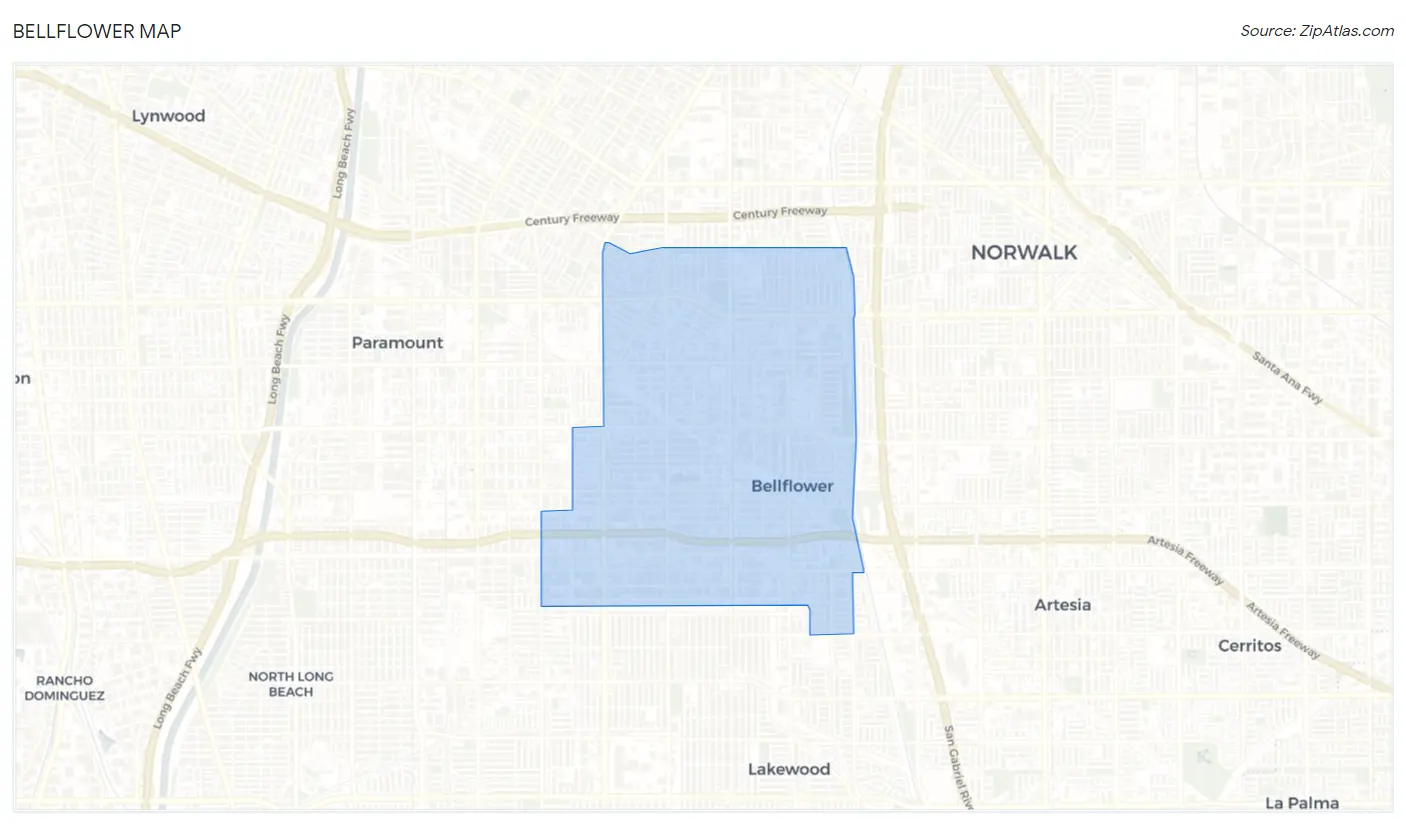
Bellflower Overview
$28,918
PER CAPITA INCOME
$80,445
AVG FAMILY INCOME
$75,379
AVG HOUSEHOLD INCOME
21.4%
WAGE / INCOME GAP [ % ]
78.6¢/ $1
WAGE / INCOME GAP [ $ ]
$10,906
FAMILY INCOME DEFICIT
0.42
INEQUALITY / GINI INDEX
78,352
TOTAL POPULATION
37,934
MALE POPULATION
40,418
FEMALE POPULATION
93.85
MALES / 100 FEMALES
106.55
FEMALES / 100 MALES
35.5
MEDIAN AGE
3.7
AVG FAMILY SIZE
3.2
AVG HOUSEHOLD SIZE
41,164
LABOR FORCE [ PEOPLE ]
66.3%
PERCENT IN LABOR FORCE
8.4%
UNEMPLOYMENT RATE
Bellflower Zip Codes
Bellflower Area Codes
Income in Bellflower
Income Overview in Bellflower
Per Capita Income in Bellflower is $28,918, while median incomes of families and households are $80,445 and $75,379 respectively.
| Characteristic | Number | Measure |
| Per Capita Income | 78,352 | $28,918 |
| Median Family Income | 17,684 | $80,445 |
| Mean Family Income | 17,684 | $95,559 |
| Median Household Income | 24,065 | $75,379 |
| Mean Household Income | 24,065 | $90,321 |
| Income Deficit | 17,684 | $10,906 |
| Wage / Income Gap (%) | 78,352 | 21.44% |
| Wage / Income Gap ($) | 78,352 | 78.56¢ per $1 |
| Gini / Inequality Index | 78,352 | 0.42 |
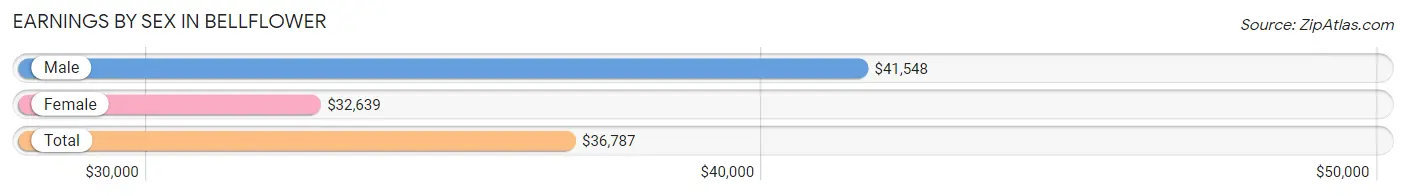
Earnings by Sex in Bellflower
Average Earnings in Bellflower are $36,787, $41,548 for men and $32,639 for women, a difference of 21.4%.
| Sex | Number | Average Earnings |
| Male | 22,204 (53.9%) | $41,548 |
| Female | 19,013 (46.1%) | $32,639 |
| Total | 41,217 (100.0%) | $36,787 |
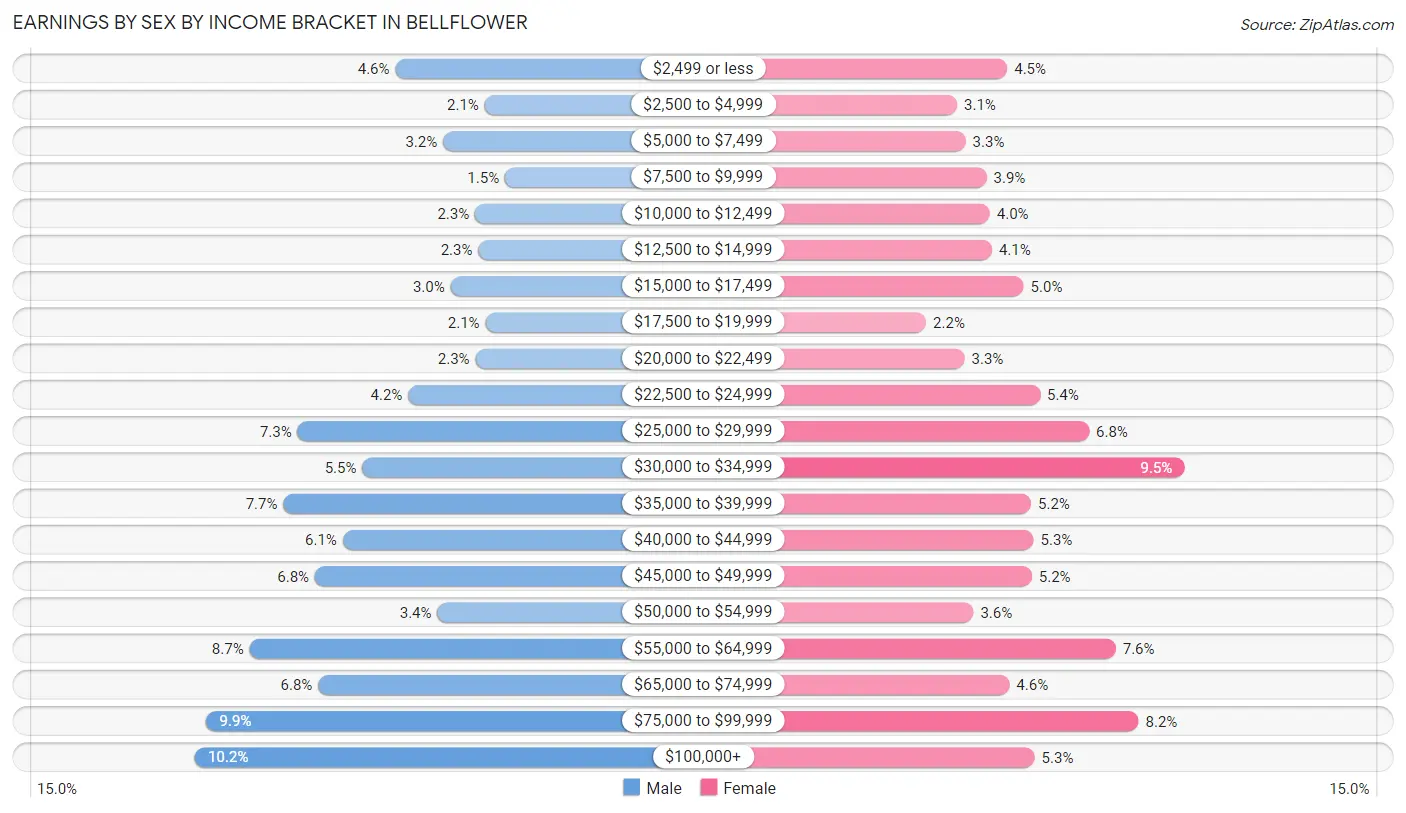
Earnings by Sex by Income Bracket in Bellflower
The most common earnings brackets in Bellflower are $100,000+ for men (2,267 | 10.2%) and $30,000 to $34,999 for women (1,803 | 9.5%).
| Income | Male | Female |
| $2,499 or less | 1,018 (4.6%) | 857 (4.5%) |
| $2,500 to $4,999 | 459 (2.1%) | 590 (3.1%) |
| $5,000 to $7,499 | 719 (3.2%) | 635 (3.3%) |
| $7,500 to $9,999 | 334 (1.5%) | 747 (3.9%) |
| $10,000 to $12,499 | 519 (2.3%) | 765 (4.0%) |
| $12,500 to $14,999 | 499 (2.2%) | 775 (4.1%) |
| $15,000 to $17,499 | 673 (3.0%) | 944 (5.0%) |
| $17,500 to $19,999 | 456 (2.1%) | 424 (2.2%) |
| $20,000 to $22,499 | 517 (2.3%) | 630 (3.3%) |
| $22,500 to $24,999 | 936 (4.2%) | 1,033 (5.4%) |
| $25,000 to $29,999 | 1,627 (7.3%) | 1,294 (6.8%) |
| $30,000 to $34,999 | 1,223 (5.5%) | 1,803 (9.5%) |
| $35,000 to $39,999 | 1,717 (7.7%) | 985 (5.2%) |
| $40,000 to $44,999 | 1,345 (6.1%) | 999 (5.2%) |
| $45,000 to $49,999 | 1,518 (6.8%) | 988 (5.2%) |
| $50,000 to $54,999 | 755 (3.4%) | 676 (3.6%) |
| $55,000 to $64,999 | 1,927 (8.7%) | 1,437 (7.6%) |
| $65,000 to $74,999 | 1,499 (6.8%) | 868 (4.6%) |
| $75,000 to $99,999 | 2,196 (9.9%) | 1,560 (8.2%) |
| $100,000+ | 2,267 (10.2%) | 1,003 (5.3%) |
| Total | 22,204 (100.0%) | 19,013 (100.0%) |
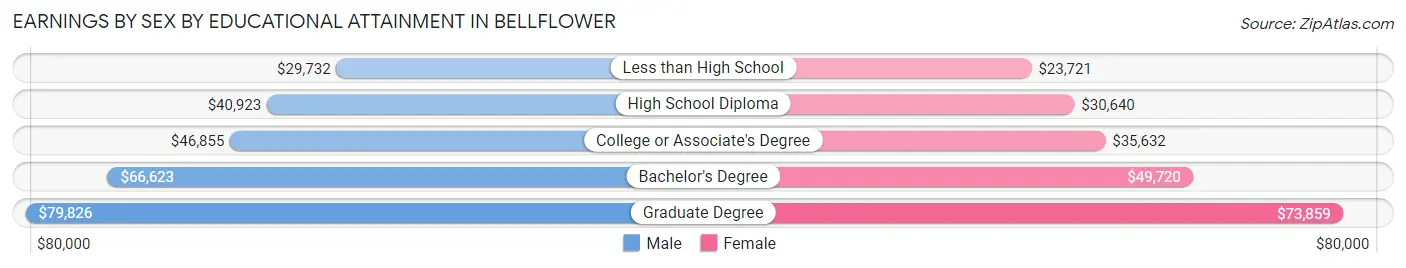
Earnings by Sex by Educational Attainment in Bellflower
Average earnings in Bellflower are $44,688 for men and $34,918 for women, a difference of 21.9%. Men with an educational attainment of graduate degree enjoy the highest average annual earnings of $79,826, while those with less than high school education earn the least with $29,732. Women with an educational attainment of graduate degree earn the most with the average annual earnings of $73,859, while those with less than high school education have the smallest earnings of $23,721.
| Educational Attainment | Male Income | Female Income |
| Less than High School | $29,732 | $23,721 |
| High School Diploma | $40,923 | $30,640 |
| College or Associate's Degree | $46,855 | $35,632 |
| Bachelor's Degree | $66,623 | $49,720 |
| Graduate Degree | $79,826 | $73,859 |
| Total | $44,688 | $34,918 |
Family Income in Bellflower
Family Income Brackets in Bellflower
According to the Bellflower family income data, there are 3,855 families falling into the $100,000 to $149,999 income range, which is the most common income bracket and makes up 21.8% of all families. Conversely, the $10,000 to $14,999 income bracket is the least frequent group with only 442 families (2.5%) belonging to this category.
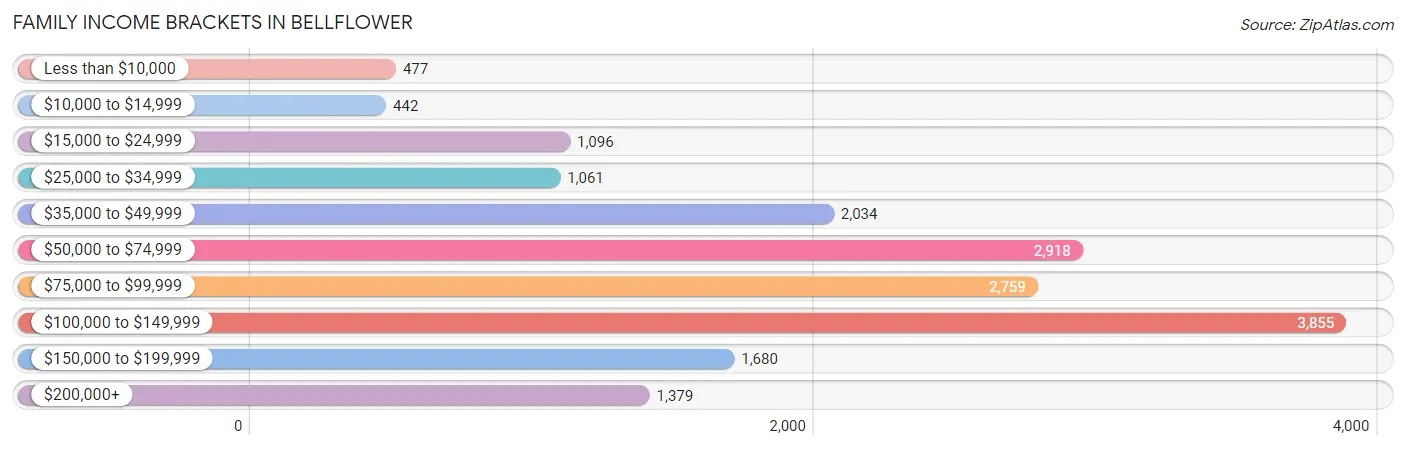
| Income Bracket | # Families | % Families |
| Less than $10,000 | 477 | 2.7% |
| $10,000 to $14,999 | 442 | 2.5% |
| $15,000 to $24,999 | 1,096 | 6.2% |
| $25,000 to $34,999 | 1,061 | 6.0% |
| $35,000 to $49,999 | 2,034 | 11.5% |
| $50,000 to $74,999 | 2,918 | 16.5% |
| $75,000 to $99,999 | 2,759 | 15.6% |
| $100,000 to $149,999 | 3,855 | 21.8% |
| $150,000 to $199,999 | 1,680 | 9.5% |
| $200,000+ | 1,379 | 7.8% |
Family Income by Famaliy Size in Bellflower
7+ person families (501 | 2.8%) account for the highest median family income in Bellflower with $136,763 per family, while 2-person families (5,287 | 29.9%) have the highest median income of $35,105 per family member.
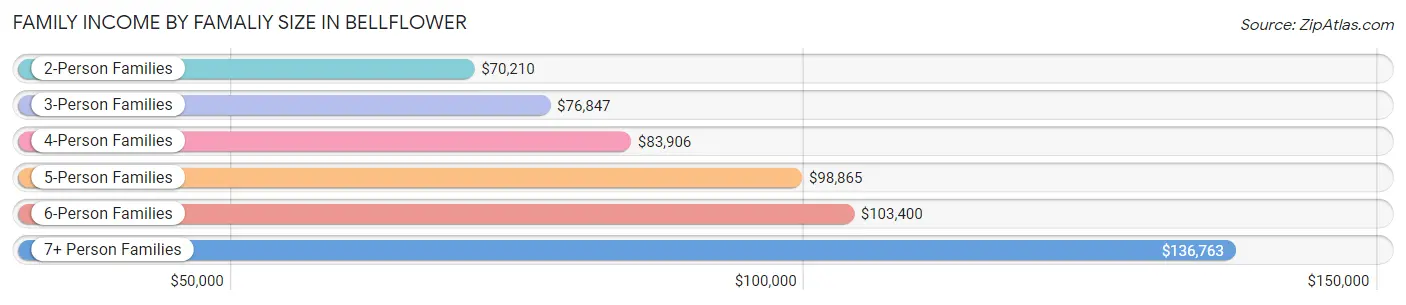
| Income Bracket | # Families | Median Income |
| 2-Person Families | 5,287 (29.9%) | $70,210 |
| 3-Person Families | 4,343 (24.6%) | $76,847 |
| 4-Person Families | 4,358 (24.6%) | $83,906 |
| 5-Person Families | 2,269 (12.8%) | $98,865 |
| 6-Person Families | 926 (5.2%) | $103,400 |
| 7+ Person Families | 501 (2.8%) | $136,763 |
| Total | 17,684 (100.0%) | $80,445 |
Family Income by Number of Earners in Bellflower
The median family income in Bellflower is $80,445, with families comprising 3+ earners (3,521) having the highest median family income of $124,564, while families with no earners (1,594) have the lowest median family income of $34,510, accounting for 19.9% and 9.0% of families, respectively.
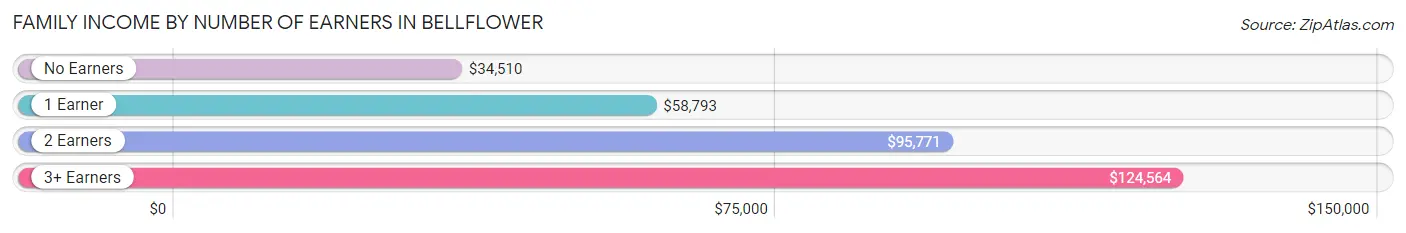
| Number of Earners | # Families | Median Income |
| No Earners | 1,594 (9.0%) | $34,510 |
| 1 Earner | 5,843 (33.0%) | $58,793 |
| 2 Earners | 6,726 (38.0%) | $95,771 |
| 3+ Earners | 3,521 (19.9%) | $124,564 |
| Total | 17,684 (100.0%) | $80,445 |
Household Income in Bellflower
Household Income Brackets in Bellflower
With 4,500 households falling in the category, the $100,000 to $149,999 income range is the most frequent in Bellflower, accounting for 18.7% of all households. In contrast, only 890 households (3.7%) fall into the $10,000 to $14,999 income bracket, making it the least populous group.
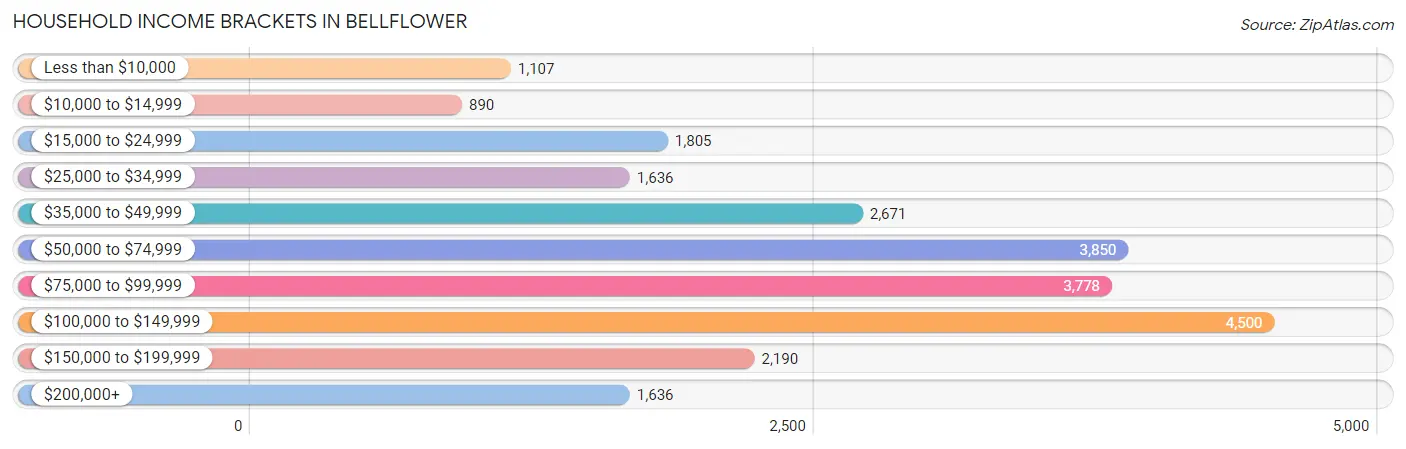
| Income Bracket | # Households | % Households |
| Less than $10,000 | 1,107 | 4.6% |
| $10,000 to $14,999 | 890 | 3.7% |
| $15,000 to $24,999 | 1,805 | 7.5% |
| $25,000 to $34,999 | 1,636 | 6.8% |
| $35,000 to $49,999 | 2,671 | 11.1% |
| $50,000 to $74,999 | 3,850 | 16.0% |
| $75,000 to $99,999 | 3,778 | 15.7% |
| $100,000 to $149,999 | 4,500 | 18.7% |
| $150,000 to $199,999 | 2,190 | 9.1% |
| $200,000+ | 1,636 | 6.8% |
Household Income by Householder Age in Bellflower
The median household income in Bellflower is $75,379, with the highest median household income of $83,391 found in the 45 to 64 years age bracket for the primary householder. A total of 9,857 households (41.0%) fall into this category. Meanwhile, the 65+ years age bracket for the primary householder has the lowest median household income of $45,336, with 4,794 households (19.9%) in this group.
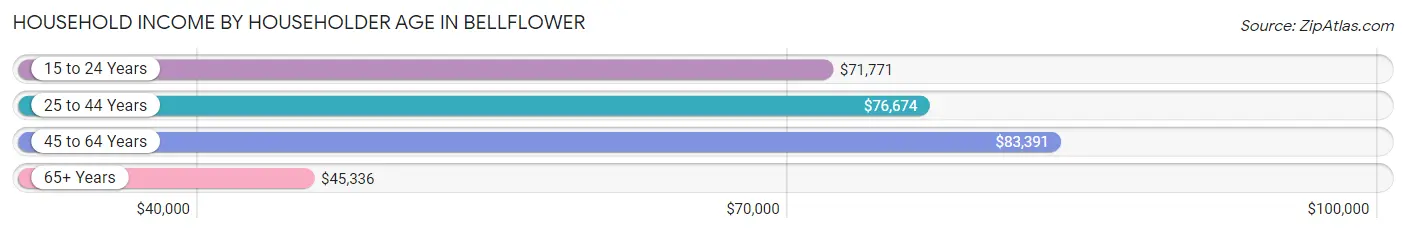
| Income Bracket | # Households | Median Income |
| 15 to 24 Years | 323 (1.3%) | $71,771 |
| 25 to 44 Years | 9,091 (37.8%) | $76,674 |
| 45 to 64 Years | 9,857 (41.0%) | $83,391 |
| 65+ Years | 4,794 (19.9%) | $45,336 |
| Total | 24,065 (100.0%) | $75,379 |
Poverty in Bellflower
Income Below Poverty by Sex and Age in Bellflower
With 12.4% poverty level for males and 15.9% for females among the residents of Bellflower, 5 year old males and 6 to 11 year old females are the most vulnerable to poverty, with 131 males (29.8%) and 802 females (26.2%) in their respective age groups living below the poverty level.
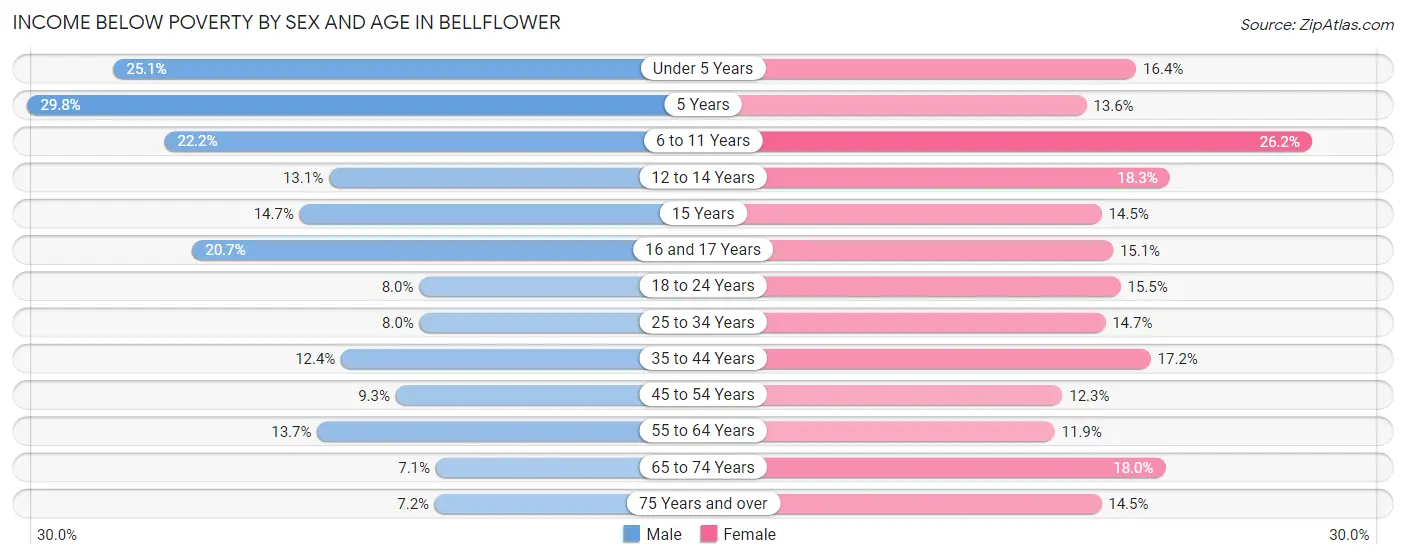
| Age Bracket | Male | Female |
| Under 5 Years | 537 (25.1%) | 373 (16.4%) |
| 5 Years | 131 (29.8%) | 88 (13.6%) |
| 6 to 11 Years | 684 (22.2%) | 802 (26.2%) |
| 12 to 14 Years | 165 (13.1%) | 336 (18.2%) |
| 15 Years | 74 (14.7%) | 79 (14.5%) |
| 16 and 17 Years | 256 (20.7%) | 145 (15.1%) |
| 18 to 24 Years | 283 (8.0%) | 528 (15.5%) |
| 25 to 34 Years | 567 (8.0%) | 887 (14.7%) |
| 35 to 44 Years | 635 (12.4%) | 1,016 (17.2%) |
| 45 to 54 Years | 488 (9.3%) | 590 (12.3%) |
| 55 to 64 Years | 579 (13.7%) | 579 (11.8%) |
| 65 to 74 Years | 171 (7.1%) | 628 (18.0%) |
| 75 Years and over | 93 (7.1%) | 297 (14.4%) |
| Total | 4,663 (12.4%) | 6,348 (15.9%) |
Income Above Poverty by Sex and Age in Bellflower
According to the poverty statistics in Bellflower, males aged 65 to 74 years and females aged 55 to 64 years are the age groups that are most secure financially, with 92.9% of males and 88.1% of females in these age groups living above the poverty line.
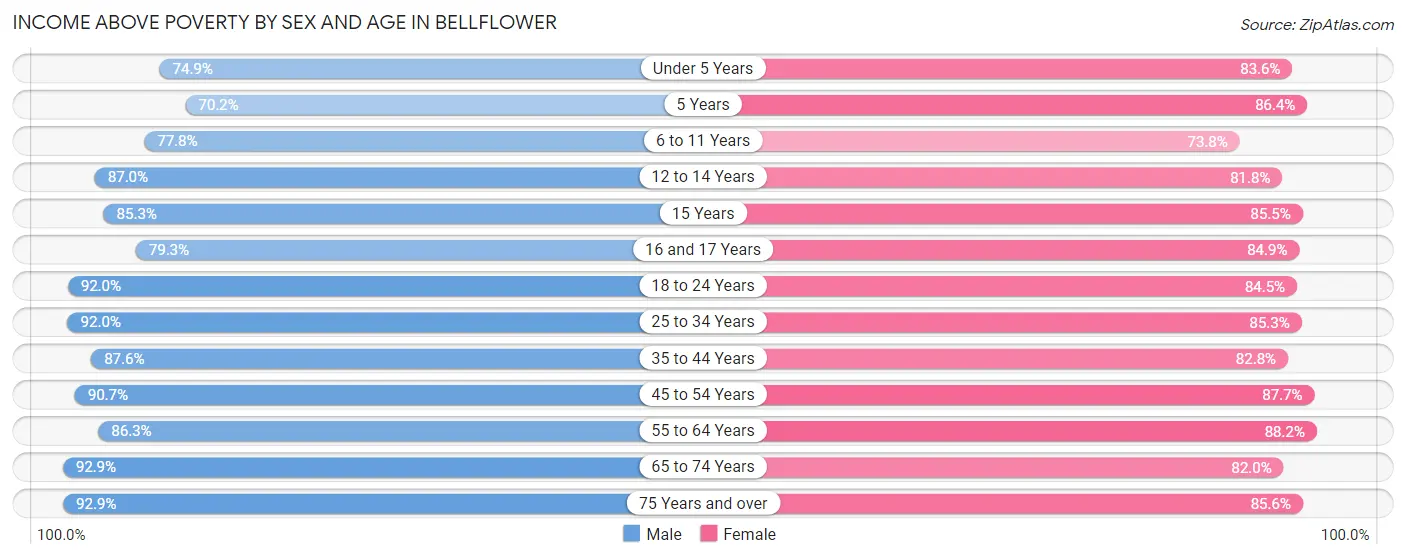
| Age Bracket | Male | Female |
| Under 5 Years | 1,606 (74.9%) | 1,903 (83.6%) |
| 5 Years | 308 (70.2%) | 558 (86.4%) |
| 6 to 11 Years | 2,395 (77.8%) | 2,262 (73.8%) |
| 12 to 14 Years | 1,099 (87.0%) | 1,505 (81.8%) |
| 15 Years | 430 (85.3%) | 467 (85.5%) |
| 16 and 17 Years | 983 (79.3%) | 815 (84.9%) |
| 18 to 24 Years | 3,246 (92.0%) | 2,873 (84.5%) |
| 25 to 34 Years | 6,522 (92.0%) | 5,159 (85.3%) |
| 35 to 44 Years | 4,500 (87.6%) | 4,890 (82.8%) |
| 45 to 54 Years | 4,741 (90.7%) | 4,215 (87.7%) |
| 55 to 64 Years | 3,648 (86.3%) | 4,309 (88.1%) |
| 65 to 74 Years | 2,236 (92.9%) | 2,858 (82.0%) |
| 75 Years and over | 1,208 (92.8%) | 1,759 (85.6%) |
| Total | 32,922 (87.6%) | 33,573 (84.1%) |
Income Below Poverty Among Married-Couple Families in Bellflower
The poverty statistics for married-couple families in Bellflower show that 8.4% or 911 of the total 10,795 families live below the poverty line. Families with 3 or 4 children have the highest poverty rate of 21.1%, comprising of 200 families. On the other hand, families with 5 or more children have the lowest poverty rate of 0.0%, which includes 0 families.
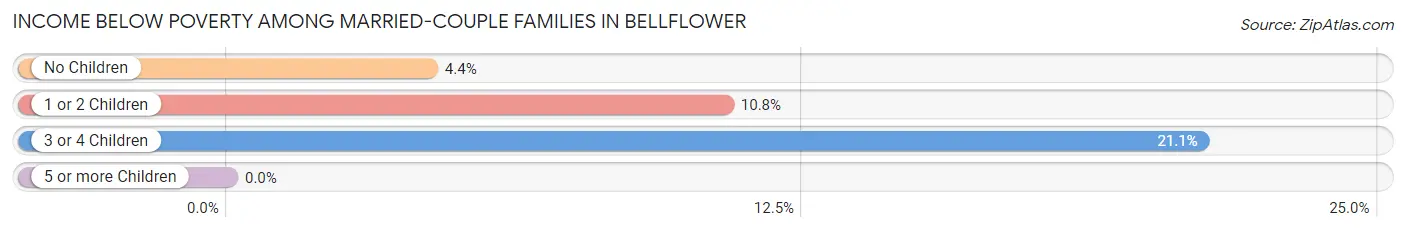
| Children | Above Poverty | Below Poverty |
| No Children | 5,168 (95.7%) | 235 (4.3%) |
| 1 or 2 Children | 3,934 (89.2%) | 476 (10.8%) |
| 3 or 4 Children | 746 (78.9%) | 200 (21.1%) |
| 5 or more Children | 36 (100.0%) | 0 (0.0%) |
| Total | 9,884 (91.6%) | 911 (8.4%) |
Income Below Poverty Among Single-Parent Households in Bellflower
According to the poverty data in Bellflower, 11.7% or 272 single-father households and 16.8% or 766 single-mother households are living below the poverty line. Among single-father households, those with 3 or 4 children have the highest poverty rate, with 111 households (33.6%) experiencing poverty. Likewise, among single-mother households, those with 3 or 4 children have the highest poverty rate, with 186 households (54.9%) falling below the poverty line.
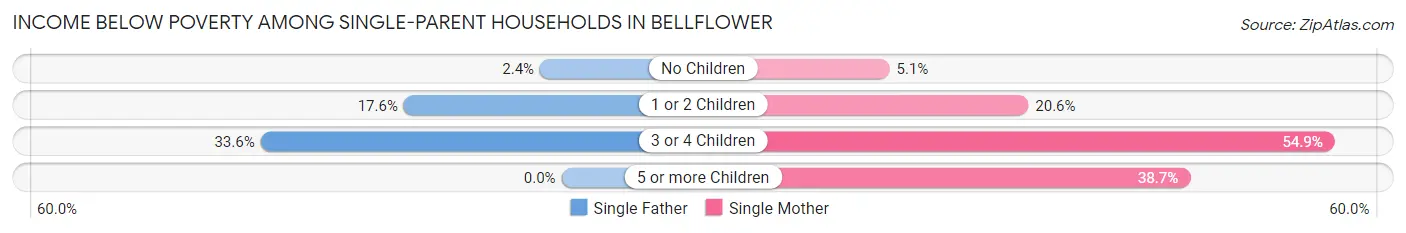
| Children | Single Father | Single Mother |
| No Children | 30 (2.4%) | 99 (5.1%) |
| 1 or 2 Children | 131 (17.6%) | 469 (20.6%) |
| 3 or 4 Children | 111 (33.6%) | 186 (54.9%) |
| 5 or more Children | 0 (0.0%) | 12 (38.7%) |
| Total | 272 (11.7%) | 766 (16.8%) |
Income Below Poverty Among Married-Couple vs Single-Parent Households in Bellflower
The poverty data for Bellflower shows that 911 of the married-couple family households (8.4%) and 1,038 of the single-parent households (15.1%) are living below the poverty level. Within the married-couple family households, those with 3 or 4 children have the highest poverty rate, with 200 households (21.1%) falling below the poverty line. Among the single-parent households, those with 3 or 4 children have the highest poverty rate, with 297 household (44.4%) living below poverty.
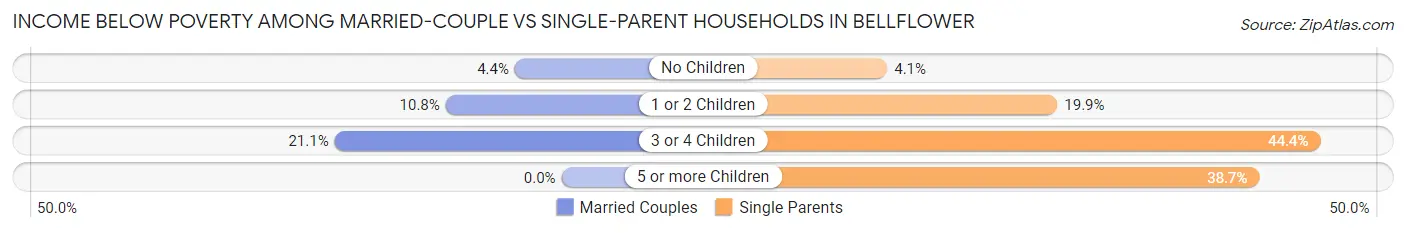
| Children | Married-Couple Families | Single-Parent Households |
| No Children | 235 (4.3%) | 129 (4.1%) |
| 1 or 2 Children | 476 (10.8%) | 600 (19.9%) |
| 3 or 4 Children | 200 (21.1%) | 297 (44.4%) |
| 5 or more Children | 0 (0.0%) | 12 (38.7%) |
| Total | 911 (8.4%) | 1,038 (15.1%) |
Race in Bellflower
The most populous races in Bellflower are Hispanic or Latino (47,055 | 60.1%), Some other Race (26,805 | 34.2%), and White / Caucasian (19,616 | 25.0%).
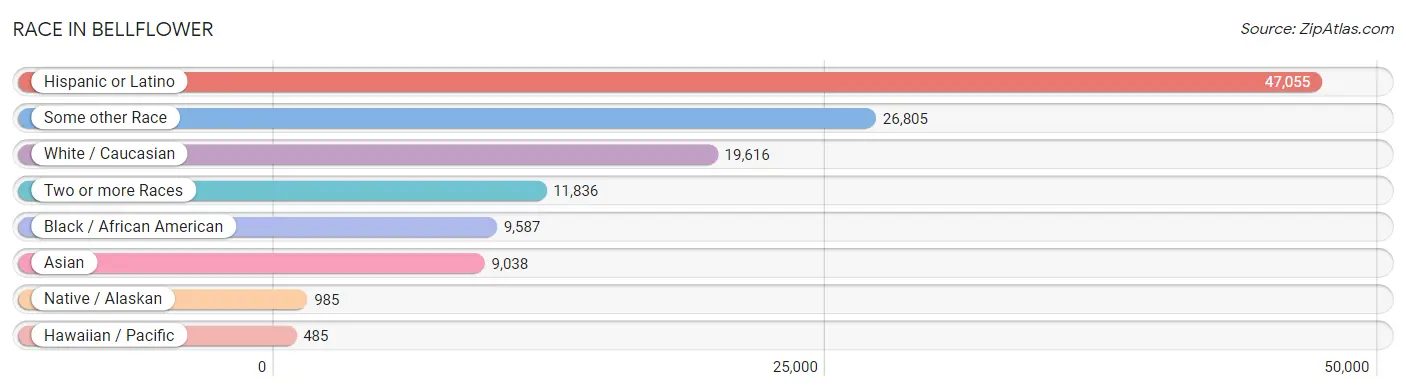
| Race | # Population | % Population |
| Asian | 9,038 | 11.5% |
| Black / African American | 9,587 | 12.2% |
| Hawaiian / Pacific | 485 | 0.6% |
| Hispanic or Latino | 47,055 | 60.1% |
| Native / Alaskan | 985 | 1.3% |
| White / Caucasian | 19,616 | 25.0% |
| Two or more Races | 11,836 | 15.1% |
| Some other Race | 26,805 | 34.2% |
| Total | 78,352 | 100.0% |
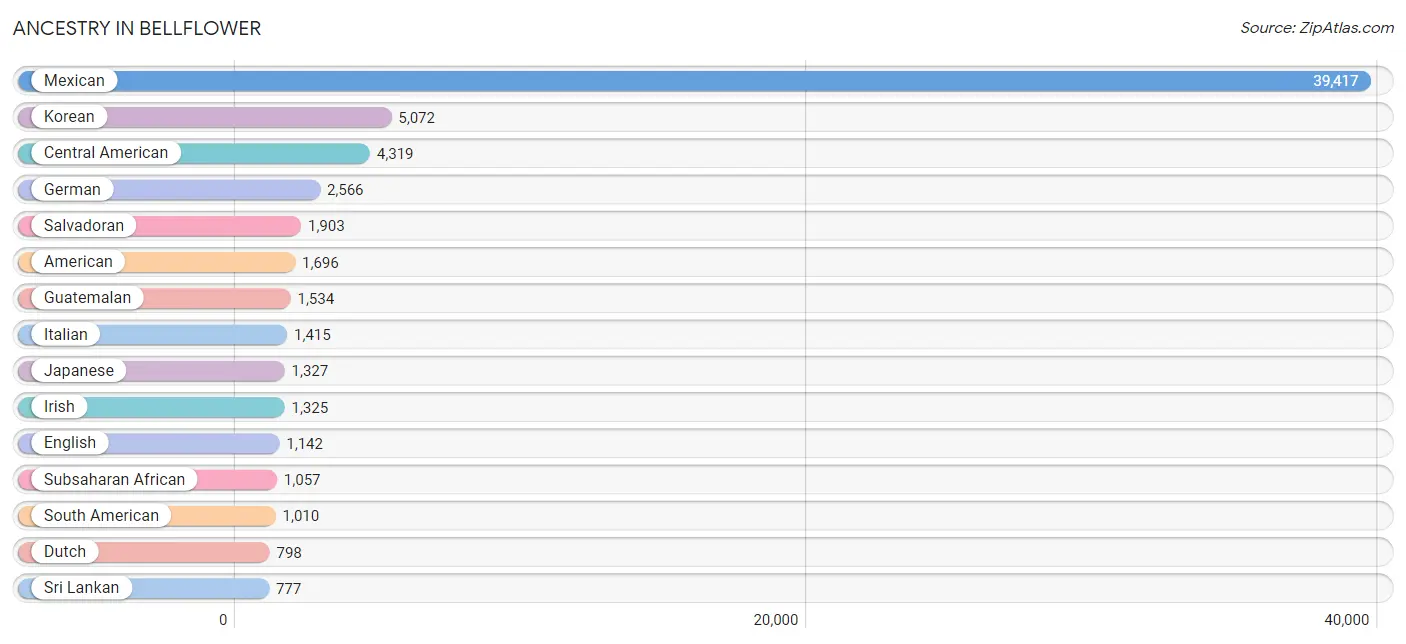
Ancestry in Bellflower
The most populous ancestries reported in Bellflower are Mexican (39,417 | 50.3%), Korean (5,072 | 6.5%), Central American (4,319 | 5.5%), German (2,566 | 3.3%), and Salvadoran (1,903 | 2.4%), together accounting for 68.0% of all Bellflower residents.
| Ancestry | # Population | % Population |
| Afghan | 9 | 0.0% |
| African | 304 | 0.4% |
| American | 1,696 | 2.2% |
| Apache | 51 | 0.1% |
| Arab | 698 | 0.9% |
| Argentinean | 82 | 0.1% |
| Armenian | 17 | 0.0% |
| Austrian | 39 | 0.1% |
| Bahamian | 44 | 0.1% |
| Bangladeshi | 40 | 0.1% |
| Basque | 36 | 0.1% |
| Belizean | 185 | 0.2% |
| Bhutanese | 354 | 0.4% |
| Blackfeet | 34 | 0.0% |
| Brazilian | 30 | 0.0% |
| British | 32 | 0.0% |
| Burmese | 693 | 0.9% |
| Canadian | 34 | 0.0% |
| Central American | 4,319 | 5.5% |
| Central American Indian | 277 | 0.4% |
| Cherokee | 12 | 0.0% |
| Chickasaw | 6 | 0.0% |
| Chilean | 12 | 0.0% |
| Choctaw | 45 | 0.1% |
| Colombian | 114 | 0.2% |
| Comanche | 25 | 0.0% |
| Costa Rican | 73 | 0.1% |
| Croatian | 18 | 0.0% |
| Cuban | 344 | 0.4% |
| Czech | 84 | 0.1% |
| Czechoslovakian | 27 | 0.0% |
| Danish | 42 | 0.1% |
| Dutch | 798 | 1.0% |
| Eastern European | 40 | 0.1% |
| Ecuadorian | 100 | 0.1% |
| Egyptian | 306 | 0.4% |
| English | 1,142 | 1.5% |
| European | 512 | 0.6% |
| Filipino | 105 | 0.1% |
| Finnish | 14 | 0.0% |
| French | 460 | 0.6% |
| French Canadian | 84 | 0.1% |
| German | 2,566 | 3.3% |
| Greek | 50 | 0.1% |
| Guamanian / Chamorro | 22 | 0.0% |
| Guatemalan | 1,534 | 2.0% |
| Honduran | 293 | 0.4% |
| Hungarian | 85 | 0.1% |
| Icelander | 5 | 0.0% |
| Indian (Asian) | 560 | 0.7% |
| Iranian | 24 | 0.0% |
| Irish | 1,325 | 1.7% |
| Italian | 1,415 | 1.8% |
| Jamaican | 49 | 0.1% |
| Japanese | 1,327 | 1.7% |
| Korean | 5,072 | 6.5% |
| Laotian | 79 | 0.1% |
| Lebanese | 248 | 0.3% |
| Malaysian | 68 | 0.1% |
| Mexican | 39,417 | 50.3% |
| Mexican American Indian | 627 | 0.8% |
| Native Hawaiian | 472 | 0.6% |
| Navajo | 59 | 0.1% |
| Nicaraguan | 509 | 0.6% |
| Nigerian | 731 | 0.9% |
| Northern European | 15 | 0.0% |
| Norwegian | 186 | 0.2% |
| Ottawa | 18 | 0.0% |
| Pakistani | 326 | 0.4% |
| Panamanian | 7 | 0.0% |
| Peruvian | 128 | 0.2% |
| Polish | 203 | 0.3% |
| Portuguese | 112 | 0.1% |
| Pueblo | 22 | 0.0% |
| Puerto Rican | 417 | 0.5% |
| Romanian | 115 | 0.2% |
| Russian | 78 | 0.1% |
| Salvadoran | 1,903 | 2.4% |
| Samoan | 348 | 0.4% |
| Scandinavian | 30 | 0.0% |
| Scotch-Irish | 40 | 0.1% |
| Scottish | 188 | 0.2% |
| Seminole | 10 | 0.0% |
| Serbian | 41 | 0.1% |
| Sioux | 53 | 0.1% |
| Slavic | 7 | 0.0% |
| Slovak | 6 | 0.0% |
| Slovene | 5 | 0.0% |
| South American | 1,010 | 1.3% |
| South American Indian | 25 | 0.0% |
| Spaniard | 81 | 0.1% |
| Spanish | 44 | 0.1% |
| Sri Lankan | 777 | 1.0% |
| Subsaharan African | 1,057 | 1.3% |
| Swedish | 136 | 0.2% |
| Swiss | 78 | 0.1% |
| Syrian | 21 | 0.0% |
| Thai | 531 | 0.7% |
| Tohono O'Odham | 55 | 0.1% |
| Tongan | 137 | 0.2% |
| Trinidadian and Tobagonian | 37 | 0.1% |
| Ukrainian | 44 | 0.1% |
| Uruguayan | 213 | 0.3% |
| Venezuelan | 361 | 0.5% |
| Vietnamese | 21 | 0.0% |
| Welsh | 117 | 0.2% |
| West Indian | 169 | 0.2% |
| Yaqui | 113 | 0.1% |
| Yugoslavian | 44 | 0.1% | View All 109 Rows |
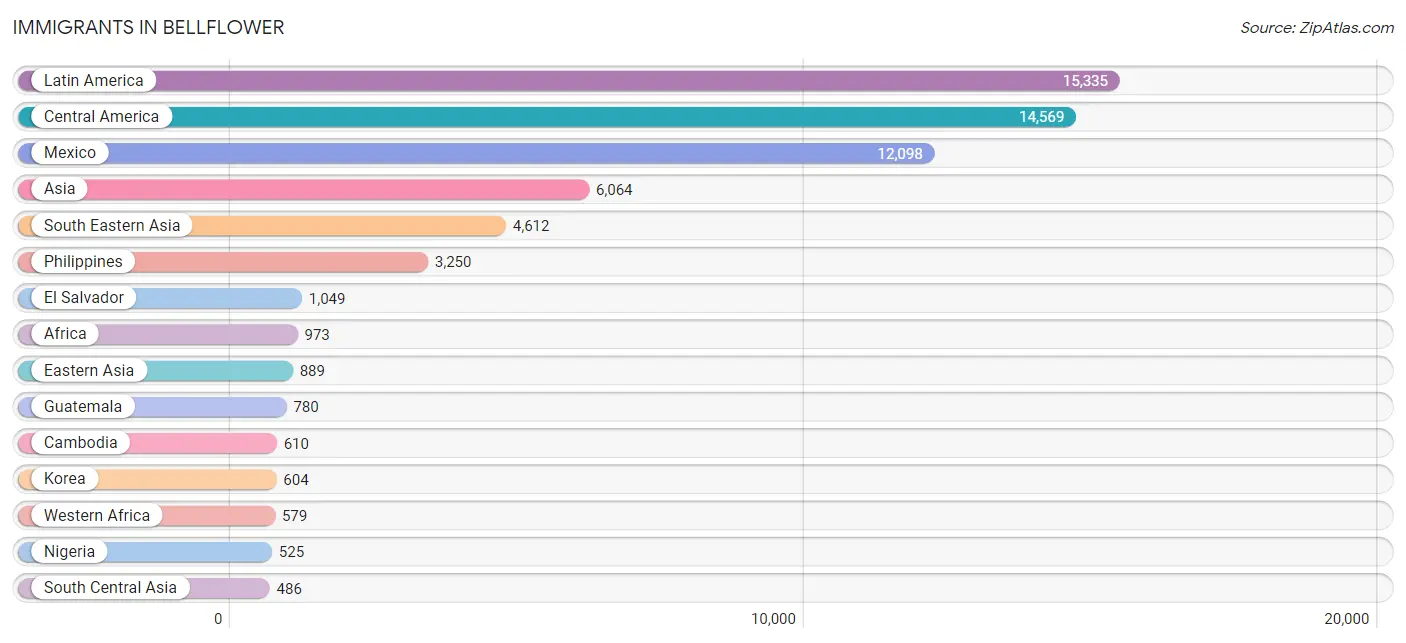
Immigrants in Bellflower
The most numerous immigrant groups reported in Bellflower came from Latin America (15,335 | 19.6%), Central America (14,569 | 18.6%), Mexico (12,098 | 15.4%), Asia (6,064 | 7.7%), and South Eastern Asia (4,612 | 5.9%), together accounting for 67.2% of all Bellflower residents.
| Immigration Origin | # Population | % Population |
| Afghanistan | 4 | 0.0% |
| Africa | 973 | 1.2% |
| Argentina | 54 | 0.1% |
| Asia | 6,064 | 7.7% |
| Azores | 11 | 0.0% |
| Bahamas | 44 | 0.1% |
| Bangladesh | 212 | 0.3% |
| Belize | 67 | 0.1% |
| Brazil | 30 | 0.0% |
| Cambodia | 610 | 0.8% |
| Cameroon | 65 | 0.1% |
| Canada | 43 | 0.1% |
| Caribbean | 285 | 0.4% |
| Central America | 14,569 | 18.6% |
| Chile | 12 | 0.0% |
| China | 227 | 0.3% |
| Colombia | 79 | 0.1% |
| Costa Rica | 46 | 0.1% |
| Cuba | 112 | 0.1% |
| Dominica | 36 | 0.1% |
| Eastern Asia | 889 | 1.1% |
| Eastern Europe | 80 | 0.1% |
| Ecuador | 60 | 0.1% |
| Egypt | 306 | 0.4% |
| El Salvador | 1,049 | 1.3% |
| England | 34 | 0.0% |
| Europe | 345 | 0.4% |
| Fiji | 124 | 0.2% |
| France | 4 | 0.0% |
| Germany | 58 | 0.1% |
| Ghana | 29 | 0.0% |
| Guatemala | 780 | 1.0% |
| Honduras | 222 | 0.3% |
| Hong Kong | 3 | 0.0% |
| India | 93 | 0.1% |
| Indonesia | 51 | 0.1% |
| Iran | 8 | 0.0% |
| Iraq | 7 | 0.0% |
| Ireland | 10 | 0.0% |
| Italy | 74 | 0.1% |
| Jamaica | 47 | 0.1% |
| Japan | 58 | 0.1% |
| Jordan | 10 | 0.0% |
| Korea | 604 | 0.8% |
| Laos | 40 | 0.1% |
| Latin America | 15,335 | 19.6% |
| Lebanon | 31 | 0.0% |
| Liberia | 25 | 0.0% |
| Malaysia | 7 | 0.0% |
| Mexico | 12,098 | 15.4% |
| Middle Africa | 65 | 0.1% |
| Nepal | 169 | 0.2% |
| Netherlands | 30 | 0.0% |
| Nicaragua | 270 | 0.3% |
| Nigeria | 525 | 0.7% |
| Northern Africa | 329 | 0.4% |
| Northern Europe | 69 | 0.1% |
| Oceania | 271 | 0.4% |
| Panama | 7 | 0.0% |
| Peru | 75 | 0.1% |
| Philippines | 3,250 | 4.2% |
| Poland | 11 | 0.0% |
| Portugal | 18 | 0.0% |
| Romania | 63 | 0.1% |
| Scotland | 10 | 0.0% |
| South America | 481 | 0.6% |
| South Central Asia | 486 | 0.6% |
| South Eastern Asia | 4,612 | 5.9% |
| Southern Europe | 104 | 0.1% |
| Spain | 12 | 0.0% |
| Sweden | 6 | 0.0% |
| Syria | 8 | 0.0% |
| Taiwan | 52 | 0.1% |
| Thailand | 267 | 0.3% |
| Trinidad and Tobago | 46 | 0.1% |
| Uruguay | 36 | 0.1% |
| Venezuela | 135 | 0.2% |
| Vietnam | 387 | 0.5% |
| Western Africa | 579 | 0.7% |
| Western Asia | 56 | 0.1% |
| Western Europe | 92 | 0.1% | View All 81 Rows |
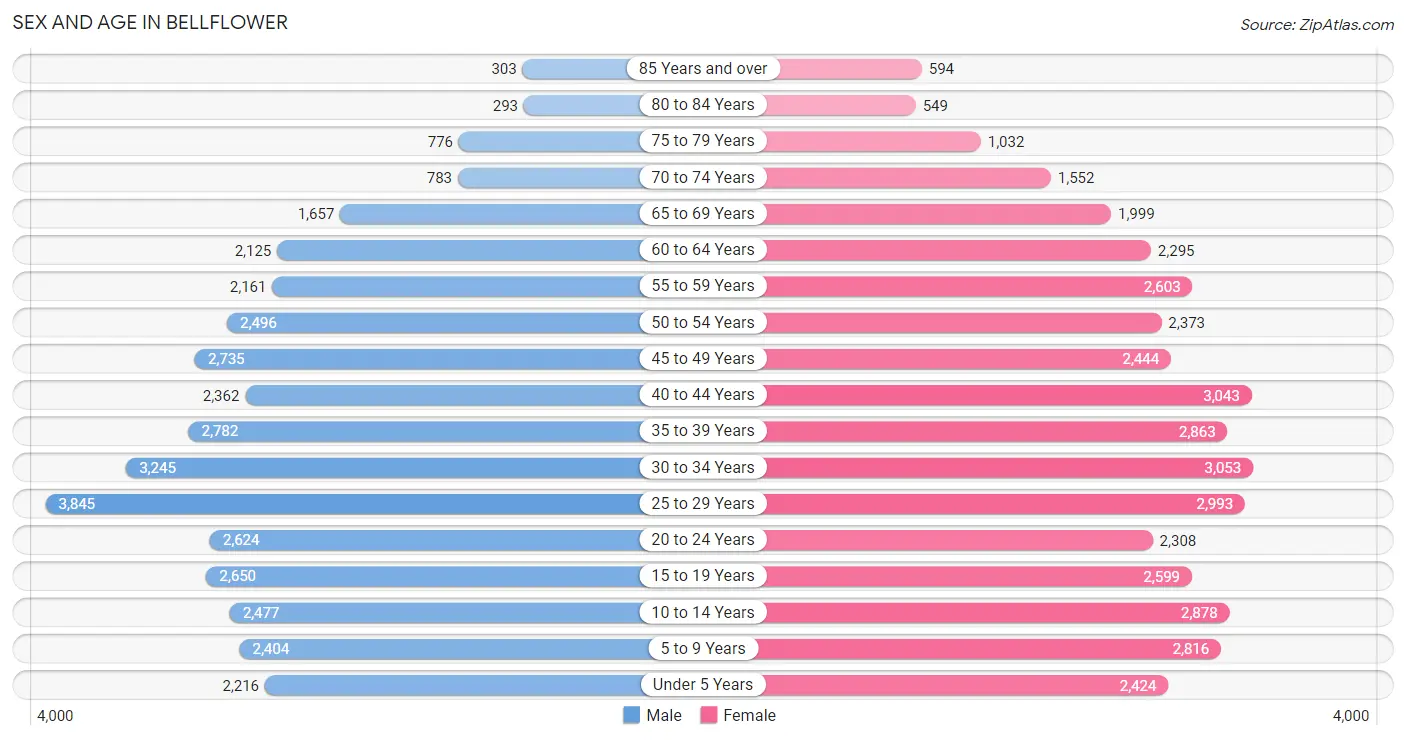
Sex and Age in Bellflower
Sex and Age in Bellflower
The most populous age groups in Bellflower are 25 to 29 Years (3,845 | 10.1%) for men and 30 to 34 Years (3,053 | 7.5%) for women.
| Age Bracket | Male | Female |
| Under 5 Years | 2,216 (5.8%) | 2,424 (6.0%) |
| 5 to 9 Years | 2,404 (6.3%) | 2,816 (7.0%) |
| 10 to 14 Years | 2,477 (6.5%) | 2,878 (7.1%) |
| 15 to 19 Years | 2,650 (7.0%) | 2,599 (6.4%) |
| 20 to 24 Years | 2,624 (6.9%) | 2,308 (5.7%) |
| 25 to 29 Years | 3,845 (10.1%) | 2,993 (7.4%) |
| 30 to 34 Years | 3,245 (8.6%) | 3,053 (7.5%) |
| 35 to 39 Years | 2,782 (7.3%) | 2,863 (7.1%) |
| 40 to 44 Years | 2,362 (6.2%) | 3,043 (7.5%) |
| 45 to 49 Years | 2,735 (7.2%) | 2,444 (6.0%) |
| 50 to 54 Years | 2,496 (6.6%) | 2,373 (5.9%) |
| 55 to 59 Years | 2,161 (5.7%) | 2,603 (6.4%) |
| 60 to 64 Years | 2,125 (5.6%) | 2,295 (5.7%) |
| 65 to 69 Years | 1,657 (4.4%) | 1,999 (5.0%) |
| 70 to 74 Years | 783 (2.1%) | 1,552 (3.8%) |
| 75 to 79 Years | 776 (2.1%) | 1,032 (2.5%) |
| 80 to 84 Years | 293 (0.8%) | 549 (1.4%) |
| 85 Years and over | 303 (0.8%) | 594 (1.5%) |
| Total | 37,934 (100.0%) | 40,418 (100.0%) |
Families and Households in Bellflower
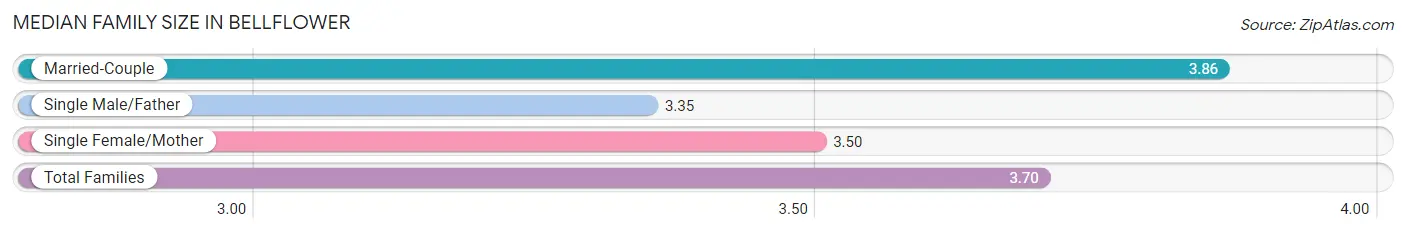
Median Family Size in Bellflower
The median family size in Bellflower is 3.70 persons per family, with married-couple families (10,795 | 61.0%) accounting for the largest median family size of 3.86 persons per family. On the other hand, single male/father families (2,316 | 13.1%) represent the smallest median family size with 3.35 persons per family.
| Family Type | # Families | Family Size |
| Married-Couple | 10,795 (61.0%) | 3.86 |
| Single Male/Father | 2,316 (13.1%) | 3.35 |
| Single Female/Mother | 4,573 (25.9%) | 3.50 |
| Total Families | 17,684 (100.0%) | 3.70 |
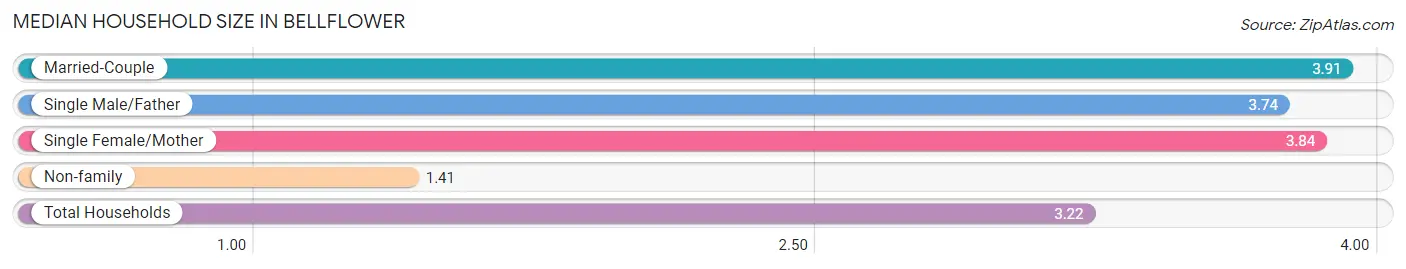
Median Household Size in Bellflower
The median household size in Bellflower is 3.22 persons per household, with married-couple households (10,795 | 44.9%) accounting for the largest median household size of 3.91 persons per household. non-family households (6,381 | 26.5%) represent the smallest median household size with 1.41 persons per household.
| Household Type | # Households | Household Size |
| Married-Couple | 10,795 (44.9%) | 3.91 |
| Single Male/Father | 2,316 (9.6%) | 3.74 |
| Single Female/Mother | 4,573 (19.0%) | 3.84 |
| Non-family | 6,381 (26.5%) | 1.41 |
| Total Households | 24,065 (100.0%) | 3.22 |
Household Size by Marriage Status in Bellflower
Out of a total of 24,065 households in Bellflower, 17,684 (73.5%) are family households, while 6,381 (26.5%) are nonfamily households. The most numerous type of family households are 2-person households, comprising 4,705, and the most common type of nonfamily households are 1-person households, comprising 4,707.
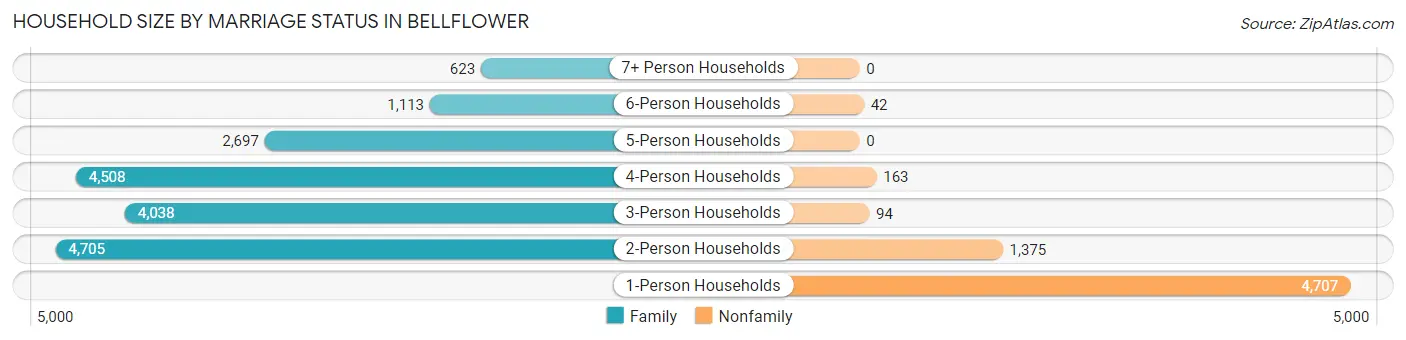
| Household Size | Family Households | Nonfamily Households |
| 1-Person Households | - | 4,707 (19.6%) |
| 2-Person Households | 4,705 (19.6%) | 1,375 (5.7%) |
| 3-Person Households | 4,038 (16.8%) | 94 (0.4%) |
| 4-Person Households | 4,508 (18.7%) | 163 (0.7%) |
| 5-Person Households | 2,697 (11.2%) | 0 (0.0%) |
| 6-Person Households | 1,113 (4.6%) | 42 (0.2%) |
| 7+ Person Households | 623 (2.6%) | 0 (0.0%) |
| Total | 17,684 (73.5%) | 6,381 (26.5%) |
Female Fertility in Bellflower
Fertility by Age in Bellflower
Average fertility rate in Bellflower is 52.0 births per 1,000 women. Women in the age bracket of 20 to 34 years have the highest fertility rate with 74.0 births per 1,000 women. Women in the age bracket of 20 to 34 years acount for 60.3% of all women with births.
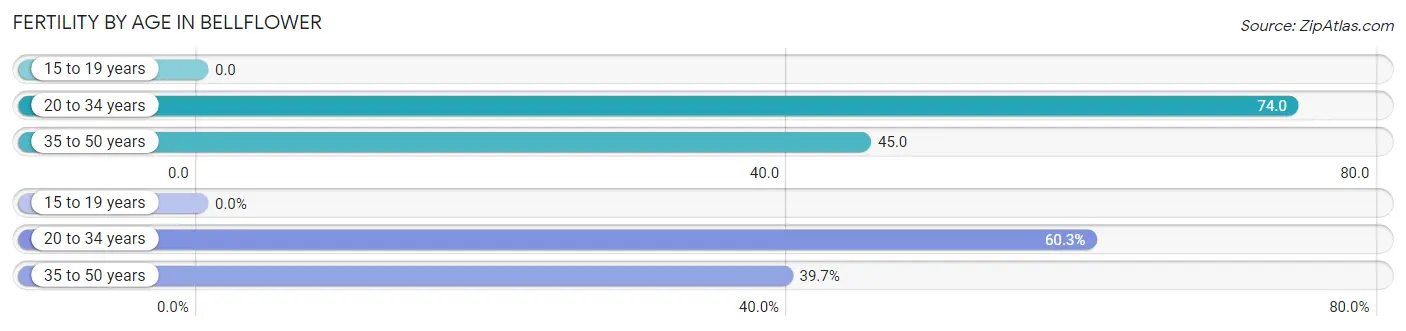
| Age Bracket | Women with Births | Births / 1,000 Women |
| 15 to 19 years | 0 (0.0%) | 0.0 |
| 20 to 34 years | 622 (60.3%) | 74.0 |
| 35 to 50 years | 409 (39.7%) | 45.0 |
| Total | 1,031 (100.0%) | 52.0 |
Fertility by Age by Marriage Status in Bellflower
47.1% of women with births (1,031) in Bellflower are married. The highest percentage of unmarried women with births falls into 20 to 34 years age bracket with 61.3% of them unmarried at the time of birth, while the lowest percentage of unmarried women with births belong to 35 to 50 years age bracket with 40.1% of them unmarried.
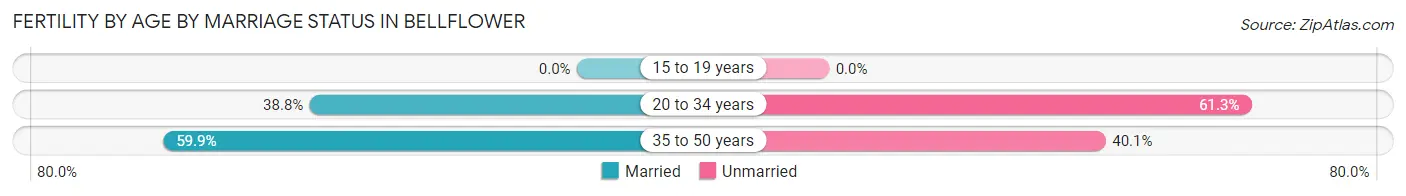
| Age Bracket | Married | Unmarried |
| 15 to 19 years | 0 (0.0%) | 0 (0.0%) |
| 20 to 34 years | 241 (38.8%) | 381 (61.3%) |
| 35 to 50 years | 245 (59.9%) | 164 (40.1%) |
| Total | 486 (47.1%) | 545 (52.9%) |
Fertility by Education in Bellflower
Average fertility rate in Bellflower is 52.0 births per 1,000 women. Women with the education attainment of high school diploma have the highest fertility rate of 75.0 births per 1,000 women, while women with the education attainment of less than high school have the lowest fertility at 21.0 births per 1,000 women. Women with the education attainment of college or associate's degree represent 37.6% of all women with births.
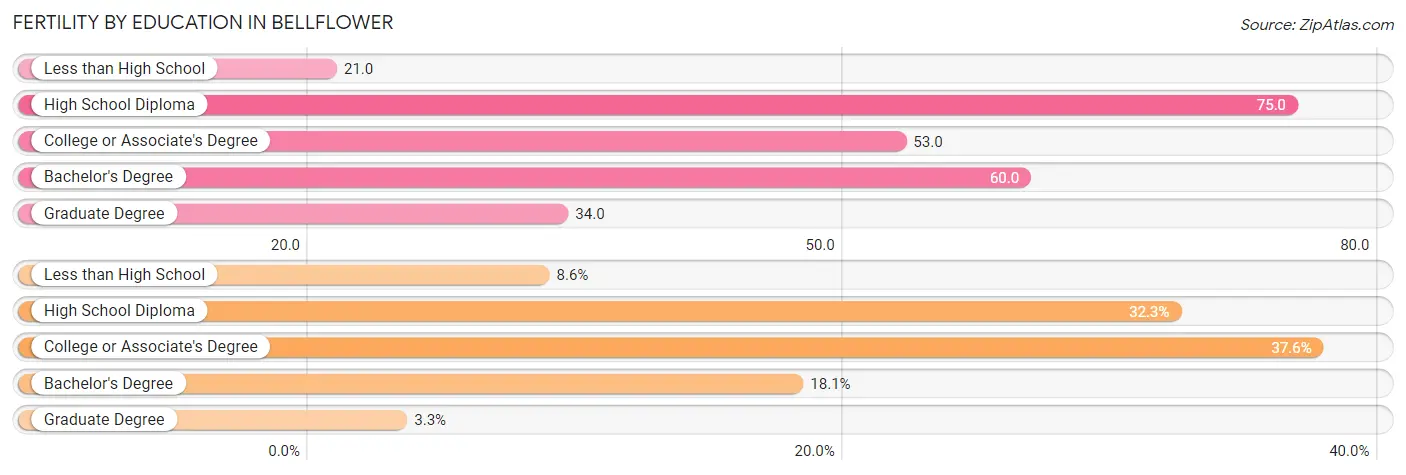
| Educational Attainment | Women with Births | Births / 1,000 Women |
| Less than High School | 89 (8.6%) | 21.0 |
| High School Diploma | 333 (32.3%) | 75.0 |
| College or Associate's Degree | 388 (37.6%) | 53.0 |
| Bachelor's Degree | 187 (18.1%) | 60.0 |
| Graduate Degree | 34 (3.3%) | 34.0 |
| Total | 1,031 (100.0%) | 52.0 |
Fertility by Education by Marriage Status in Bellflower
52.9% of women with births in Bellflower are unmarried. Women with the educational attainment of graduate degree are most likely to be married with 100.0% of them married at childbirth, while women with the educational attainment of college or associate's degree are least likely to be married with 64.2% of them unmarried at childbirth.
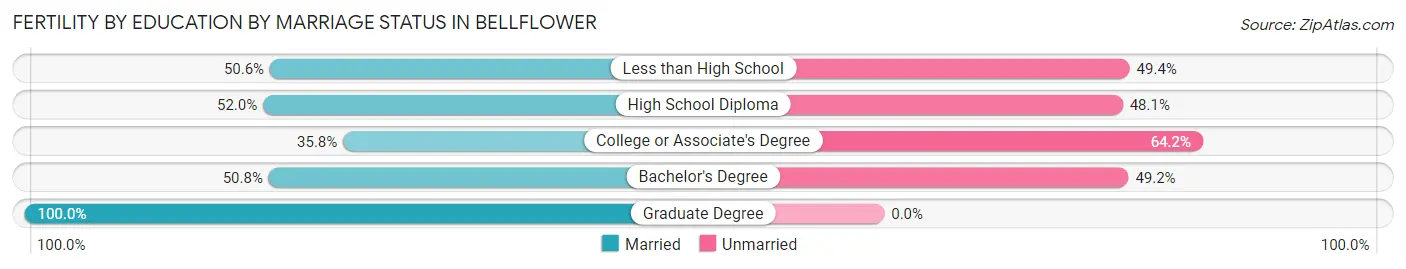
| Educational Attainment | Married | Unmarried |
| Less than High School | 45 (50.6%) | 44 (49.4%) |
| High School Diploma | 173 (51.9%) | 160 (48.0%) |
| College or Associate's Degree | 139 (35.8%) | 249 (64.2%) |
| Bachelor's Degree | 95 (50.8%) | 92 (49.2%) |
| Graduate Degree | 34 (100.0%) | 0 (0.0%) |
| Total | 486 (47.1%) | 545 (52.9%) |
Employment Characteristics in Bellflower
Employment by Class of Employer in Bellflower
Among the 36,415 employed individuals in Bellflower, private company employees (25,337 | 69.6%), local government employees (3,098 | 8.5%), and self-employed (not incorporated) (2,365 | 6.5%) make up the most common classes of employment.
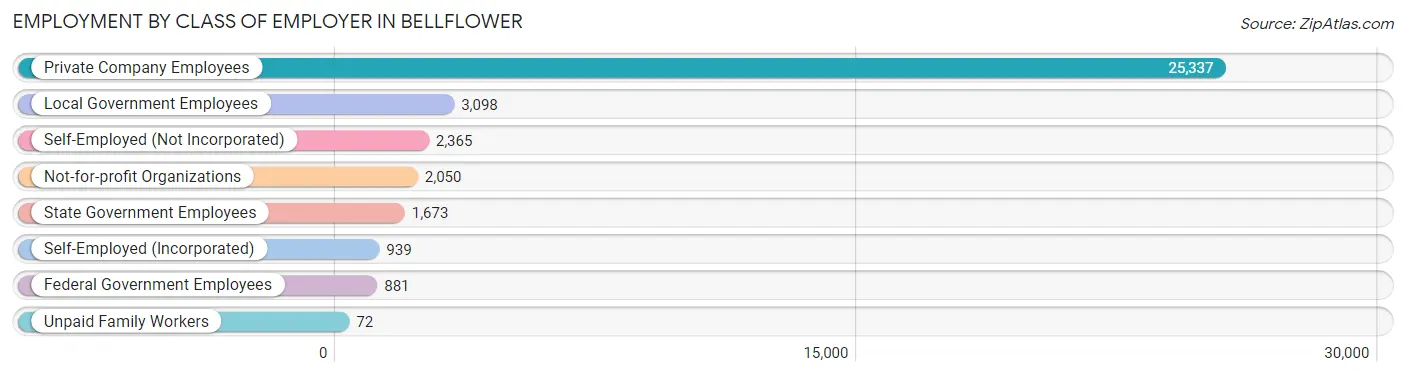
| Employer Class | # Employees | % Employees |
| Private Company Employees | 25,337 | 69.6% |
| Self-Employed (Incorporated) | 939 | 2.6% |
| Self-Employed (Not Incorporated) | 2,365 | 6.5% |
| Not-for-profit Organizations | 2,050 | 5.6% |
| Local Government Employees | 3,098 | 8.5% |
| State Government Employees | 1,673 | 4.6% |
| Federal Government Employees | 881 | 2.4% |
| Unpaid Family Workers | 72 | 0.2% |
| Total | 36,415 | 100.0% |
Employment Status by Age in Bellflower
According to the labor force statistics for Bellflower, out of the total population over 16 years of age (62,087), 66.3% or 41,164 individuals are in the labor force, with 8.4% or 3,458 of them unemployed. The age group with the highest labor force participation rate is 25 to 29 years, with 86.7% or 5,929 individuals in the labor force. Within the labor force, the 16 to 19 years age range has the highest percentage of unemployed individuals, with 33.9% or 404 of them being unemployed.
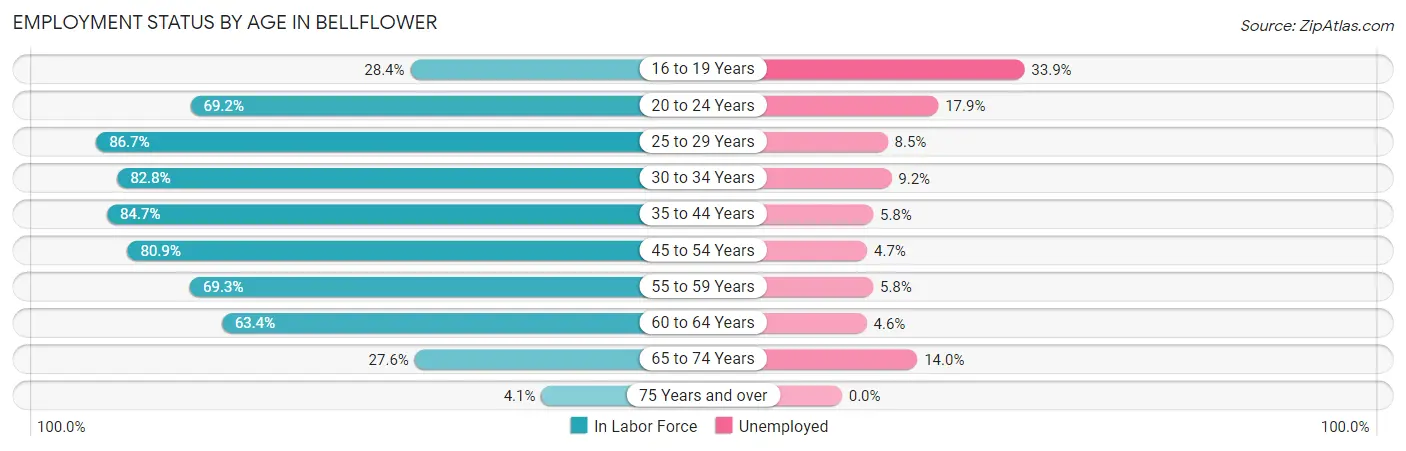
| Age Bracket | In Labor Force | Unemployed |
| 16 to 19 Years | 1,193 (28.4%) | 404 (33.9%) |
| 20 to 24 Years | 3,413 (69.2%) | 611 (17.9%) |
| 25 to 29 Years | 5,929 (86.7%) | 504 (8.5%) |
| 30 to 34 Years | 5,215 (82.8%) | 480 (9.2%) |
| 35 to 44 Years | 9,359 (84.7%) | 543 (5.8%) |
| 45 to 54 Years | 8,129 (80.9%) | 382 (4.7%) |
| 55 to 59 Years | 3,301 (69.3%) | 191 (5.8%) |
| 60 to 64 Years | 2,802 (63.4%) | 129 (4.6%) |
| 65 to 74 Years | 1,654 (27.6%) | 232 (14.0%) |
| 75 Years and over | 145 (4.1%) | 0 (0.0%) |
| Total | 41,164 (66.3%) | 3,458 (8.4%) |
Employment Status by Educational Attainment in Bellflower
According to labor force statistics for Bellflower, 80.0% of individuals (34,734) out of the total population between 25 and 64 years of age (43,418) are in the labor force, with 6.4% or 2,223 of them being unemployed. The group with the highest labor force participation rate are those with the educational attainment of bachelor's degree or higher, with 87.4% or 7,876 individuals in the labor force. Within the labor force, individuals with less than high school education have the highest percentage of unemployment, with 7.6% or 447 of them being unemployed.
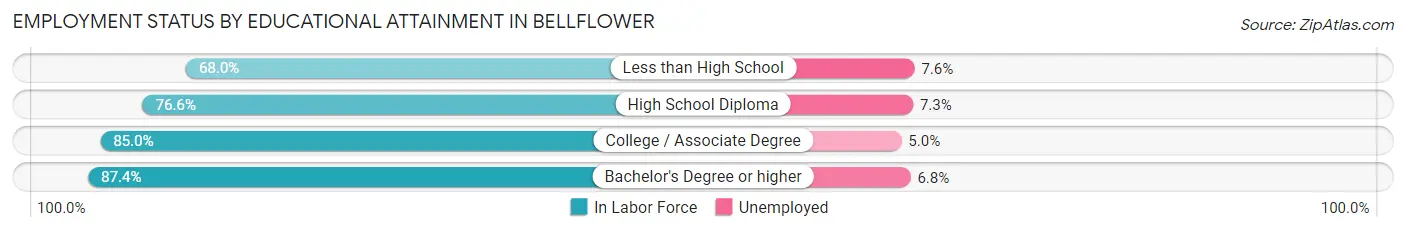
| Educational Attainment | In Labor Force | Unemployed |
| Less than High School | 5,881 (68.0%) | 657 (7.6%) |
| High School Diploma | 8,472 (76.6%) | 807 (7.3%) |
| College / Associate Degree | 12,493 (85.0%) | 735 (5.0%) |
| Bachelor's Degree or higher | 7,876 (87.4%) | 613 (6.8%) |
| Total | 34,734 (80.0%) | 2,779 (6.4%) |
Employment Occupations by Sex in Bellflower
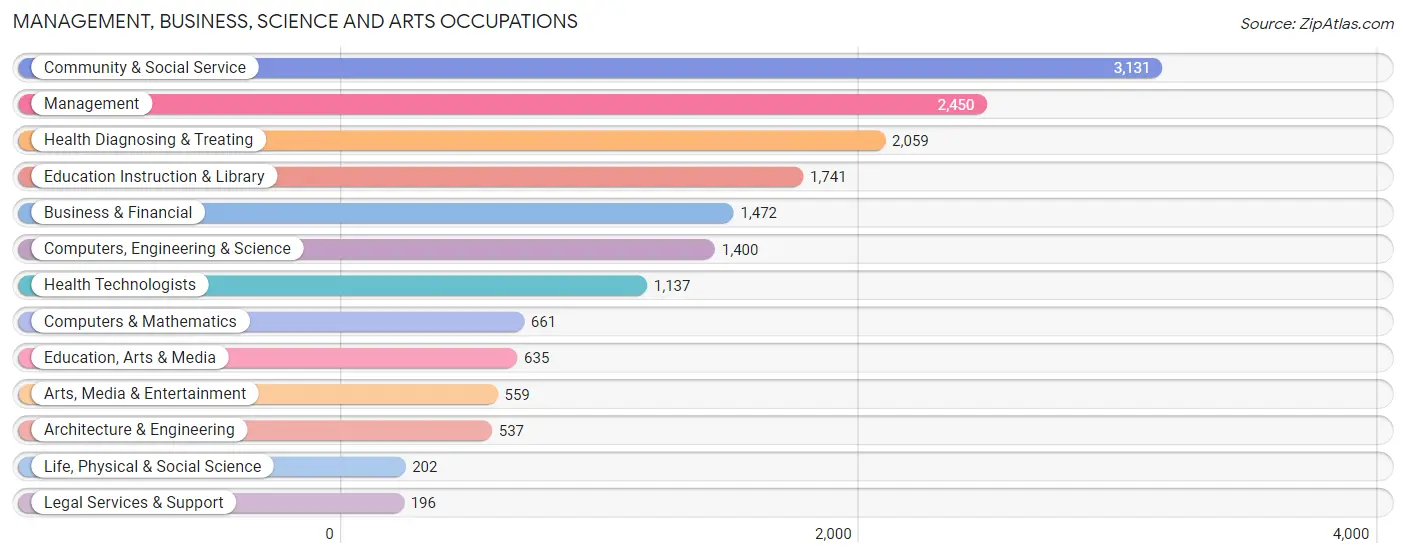
Management, Business, Science and Arts Occupations
The most common Management, Business, Science and Arts occupations in Bellflower are Community & Social Service (3,131 | 8.3%), Management (2,450 | 6.5%), Health Diagnosing & Treating (2,059 | 5.5%), Education Instruction & Library (1,741 | 4.6%), and Business & Financial (1,472 | 3.9%).
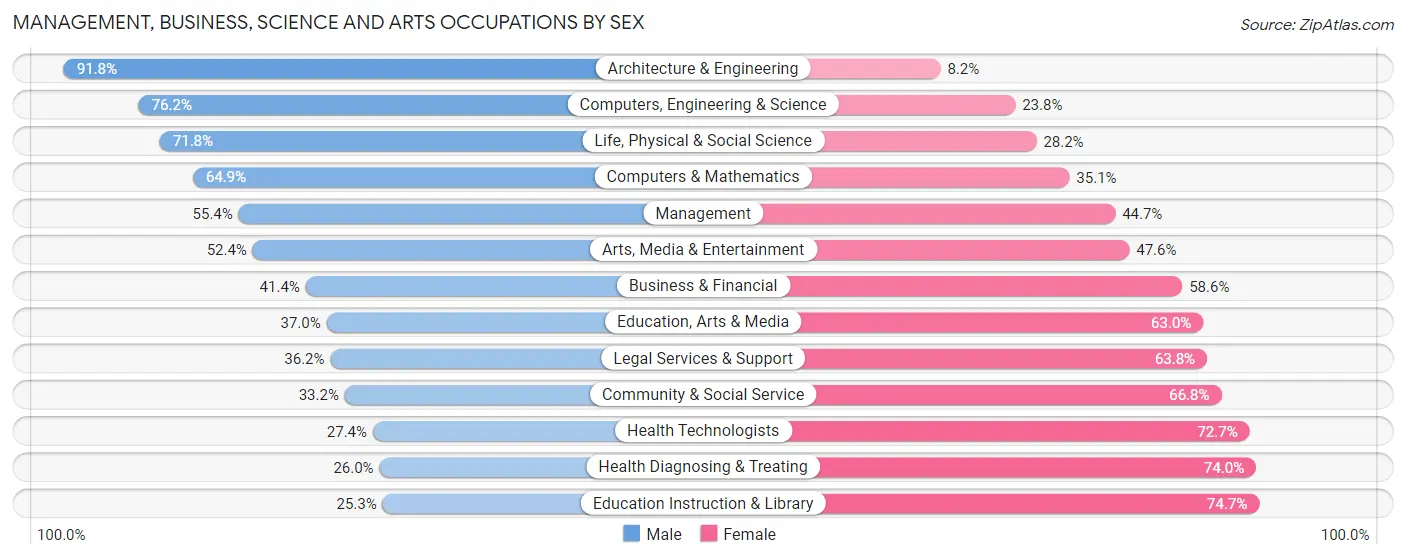
Management, Business, Science and Arts Occupations by Sex
Within the Management, Business, Science and Arts occupations in Bellflower, the most male-oriented occupations are Architecture & Engineering (91.8%), Computers, Engineering & Science (76.2%), and Life, Physical & Social Science (71.8%), while the most female-oriented occupations are Education Instruction & Library (74.7%), Health Diagnosing & Treating (74.0%), and Health Technologists (72.7%).
| Occupation | Male | Female |
| Management | 1,356 (55.3%) | 1,094 (44.7%) |
| Business & Financial | 609 (41.4%) | 863 (58.6%) |
| Computers, Engineering & Science | 1,067 (76.2%) | 333 (23.8%) |
| Computers & Mathematics | 429 (64.9%) | 232 (35.1%) |
| Architecture & Engineering | 493 (91.8%) | 44 (8.2%) |
| Life, Physical & Social Science | 145 (71.8%) | 57 (28.2%) |
| Community & Social Service | 1,040 (33.2%) | 2,091 (66.8%) |
| Education, Arts & Media | 235 (37.0%) | 400 (63.0%) |
| Legal Services & Support | 71 (36.2%) | 125 (63.8%) |
| Education Instruction & Library | 441 (25.3%) | 1,300 (74.7%) |
| Arts, Media & Entertainment | 293 (52.4%) | 266 (47.6%) |
| Health Diagnosing & Treating | 535 (26.0%) | 1,524 (74.0%) |
| Health Technologists | 311 (27.4%) | 826 (72.7%) |
| Total (Category) | 4,607 (43.8%) | 5,905 (56.2%) |
| Total (Overall) | 20,484 (54.4%) | 17,186 (45.6%) |
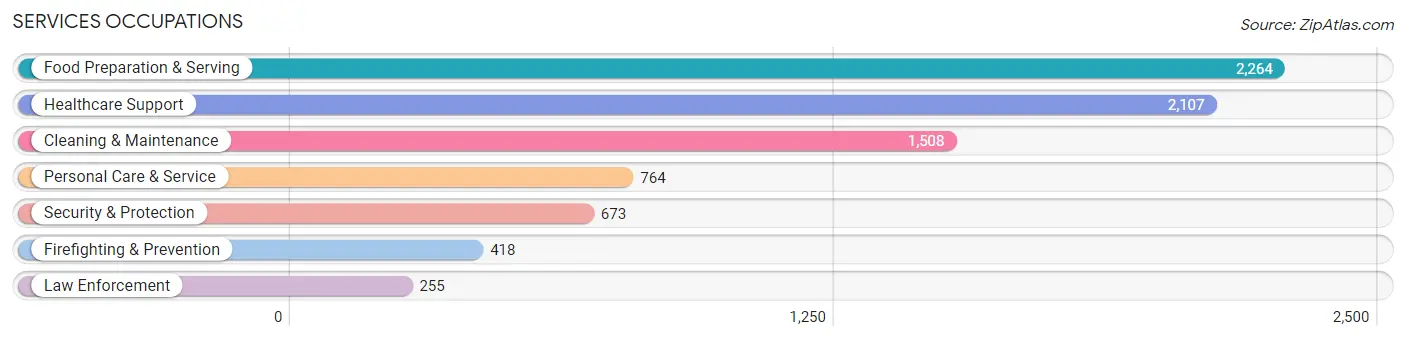
Services Occupations
The most common Services occupations in Bellflower are Food Preparation & Serving (2,264 | 6.0%), Healthcare Support (2,107 | 5.6%), Cleaning & Maintenance (1,508 | 4.0%), Personal Care & Service (764 | 2.0%), and Security & Protection (673 | 1.8%).
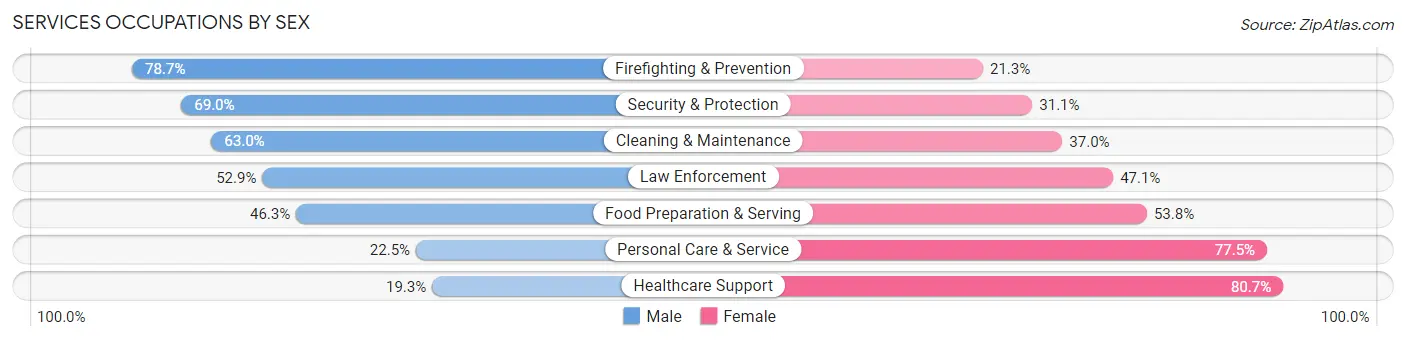
Services Occupations by Sex
Within the Services occupations in Bellflower, the most male-oriented occupations are Firefighting & Prevention (78.7%), Security & Protection (69.0%), and Cleaning & Maintenance (63.0%), while the most female-oriented occupations are Healthcare Support (80.7%), Personal Care & Service (77.5%), and Food Preparation & Serving (53.7%).
| Occupation | Male | Female |
| Healthcare Support | 407 (19.3%) | 1,700 (80.7%) |
| Security & Protection | 464 (69.0%) | 209 (31.0%) |
| Firefighting & Prevention | 329 (78.7%) | 89 (21.3%) |
| Law Enforcement | 135 (52.9%) | 120 (47.1%) |
| Food Preparation & Serving | 1,047 (46.3%) | 1,217 (53.7%) |
| Cleaning & Maintenance | 950 (63.0%) | 558 (37.0%) |
| Personal Care & Service | 172 (22.5%) | 592 (77.5%) |
| Total (Category) | 3,040 (41.5%) | 4,276 (58.5%) |
| Total (Overall) | 20,484 (54.4%) | 17,186 (45.6%) |
Sales and Office Occupations
The most common Sales and Office occupations in Bellflower are Office & Administration (5,332 | 14.1%), and Sales & Related (3,681 | 9.8%).

Sales and Office Occupations by Sex
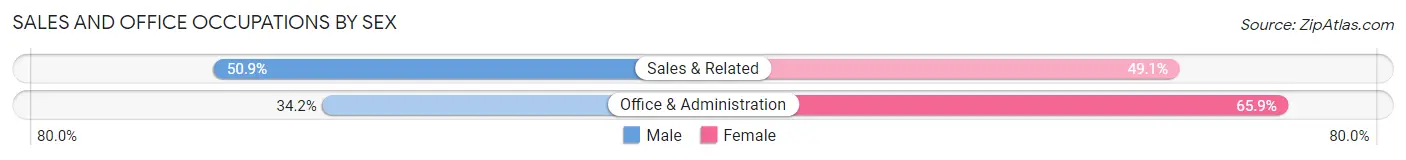
| Occupation | Male | Female |
| Sales & Related | 1,873 (50.9%) | 1,808 (49.1%) |
| Office & Administration | 1,821 (34.2%) | 3,511 (65.8%) |
| Total (Category) | 3,694 (41.0%) | 5,319 (59.0%) |
| Total (Overall) | 20,484 (54.4%) | 17,186 (45.6%) |
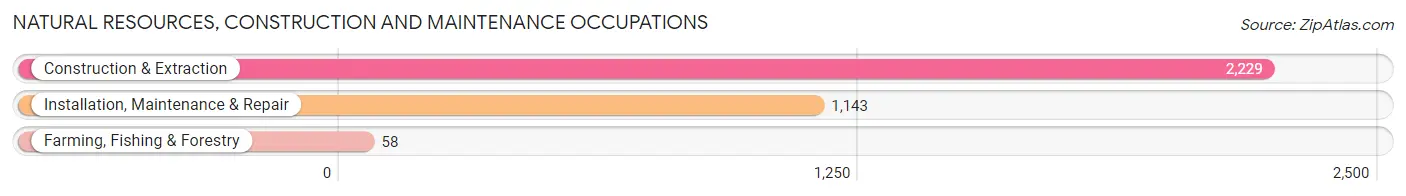
Natural Resources, Construction and Maintenance Occupations
The most common Natural Resources, Construction and Maintenance occupations in Bellflower are Construction & Extraction (2,229 | 5.9%), Installation, Maintenance & Repair (1,143 | 3.0%), and Farming, Fishing & Forestry (58 | 0.2%).
Natural Resources, Construction and Maintenance Occupations by Sex
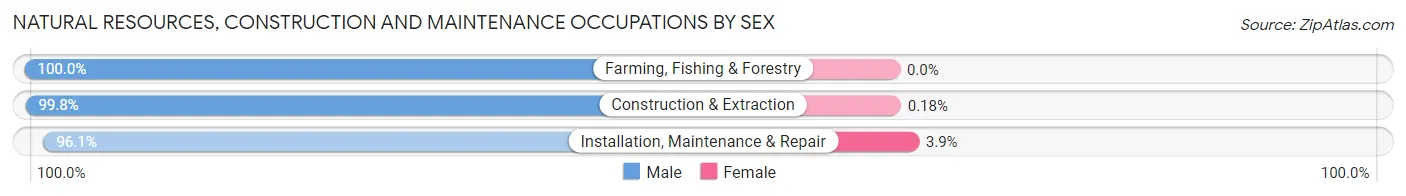
| Occupation | Male | Female |
| Farming, Fishing & Forestry | 58 (100.0%) | 0 (0.0%) |
| Construction & Extraction | 2,225 (99.8%) | 4 (0.2%) |
| Installation, Maintenance & Repair | 1,098 (96.1%) | 45 (3.9%) |
| Total (Category) | 3,381 (98.6%) | 49 (1.4%) |
| Total (Overall) | 20,484 (54.4%) | 17,186 (45.6%) |
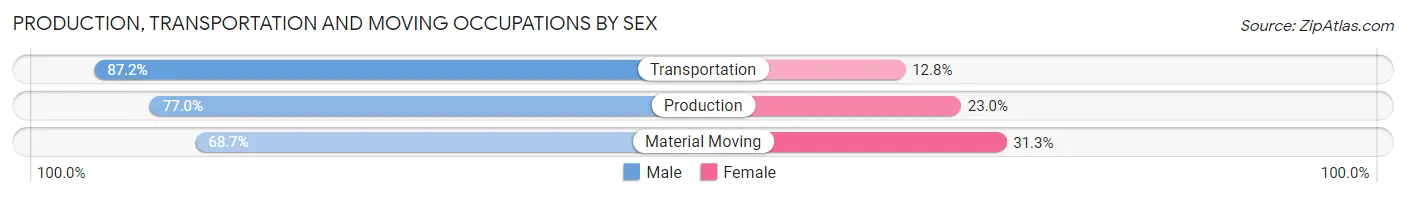
Production, Transportation and Moving Occupations
The most common Production, Transportation and Moving occupations in Bellflower are Production (2,967 | 7.9%), Transportation (2,338 | 6.2%), and Material Moving (2,094 | 5.6%).
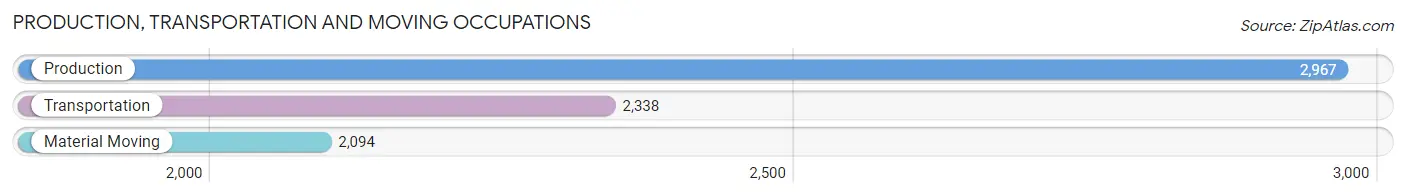
Production, Transportation and Moving Occupations by Sex
| Occupation | Male | Female |
| Production | 2,285 (77.0%) | 682 (23.0%) |
| Transportation | 2,039 (87.2%) | 299 (12.8%) |
| Material Moving | 1,438 (68.7%) | 656 (31.3%) |
| Total (Category) | 5,762 (77.9%) | 1,637 (22.1%) |
| Total (Overall) | 20,484 (54.4%) | 17,186 (45.6%) |
Employment Industries by Sex in Bellflower
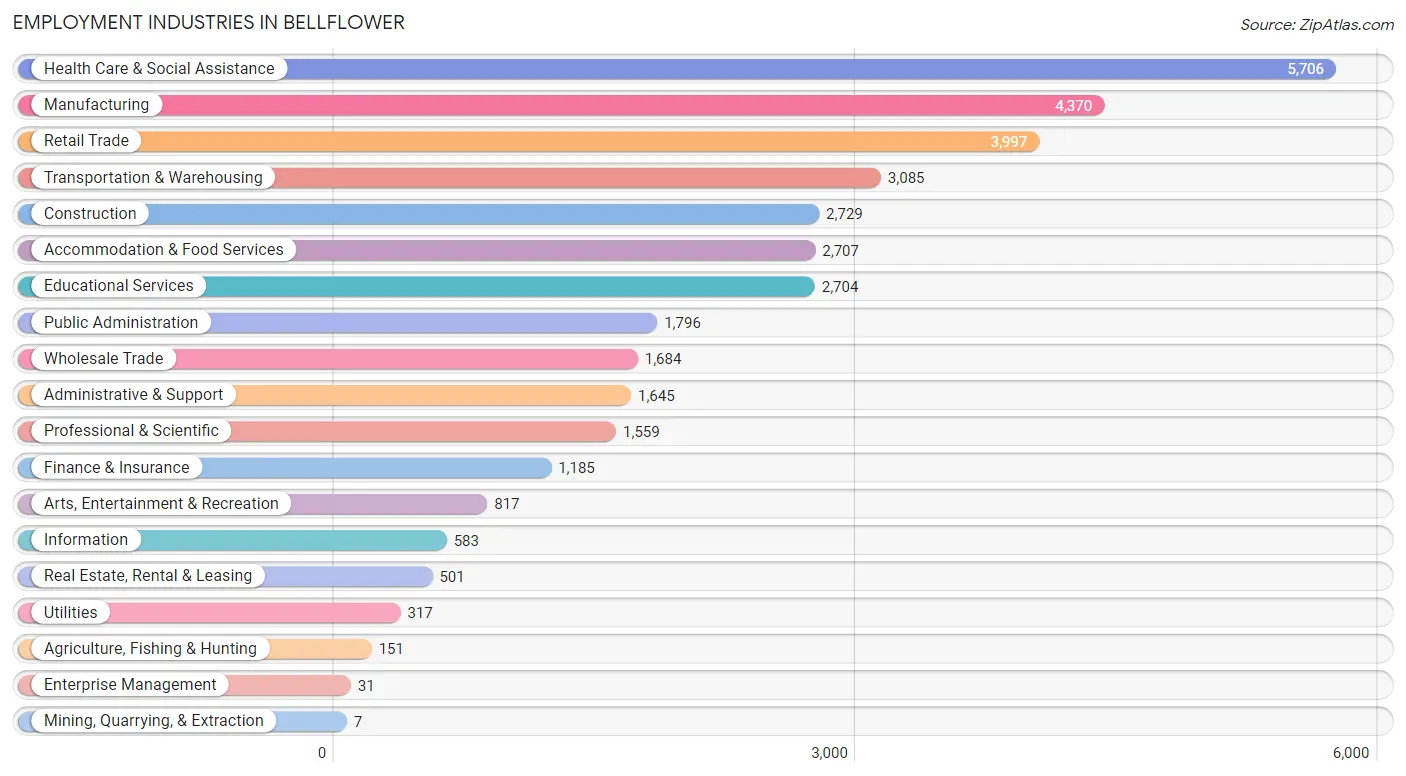
Employment Industries in Bellflower
The major employment industries in Bellflower include Health Care & Social Assistance (5,706 | 15.1%), Manufacturing (4,370 | 11.6%), Retail Trade (3,997 | 10.6%), Transportation & Warehousing (3,085 | 8.2%), and Construction (2,729 | 7.2%).
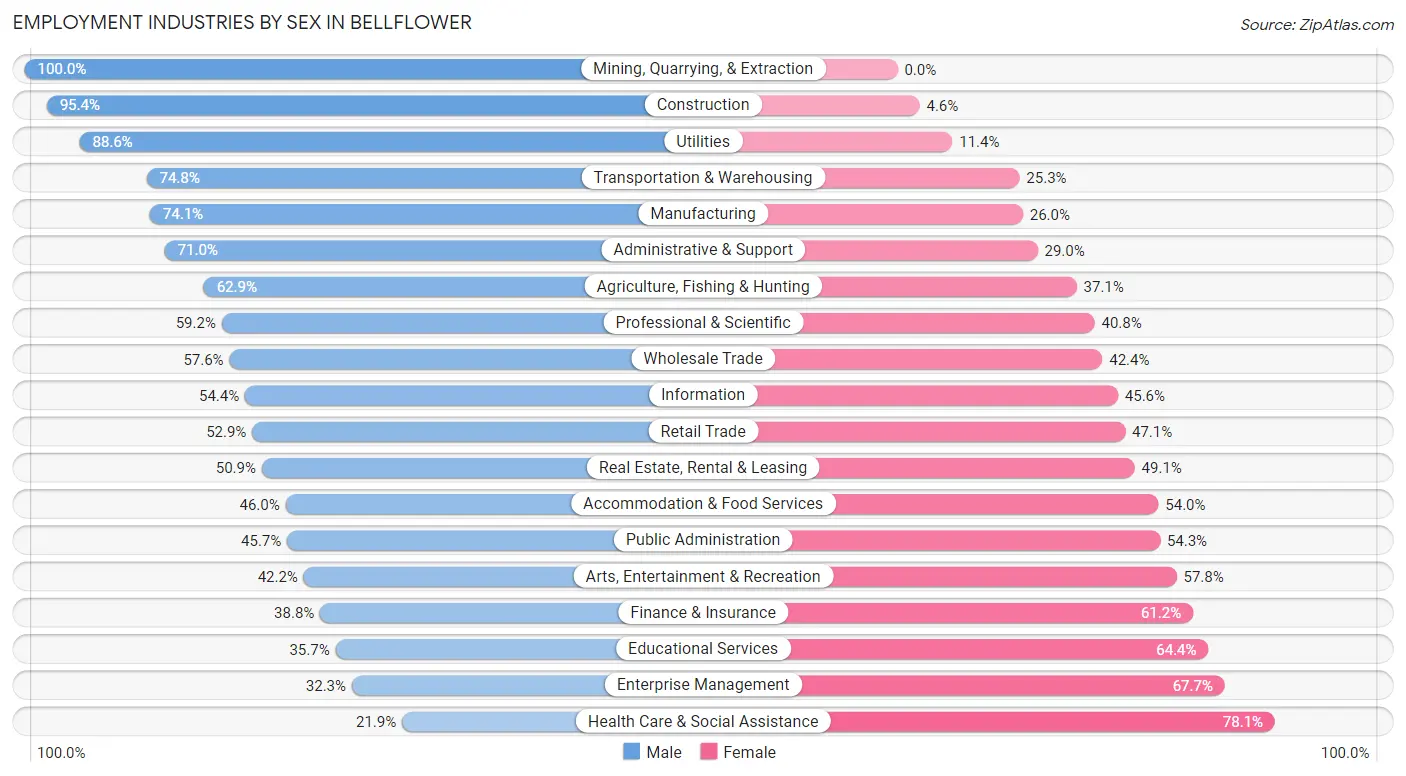
Employment Industries by Sex in Bellflower
The Bellflower industries that see more men than women are Mining, Quarrying, & Extraction (100.0%), Construction (95.4%), and Utilities (88.6%), whereas the industries that tend to have a higher number of women are Health Care & Social Assistance (78.1%), Enterprise Management (67.7%), and Educational Services (64.3%).
| Industry | Male | Female |
| Agriculture, Fishing & Hunting | 95 (62.9%) | 56 (37.1%) |
| Mining, Quarrying, & Extraction | 7 (100.0%) | 0 (0.0%) |
| Construction | 2,604 (95.4%) | 125 (4.6%) |
| Manufacturing | 3,236 (74.1%) | 1,134 (26.0%) |
| Wholesale Trade | 970 (57.6%) | 714 (42.4%) |
| Retail Trade | 2,114 (52.9%) | 1,883 (47.1%) |
| Transportation & Warehousing | 2,306 (74.8%) | 779 (25.3%) |
| Utilities | 281 (88.6%) | 36 (11.4%) |
| Information | 317 (54.4%) | 266 (45.6%) |
| Finance & Insurance | 460 (38.8%) | 725 (61.2%) |
| Real Estate, Rental & Leasing | 255 (50.9%) | 246 (49.1%) |
| Professional & Scientific | 923 (59.2%) | 636 (40.8%) |
| Enterprise Management | 10 (32.3%) | 21 (67.7%) |
| Administrative & Support | 1,168 (71.0%) | 477 (29.0%) |
| Educational Services | 964 (35.6%) | 1,740 (64.3%) |
| Health Care & Social Assistance | 1,248 (21.9%) | 4,458 (78.1%) |
| Arts, Entertainment & Recreation | 345 (42.2%) | 472 (57.8%) |
| Accommodation & Food Services | 1,245 (46.0%) | 1,462 (54.0%) |
| Public Administration | 820 (45.7%) | 976 (54.3%) |
| Total | 20,484 (54.4%) | 17,186 (45.6%) |
Education in Bellflower
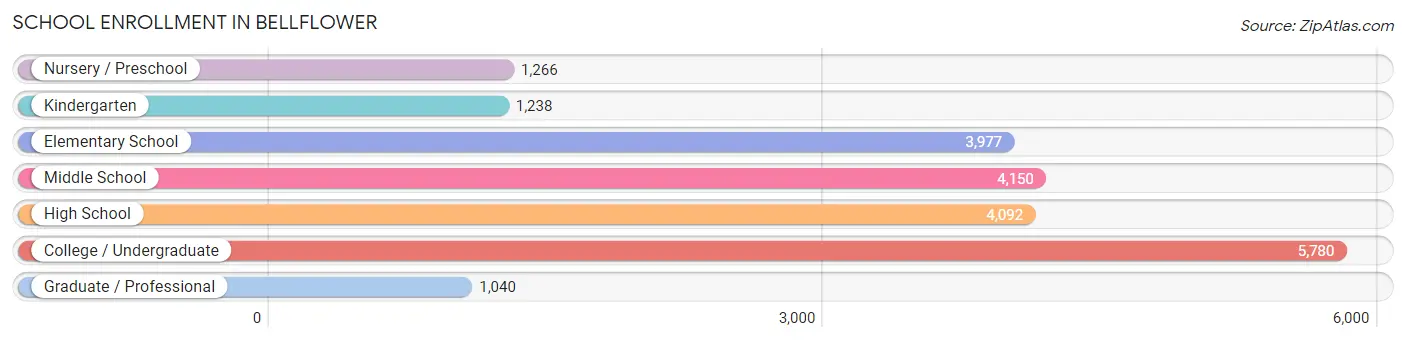
School Enrollment in Bellflower
The most common levels of schooling among the 21,543 students in Bellflower are college / undergraduate (5,780 | 26.8%), middle school (4,150 | 19.3%), and high school (4,092 | 19.0%).
| School Level | # Students | % Students |
| Nursery / Preschool | 1,266 | 5.9% |
| Kindergarten | 1,238 | 5.8% |
| Elementary School | 3,977 | 18.5% |
| Middle School | 4,150 | 19.3% |
| High School | 4,092 | 19.0% |
| College / Undergraduate | 5,780 | 26.8% |
| Graduate / Professional | 1,040 | 4.8% |
| Total | 21,543 | 100.0% |
School Enrollment by Age by Funding Source in Bellflower
Out of a total of 21,543 students who are enrolled in schools in Bellflower, 2,348 (10.9%) attend a private institution, while the remaining 19,195 (89.1%) are enrolled in public schools. The age group of 3 to 4 year olds has the highest likelihood of being enrolled in private schools, with 285 (24.7% in the age bracket) enrolled. Conversely, the age group of 10 to 14 year olds has the lowest likelihood of being enrolled in a private school, with 4,840 (93.3% in the age bracket) attending a public institution.
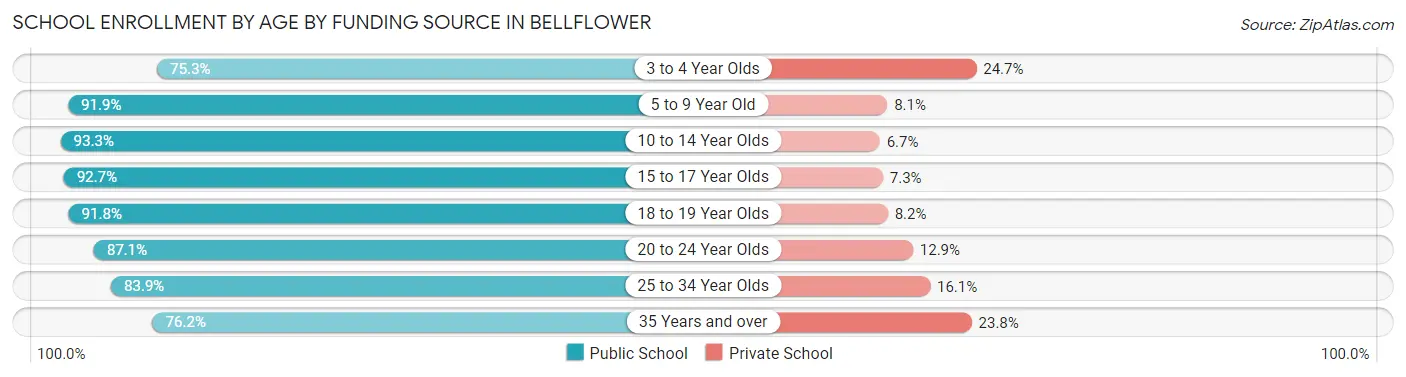
| Age Bracket | Public School | Private School |
| 3 to 4 Year Olds | 869 (75.3%) | 285 (24.7%) |
| 5 to 9 Year Old | 4,409 (91.9%) | 389 (8.1%) |
| 10 to 14 Year Olds | 4,840 (93.3%) | 348 (6.7%) |
| 15 to 17 Year Olds | 2,894 (92.7%) | 228 (7.3%) |
| 18 to 19 Year Olds | 1,364 (91.8%) | 122 (8.2%) |
| 20 to 24 Year Olds | 2,162 (87.1%) | 320 (12.9%) |
| 25 to 34 Year Olds | 1,502 (83.9%) | 288 (16.1%) |
| 35 Years and over | 1,160 (76.2%) | 363 (23.8%) |
| Total | 19,195 (89.1%) | 2,348 (10.9%) |
Educational Attainment by Field of Study in Bellflower
Business (2,517 | 23.0%), science & technology (1,302 | 11.9%), social sciences (977 | 8.9%), engineering (969 | 8.8%), and arts & humanities (912 | 8.3%) are the most common fields of study among 10,965 individuals in Bellflower who have obtained a bachelor's degree or higher.
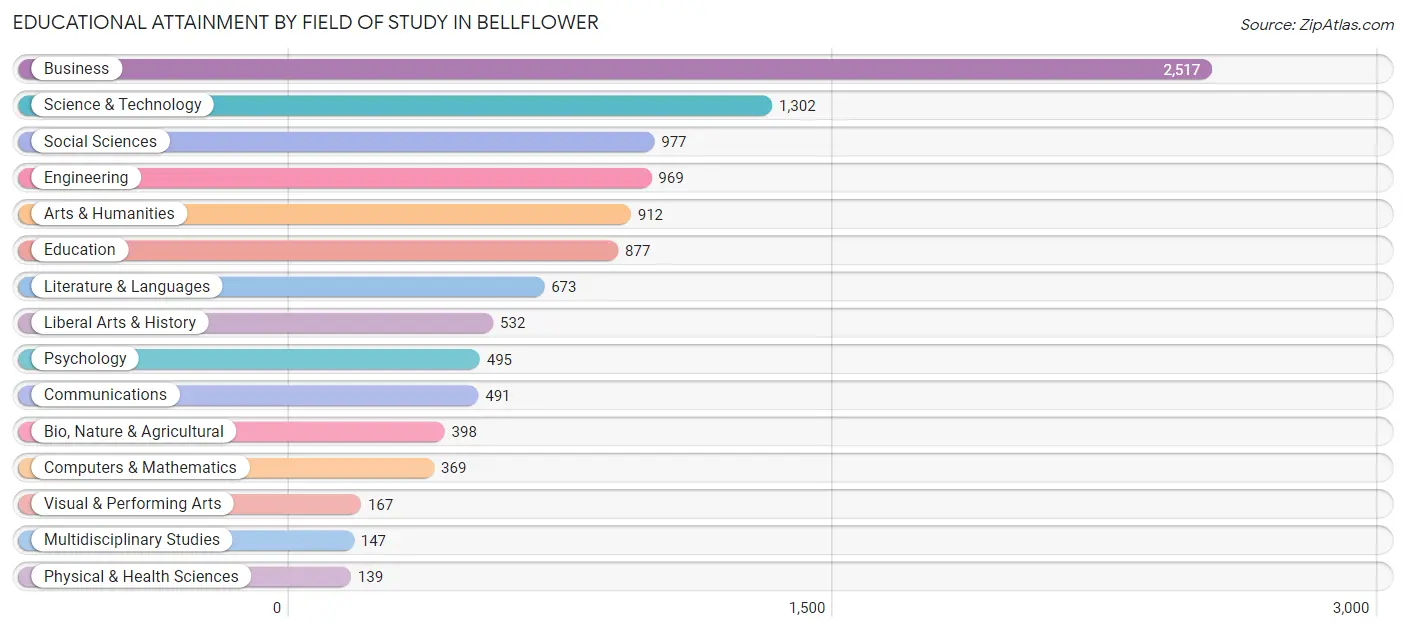
| Field of Study | # Graduates | % Graduates |
| Computers & Mathematics | 369 | 3.4% |
| Bio, Nature & Agricultural | 398 | 3.6% |
| Physical & Health Sciences | 139 | 1.3% |
| Psychology | 495 | 4.5% |
| Social Sciences | 977 | 8.9% |
| Engineering | 969 | 8.8% |
| Multidisciplinary Studies | 147 | 1.3% |
| Science & Technology | 1,302 | 11.9% |
| Business | 2,517 | 23.0% |
| Education | 877 | 8.0% |
| Literature & Languages | 673 | 6.1% |
| Liberal Arts & History | 532 | 4.9% |
| Visual & Performing Arts | 167 | 1.5% |
| Communications | 491 | 4.5% |
| Arts & Humanities | 912 | 8.3% |
| Total | 10,965 | 100.0% |
Transportation & Commute in Bellflower
Vehicle Availability by Sex in Bellflower
The most prevalent vehicle ownership categories in Bellflower are males with 2 vehicles (6,978, accounting for 35.1%) and females with 2 vehicles (5,435, making up 42.5%).
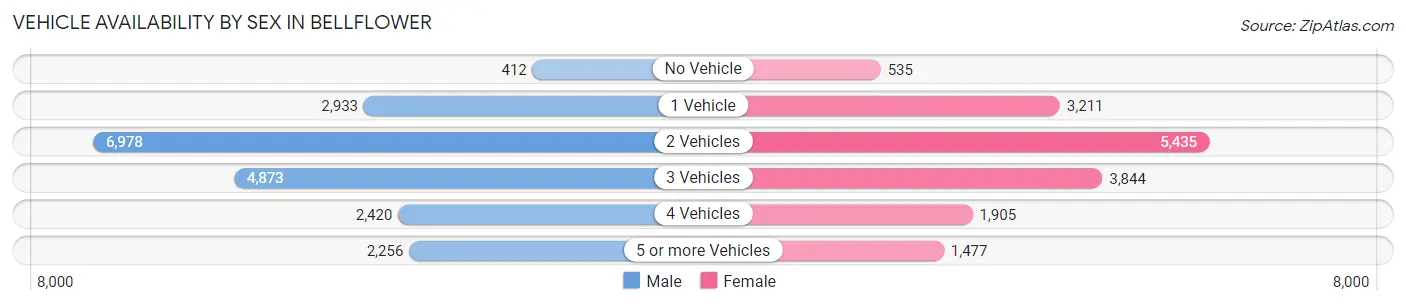
| Vehicles Available | Male | Female |
| No Vehicle | 412 (2.1%) | 535 (3.3%) |
| 1 Vehicle | 2,933 (14.8%) | 3,211 (19.6%) |
| 2 Vehicles | 6,978 (35.1%) | 5,435 (33.1%) |
| 3 Vehicles | 4,873 (24.5%) | 3,844 (23.4%) |
| 4 Vehicles | 2,420 (12.2%) | 1,905 (11.6%) |
| 5 or more Vehicles | 2,256 (11.4%) | 1,477 (9.0%) |
| Total | 19,872 (100.0%) | 16,407 (100.0%) |
Commute Time in Bellflower
The most frequently occuring commute durations in Bellflower are 30 to 34 minutes (6,549 commuters, 19.6%), 20 to 24 minutes (5,018 commuters, 15.0%), and 15 to 19 minutes (4,504 commuters, 13.5%).
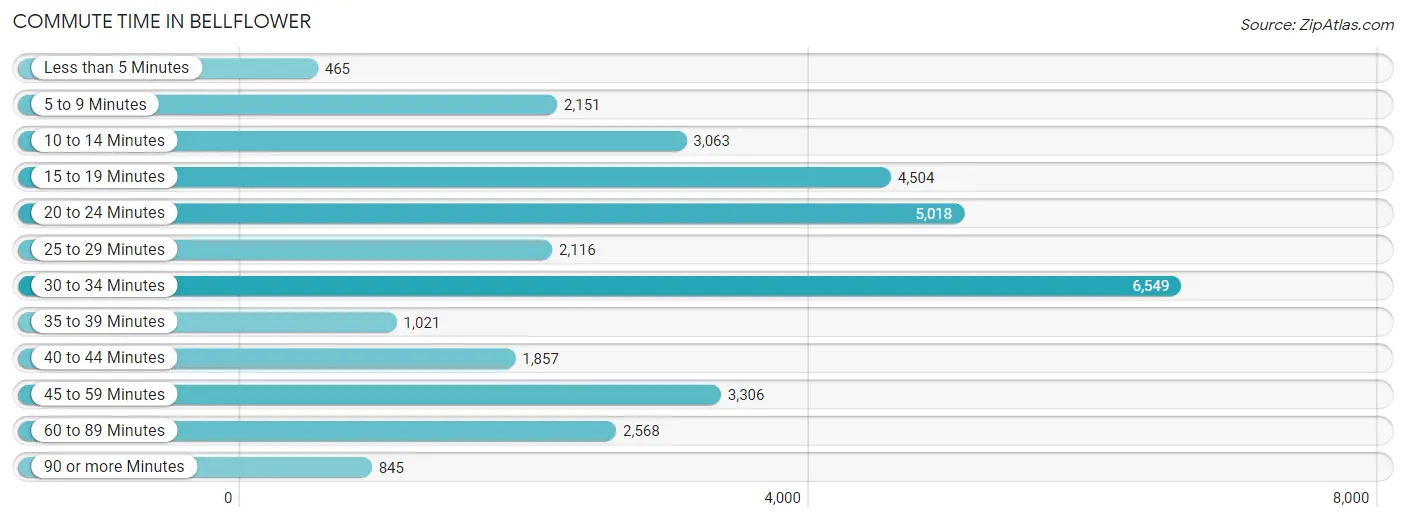
| Commute Time | # Commuters | % Commuters |
| Less than 5 Minutes | 465 | 1.4% |
| 5 to 9 Minutes | 2,151 | 6.4% |
| 10 to 14 Minutes | 3,063 | 9.1% |
| 15 to 19 Minutes | 4,504 | 13.5% |
| 20 to 24 Minutes | 5,018 | 15.0% |
| 25 to 29 Minutes | 2,116 | 6.3% |
| 30 to 34 Minutes | 6,549 | 19.6% |
| 35 to 39 Minutes | 1,021 | 3.0% |
| 40 to 44 Minutes | 1,857 | 5.6% |
| 45 to 59 Minutes | 3,306 | 9.9% |
| 60 to 89 Minutes | 2,568 | 7.7% |
| 90 or more Minutes | 845 | 2.5% |
Commute Time by Sex in Bellflower
The most common commute times in Bellflower are 30 to 34 minutes (4,072 commuters, 21.8%) for males and 30 to 34 minutes (2,477 commuters, 16.7%) for females.
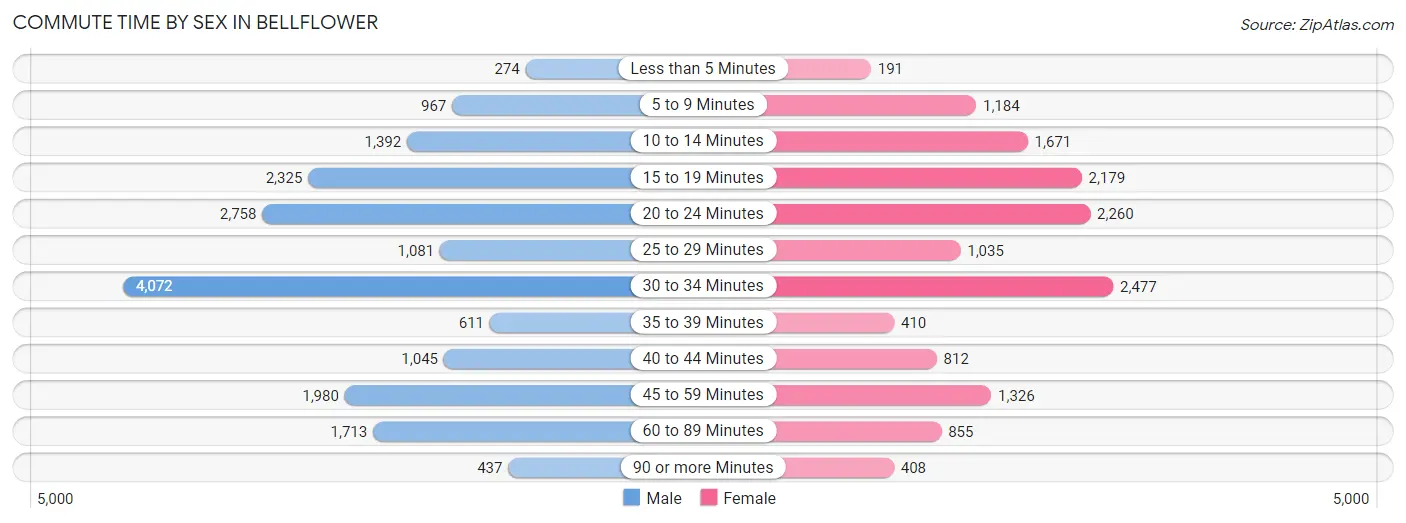
| Commute Time | Male | Female |
| Less than 5 Minutes | 274 (1.5%) | 191 (1.3%) |
| 5 to 9 Minutes | 967 (5.2%) | 1,184 (8.0%) |
| 10 to 14 Minutes | 1,392 (7.5%) | 1,671 (11.3%) |
| 15 to 19 Minutes | 2,325 (12.5%) | 2,179 (14.7%) |
| 20 to 24 Minutes | 2,758 (14.8%) | 2,260 (15.3%) |
| 25 to 29 Minutes | 1,081 (5.8%) | 1,035 (7.0%) |
| 30 to 34 Minutes | 4,072 (21.8%) | 2,477 (16.7%) |
| 35 to 39 Minutes | 611 (3.3%) | 410 (2.8%) |
| 40 to 44 Minutes | 1,045 (5.6%) | 812 (5.5%) |
| 45 to 59 Minutes | 1,980 (10.6%) | 1,326 (8.9%) |
| 60 to 89 Minutes | 1,713 (9.2%) | 855 (5.8%) |
| 90 or more Minutes | 437 (2.3%) | 408 (2.8%) |
Time of Departure to Work by Sex in Bellflower
The most frequent times of departure to work in Bellflower are 12:00 AM to 4:59 AM (2,507, 13.4%) for males and 7:00 AM to 7:29 AM (2,829, 19.1%) for females.
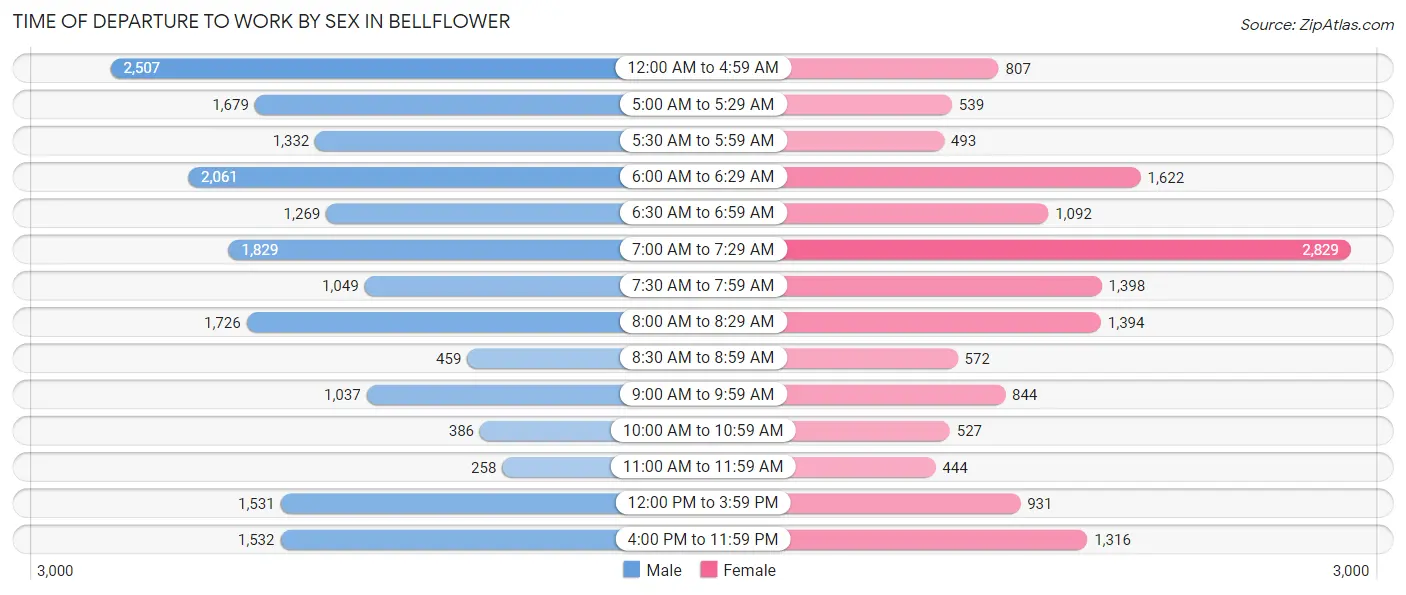
| Time of Departure | Male | Female |
| 12:00 AM to 4:59 AM | 2,507 (13.4%) | 807 (5.4%) |
| 5:00 AM to 5:29 AM | 1,679 (9.0%) | 539 (3.6%) |
| 5:30 AM to 5:59 AM | 1,332 (7.1%) | 493 (3.3%) |
| 6:00 AM to 6:29 AM | 2,061 (11.1%) | 1,622 (11.0%) |
| 6:30 AM to 6:59 AM | 1,269 (6.8%) | 1,092 (7.4%) |
| 7:00 AM to 7:29 AM | 1,829 (9.8%) | 2,829 (19.1%) |
| 7:30 AM to 7:59 AM | 1,049 (5.6%) | 1,398 (9.4%) |
| 8:00 AM to 8:29 AM | 1,726 (9.2%) | 1,394 (9.4%) |
| 8:30 AM to 8:59 AM | 459 (2.5%) | 572 (3.9%) |
| 9:00 AM to 9:59 AM | 1,037 (5.6%) | 844 (5.7%) |
| 10:00 AM to 10:59 AM | 386 (2.1%) | 527 (3.6%) |
| 11:00 AM to 11:59 AM | 258 (1.4%) | 444 (3.0%) |
| 12:00 PM to 3:59 PM | 1,531 (8.2%) | 931 (6.3%) |
| 4:00 PM to 11:59 PM | 1,532 (8.2%) | 1,316 (8.9%) |
| Total | 18,655 (100.0%) | 14,808 (100.0%) |
Housing Occupancy in Bellflower
Occupancy by Ownership in Bellflower
Of the total 24,065 dwellings in Bellflower, owner-occupied units account for 9,397 (39.1%), while renter-occupied units make up 14,668 (61.0%).
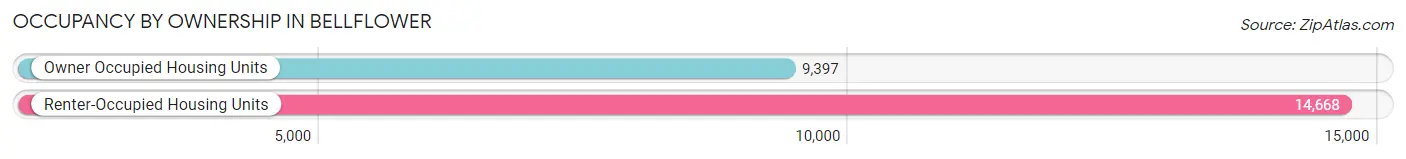
| Occupancy | # Housing Units | % Housing Units |
| Owner Occupied Housing Units | 9,397 | 39.1% |
| Renter-Occupied Housing Units | 14,668 | 61.0% |
| Total Occupied Housing Units | 24,065 | 100.0% |
Occupancy by Household Size in Bellflower
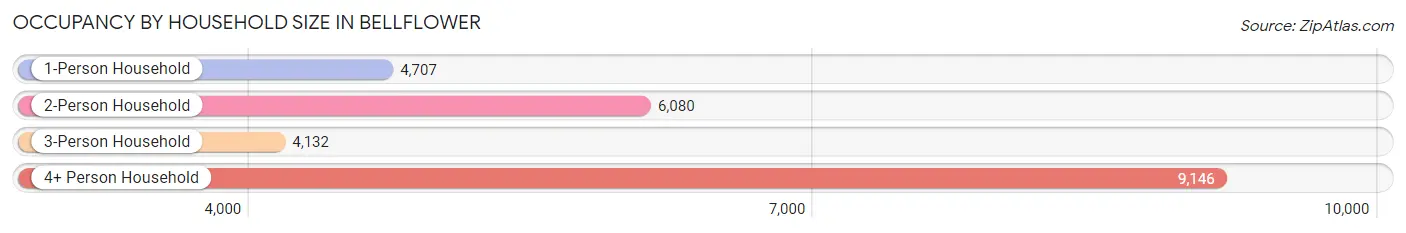
| Household Size | # Housing Units | % Housing Units |
| 1-Person Household | 4,707 | 19.6% |
| 2-Person Household | 6,080 | 25.3% |
| 3-Person Household | 4,132 | 17.2% |
| 4+ Person Household | 9,146 | 38.0% |
| Total Housing Units | 24,065 | 100.0% |
Occupancy by Ownership by Household Size in Bellflower
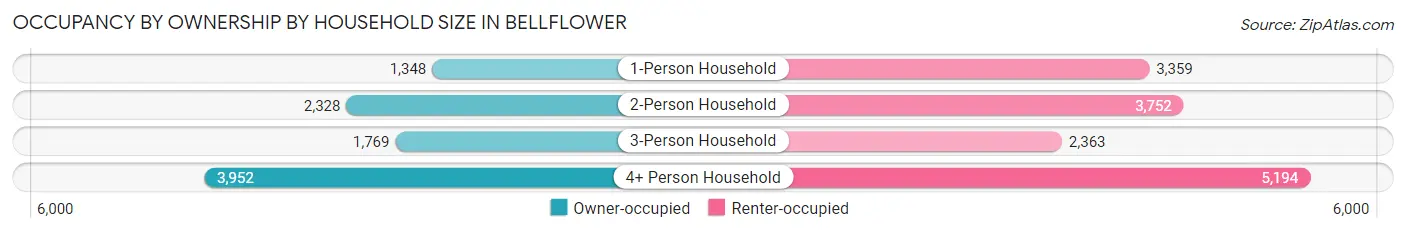
| Household Size | Owner-occupied | Renter-occupied |
| 1-Person Household | 1,348 (28.6%) | 3,359 (71.4%) |
| 2-Person Household | 2,328 (38.3%) | 3,752 (61.7%) |
| 3-Person Household | 1,769 (42.8%) | 2,363 (57.2%) |
| 4+ Person Household | 3,952 (43.2%) | 5,194 (56.8%) |
| Total Housing Units | 9,397 (39.1%) | 14,668 (61.0%) |
Occupancy by Educational Attainment in Bellflower
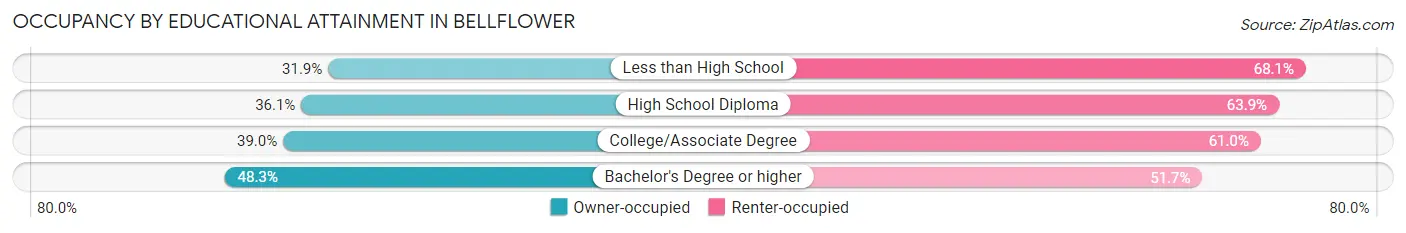
| Household Size | Owner-occupied | Renter-occupied |
| Less than High School | 1,533 (31.9%) | 3,278 (68.1%) |
| High School Diploma | 1,850 (36.1%) | 3,271 (63.9%) |
| College/Associate Degree | 3,406 (39.0%) | 5,324 (61.0%) |
| Bachelor's Degree or higher | 2,608 (48.3%) | 2,795 (51.7%) |
Occupancy by Age of Householder in Bellflower
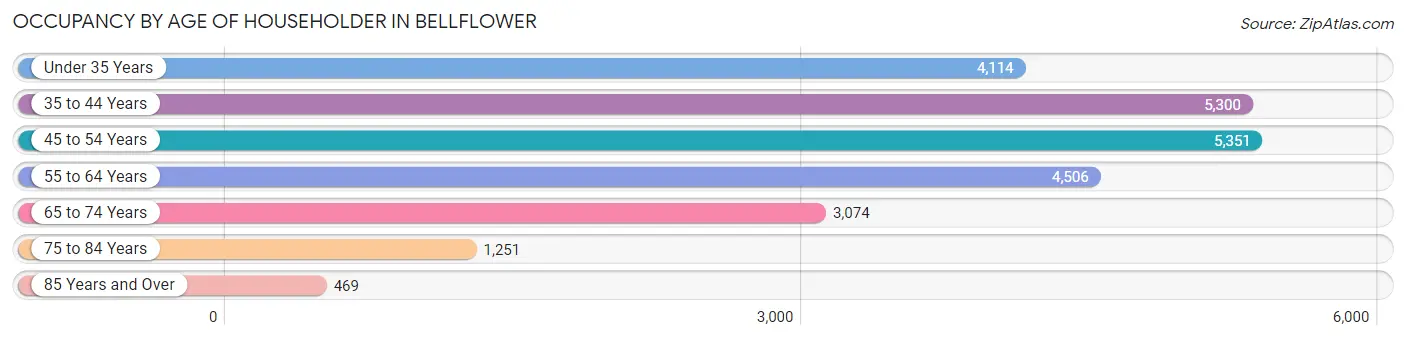
| Age Bracket | # Households | % Households |
| Under 35 Years | 4,114 | 17.1% |
| 35 to 44 Years | 5,300 | 22.0% |
| 45 to 54 Years | 5,351 | 22.2% |
| 55 to 64 Years | 4,506 | 18.7% |
| 65 to 74 Years | 3,074 | 12.8% |
| 75 to 84 Years | 1,251 | 5.2% |
| 85 Years and Over | 469 | 1.9% |
| Total | 24,065 | 100.0% |
Housing Finances in Bellflower
Median Income by Occupancy in Bellflower
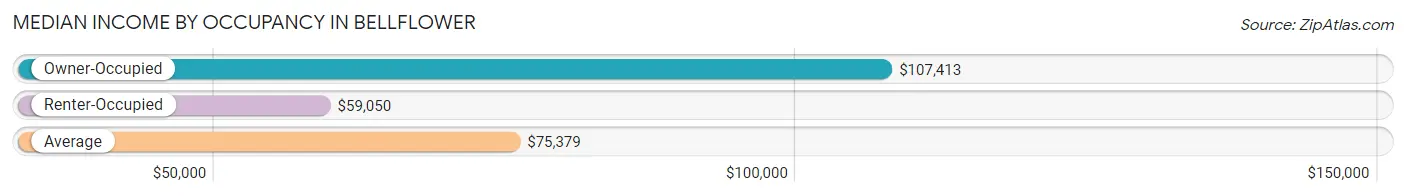
| Occupancy Type | # Households | Median Income |
| Owner-Occupied | 9,397 (39.1%) | $107,413 |
| Renter-Occupied | 14,668 (61.0%) | $59,050 |
| Average | 24,065 (100.0%) | $75,379 |
Occupancy by Householder Income Bracket in Bellflower
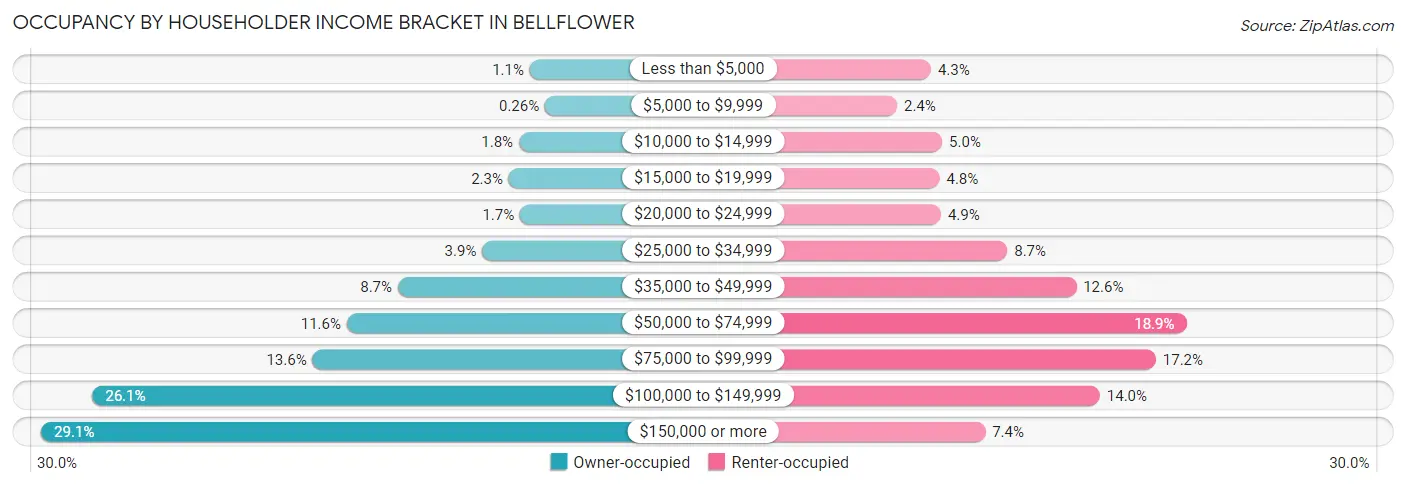
| Income Bracket | Owner-occupied | Renter-occupied |
| Less than $5,000 | 106 (1.1%) | 632 (4.3%) |
| $5,000 to $9,999 | 24 (0.3%) | 347 (2.4%) |
| $10,000 to $14,999 | 164 (1.8%) | 726 (5.0%) |
| $15,000 to $19,999 | 219 (2.3%) | 704 (4.8%) |
| $20,000 to $24,999 | 159 (1.7%) | 716 (4.9%) |
| $25,000 to $34,999 | 362 (3.8%) | 1,271 (8.7%) |
| $35,000 to $49,999 | 815 (8.7%) | 1,849 (12.6%) |
| $50,000 to $74,999 | 1,089 (11.6%) | 2,772 (18.9%) |
| $75,000 to $99,999 | 1,273 (13.6%) | 2,517 (17.2%) |
| $100,000 to $149,999 | 2,455 (26.1%) | 2,047 (14.0%) |
| $150,000 or more | 2,731 (29.1%) | 1,087 (7.4%) |
| Total | 9,397 (100.0%) | 14,668 (100.0%) |
Monthly Housing Cost Tiers in Bellflower
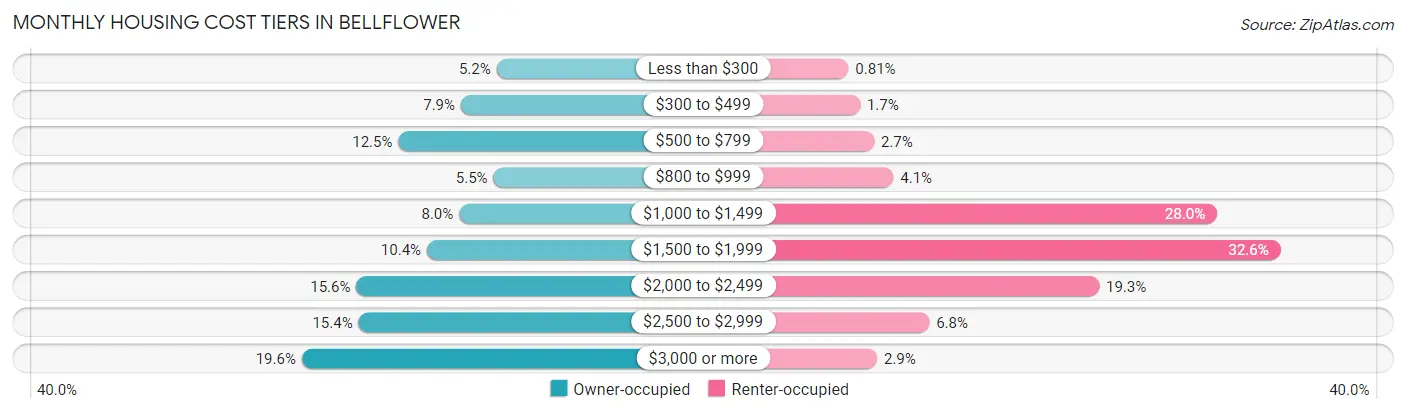
| Monthly Cost | Owner-occupied | Renter-occupied |
| Less than $300 | 492 (5.2%) | 119 (0.8%) |
| $300 to $499 | 740 (7.9%) | 243 (1.7%) |
| $500 to $799 | 1,173 (12.5%) | 394 (2.7%) |
| $800 to $999 | 514 (5.5%) | 605 (4.1%) |
| $1,000 to $1,499 | 752 (8.0%) | 4,101 (28.0%) |
| $1,500 to $1,999 | 974 (10.4%) | 4,786 (32.6%) |
| $2,000 to $2,499 | 1,463 (15.6%) | 2,826 (19.3%) |
| $2,500 to $2,999 | 1,448 (15.4%) | 992 (6.8%) |
| $3,000 or more | 1,841 (19.6%) | 428 (2.9%) |
| Total | 9,397 (100.0%) | 14,668 (100.0%) |
Physical Housing Characteristics in Bellflower
Housing Structures in Bellflower
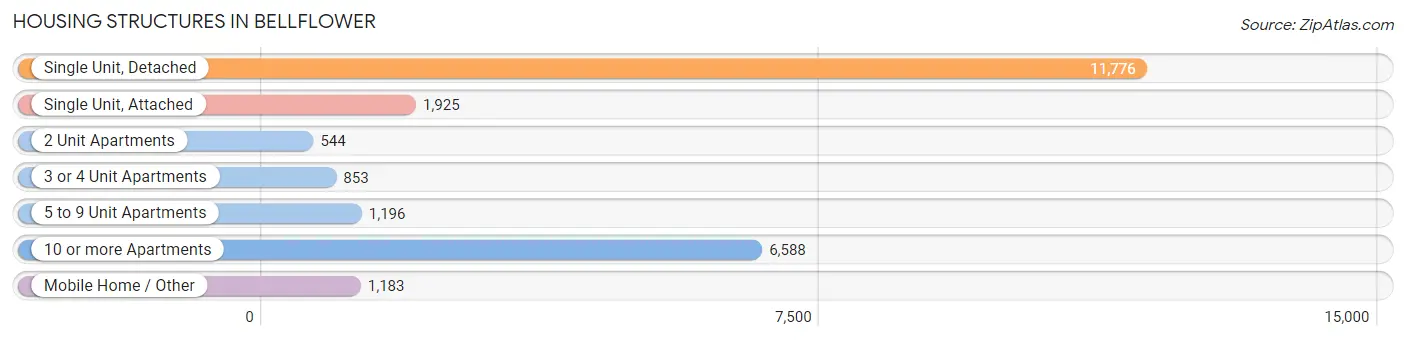
| Structure Type | # Housing Units | % Housing Units |
| Single Unit, Detached | 11,776 | 48.9% |
| Single Unit, Attached | 1,925 | 8.0% |
| 2 Unit Apartments | 544 | 2.3% |
| 3 or 4 Unit Apartments | 853 | 3.5% |
| 5 to 9 Unit Apartments | 1,196 | 5.0% |
| 10 or more Apartments | 6,588 | 27.4% |
| Mobile Home / Other | 1,183 | 4.9% |
| Total | 24,065 | 100.0% |
Housing Structures by Occupancy in Bellflower
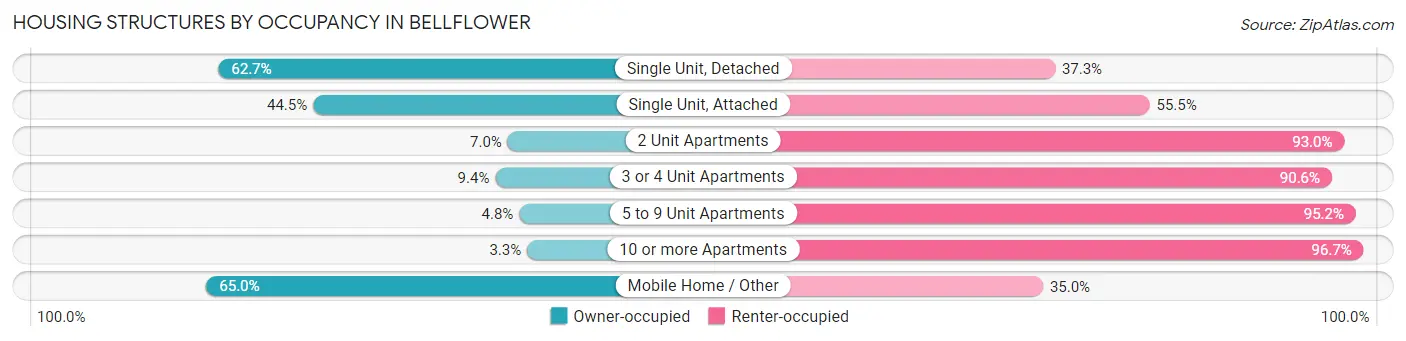
| Structure Type | Owner-occupied | Renter-occupied |
| Single Unit, Detached | 7,382 (62.7%) | 4,394 (37.3%) |
| Single Unit, Attached | 856 (44.5%) | 1,069 (55.5%) |
| 2 Unit Apartments | 38 (7.0%) | 506 (93.0%) |
| 3 or 4 Unit Apartments | 80 (9.4%) | 773 (90.6%) |
| 5 to 9 Unit Apartments | 57 (4.8%) | 1,139 (95.2%) |
| 10 or more Apartments | 215 (3.3%) | 6,373 (96.7%) |
| Mobile Home / Other | 769 (65.0%) | 414 (35.0%) |
| Total | 9,397 (39.1%) | 14,668 (61.0%) |
Housing Structures by Number of Rooms in Bellflower
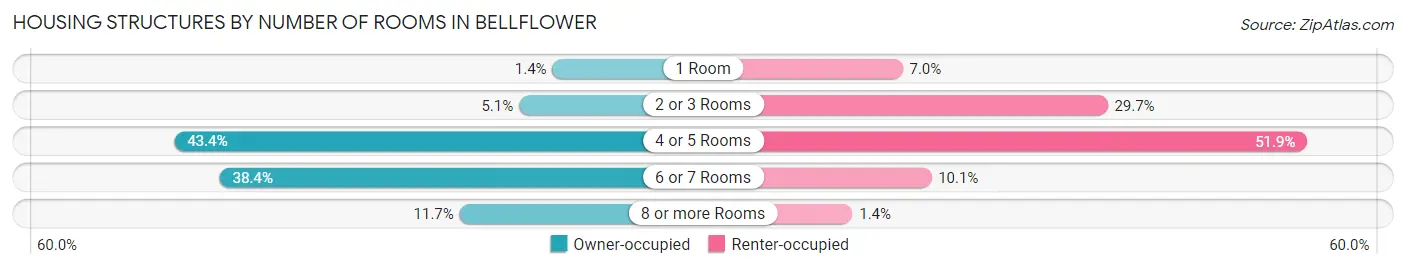
| Number of Rooms | Owner-occupied | Renter-occupied |
| 1 Room | 133 (1.4%) | 1,019 (7.0%) |
| 2 or 3 Rooms | 481 (5.1%) | 4,355 (29.7%) |
| 4 or 5 Rooms | 4,077 (43.4%) | 7,607 (51.9%) |
| 6 or 7 Rooms | 3,605 (38.4%) | 1,486 (10.1%) |
| 8 or more Rooms | 1,101 (11.7%) | 201 (1.4%) |
| Total | 9,397 (100.0%) | 14,668 (100.0%) |
Housing Structure by Heating Type in Bellflower
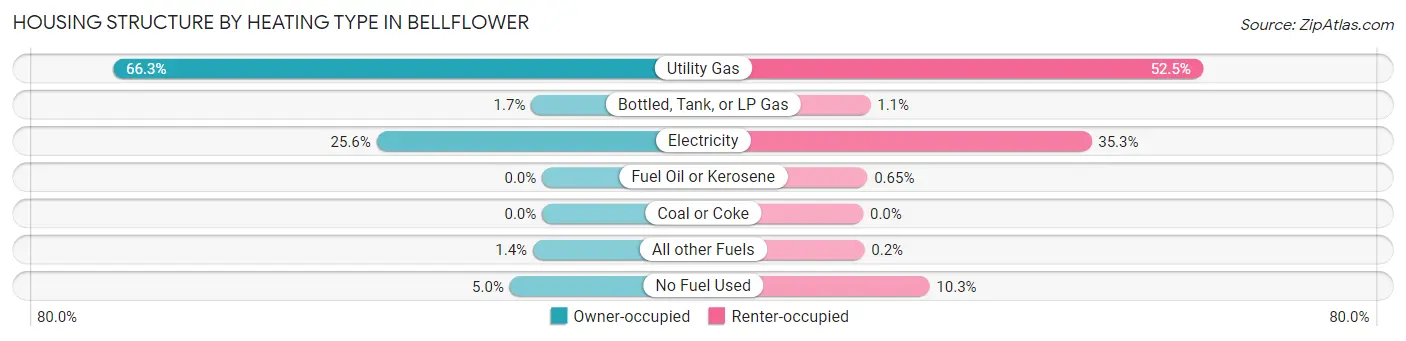
| Heating Type | Owner-occupied | Renter-occupied |
| Utility Gas | 6,232 (66.3%) | 7,700 (52.5%) |
| Bottled, Tank, or LP Gas | 158 (1.7%) | 164 (1.1%) |
| Electricity | 2,404 (25.6%) | 5,175 (35.3%) |
| Fuel Oil or Kerosene | 0 (0.0%) | 95 (0.6%) |
| Coal or Coke | 0 (0.0%) | 0 (0.0%) |
| All other Fuels | 133 (1.4%) | 29 (0.2%) |
| No Fuel Used | 470 (5.0%) | 1,505 (10.3%) |
| Total | 9,397 (100.0%) | 14,668 (100.0%) |
Household Vehicle Usage in Bellflower
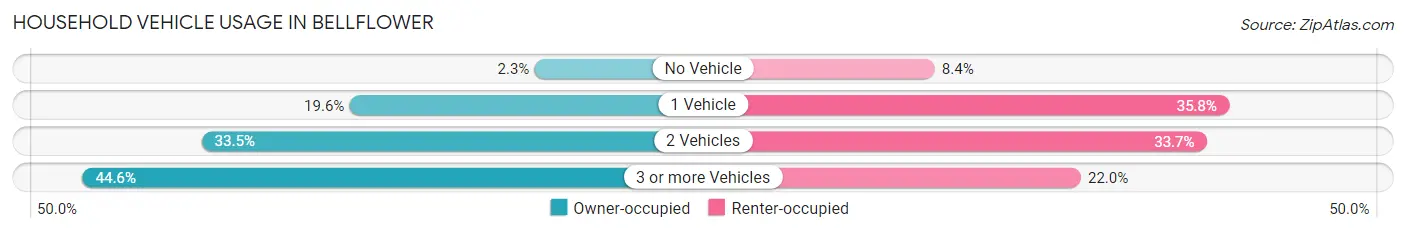
| Vehicles per Household | Owner-occupied | Renter-occupied |
| No Vehicle | 220 (2.3%) | 1,232 (8.4%) |
| 1 Vehicle | 1,843 (19.6%) | 5,255 (35.8%) |
| 2 Vehicles | 3,145 (33.5%) | 4,948 (33.7%) |
| 3 or more Vehicles | 4,189 (44.6%) | 3,233 (22.0%) |
| Total | 9,397 (100.0%) | 14,668 (100.0%) |
Real Estate & Mortgages in Bellflower
Real Estate and Mortgage Overview in Bellflower
| Characteristic | Without Mortgage | With Mortgage |
| Housing Units | 3,030 | 6,367 |
| Median Property Value | $572,500 | $639,000 |
| Median Household Income | $71,743 | $2,219 |
| Monthly Housing Costs | $608 | $1,819 |
| Real Estate Taxes | $3,090 | $171 |
Property Value by Mortgage Status in Bellflower
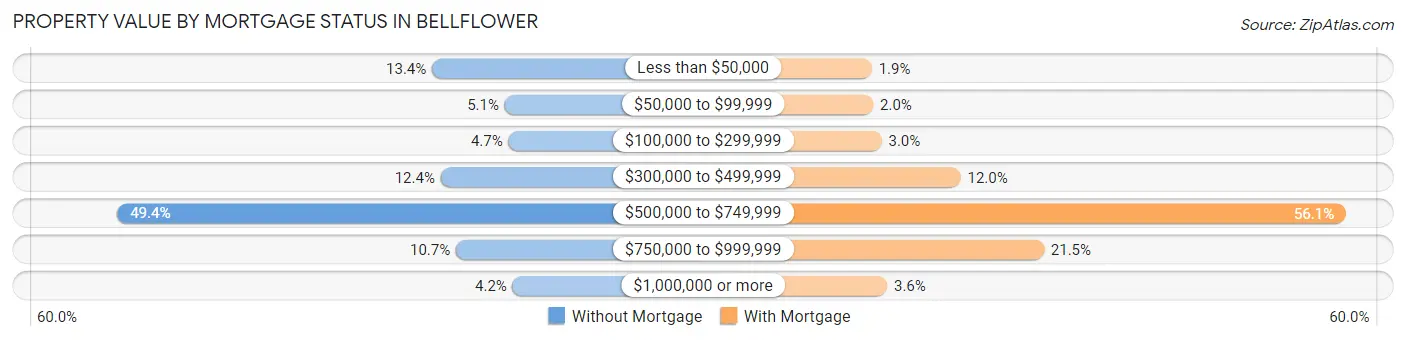
| Property Value | Without Mortgage | With Mortgage |
| Less than $50,000 | 407 (13.4%) | 118 (1.8%) |
| $50,000 to $99,999 | 155 (5.1%) | 128 (2.0%) |
| $100,000 to $299,999 | 142 (4.7%) | 189 (3.0%) |
| $300,000 to $499,999 | 377 (12.4%) | 764 (12.0%) |
| $500,000 to $749,999 | 1,497 (49.4%) | 3,569 (56.0%) |
| $750,000 to $999,999 | 324 (10.7%) | 1,370 (21.5%) |
| $1,000,000 or more | 128 (4.2%) | 229 (3.6%) |
| Total | 3,030 (100.0%) | 6,367 (100.0%) |
Household Income by Mortgage Status in Bellflower
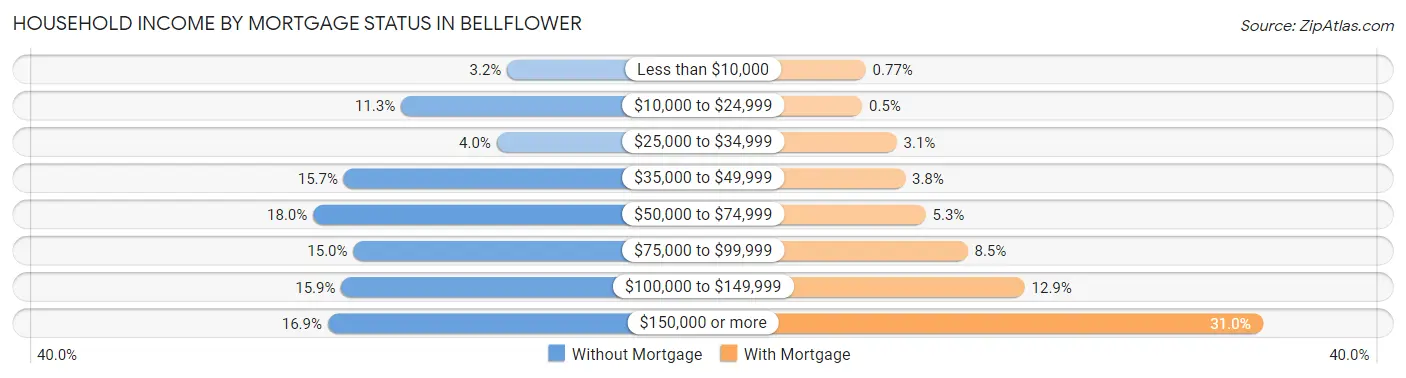
| Household Income | Without Mortgage | With Mortgage |
| Less than $10,000 | 98 (3.2%) | 49 (0.8%) |
| $10,000 to $24,999 | 343 (11.3%) | 32 (0.5%) |
| $25,000 to $34,999 | 122 (4.0%) | 199 (3.1%) |
| $35,000 to $49,999 | 475 (15.7%) | 240 (3.8%) |
| $50,000 to $74,999 | 546 (18.0%) | 340 (5.3%) |
| $75,000 to $99,999 | 453 (14.9%) | 543 (8.5%) |
| $100,000 to $149,999 | 481 (15.9%) | 820 (12.9%) |
| $150,000 or more | 512 (16.9%) | 1,974 (31.0%) |
| Total | 3,030 (100.0%) | 6,367 (100.0%) |
Property Value to Household Income Ratio in Bellflower
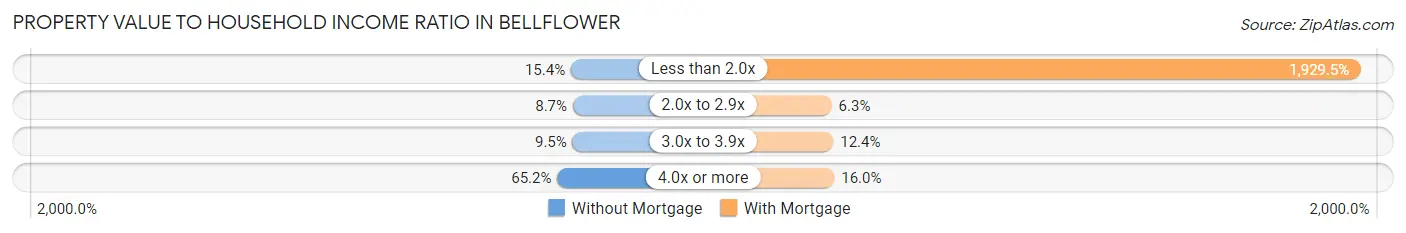
| Value-to-Income Ratio | Without Mortgage | With Mortgage |
| Less than 2.0x | 466 (15.4%) | 122,854 (1,929.5%) |
| 2.0x to 2.9x | 262 (8.6%) | 399 (6.3%) |
| 3.0x to 3.9x | 289 (9.5%) | 788 (12.4%) |
| 4.0x or more | 1,974 (65.1%) | 1,019 (16.0%) |
| Total | 3,030 (100.0%) | 6,367 (100.0%) |
Real Estate Taxes by Mortgage Status in Bellflower
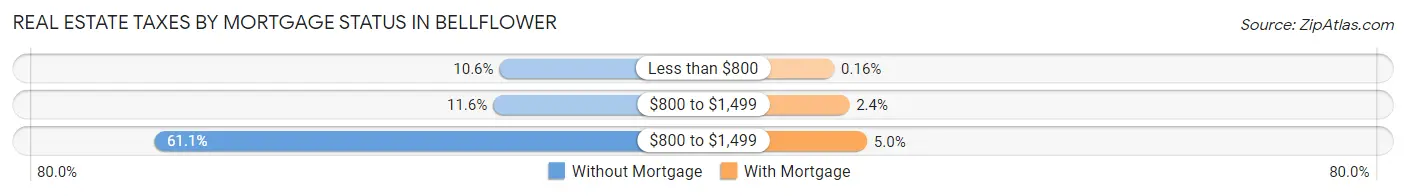
| Property Taxes | Without Mortgage | With Mortgage |
| Less than $800 | 322 (10.6%) | 10 (0.2%) |
| $800 to $1,499 | 350 (11.6%) | 150 (2.4%) |
| $800 to $1,499 | 1,851 (61.1%) | 315 (5.0%) |
| Total | 3,030 (100.0%) | 6,367 (100.0%) |
Health & Disability in Bellflower
Health Insurance Coverage by Age in Bellflower
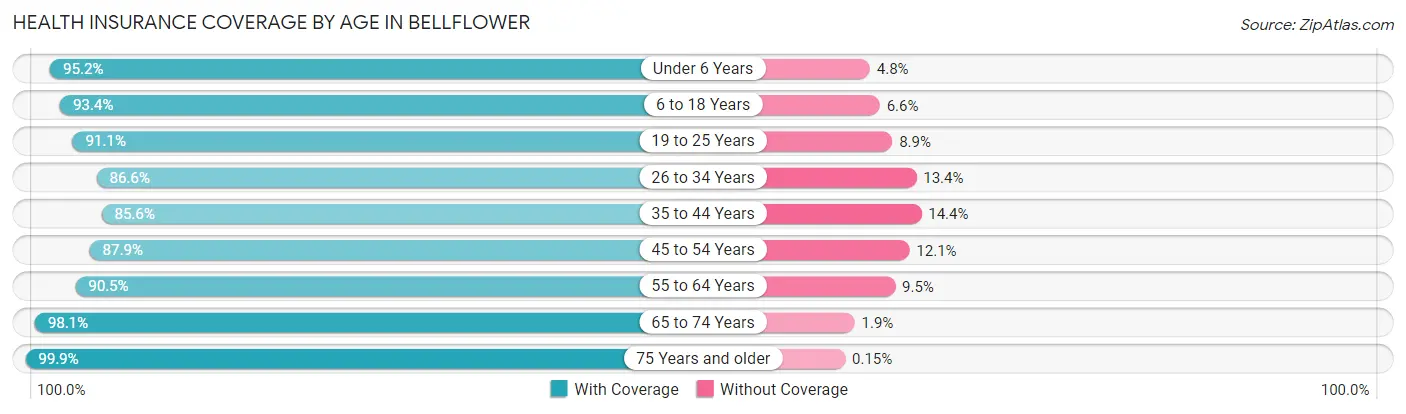
| Age Bracket | With Coverage | Without Coverage |
| Under 6 Years | 5,490 (95.2%) | 275 (4.8%) |
| 6 to 18 Years | 12,877 (93.4%) | 911 (6.6%) |
| 19 to 25 Years | 6,827 (91.1%) | 670 (8.9%) |
| 26 to 34 Years | 9,938 (86.6%) | 1,541 (13.4%) |
| 35 to 44 Years | 9,455 (85.6%) | 1,586 (14.4%) |
| 45 to 54 Years | 8,816 (87.9%) | 1,218 (12.1%) |
| 55 to 64 Years | 8,252 (90.5%) | 863 (9.5%) |
| 65 to 74 Years | 5,780 (98.1%) | 113 (1.9%) |
| 75 Years and older | 3,352 (99.9%) | 5 (0.2%) |
| Total | 70,787 (90.8%) | 7,182 (9.2%) |
Health Insurance Coverage by Citizenship Status in Bellflower
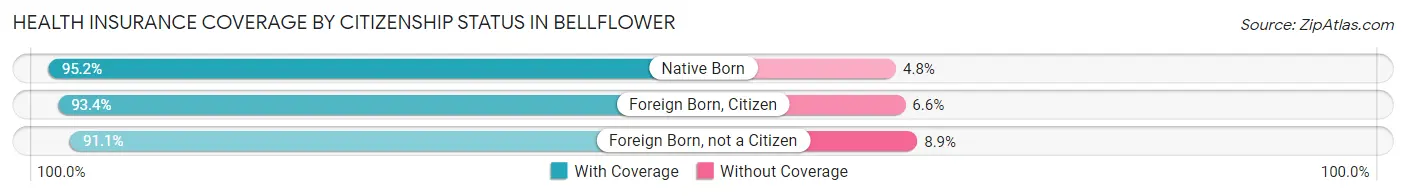
| Citizenship Status | With Coverage | Without Coverage |
| Native Born | 5,490 (95.2%) | 275 (4.8%) |
| Foreign Born, Citizen | 12,877 (93.4%) | 911 (6.6%) |
| Foreign Born, not a Citizen | 6,827 (91.1%) | 670 (8.9%) |
Health Insurance Coverage by Household Income in Bellflower
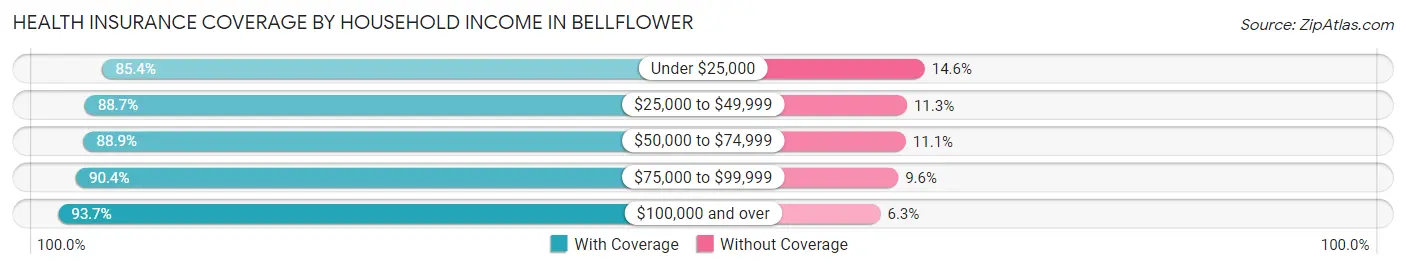
| Household Income | With Coverage | Without Coverage |
| Under $25,000 | 6,960 (85.4%) | 1,191 (14.6%) |
| $25,000 to $49,999 | 10,782 (88.7%) | 1,371 (11.3%) |
| $50,000 to $74,999 | 10,488 (88.9%) | 1,306 (11.1%) |
| $75,000 to $99,999 | 11,345 (90.4%) | 1,211 (9.6%) |
| $100,000 and over | 30,716 (93.7%) | 2,072 (6.3%) |
Public vs Private Health Insurance Coverage by Age in Bellflower
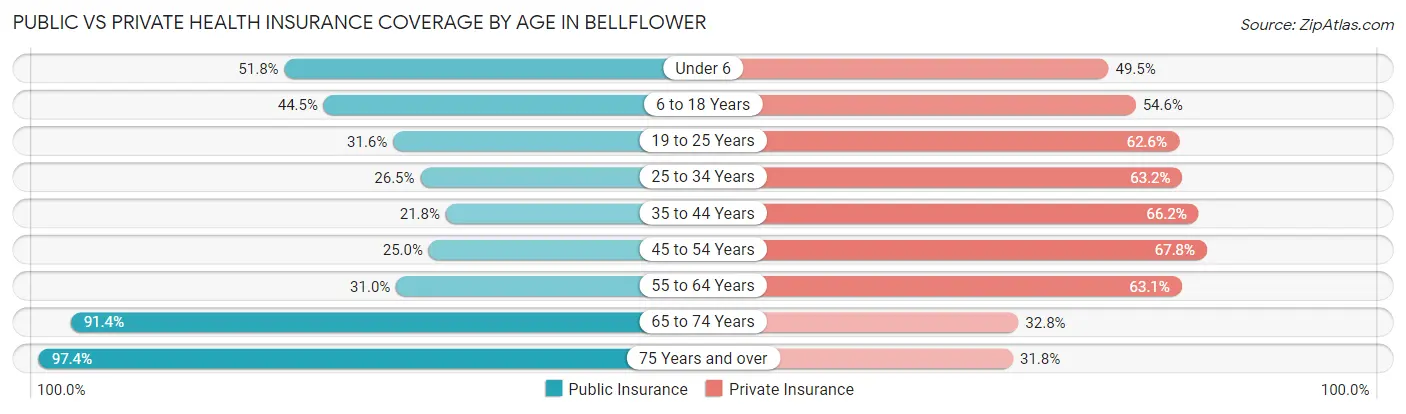
| Age Bracket | Public Insurance | Private Insurance |
| Under 6 | 2,985 (51.8%) | 2,854 (49.5%) |
| 6 to 18 Years | 6,130 (44.5%) | 7,522 (54.5%) |
| 19 to 25 Years | 2,369 (31.6%) | 4,689 (62.5%) |
| 25 to 34 Years | 3,046 (26.5%) | 7,256 (63.2%) |
| 35 to 44 Years | 2,409 (21.8%) | 7,313 (66.2%) |
| 45 to 54 Years | 2,505 (25.0%) | 6,798 (67.7%) |
| 55 to 64 Years | 2,828 (31.0%) | 5,749 (63.1%) |
| 65 to 74 Years | 5,388 (91.4%) | 1,932 (32.8%) |
| 75 Years and over | 3,268 (97.4%) | 1,067 (31.8%) |
| Total | 30,928 (39.7%) | 45,180 (58.0%) |
Disability Status by Sex by Age in Bellflower
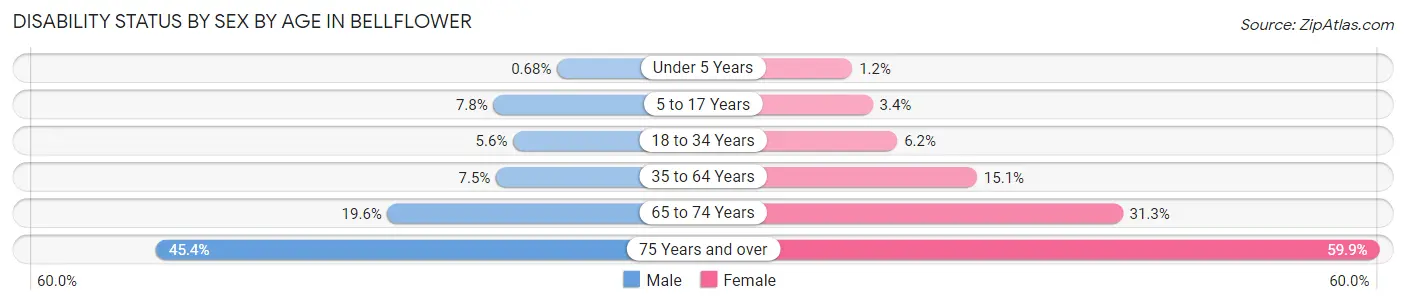
| Age Bracket | Male | Female |
| Under 5 Years | 15 (0.7%) | 28 (1.2%) |
| 5 to 17 Years | 515 (7.8%) | 247 (3.4%) |
| 18 to 34 Years | 592 (5.6%) | 583 (6.2%) |
| 35 to 64 Years | 1,092 (7.5%) | 2,347 (15.0%) |
| 65 to 74 Years | 471 (19.6%) | 1,090 (31.3%) |
| 75 Years and over | 590 (45.4%) | 1,231 (59.9%) |
Disability Class by Sex by Age in Bellflower
Disability Class: Hearing Difficulty
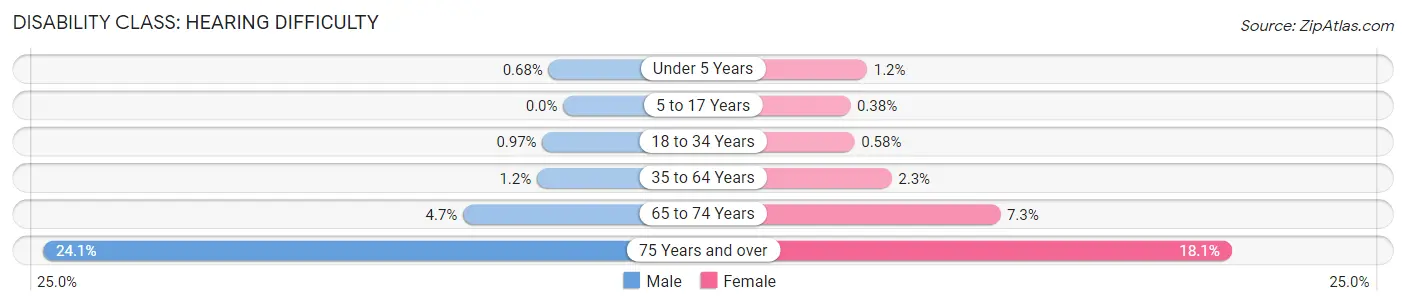
| Age Bracket | Male | Female |
| Under 5 Years | 15 (0.7%) | 28 (1.2%) |
| 5 to 17 Years | 0 (0.0%) | 27 (0.4%) |
| 18 to 34 Years | 103 (1.0%) | 55 (0.6%) |
| 35 to 64 Years | 178 (1.2%) | 358 (2.3%) |
| 65 to 74 Years | 112 (4.6%) | 256 (7.3%) |
| 75 Years and over | 314 (24.1%) | 372 (18.1%) |
Disability Class: Vision Difficulty
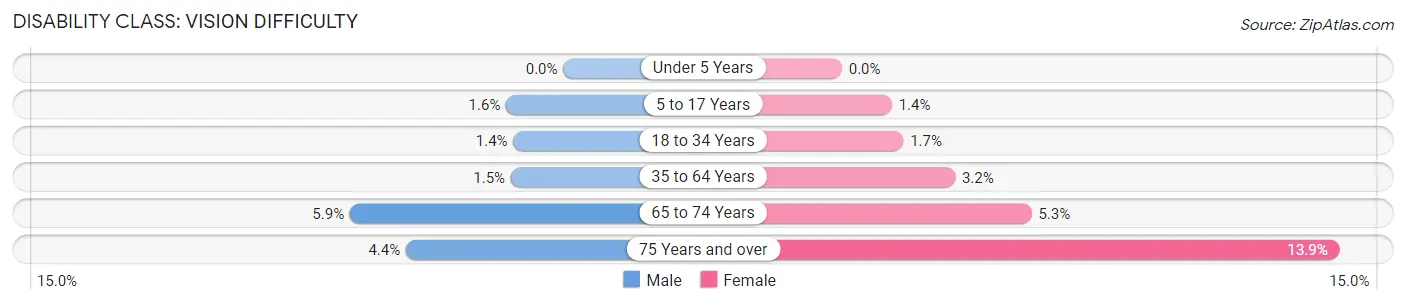
| Age Bracket | Male | Female |
| Under 5 Years | 0 (0.0%) | 0 (0.0%) |
| 5 to 17 Years | 105 (1.6%) | 100 (1.4%) |
| 18 to 34 Years | 148 (1.4%) | 162 (1.7%) |
| 35 to 64 Years | 213 (1.5%) | 492 (3.2%) |
| 65 to 74 Years | 143 (5.9%) | 184 (5.3%) |
| 75 Years and over | 57 (4.4%) | 285 (13.9%) |
Disability Class: Cognitive Difficulty
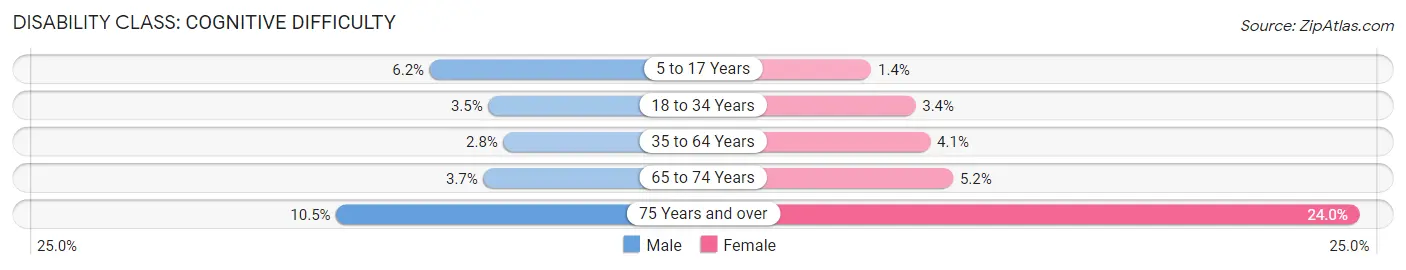
| Age Bracket | Male | Female |
| 5 to 17 Years | 410 (6.2%) | 98 (1.4%) |
| 18 to 34 Years | 368 (3.5%) | 322 (3.4%) |
| 35 to 64 Years | 404 (2.8%) | 639 (4.1%) |
| 65 to 74 Years | 89 (3.7%) | 180 (5.2%) |
| 75 Years and over | 137 (10.5%) | 494 (24.0%) |
Disability Class: Ambulatory Difficulty
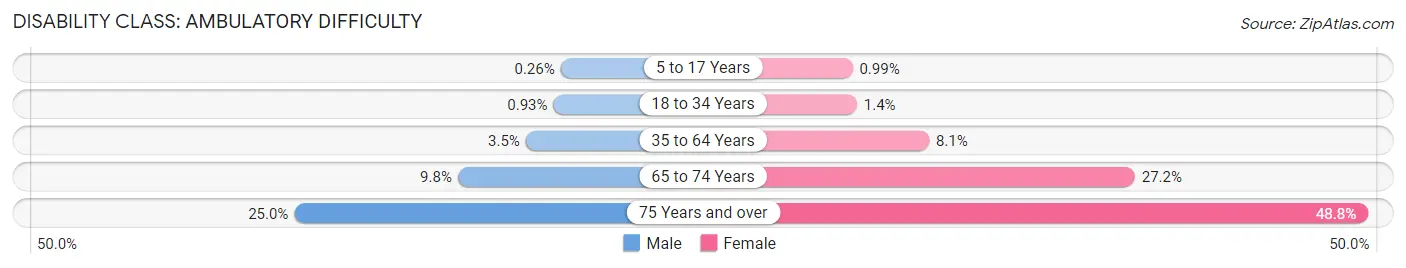
| Age Bracket | Male | Female |
| 5 to 17 Years | 17 (0.3%) | 71 (1.0%) |
| 18 to 34 Years | 99 (0.9%) | 132 (1.4%) |
| 35 to 64 Years | 510 (3.5%) | 1,262 (8.1%) |
| 65 to 74 Years | 236 (9.8%) | 948 (27.2%) |
| 75 Years and over | 325 (25.0%) | 1,004 (48.8%) |
Disability Class: Self-Care Difficulty
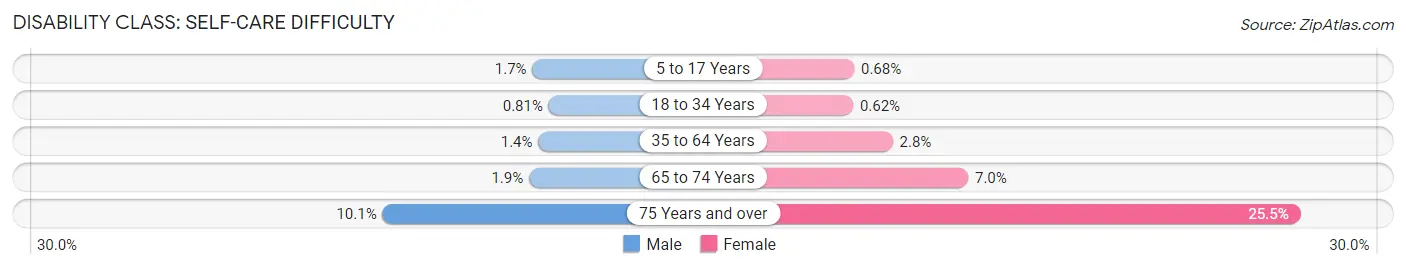
| Age Bracket | Male | Female |
| 5 to 17 Years | 114 (1.7%) | 49 (0.7%) |
| 18 to 34 Years | 86 (0.8%) | 59 (0.6%) |
| 35 to 64 Years | 203 (1.4%) | 442 (2.8%) |
| 65 to 74 Years | 46 (1.9%) | 245 (7.0%) |
| 75 Years and over | 131 (10.1%) | 525 (25.5%) |
Technology Access in Bellflower
Computing Device Access in Bellflower
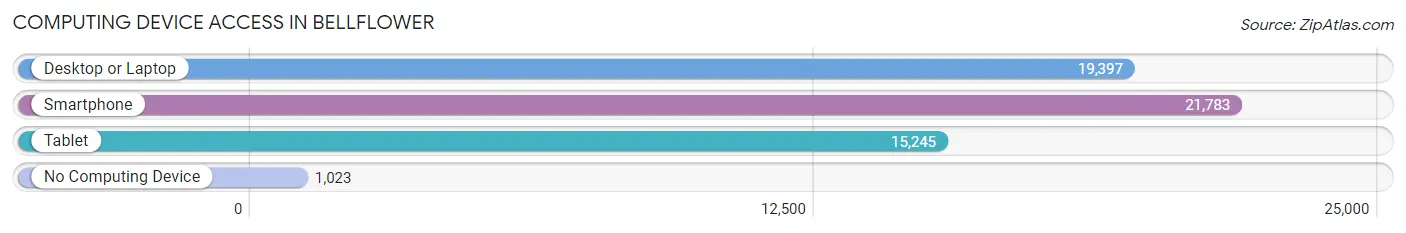
| Device Type | # Households | % Households |
| Desktop or Laptop | 19,397 | 80.6% |
| Smartphone | 21,783 | 90.5% |
| Tablet | 15,245 | 63.3% |
| No Computing Device | 1,023 | 4.3% |
| Total | 24,065 | 100.0% |
Internet Access in Bellflower
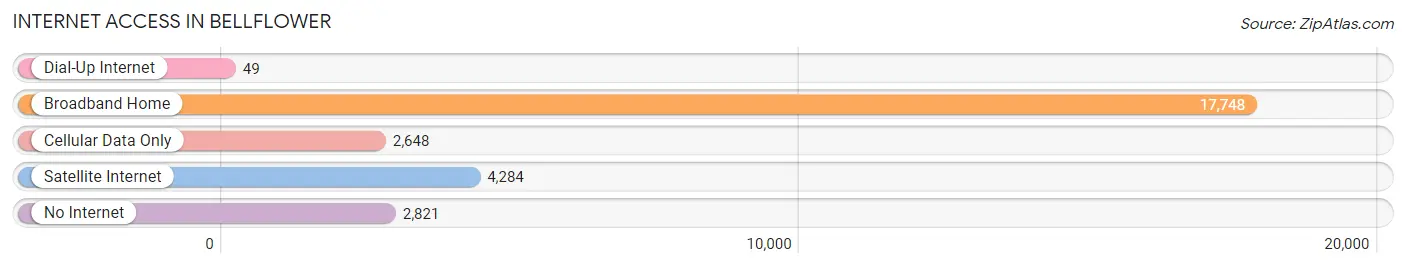
| Internet Type | # Households | % Households |
| Dial-Up Internet | 49 | 0.2% |
| Broadband Home | 17,748 | 73.8% |
| Cellular Data Only | 2,648 | 11.0% |
| Satellite Internet | 4,284 | 17.8% |
| No Internet | 2,821 | 11.7% |
| Total | 24,065 | 100.0% |
Bellflower Summary
Bellflower, California is a city located in Los Angeles County, California. It is situated in the southeastern portion of the county, about 20 miles southeast of downtown Los Angeles. The city has a population of approximately 76,600 people, making it the 53rd most populous city in California.
History
Bellflower was founded in 1906 by John W. Bell, a real estate developer from Iowa. He purchased a large tract of land in the area and began to develop it into a farming community. The city was named after the bell-shaped flowers that grew in abundance in the area.
In the early 1900s, Bellflower was a small farming community, with most of the population being of German and Dutch descent. The city was incorporated in 1957 and has since grown to become a thriving suburban community.
Geography
Bellflower is located in southeastern Los Angeles County, about 20 miles southeast of downtown Los Angeles. The city is situated in the Los Angeles Basin, with the San Gabriel Mountains to the north and the Pacific Ocean to the south. The city covers an area of 5.7 square miles and has a population density of 13,400 people per square mile.
The city is divided into several distinct neighborhoods, including Bellflower, Artesia, Lakewood, and Paramount. The city is bordered by the cities of Downey, Lakewood, Paramount, and Cerritos.
Economy
Bellflower’s economy is largely based on retail and services. The city is home to several large shopping centers, including the Bellflower Towne Center and the Bellflower Plaza. The city is also home to several industrial parks, which provide employment opportunities for many of the city’s residents.
The city is also home to several major employers, including the Los Angeles County Department of Health Services, the Los Angeles County Sheriff’s Department, and the Los Angeles County Fire Department.
Demographics
As of the 2010 census, Bellflower had a population of 76,616 people. The racial makeup of the city was 57.2% White, 11.2% African American, 0.7% Native American, 11.3% Asian, 0.2% Pacific Islander, and 18.2% from other races. Hispanic or Latino of any race were 33.2% of the population.
The median household income in Bellflower was $50,945, and the median family income was $56,945. The per capita income for the city was $20,945. About 15.2% of the population was below the poverty line.
Bellflower is a diverse city with a rich history and a vibrant economy. The city is home to a variety of businesses, industries, and services, providing employment opportunities for many of its residents. The city is also home to a variety of cultural attractions, making it an attractive destination for visitors and residents alike.
Common Questions
What is Per Capita Income in Bellflower?
Per Capita income in Bellflower is $28,918.
What is the Median Family Income in Bellflower?
Median Family Income in Bellflower is $80,445.
What is the Median Household income in Bellflower?
Median Household Income in Bellflower is $75,379.
What is Income or Wage Gap in Bellflower?
Income or Wage Gap in Bellflower is 21.4%.
Women in Bellflower earn 78.6 cents for every dollar earned by a man.
What is Family Income Deficit in Bellflower?
Family Income Deficit in Bellflower is $10,906.
Families that are below poverty line in Bellflower earn $10,906 less on average than the poverty threshold level.
What is Inequality or Gini Index in Bellflower?
Inequality or Gini Index in Bellflower is 0.42.
What is the Total Population of Bellflower?
Total Population of Bellflower is 78,352.
What is the Total Male Population of Bellflower?
Total Male Population of Bellflower is 37,934.
What is the Total Female Population of Bellflower?
Total Female Population of Bellflower is 40,418.
What is the Ratio of Males per 100 Females in Bellflower?
There are 93.85 Males per 100 Females in Bellflower.
What is the Ratio of Females per 100 Males in Bellflower?
There are 106.55 Females per 100 Males in Bellflower.
What is the Median Population Age in Bellflower?
Median Population Age in Bellflower is 35.5 Years.
What is the Average Family Size in Bellflower
Average Family Size in Bellflower is 3.7 People.
What is the Average Household Size in Bellflower
Average Household Size in Bellflower is 3.2 People.
How Large is the Labor Force in Bellflower?
There are 41,164 People in the Labor Forcein in Bellflower.
What is the Percentage of People in the Labor Force in Bellflower?
66.3% of People are in the Labor Force in Bellflower.
What is the Unemployment Rate in Bellflower?
Unemployment Rate in Bellflower is 8.4%.