Cities with the Highest Percentage of Black / African American Population in Massachusetts
RELATED REPORTS & OPTIONS
Black / African American
Massachusetts
Compare Cities
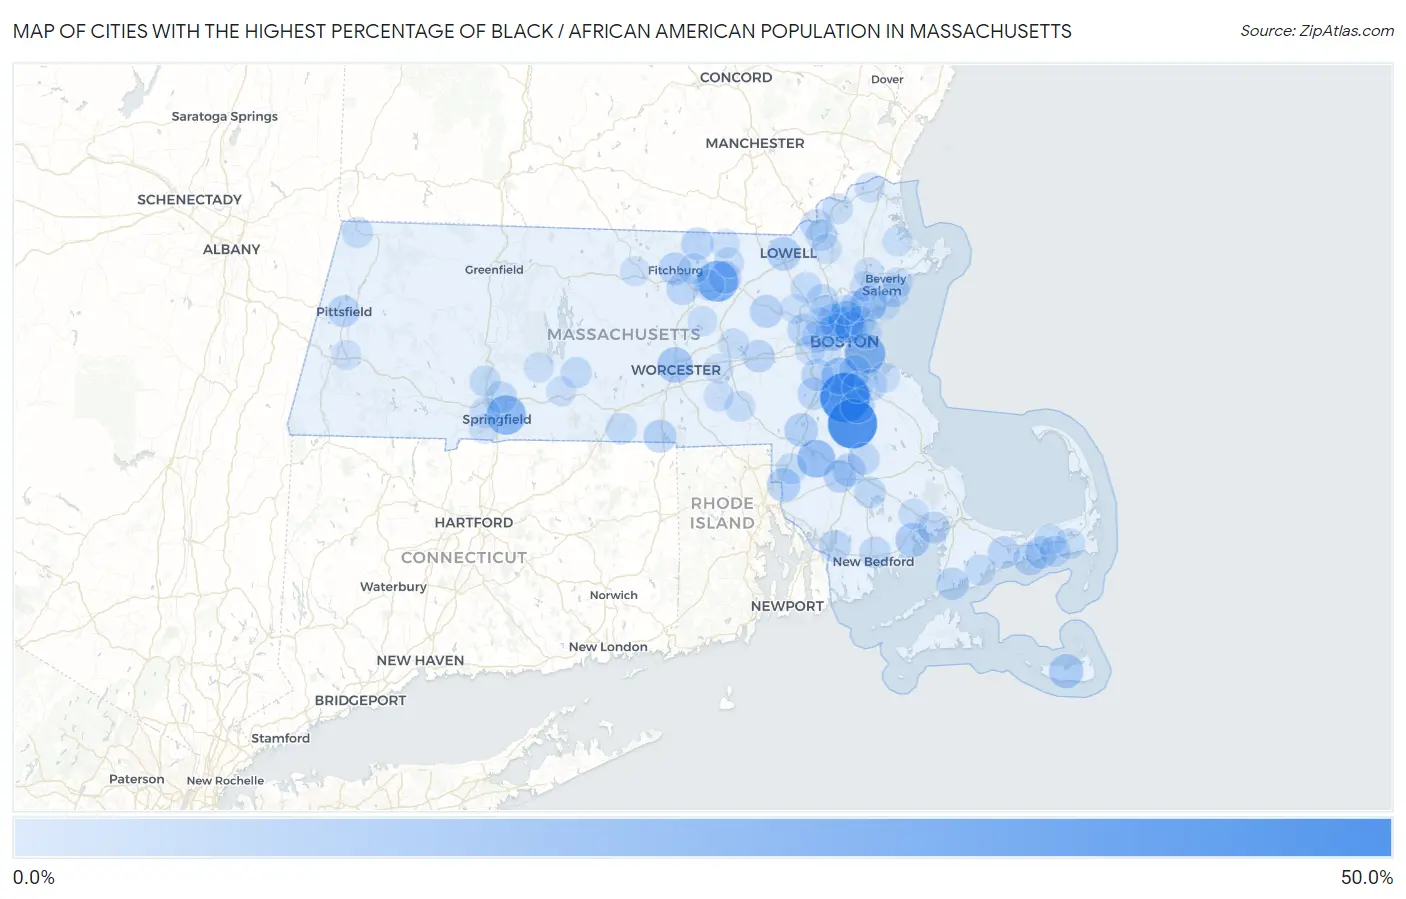
Map of Cities with the Highest Percentage of Black / African American Population in Massachusetts
0.0%
50.0%
Cities with the Highest Percentage of Black / African American Population in Massachusetts
| City | Black / African American | vs State | vs National | |
| 1. | Randolph Town | 40.6% | 7.1%(+33.5)#1 | 12.5%(+28.2)#1,703 |
| 2. | Brockton | 40.3% | 7.1%(+33.2)#2 | 12.5%(+27.8)#1,724 |
| 3. | Devens | 23.7% | 7.1%(+16.6)#3 | 12.5%(+11.2)#2,879 |
| 4. | Boston | 22.5% | 7.1%(+15.4)#4 | 12.5%(+10.1)#3,018 |
| 5. | Springfield | 20.5% | 7.1%(+13.4)#5 | 12.5%(+8.05)#3,243 |
| 6. | Norton Center | 17.4% | 7.1%(+10.2)#6 | 12.5%(+4.89)#3,662 |
| 7. | Milton | 16.1% | 7.1%(+8.97)#7 | 12.5%(+3.64)#3,888 |
| 8. | Everett | 13.7% | 7.1%(+6.57)#8 | 12.5%(+1.24)#4,350 |
| 9. | Lynn | 13.4% | 7.1%(+6.31)#9 | 12.5%(+0.978)#4,409 |
| 10. | Malden | 13.3% | 7.1%(+6.13)#10 | 12.5%(+0.798)#4,454 |
| 11. | Worcester | 12.8% | 7.1%(+5.66)#11 | 12.5%(+0.331)#4,562 |
| 12. | Oak Bluffs | 12.6% | 7.1%(+5.42)#12 | 12.5%(+0.087)#4,612 |
| 13. | Cambridge | 10.8% | 7.1%(+3.63)#13 | 12.5%(-1.70)#5,086 |
| 14. | Nantucket | 10.6% | 7.1%(+3.47)#14 | 12.5%(-1.86)#5,124 |
| 15. | Marion Center | 10.3% | 7.1%(+3.16)#15 | 12.5%(-2.16)#5,221 |
| 16. | Holbrook | 9.9% | 7.1%(+2.75)#16 | 12.5%(-2.58)#5,357 |
| 17. | Lowell | 9.5% | 7.1%(+2.31)#17 | 12.5%(-3.01)#5,489 |
| 18. | North Seekonk | 9.1% | 7.1%(+1.99)#18 | 12.5%(-3.34)#5,595 |
| 19. | Foxborough | 9.1% | 7.1%(+1.97)#19 | 12.5%(-3.36)#5,603 |
| 20. | Webster | 8.0% | 7.1%(+0.882)#20 | 12.5%(-4.45)#6,032 |
| 21. | West Yarmouth | 7.9% | 7.1%(+0.713)#21 | 12.5%(-4.62)#6,115 |
| 22. | Raynham Center | 7.8% | 7.1%(+0.702)#22 | 12.5%(-4.63)#6,121 |
| 23. | Medford | 7.8% | 7.1%(+0.692)#23 | 12.5%(-4.64)#6,128 |
| 24. | West Concord | 7.7% | 7.1%(+0.517)#24 | 12.5%(-4.81)#6,203 |
| 25. | Taunton | 7.5% | 7.1%(+0.372)#25 | 12.5%(-4.96)#6,267 |
| 26. | Ayer | 7.3% | 7.1%(+0.201)#26 | 12.5%(-5.13)#6,350 |
| 27. | Fitchburg | 7.2% | 7.1%(+0.018)#27 | 12.5%(-5.31)#6,433 |
| 28. | Waltham | 7.1% | 7.1%(-0.035)#28 | 12.5%(-5.36)#6,455 |
| 29. | Townsend | 6.9% | 7.1%(-0.245)#29 | 12.5%(-5.57)#6,554 |
| 30. | South Yarmouth | 6.9% | 7.1%(-0.280)#30 | 12.5%(-5.61)#6,579 |
| 31. | Norwood | 6.7% | 7.1%(-0.435)#31 | 12.5%(-5.76)#6,665 |
| 32. | Teaticket | 6.5% | 7.1%(-0.607)#32 | 12.5%(-5.94)#6,753 |
| 33. | Leominster | 6.5% | 7.1%(-0.642)#33 | 12.5%(-5.97)#6,768 |
| 34. | Fall River | 6.4% | 7.1%(-0.702)#34 | 12.5%(-6.03)#6,803 |
| 35. | Quincy | 6.4% | 7.1%(-0.740)#35 | 12.5%(-6.07)#6,822 |
| 36. | Framingham | 6.4% | 7.1%(-0.759)#36 | 12.5%(-6.09)#6,835 |
| 37. | Barnstable Town | 6.3% | 7.1%(-0.872)#37 | 12.5%(-6.20)#6,891 |
| 38. | Chelsea | 6.2% | 7.1%(-0.945)#38 | 12.5%(-6.27)#6,938 |
| 39. | Salem | 6.1% | 7.1%(-1.09)#39 | 12.5%(-6.42)#7,036 |
| 40. | Onset | 6.0% | 7.1%(-1.18)#40 | 12.5%(-6.51)#7,083 |
| 41. | Dedham | 6.0% | 7.1%(-1.19)#41 | 12.5%(-6.51)#7,084 |
| 42. | Pittsfield | 5.9% | 7.1%(-1.21)#42 | 12.5%(-6.54)#7,097 |
| 43. | Chicopee | 5.7% | 7.1%(-1.45)#43 | 12.5%(-6.78)#7,240 |
| 44. | Bridgewater Town | 5.6% | 7.1%(-1.53)#44 | 12.5%(-6.86)#7,299 |
| 45. | Methuen Town | 5.5% | 7.1%(-1.63)#45 | 12.5%(-6.96)#7,360 |
| 46. | New Bedford | 5.5% | 7.1%(-1.64)#46 | 12.5%(-6.97)#7,368 |
| 47. | Weymouth Town | 5.5% | 7.1%(-1.66)#47 | 12.5%(-6.99)#7,377 |
| 48. | North Lakeville | 5.4% | 7.1%(-1.69)#48 | 12.5%(-7.02)#7,397 |
| 49. | South Dennis | 5.2% | 7.1%(-1.98)#49 | 12.5%(-7.31)#7,604 |
| 50. | Lawrence | 5.1% | 7.1%(-1.99)#50 | 12.5%(-7.32)#7,612 |
| 51. | Woburn | 5.1% | 7.1%(-2.03)#51 | 12.5%(-7.36)#7,635 |
| 52. | Southbridge Town | 4.9% | 7.1%(-2.20)#52 | 12.5%(-7.52)#7,739 |
| 53. | Ware | 4.7% | 7.1%(-2.42)#53 | 12.5%(-7.75)#7,916 |
| 54. | Holyoke | 4.6% | 7.1%(-2.54)#54 | 12.5%(-7.87)#8,006 |
| 55. | Amherst | 4.5% | 7.1%(-2.60)#55 | 12.5%(-7.93)#8,059 |
| 56. | Shirley | 4.5% | 7.1%(-2.65)#56 | 12.5%(-7.98)#8,112 |
| 57. | Attleboro | 4.5% | 7.1%(-2.66)#57 | 12.5%(-7.99)#8,118 |
| 58. | Dennis Port | 4.4% | 7.1%(-2.72)#58 | 12.5%(-8.05)#8,179 |
| 59. | Mashpee Neck | 4.3% | 7.1%(-2.81)#59 | 12.5%(-8.14)#8,258 |
| 60. | Lunenburg | 4.2% | 7.1%(-2.95)#60 | 12.5%(-8.28)#8,389 |
| 61. | Pinehurst | 4.2% | 7.1%(-2.99)#61 | 12.5%(-8.32)#8,425 |
| 62. | Somerville | 4.1% | 7.1%(-3.02)#62 | 12.5%(-8.35)#8,465 |
| 63. | Williamstown | 4.0% | 7.1%(-3.10)#63 | 12.5%(-8.42)#8,521 |
| 64. | Revere | 4.0% | 7.1%(-3.17)#64 | 12.5%(-8.50)#8,588 |
| 65. | Watertown Town | 3.9% | 7.1%(-3.21)#65 | 12.5%(-8.54)#8,628 |
| 66. | Winthrop Town | 3.9% | 7.1%(-3.22)#66 | 12.5%(-8.55)#8,637 |
| 67. | Haverhill | 3.8% | 7.1%(-3.31)#67 | 12.5%(-8.64)#8,733 |
| 68. | Milford | 3.8% | 7.1%(-3.38)#68 | 12.5%(-8.71)#8,801 |
| 69. | West Wareham | 3.7% | 7.1%(-3.46)#69 | 12.5%(-8.78)#8,876 |
| 70. | Harwich Center | 3.7% | 7.1%(-3.48)#70 | 12.5%(-8.81)#8,900 |
| 71. | West Warren | 3.6% | 7.1%(-3.51)#71 | 12.5%(-8.84)#8,936 |
| 72. | West Springfield Town | 3.5% | 7.1%(-3.61)#72 | 12.5%(-8.94)#9,039 |
| 73. | Marlborough | 3.4% | 7.1%(-3.72)#73 | 12.5%(-9.04)#9,153 |
| 74. | Braintree Town | 3.3% | 7.1%(-3.80)#74 | 12.5%(-9.13)#9,256 |
| 75. | Saugus | 3.3% | 7.1%(-3.82)#75 | 12.5%(-9.15)#9,285 |
| 76. | Upton | 3.2% | 7.1%(-3.98)#76 | 12.5%(-9.31)#9,487 |
| 77. | Peabody | 3.1% | 7.1%(-4.01)#77 | 12.5%(-9.34)#9,519 |
| 78. | Amesbury Town | 3.1% | 7.1%(-4.03)#78 | 12.5%(-9.36)#9,547 |
| 79. | Groton | 3.1% | 7.1%(-4.08)#79 | 12.5%(-9.41)#9,608 |
| 80. | Beverly | 2.9% | 7.1%(-4.26)#80 | 12.5%(-9.58)#9,846 |
| 81. | Andover | 2.8% | 7.1%(-4.32)#81 | 12.5%(-9.65)#9,917 |
| 82. | Arlington | 2.8% | 7.1%(-4.33)#82 | 12.5%(-9.66)#9,927 |
| 83. | Ipswich | 2.8% | 7.1%(-4.33)#83 | 12.5%(-9.66)#9,932 |
| 84. | Hingham | 2.8% | 7.1%(-4.36)#84 | 12.5%(-9.69)#9,971 |
| 85. | Clinton | 2.7% | 7.1%(-4.41)#85 | 12.5%(-9.74)#10,043 |
| 86. | Newton | 2.7% | 7.1%(-4.44)#86 | 12.5%(-9.77)#10,095 |
| 87. | Melrose | 2.7% | 7.1%(-4.45)#87 | 12.5%(-9.78)#10,108 |
| 88. | Brookline | 2.7% | 7.1%(-4.48)#88 | 12.5%(-9.81)#10,141 |
| 89. | Palmer Town | 2.6% | 7.1%(-4.52)#89 | 12.5%(-9.85)#10,200 |
| 90. | Belchertown | 2.6% | 7.1%(-4.54)#90 | 12.5%(-9.86)#10,233 |
| 91. | Swampscott | 2.5% | 7.1%(-4.64)#91 | 12.5%(-9.96)#10,382 |
| 92. | Hanscom Afb | 2.5% | 7.1%(-4.68)#92 | 12.5%(-10.0)#10,445 |
| 93. | Winchester | 2.4% | 7.1%(-4.70)#93 | 12.5%(-10.0)#10,484 |
| 94. | Greenfield | 2.4% | 7.1%(-4.71)#94 | 12.5%(-10.0)#10,497 |
| 95. | Westborough | 2.4% | 7.1%(-4.72)#95 | 12.5%(-10.1)#10,516 |
| 96. | Danvers | 2.4% | 7.1%(-4.72)#96 | 12.5%(-10.1)#10,522 |
| 97. | Pepperell | 2.4% | 7.1%(-4.74)#97 | 12.5%(-10.1)#10,542 |
| 98. | Agawam Town | 2.4% | 7.1%(-4.75)#98 | 12.5%(-10.1)#10,558 |
| 99. | Lee | 2.4% | 7.1%(-4.75)#99 | 12.5%(-10.1)#10,566 |
| 100. | Gardner | 2.4% | 7.1%(-4.79)#100 | 12.5%(-10.1)#10,644 |
Common Questions
What are the Top 10 Cities with the Highest Percentage of Black / African American Population in Massachusetts?
Top 10 Cities with the Highest Percentage of Black / African American Population in Massachusetts are:
#1
40.6%
#2
40.3%
#3
23.7%
#4
22.5%
#5
20.5%
#6
17.4%
#7
16.1%
#8
13.7%
#9
13.4%
#10
13.3%
What city has the Highest Percentage of Black / African American Population in Massachusetts?
Randolph Town has the Highest Percentage of Black / African American Population in Massachusetts with 40.6%.
What is the Percentage of Black / African American Population in the State of Massachusetts?
Percentage of Black / African American Population in Massachusetts is 7.1%.
What is the Percentage of Black / African American Population in the United States?
Percentage of Black / African American Population in the United States is 12.5%.