Cities with the Highest Percentage of Black / African American Population in Illinois
RELATED REPORTS & OPTIONS
Black / African American
Illinois
Compare Cities
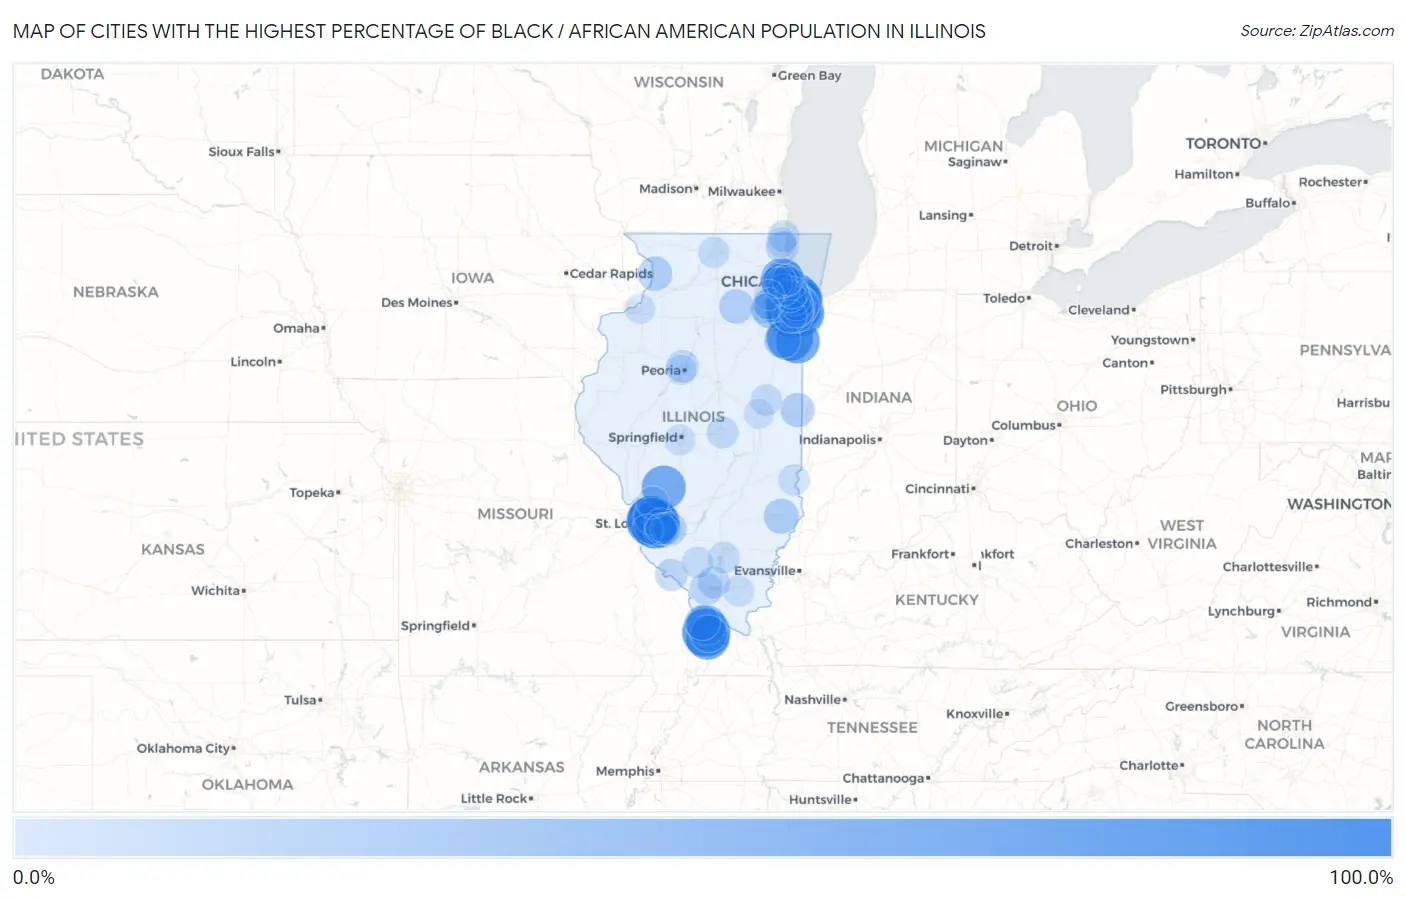
Map of Cities with the Highest Percentage of Black / African American Population in Illinois
0.0%
100.0%
Cities with the Highest Percentage of Black / African American Population in Illinois
| City | Black / African American | vs State | vs National | |
| 1. | Unity | 100.0% | 13.9%(+86.1)#1 | 12.5%(+87.5)#37 |
| 2. | Brooklyn | 95.9% | 13.9%(+82.0)#2 | 12.5%(+83.4)#104 |
| 3. | East St Louis | 94.6% | 13.9%(+80.6)#3 | 12.5%(+82.1)#119 |
| 4. | Ford Heights | 93.0% | 13.9%(+79.1)#4 | 12.5%(+80.5)#137 |
| 5. | Dolton | 91.2% | 13.9%(+77.3)#5 | 12.5%(+78.7)#164 |
| 6. | Richton Park | 90.4% | 13.9%(+76.5)#6 | 12.5%(+77.9)#178 |
| 7. | Mounds | 90.0% | 13.9%(+76.1)#7 | 12.5%(+77.5)#186 |
| 8. | Venice | 89.5% | 13.9%(+75.6)#8 | 12.5%(+77.0)#195 |
| 9. | Country Club Hills | 88.8% | 13.9%(+74.9)#9 | 12.5%(+76.4)#206 |
| 10. | Robbins | 88.0% | 13.9%(+74.1)#10 | 12.5%(+75.5)#222 |
| 11. | Riverdale | 87.6% | 13.9%(+73.7)#11 | 12.5%(+75.1)#227 |
| 12. | Calumet Park | 86.7% | 13.9%(+72.8)#12 | 12.5%(+74.2)#246 |
| 13. | Hazel Crest | 86.6% | 13.9%(+72.7)#13 | 12.5%(+74.1)#249 |
| 14. | University Park | 85.6% | 13.9%(+71.7)#14 | 12.5%(+73.1)#267 |
| 15. | Harding | 85.5% | 13.9%(+71.5)#15 | 12.5%(+73.0)#270 |
| 16. | Sun River Terrace | 83.5% | 13.9%(+69.6)#16 | 12.5%(+71.1)#314 |
| 17. | Washington Park | 81.2% | 13.9%(+67.3)#17 | 12.5%(+68.7)#364 |
| 18. | Matteson | 80.4% | 13.9%(+66.5)#18 | 12.5%(+67.9)#381 |
| 19. | South Holland | 80.3% | 13.9%(+66.4)#19 | 12.5%(+67.8)#384 |
| 20. | Willowbrook | 80.0% | 13.9%(+66.1)#20 | 12.5%(+67.5)#393 |
| 21. | Olympia Fields | 79.2% | 13.9%(+65.3)#21 | 12.5%(+66.7)#416 |
| 22. | Hopkins Park | 75.2% | 13.9%(+61.3)#22 | 12.5%(+62.8)#493 |
| 23. | Cahokia Heights | 75.1% | 13.9%(+61.2)#23 | 12.5%(+62.6)#497 |
| 24. | Plum Valley | 74.8% | 13.9%(+60.9)#24 | 12.5%(+62.3)#499 |
| 25. | Cairo | 73.9% | 13.9%(+60.0)#25 | 12.5%(+61.4)#526 |
| 26. | Markham | 73.6% | 13.9%(+59.6)#26 | 12.5%(+61.1)#540 |
| 27. | Phoenix | 73.6% | 13.9%(+59.6)#27 | 12.5%(+61.1)#541 |
| 28. | Royal Lakes | 73.3% | 13.9%(+59.3)#28 | 12.5%(+60.8)#547 |
| 29. | Bellwood | 71.9% | 13.9%(+58.0)#29 | 12.5%(+59.4)#573 |
| 30. | Calumet City | 71.5% | 13.9%(+57.6)#30 | 12.5%(+59.0)#586 |
| 31. | Park Forest | 71.3% | 13.9%(+57.4)#31 | 12.5%(+58.8)#589 |
| 32. | Lynwood | 70.6% | 13.9%(+56.7)#32 | 12.5%(+58.1)#604 |
| 33. | Broadview | 68.6% | 13.9%(+54.7)#33 | 12.5%(+56.2)#657 |
| 34. | Sauk Village | 67.1% | 13.9%(+53.2)#34 | 12.5%(+54.6)#683 |
| 35. | Burnham | 65.4% | 13.9%(+51.5)#35 | 12.5%(+52.9)#724 |
| 36. | Glenwood | 64.1% | 13.9%(+50.2)#36 | 12.5%(+51.6)#767 |
| 37. | Flossmoor | 63.4% | 13.9%(+49.5)#37 | 12.5%(+50.9)#795 |
| 38. | East Hazel Crest | 60.6% | 13.9%(+46.7)#38 | 12.5%(+48.2)#876 |
| 39. | Maywood | 60.6% | 13.9%(+46.7)#39 | 12.5%(+48.1)#877 |
| 40. | Harvey | 59.0% | 13.9%(+45.0)#40 | 12.5%(+46.5)#926 |
| 41. | Pulaski | 55.7% | 13.9%(+41.8)#41 | 12.5%(+43.2)#1,043 |
| 42. | Homewood | 50.1% | 13.9%(+36.1)#42 | 12.5%(+37.6)#1,250 |
| 43. | Hillside | 49.9% | 13.9%(+36.0)#43 | 12.5%(+37.5)#1,258 |
| 44. | Lansing | 47.6% | 13.9%(+33.7)#44 | 12.5%(+35.1)#1,341 |
| 45. | Madison | 46.4% | 13.9%(+32.5)#45 | 12.5%(+34.0)#1,407 |
| 46. | Mound City | 43.2% | 13.9%(+29.3)#46 | 12.5%(+30.8)#1,564 |
| 47. | Preston Heights | 42.7% | 13.9%(+28.8)#47 | 12.5%(+30.2)#1,594 |
| 48. | Kankakee | 41.2% | 13.9%(+27.3)#48 | 12.5%(+28.7)#1,668 |
| 49. | Chicago Heights | 40.2% | 13.9%(+26.3)#49 | 12.5%(+27.8)#1,727 |
| 50. | Tamms | 37.0% | 13.9%(+23.1)#50 | 12.5%(+24.5)#1,906 |
| 51. | Sumner | 36.8% | 13.9%(+22.9)#51 | 12.5%(+24.4)#1,917 |
| 52. | Lake | 35.9% | 13.9%(+22.0)#52 | 12.5%(+23.4)#1,981 |
| 53. | Crete | 35.3% | 13.9%(+21.4)#53 | 12.5%(+22.8)#2,016 |
| 54. | Thomson | 35.0% | 13.9%(+21.1)#54 | 12.5%(+22.6)#2,031 |
| 55. | Sheridan | 34.2% | 13.9%(+20.3)#55 | 12.5%(+21.8)#2,073 |
| 56. | Blue Island | 33.6% | 13.9%(+19.6)#56 | 12.5%(+21.1)#2,111 |
| 57. | Dixmoor | 33.5% | 13.9%(+19.6)#57 | 12.5%(+21.0)#2,113 |
| 58. | Fairmont | 33.2% | 13.9%(+19.3)#58 | 12.5%(+20.7)#2,136 |
| 59. | Danville | 33.1% | 13.9%(+19.2)#59 | 12.5%(+20.6)#2,145 |
| 60. | Belleville | 30.6% | 13.9%(+16.7)#60 | 12.5%(+18.1)#2,320 |
| 61. | Fairview Heights | 30.3% | 13.9%(+16.4)#61 | 12.5%(+17.8)#2,341 |
| 62. | Scott Afb | 30.3% | 13.9%(+16.3)#62 | 12.5%(+17.8)#2,343 |
| 63. | South Chicago Heights | 29.1% | 13.9%(+15.2)#63 | 12.5%(+16.7)#2,422 |
| 64. | Thornton | 28.9% | 13.9%(+15.0)#64 | 12.5%(+16.4)#2,436 |
| 65. | Chicago | 28.8% | 13.9%(+14.9)#65 | 12.5%(+16.3)#2,445 |
| 66. | Monee | 28.0% | 13.9%(+14.1)#66 | 12.5%(+15.6)#2,505 |
| 67. | Carbondale | 27.5% | 13.9%(+13.6)#67 | 12.5%(+15.0)#2,537 |
| 68. | Peoria | 26.4% | 13.9%(+12.5)#68 | 12.5%(+14.0)#2,616 |
| 69. | Colp | 26.1% | 13.9%(+12.2)#69 | 12.5%(+13.6)#2,649 |
| 70. | Chester | 25.9% | 13.9%(+12.0)#70 | 12.5%(+13.4)#2,668 |
| 71. | North Chicago | 25.6% | 13.9%(+11.7)#71 | 12.5%(+13.1)#2,701 |
| 72. | Forest Park | 25.3% | 13.9%(+11.3)#72 | 12.5%(+12.8)#2,743 |
| 73. | Berkeley | 25.0% | 13.9%(+11.1)#73 | 12.5%(+12.6)#2,759 |
| 74. | Alton | 24.7% | 13.9%(+10.8)#74 | 12.5%(+12.3)#2,790 |
| 75. | Decatur | 24.0% | 13.9%(+10.1)#75 | 12.5%(+11.6)#2,851 |
| 76. | Zion | 23.7% | 13.9%(+9.77)#76 | 12.5%(+11.2)#2,883 |
| 77. | Alsip | 23.1% | 13.9%(+9.23)#77 | 12.5%(+10.7)#2,949 |
| 78. | Evergreen Park | 23.1% | 13.9%(+9.16)#78 | 12.5%(+10.6)#2,958 |
| 79. | Rantoul | 22.8% | 13.9%(+8.92)#79 | 12.5%(+10.4)#2,985 |
| 80. | Ina | 22.8% | 13.9%(+8.89)#80 | 12.5%(+10.3)#2,990 |
| 81. | Pinckneyville | 22.4% | 13.9%(+8.46)#81 | 12.5%(+9.90)#3,038 |
| 82. | Rockford | 22.0% | 13.9%(+8.04)#82 | 12.5%(+9.48)#3,076 |
| 83. | Shiloh | 21.9% | 13.9%(+7.97)#83 | 12.5%(+9.41)#3,086 |
| 84. | West Union | 21.8% | 13.9%(+7.92)#84 | 12.5%(+9.36)#3,091 |
| 85. | Crest Hill | 21.8% | 13.9%(+7.88)#85 | 12.5%(+9.32)#3,096 |
| 86. | Justice | 21.6% | 13.9%(+7.73)#86 | 12.5%(+9.17)#3,107 |
| 87. | East Carondelet | 21.0% | 13.9%(+7.06)#87 | 12.5%(+8.50)#3,185 |
| 88. | Oakbrook Terrace | 20.9% | 13.9%(+6.98)#88 | 12.5%(+8.42)#3,198 |
| 89. | Swansea | 20.6% | 13.9%(+6.67)#89 | 12.5%(+8.11)#3,237 |
| 90. | Springfield | 20.3% | 13.9%(+6.36)#90 | 12.5%(+7.80)#3,272 |
| 91. | Carrier Mills | 20.2% | 13.9%(+6.33)#91 | 12.5%(+7.77)#3,277 |
| 92. | Westchester | 19.4% | 13.9%(+5.52)#92 | 12.5%(+6.96)#3,371 |
| 93. | Oak Park | 19.0% | 13.9%(+5.12)#93 | 12.5%(+6.56)#3,420 |
| 94. | East Moline | 18.4% | 13.9%(+4.45)#94 | 12.5%(+5.89)#3,521 |
| 95. | West Peoria | 18.4% | 13.9%(+4.45)#95 | 12.5%(+5.89)#3,522 |
| 96. | Waukegan | 18.2% | 13.9%(+4.25)#96 | 12.5%(+5.69)#3,559 |
| 97. | Bolingbrook | 17.9% | 13.9%(+3.98)#97 | 12.5%(+5.42)#3,595 |
| 98. | Ridgewood | 17.6% | 13.9%(+3.64)#98 | 12.5%(+5.08)#3,643 |
| 99. | Champaign | 17.2% | 13.9%(+3.29)#99 | 12.5%(+4.73)#3,692 |
| 100. | Joliet | 17.1% | 13.9%(+3.24)#100 | 12.5%(+4.68)#3,704 |
Common Questions
What are the Top 10 Cities with the Highest Percentage of Black / African American Population in Illinois?
Top 10 Cities with the Highest Percentage of Black / African American Population in Illinois are:
#1
95.9%
#2
94.6%
#3
93.0%
#4
91.2%
#5
90.4%
#6
90.0%
#7
89.5%
#8
88.8%
#9
88.0%
#10
87.6%
What city has the Highest Percentage of Black / African American Population in Illinois?
Brooklyn has the Highest Percentage of Black / African American Population in Illinois with 95.9%.
What is the Percentage of Black / African American Population in the State of Illinois?
Percentage of Black / African American Population in Illinois is 13.9%.
What is the Percentage of Black / African American Population in the United States?
Percentage of Black / African American Population in the United States is 12.5%.