Zip Codes with the Highest Percentage of Black / African American Population in San Jose, CA
RELATED REPORTS & OPTIONS
Black / African American
San Jose
Compare Zip Codes
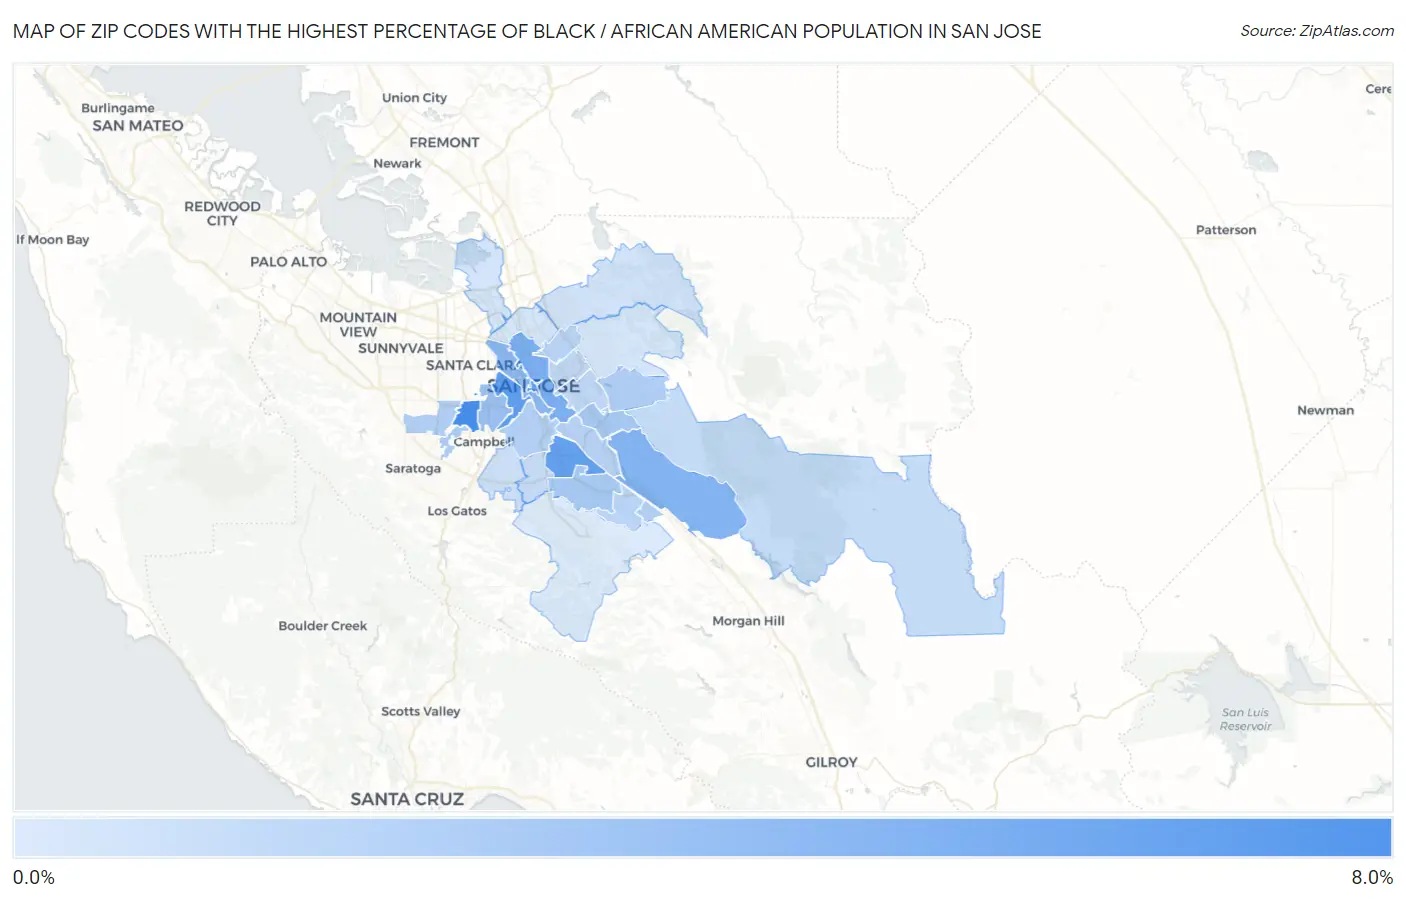
Map of Zip Codes with the Highest Percentage of Black / African American Population in San Jose
1.1%
6.8%
Zip Codes with the Highest Percentage of Black / African American Population in San Jose, CA
| Zip Code | Black / African American | vs State | vs National | |
| 1. | 95117 | 6.8% | 5.6%(+1.22)#320 | 12.5%(-5.65)#8,206 |
| 2. | 95126 | 5.8% | 5.6%(+0.201)#376 | 12.5%(-6.67)#8,892 |
| 3. | 95113 | 5.7% | 5.6%(+0.095)#387 | 12.5%(-6.78)#8,979 |
| 4. | 95136 | 5.7% | 5.6%(+0.091)#388 | 12.5%(-6.78)#8,982 |
| 5. | 95112 | 4.8% | 5.6%(-0.816)#456 | 12.5%(-7.69)#9,749 |
| 6. | 95138 | 4.5% | 5.6%(-1.08)#476 | 12.5%(-7.95)#10,004 |
| 7. | 95110 | 4.1% | 5.6%(-1.52)#525 | 12.5%(-8.39)#10,419 |
| 8. | 95128 | 3.6% | 5.6%(-1.99)#573 | 12.5%(-8.86)#10,925 |
| 9. | 95121 | 3.1% | 5.6%(-2.50)#636 | 12.5%(-9.37)#11,662 |
| 10. | 95123 | 3.1% | 5.6%(-2.51)#639 | 12.5%(-9.38)#11,679 |
| 11. | 95130 | 2.8% | 5.6%(-2.82)#683 | 12.5%(-9.69)#12,150 |
| 12. | 95148 | 2.7% | 5.6%(-2.87)#693 | 12.5%(-9.75)#12,257 |
| 13. | 95129 | 2.7% | 5.6%(-2.94)#703 | 12.5%(-9.81)#12,370 |
| 14. | 95139 | 2.6% | 5.6%(-2.98)#711 | 12.5%(-9.86)#12,431 |
| 15. | 95125 | 2.6% | 5.6%(-3.03)#717 | 12.5%(-9.90)#12,490 |
| 16. | 95111 | 2.5% | 5.6%(-3.06)#726 | 12.5%(-9.94)#12,555 |
| 17. | 95119 | 2.4% | 5.6%(-3.16)#742 | 12.5%(-10.0)#12,718 |
| 18. | 95133 | 2.4% | 5.6%(-3.18)#748 | 12.5%(-10.1)#12,761 |
| 19. | 95116 | 2.2% | 5.6%(-3.43)#794 | 12.5%(-10.3)#13,208 |
| 20. | 95122 | 2.1% | 5.6%(-3.47)#806 | 12.5%(-10.3)#13,286 |
| 21. | 95135 | 2.0% | 5.6%(-3.61)#837 | 12.5%(-10.5)#13,613 |
| 22. | 95118 | 1.9% | 5.6%(-3.71)#868 | 12.5%(-10.6)#13,855 |
| 23. | 95124 | 1.6% | 5.6%(-3.97)#915 | 12.5%(-10.8)#14,469 |
| 24. | 95132 | 1.6% | 5.6%(-4.04)#933 | 12.5%(-10.9)#14,659 |
| 25. | 95134 | 1.5% | 5.6%(-4.09)#943 | 12.5%(-11.0)#14,803 |
| 26. | 95127 | 1.4% | 5.6%(-4.23)#979 | 12.5%(-11.1)#15,238 |
| 27. | 95131 | 1.3% | 5.6%(-4.25)#983 | 12.5%(-11.1)#15,283 |
| 28. | 95120 | 1.1% | 5.6%(-4.47)#1,037 | 12.5%(-11.3)#16,021 |
1
Common Questions
What are the Top 10 Zip Codes with the Highest Percentage of Black / African American Population in San Jose, CA?
Top 10 Zip Codes with the Highest Percentage of Black / African American Population in San Jose, CA are:
What zip code has the Highest Percentage of Black / African American Population in San Jose, CA?
95117 has the Highest Percentage of Black / African American Population in San Jose, CA with 6.8%.
What is the Percentage of Black / African American Population in San Jose, CA?
Percentage of Black / African American Population in San Jose is 2.9%.
What is the Percentage of Black / African American Population in California?
Percentage of Black / African American Population in California is 5.6%.
What is the Percentage of Black / African American Population in the United States?
Percentage of Black / African American Population in the United States is 12.5%.