San Bernardino, CA Map & Demographics
San Bernardino Map
San Bernardino Overview
$22,865
PER CAPITA INCOME
$66,810
AVG FAMILY INCOME
$61,323
AVG HOUSEHOLD INCOME
24.0%
WAGE / INCOME GAP [ % ]
76.0¢/ $1
WAGE / INCOME GAP [ $ ]
$12,956
FAMILY INCOME DEFICIT
0.43
INEQUALITY / GINI INDEX
221,041
TOTAL POPULATION
110,953
MALE POPULATION
110,088
FEMALE POPULATION
100.79
MALES / 100 FEMALES
99.22
FEMALES / 100 MALES
31.2
MEDIAN AGE
3.9
AVG FAMILY SIZE
3.4
AVG HOUSEHOLD SIZE
101,671
LABOR FORCE [ PEOPLE ]
60.9%
PERCENT IN LABOR FORCE
7.6%
UNEMPLOYMENT RATE
Income in San Bernardino
Income Overview in San Bernardino
Per Capita Income in San Bernardino is $22,865, while median incomes of families and households are $66,810 and $61,323 respectively.
| Characteristic | Number | Measure |
| Per Capita Income | 221,041 | $22,865 |
| Median Family Income | 46,234 | $66,810 |
| Mean Family Income | 46,234 | $79,834 |
| Median Household Income | 62,486 | $61,323 |
| Mean Household Income | 62,486 | $76,725 |
| Income Deficit | 46,234 | $12,956 |
| Wage / Income Gap (%) | 221,041 | 24.02% |
| Wage / Income Gap ($) | 221,041 | 75.98¢ per $1 |
| Gini / Inequality Index | 221,041 | 0.43 |
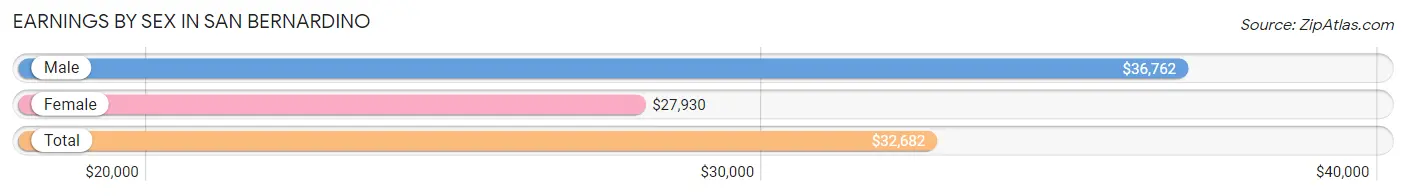
Earnings by Sex in San Bernardino
Average Earnings in San Bernardino are $32,682, $36,762 for men and $27,930 for women, a difference of 24.0%.
| Sex | Number | Average Earnings |
| Male | 56,971 (55.2%) | $36,762 |
| Female | 46,316 (44.8%) | $27,930 |
| Total | 103,287 (100.0%) | $32,682 |
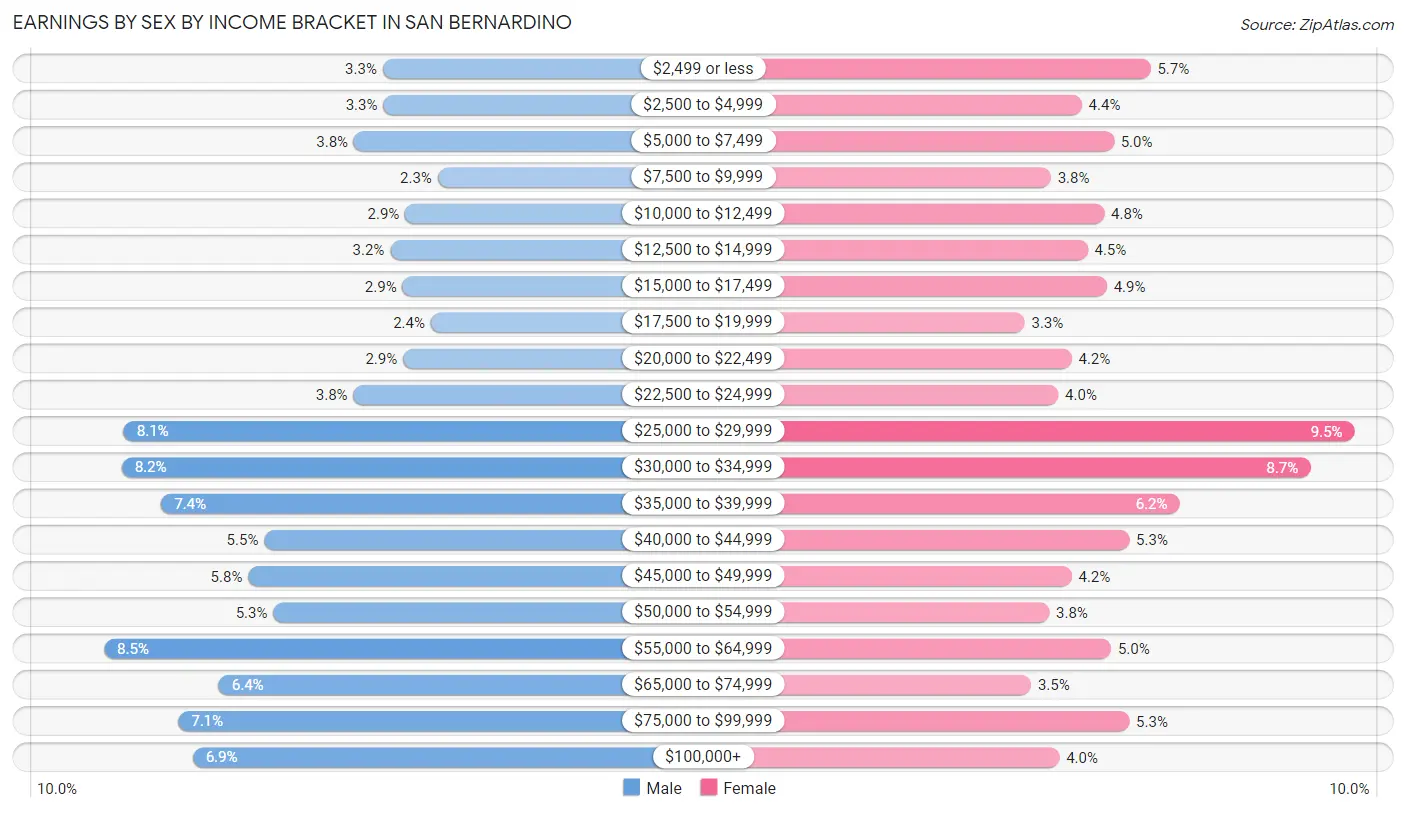
Earnings by Sex by Income Bracket in San Bernardino
The most common earnings brackets in San Bernardino are $55,000 to $64,999 for men (4,846 | 8.5%) and $25,000 to $29,999 for women (4,403 | 9.5%).
| Income | Male | Female |
| $2,499 or less | 1,875 (3.3%) | 2,635 (5.7%) |
| $2,500 to $4,999 | 1,869 (3.3%) | 2,039 (4.4%) |
| $5,000 to $7,499 | 2,184 (3.8%) | 2,316 (5.0%) |
| $7,500 to $9,999 | 1,287 (2.3%) | 1,769 (3.8%) |
| $10,000 to $12,499 | 1,634 (2.9%) | 2,234 (4.8%) |
| $12,500 to $14,999 | 1,793 (3.2%) | 2,090 (4.5%) |
| $15,000 to $17,499 | 1,664 (2.9%) | 2,256 (4.9%) |
| $17,500 to $19,999 | 1,361 (2.4%) | 1,541 (3.3%) |
| $20,000 to $22,499 | 1,656 (2.9%) | 1,951 (4.2%) |
| $22,500 to $24,999 | 2,185 (3.8%) | 1,834 (4.0%) |
| $25,000 to $29,999 | 4,640 (8.1%) | 4,403 (9.5%) |
| $30,000 to $34,999 | 4,661 (8.2%) | 4,022 (8.7%) |
| $35,000 to $39,999 | 4,239 (7.4%) | 2,885 (6.2%) |
| $40,000 to $44,999 | 3,141 (5.5%) | 2,450 (5.3%) |
| $45,000 to $49,999 | 3,312 (5.8%) | 1,950 (4.2%) |
| $50,000 to $54,999 | 3,041 (5.3%) | 1,754 (3.8%) |
| $55,000 to $64,999 | 4,846 (8.5%) | 2,294 (5.0%) |
| $65,000 to $74,999 | 3,622 (6.4%) | 1,600 (3.5%) |
| $75,000 to $99,999 | 4,059 (7.1%) | 2,450 (5.3%) |
| $100,000+ | 3,902 (6.9%) | 1,843 (4.0%) |
| Total | 56,971 (100.0%) | 46,316 (100.0%) |
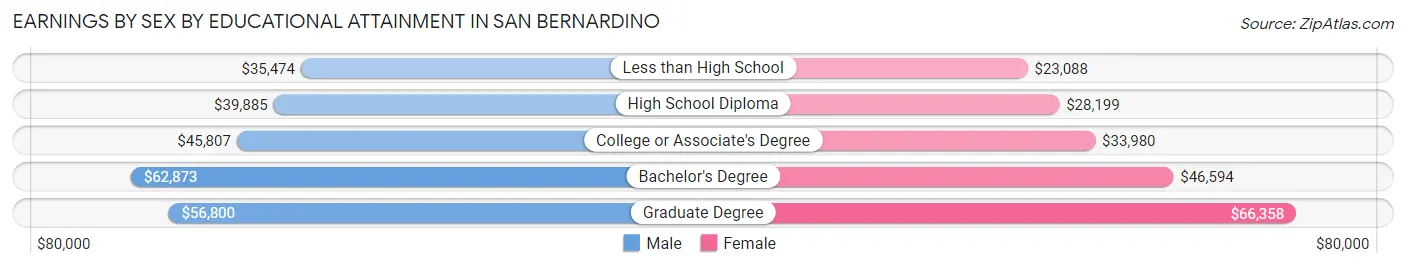
Earnings by Sex by Educational Attainment in San Bernardino
Average earnings in San Bernardino are $41,354 for men and $31,395 for women, a difference of 24.1%. Men with an educational attainment of bachelor's degree enjoy the highest average annual earnings of $62,873, while those with less than high school education earn the least with $35,474. Women with an educational attainment of graduate degree earn the most with the average annual earnings of $66,358, while those with less than high school education have the smallest earnings of $23,088.
| Educational Attainment | Male Income | Female Income |
| Less than High School | $35,474 | $23,088 |
| High School Diploma | $39,885 | $28,199 |
| College or Associate's Degree | $45,807 | $33,980 |
| Bachelor's Degree | $62,873 | $46,594 |
| Graduate Degree | $56,800 | $66,358 |
| Total | $41,354 | $31,395 |
Family Income in San Bernardino
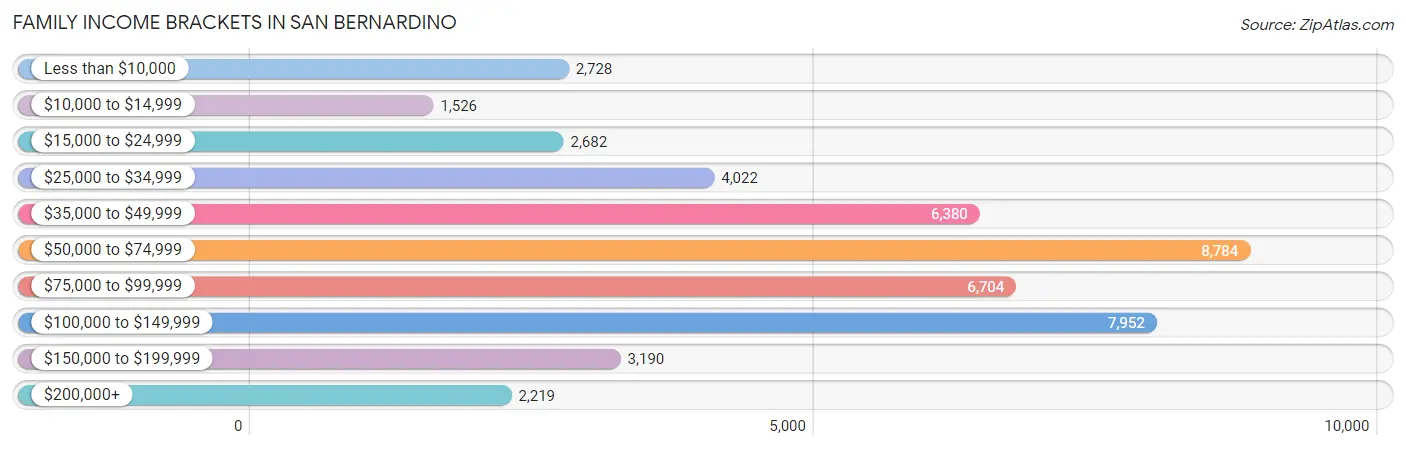
Family Income Brackets in San Bernardino
According to the San Bernardino family income data, there are 8,784 families falling into the $50,000 to $74,999 income range, which is the most common income bracket and makes up 19.0% of all families. Conversely, the $10,000 to $14,999 income bracket is the least frequent group with only 1,526 families (3.3%) belonging to this category.
| Income Bracket | # Families | % Families |
| Less than $10,000 | 2,728 | 5.9% |
| $10,000 to $14,999 | 1,526 | 3.3% |
| $15,000 to $24,999 | 2,682 | 5.8% |
| $25,000 to $34,999 | 4,022 | 8.7% |
| $35,000 to $49,999 | 6,380 | 13.8% |
| $50,000 to $74,999 | 8,784 | 19.0% |
| $75,000 to $99,999 | 6,704 | 14.5% |
| $100,000 to $149,999 | 7,952 | 17.2% |
| $150,000 to $199,999 | 3,190 | 6.9% |
| $200,000+ | 2,219 | 4.8% |
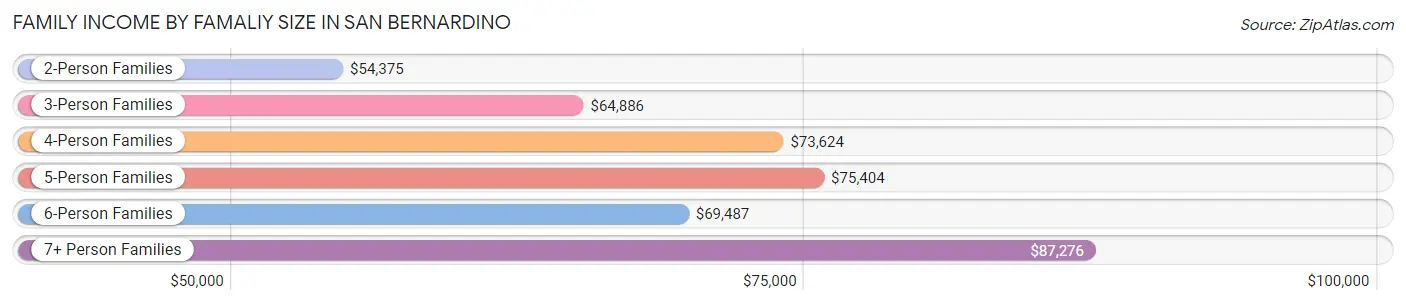
Family Income by Famaliy Size in San Bernardino
7+ person families (2,461 | 5.3%) account for the highest median family income in San Bernardino with $87,276 per family, while 2-person families (12,585 | 27.2%) have the highest median income of $27,188 per family member.
| Income Bracket | # Families | Median Income |
| 2-Person Families | 12,585 (27.2%) | $54,375 |
| 3-Person Families | 10,379 (22.5%) | $64,886 |
| 4-Person Families | 11,097 (24.0%) | $73,624 |
| 5-Person Families | 6,683 (14.4%) | $75,404 |
| 6-Person Families | 3,029 (6.6%) | $69,487 |
| 7+ Person Families | 2,461 (5.3%) | $87,276 |
| Total | 46,234 (100.0%) | $66,810 |
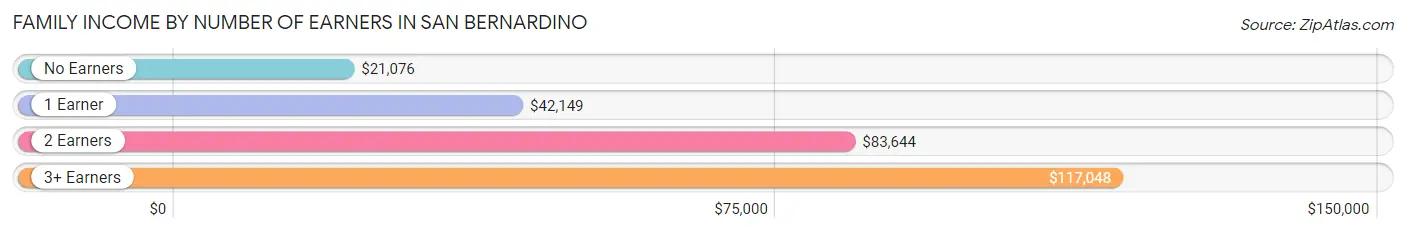
Family Income by Number of Earners in San Bernardino
The median family income in San Bernardino is $66,810, with families comprising 3+ earners (8,679) having the highest median family income of $117,048, while families with no earners (5,774) have the lowest median family income of $21,076, accounting for 18.8% and 12.5% of families, respectively.
| Number of Earners | # Families | Median Income |
| No Earners | 5,774 (12.5%) | $21,076 |
| 1 Earner | 16,058 (34.7%) | $42,149 |
| 2 Earners | 15,723 (34.0%) | $83,644 |
| 3+ Earners | 8,679 (18.8%) | $117,048 |
| Total | 46,234 (100.0%) | $66,810 |
Household Income in San Bernardino
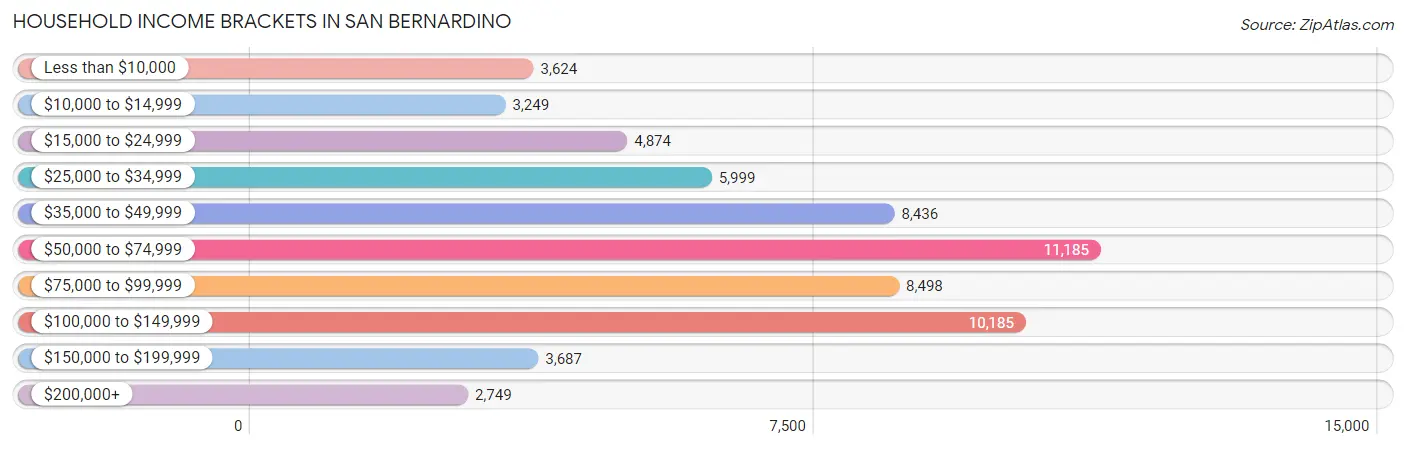
Household Income Brackets in San Bernardino
With 11,185 households falling in the category, the $50,000 to $74,999 income range is the most frequent in San Bernardino, accounting for 17.9% of all households. In contrast, only 2,749 households (4.4%) fall into the $200,000+ income bracket, making it the least populous group.
| Income Bracket | # Households | % Households |
| Less than $10,000 | 3,624 | 5.8% |
| $10,000 to $14,999 | 3,249 | 5.2% |
| $15,000 to $24,999 | 4,874 | 7.8% |
| $25,000 to $34,999 | 5,999 | 9.6% |
| $35,000 to $49,999 | 8,436 | 13.5% |
| $50,000 to $74,999 | 11,185 | 17.9% |
| $75,000 to $99,999 | 8,498 | 13.6% |
| $100,000 to $149,999 | 10,185 | 16.3% |
| $150,000 to $199,999 | 3,687 | 5.9% |
| $200,000+ | 2,749 | 4.4% |
Household Income by Householder Age in San Bernardino
The median household income in San Bernardino is $61,323, with the highest median household income of $75,677 found in the 45 to 64 years age bracket for the primary householder. A total of 22,811 households (36.5%) fall into this category. Meanwhile, the 65+ years age bracket for the primary householder has the lowest median household income of $36,828, with 11,650 households (18.6%) in this group.
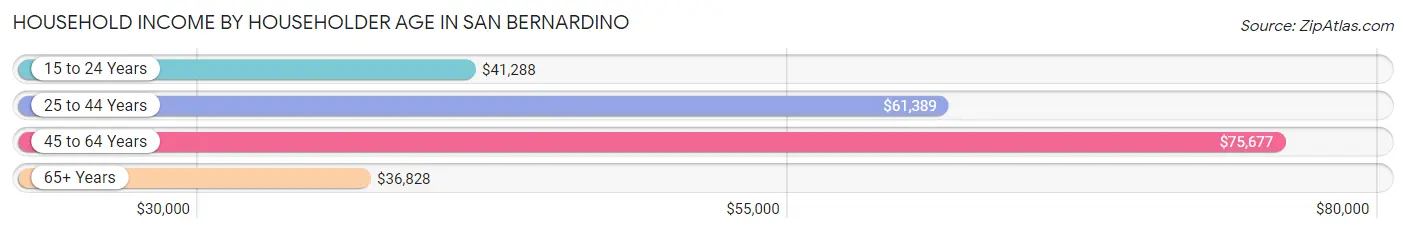
| Income Bracket | # Households | Median Income |
| 15 to 24 Years | 2,293 (3.7%) | $41,288 |
| 25 to 44 Years | 25,732 (41.2%) | $61,389 |
| 45 to 64 Years | 22,811 (36.5%) | $75,677 |
| 65+ Years | 11,650 (18.6%) | $36,828 |
| Total | 62,486 (100.0%) | $61,323 |
Poverty in San Bernardino
Income Below Poverty by Sex and Age in San Bernardino
With 17.5% poverty level for males and 22.8% for females among the residents of San Bernardino, 5 year old males and 5 year old females are the most vulnerable to poverty, with 626 males (32.6%) and 552 females (35.2%) in their respective age groups living below the poverty level.
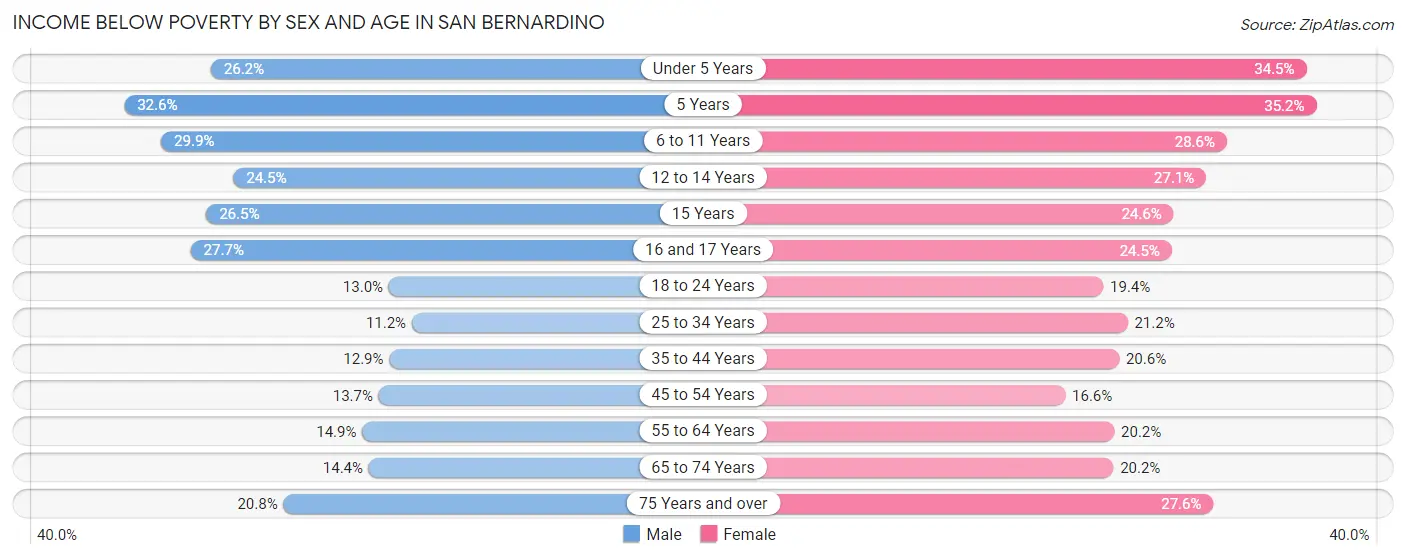
| Age Bracket | Male | Female |
| Under 5 Years | 1,858 (26.2%) | 2,640 (34.5%) |
| 5 Years | 626 (32.6%) | 552 (35.2%) |
| 6 to 11 Years | 3,012 (29.9%) | 2,902 (28.6%) |
| 12 to 14 Years | 1,356 (24.5%) | 1,362 (27.1%) |
| 15 Years | 581 (26.5%) | 379 (24.6%) |
| 16 and 17 Years | 1,040 (27.7%) | 905 (24.5%) |
| 18 to 24 Years | 1,608 (13.0%) | 2,367 (19.4%) |
| 25 to 34 Years | 2,007 (11.2%) | 3,650 (21.2%) |
| 35 to 44 Years | 1,823 (12.9%) | 2,767 (20.6%) |
| 45 to 54 Years | 1,713 (13.7%) | 1,963 (16.6%) |
| 55 to 64 Years | 1,381 (14.9%) | 2,142 (20.2%) |
| 65 to 74 Years | 820 (14.4%) | 1,475 (20.2%) |
| 75 Years and over | 610 (20.8%) | 1,323 (27.6%) |
| Total | 18,435 (17.5%) | 24,427 (22.8%) |
Income Above Poverty by Sex and Age in San Bernardino
According to the poverty statistics in San Bernardino, males aged 25 to 34 years and females aged 45 to 54 years are the age groups that are most secure financially, with 88.8% of males and 83.4% of females in these age groups living above the poverty line.
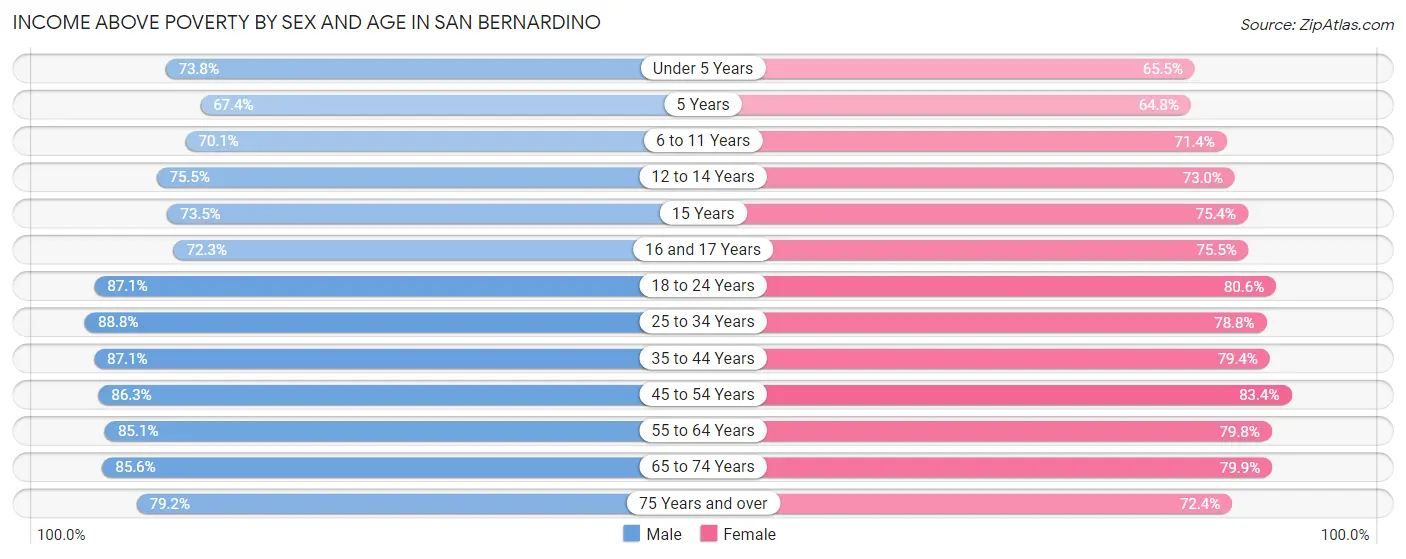
| Age Bracket | Male | Female |
| Under 5 Years | 5,243 (73.8%) | 5,014 (65.5%) |
| 5 Years | 1,294 (67.4%) | 1,015 (64.8%) |
| 6 to 11 Years | 7,074 (70.1%) | 7,253 (71.4%) |
| 12 to 14 Years | 4,178 (75.5%) | 3,673 (73.0%) |
| 15 Years | 1,611 (73.5%) | 1,159 (75.4%) |
| 16 and 17 Years | 2,719 (72.3%) | 2,790 (75.5%) |
| 18 to 24 Years | 10,810 (87.1%) | 9,833 (80.6%) |
| 25 to 34 Years | 15,850 (88.8%) | 13,559 (78.8%) |
| 35 to 44 Years | 12,292 (87.1%) | 10,676 (79.4%) |
| 45 to 54 Years | 10,795 (86.3%) | 9,877 (83.4%) |
| 55 to 64 Years | 7,871 (85.1%) | 8,449 (79.8%) |
| 65 to 74 Years | 4,858 (85.6%) | 5,844 (79.8%) |
| 75 Years and over | 2,326 (79.2%) | 3,474 (72.4%) |
| Total | 86,921 (82.5%) | 82,616 (77.2%) |
Income Below Poverty Among Married-Couple Families in San Bernardino
The poverty statistics for married-couple families in San Bernardino show that 9.6% or 2,560 of the total 26,609 families live below the poverty line. Families with 5 or more children have the highest poverty rate of 35.1%, comprising of 150 families. On the other hand, families with no children have the lowest poverty rate of 6.6%, which includes 754 families.
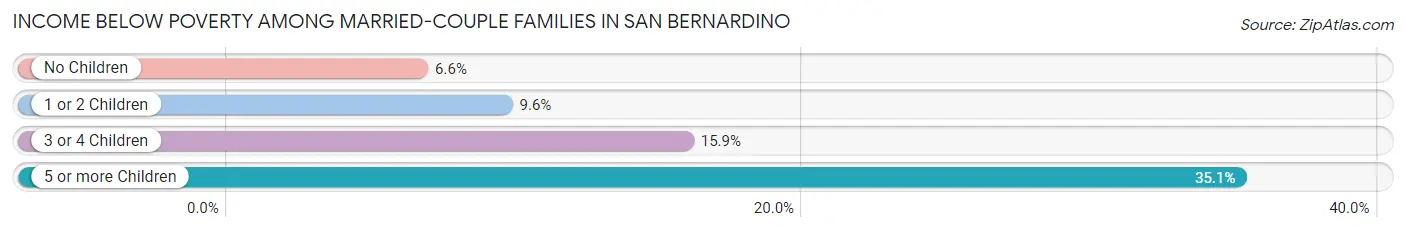
| Children | Above Poverty | Below Poverty |
| No Children | 10,628 (93.4%) | 754 (6.6%) |
| 1 or 2 Children | 9,920 (90.4%) | 1,048 (9.6%) |
| 3 or 4 Children | 3,224 (84.1%) | 608 (15.9%) |
| 5 or more Children | 277 (64.9%) | 150 (35.1%) |
| Total | 24,049 (90.4%) | 2,560 (9.6%) |
Income Below Poverty Among Single-Parent Households in San Bernardino
According to the poverty data in San Bernardino, 15.5% or 979 single-father households and 30.6% or 4,070 single-mother households are living below the poverty line. Among single-father households, those with 3 or 4 children have the highest poverty rate, with 207 households (34.1%) experiencing poverty. Likewise, among single-mother households, those with 5 or more children have the highest poverty rate, with 391 households (88.7%) falling below the poverty line.
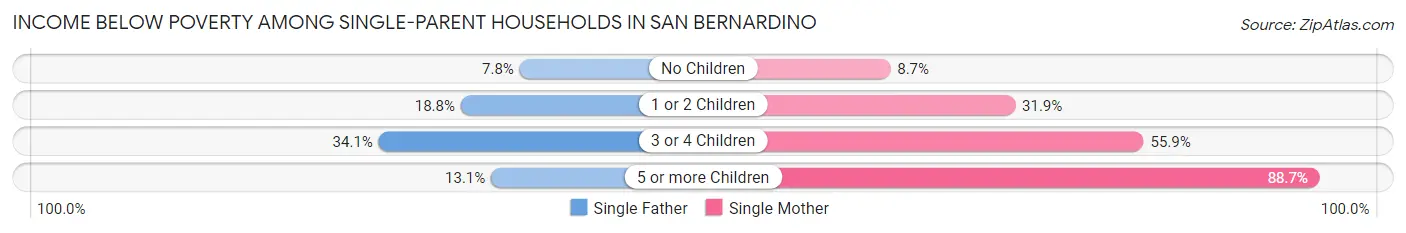
| Children | Single Father | Single Mother |
| No Children | 211 (7.8%) | 391 (8.7%) |
| 1 or 2 Children | 553 (18.8%) | 1,842 (31.9%) |
| 3 or 4 Children | 207 (34.1%) | 1,446 (55.8%) |
| 5 or more Children | 8 (13.1%) | 391 (88.7%) |
| Total | 979 (15.5%) | 4,070 (30.6%) |
Income Below Poverty Among Married-Couple vs Single-Parent Households in San Bernardino
The poverty data for San Bernardino shows that 2,560 of the married-couple family households (9.6%) and 5,049 of the single-parent households (25.7%) are living below the poverty level. Within the married-couple family households, those with 5 or more children have the highest poverty rate, with 150 households (35.1%) falling below the poverty line. Among the single-parent households, those with 5 or more children have the highest poverty rate, with 399 household (79.5%) living below poverty.
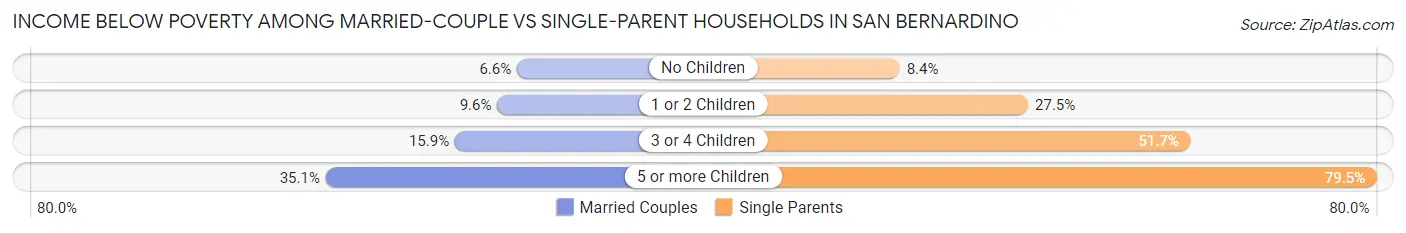
| Children | Married-Couple Families | Single-Parent Households |
| No Children | 754 (6.6%) | 602 (8.4%) |
| 1 or 2 Children | 1,048 (9.6%) | 2,395 (27.5%) |
| 3 or 4 Children | 608 (15.9%) | 1,653 (51.7%) |
| 5 or more Children | 150 (35.1%) | 399 (79.5%) |
| Total | 2,560 (9.6%) | 5,049 (25.7%) |
Race in San Bernardino
The most populous races in San Bernardino are Hispanic or Latino (149,153 | 67.5%), White / Caucasian (83,792 | 37.9%), and Some other Race (68,005 | 30.8%).
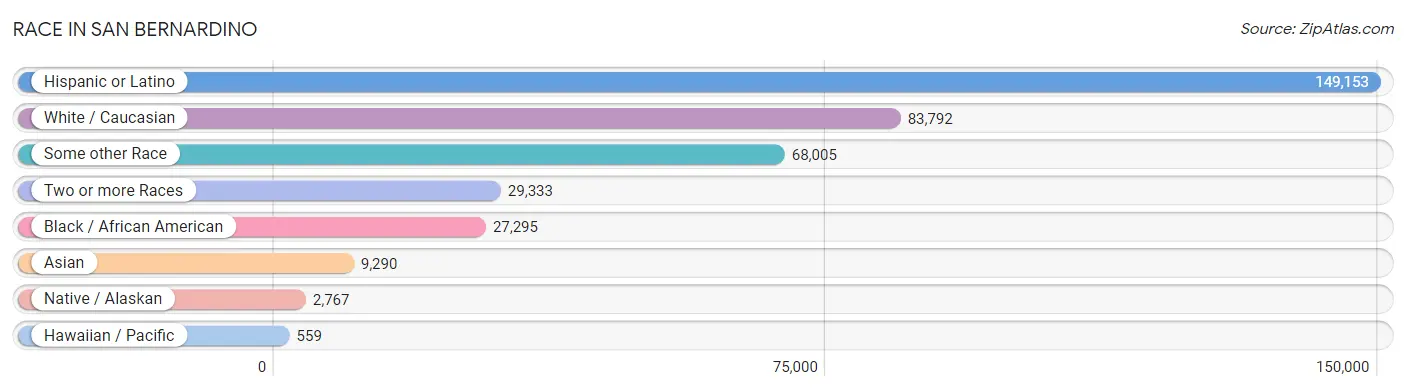
| Race | # Population | % Population |
| Asian | 9,290 | 4.2% |
| Black / African American | 27,295 | 12.3% |
| Hawaiian / Pacific | 559 | 0.3% |
| Hispanic or Latino | 149,153 | 67.5% |
| Native / Alaskan | 2,767 | 1.3% |
| White / Caucasian | 83,792 | 37.9% |
| Two or more Races | 29,333 | 13.3% |
| Some other Race | 68,005 | 30.8% |
| Total | 221,041 | 100.0% |
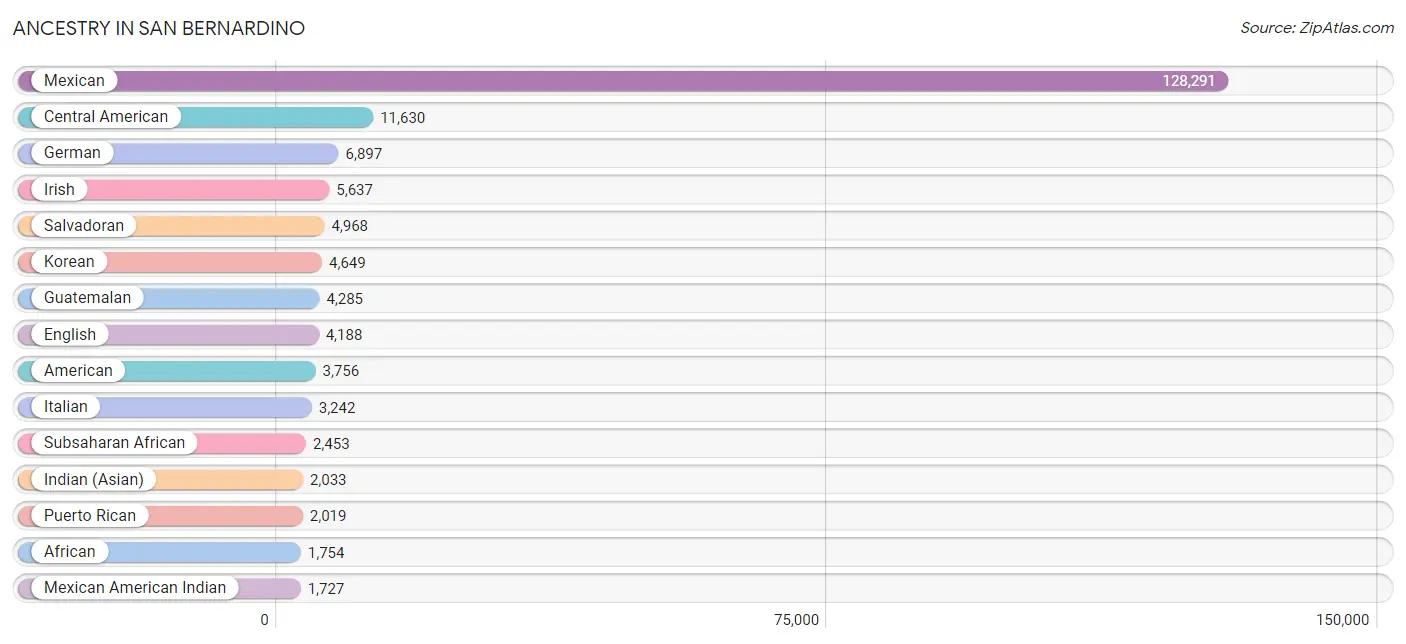
Ancestry in San Bernardino
The most populous ancestries reported in San Bernardino are Mexican (128,291 | 58.0%), Central American (11,630 | 5.3%), German (6,897 | 3.1%), Irish (5,637 | 2.5%), and Salvadoran (4,968 | 2.2%), together accounting for 71.2% of all San Bernardino residents.
| Ancestry | # Population | % Population |
| Afghan | 234 | 0.1% |
| African | 1,754 | 0.8% |
| Alaska Native | 8 | 0.0% |
| American | 3,756 | 1.7% |
| Apache | 258 | 0.1% |
| Arab | 1,707 | 0.8% |
| Argentinean | 110 | 0.1% |
| Armenian | 154 | 0.1% |
| Austrian | 62 | 0.0% |
| Bangladeshi | 14 | 0.0% |
| Basque | 32 | 0.0% |
| Belgian | 19 | 0.0% |
| Belizean | 109 | 0.1% |
| Bhutanese | 648 | 0.3% |
| Blackfeet | 28 | 0.0% |
| Bolivian | 24 | 0.0% |
| Brazilian | 57 | 0.0% |
| British | 273 | 0.1% |
| British West Indian | 14 | 0.0% |
| Burmese | 529 | 0.2% |
| Canadian | 529 | 0.2% |
| Central American | 11,630 | 5.3% |
| Central American Indian | 417 | 0.2% |
| Cherokee | 248 | 0.1% |
| Chickasaw | 12 | 0.0% |
| Chilean | 9 | 0.0% |
| Chinese | 9 | 0.0% |
| Chippewa | 6 | 0.0% |
| Choctaw | 59 | 0.0% |
| Colombian | 319 | 0.1% |
| Comanche | 25 | 0.0% |
| Costa Rican | 261 | 0.1% |
| Creek | 178 | 0.1% |
| Cuban | 533 | 0.2% |
| Czech | 86 | 0.0% |
| Czechoslovakian | 33 | 0.0% |
| Danish | 122 | 0.1% |
| Dominican | 68 | 0.0% |
| Dutch | 845 | 0.4% |
| Eastern European | 79 | 0.0% |
| Ecuadorian | 118 | 0.1% |
| Egyptian | 126 | 0.1% |
| English | 4,188 | 1.9% |
| Ethiopian | 68 | 0.0% |
| European | 978 | 0.4% |
| Filipino | 71 | 0.0% |
| Finnish | 58 | 0.0% |
| French | 1,528 | 0.7% |
| French Canadian | 102 | 0.1% |
| German | 6,897 | 3.1% |
| Ghanaian | 71 | 0.0% |
| Greek | 220 | 0.1% |
| Guamanian / Chamorro | 95 | 0.0% |
| Guatemalan | 4,285 | 1.9% |
| Guyanese | 19 | 0.0% |
| Haitian | 18 | 0.0% |
| Honduran | 1,042 | 0.5% |
| Hopi | 2 | 0.0% |
| Hungarian | 189 | 0.1% |
| Indian (Asian) | 2,033 | 0.9% |
| Iranian | 78 | 0.0% |
| Iraqi | 122 | 0.1% |
| Irish | 5,637 | 2.5% |
| Italian | 3,242 | 1.5% |
| Jamaican | 467 | 0.2% |
| Japanese | 739 | 0.3% |
| Jordanian | 366 | 0.2% |
| Kenyan | 80 | 0.0% |
| Korean | 4,649 | 2.1% |
| Laotian | 1,111 | 0.5% |
| Lebanese | 136 | 0.1% |
| Lithuanian | 20 | 0.0% |
| Malaysian | 129 | 0.1% |
| Mexican | 128,291 | 58.0% |
| Mexican American Indian | 1,727 | 0.8% |
| Native Hawaiian | 531 | 0.2% |
| Navajo | 304 | 0.1% |
| Nicaraguan | 973 | 0.4% |
| Nigerian | 459 | 0.2% |
| Northern European | 95 | 0.0% |
| Norwegian | 552 | 0.3% |
| Pakistani | 212 | 0.1% |
| Palestinian | 177 | 0.1% |
| Panamanian | 72 | 0.0% |
| Pennsylvania German | 31 | 0.0% |
| Peruvian | 519 | 0.2% |
| Polish | 890 | 0.4% |
| Portuguese | 234 | 0.1% |
| Pueblo | 23 | 0.0% |
| Puerto Rican | 2,019 | 0.9% |
| Romanian | 147 | 0.1% |
| Russian | 144 | 0.1% |
| Salvadoran | 4,968 | 2.2% |
| Samoan | 319 | 0.1% |
| Scandinavian | 121 | 0.1% |
| Scotch-Irish | 460 | 0.2% |
| Scottish | 704 | 0.3% |
| Serbian | 7 | 0.0% |
| Shoshone | 14 | 0.0% |
| Sioux | 10 | 0.0% |
| Slavic | 70 | 0.0% |
| Slovak | 11 | 0.0% |
| South African | 25 | 0.0% |
| South American | 1,099 | 0.5% |
| South American Indian | 41 | 0.0% |
| Spaniard | 751 | 0.3% |
| Spanish | 414 | 0.2% |
| Spanish American | 173 | 0.1% |
| Sri Lankan | 1,579 | 0.7% |
| Subsaharan African | 2,453 | 1.1% |
| Sudanese | 7 | 0.0% |
| Swedish | 604 | 0.3% |
| Swiss | 70 | 0.0% |
| Syrian | 303 | 0.1% |
| Thai | 765 | 0.4% |
| Tongan | 227 | 0.1% |
| Trinidadian and Tobagonian | 44 | 0.0% |
| Ukrainian | 69 | 0.0% |
| Vietnamese | 23 | 0.0% |
| Welsh | 154 | 0.1% |
| West Indian | 84 | 0.0% |
| Yaqui | 228 | 0.1% |
| Yuman | 18 | 0.0% |
| Yup'ik | 9 | 0.0% | View All 124 Rows |
Immigrants in San Bernardino
The most numerous immigrant groups reported in San Bernardino came from Latin America (40,042 | 18.1%), Central America (38,809 | 17.6%), Mexico (33,766 | 15.3%), Asia (6,657 | 3.0%), and South Eastern Asia (4,086 | 1.8%), together accounting for 55.8% of all San Bernardino residents.
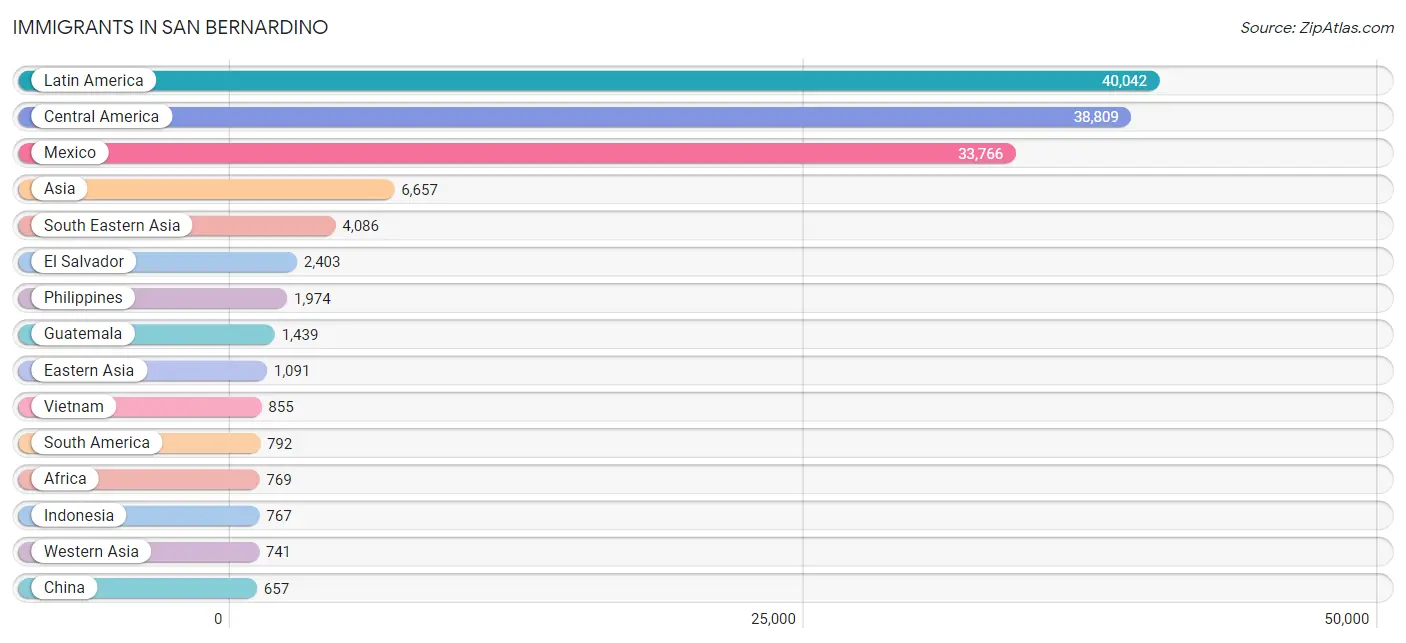
| Immigration Origin | # Population | % Population |
| Afghanistan | 94 | 0.0% |
| Africa | 769 | 0.4% |
| Argentina | 88 | 0.0% |
| Armenia | 34 | 0.0% |
| Asia | 6,657 | 3.0% |
| Austria | 4 | 0.0% |
| Bangladesh | 65 | 0.0% |
| Barbados | 43 | 0.0% |
| Belarus | 15 | 0.0% |
| Belgium | 49 | 0.0% |
| Belize | 145 | 0.1% |
| Bolivia | 4 | 0.0% |
| Brazil | 32 | 0.0% |
| Bulgaria | 9 | 0.0% |
| Cambodia | 283 | 0.1% |
| Canada | 229 | 0.1% |
| Caribbean | 441 | 0.2% |
| Central America | 38,809 | 17.6% |
| Chile | 9 | 0.0% |
| China | 657 | 0.3% |
| Colombia | 216 | 0.1% |
| Costa Rica | 86 | 0.0% |
| Cuba | 199 | 0.1% |
| Czechoslovakia | 33 | 0.0% |
| Denmark | 6 | 0.0% |
| Dominica | 24 | 0.0% |
| Dominican Republic | 19 | 0.0% |
| Eastern Africa | 127 | 0.1% |
| Eastern Asia | 1,091 | 0.5% |
| Eastern Europe | 120 | 0.1% |
| Ecuador | 104 | 0.1% |
| Egypt | 69 | 0.0% |
| El Salvador | 2,403 | 1.1% |
| England | 18 | 0.0% |
| Ethiopia | 81 | 0.0% |
| Europe | 512 | 0.2% |
| Fiji | 6 | 0.0% |
| France | 14 | 0.0% |
| Germany | 62 | 0.0% |
| Greece | 8 | 0.0% |
| Grenada | 6 | 0.0% |
| Guatemala | 1,439 | 0.6% |
| Guyana | 19 | 0.0% |
| Haiti | 18 | 0.0% |
| Honduras | 466 | 0.2% |
| Hong Kong | 63 | 0.0% |
| India | 316 | 0.1% |
| Indonesia | 767 | 0.4% |
| Iran | 25 | 0.0% |
| Iraq | 122 | 0.1% |
| Ireland | 14 | 0.0% |
| Israel | 18 | 0.0% |
| Italy | 18 | 0.0% |
| Jamaica | 71 | 0.0% |
| Japan | 47 | 0.0% |
| Jordan | 325 | 0.2% |
| Kenya | 41 | 0.0% |
| Korea | 387 | 0.2% |
| Laos | 17 | 0.0% |
| Latin America | 40,042 | 18.1% |
| Lebanon | 61 | 0.0% |
| Liberia | 17 | 0.0% |
| Malaysia | 32 | 0.0% |
| Mexico | 33,766 | 15.3% |
| Netherlands | 58 | 0.0% |
| Nicaragua | 462 | 0.2% |
| Nigeria | 512 | 0.2% |
| Northern Africa | 81 | 0.0% |
| Northern Europe | 96 | 0.0% |
| Oceania | 55 | 0.0% |
| Pakistan | 47 | 0.0% |
| Panama | 19 | 0.0% |
| Peru | 310 | 0.1% |
| Philippines | 1,974 | 0.9% |
| Romania | 45 | 0.0% |
| Russia | 18 | 0.0% |
| Saudi Arabia | 48 | 0.0% |
| Scotland | 12 | 0.0% |
| South Africa | 30 | 0.0% |
| South America | 792 | 0.4% |
| South Central Asia | 624 | 0.3% |
| South Eastern Asia | 4,086 | 1.8% |
| Southern Europe | 109 | 0.1% |
| Spain | 83 | 0.0% |
| Sri Lanka | 77 | 0.0% |
| Sudan | 12 | 0.0% |
| Syria | 133 | 0.1% |
| Taiwan | 73 | 0.0% |
| Thailand | 150 | 0.1% |
| Trinidad and Tobago | 47 | 0.0% |
| Uruguay | 10 | 0.0% |
| Vietnam | 855 | 0.4% |
| Western Africa | 529 | 0.2% |
| Western Asia | 741 | 0.3% |
| Western Europe | 187 | 0.1% | View All 95 Rows |
Sex and Age in San Bernardino
Sex and Age in San Bernardino
The most populous age groups in San Bernardino are 20 to 24 Years (9,538 | 8.6%) for men and 20 to 24 Years (9,504 | 8.6%) for women.
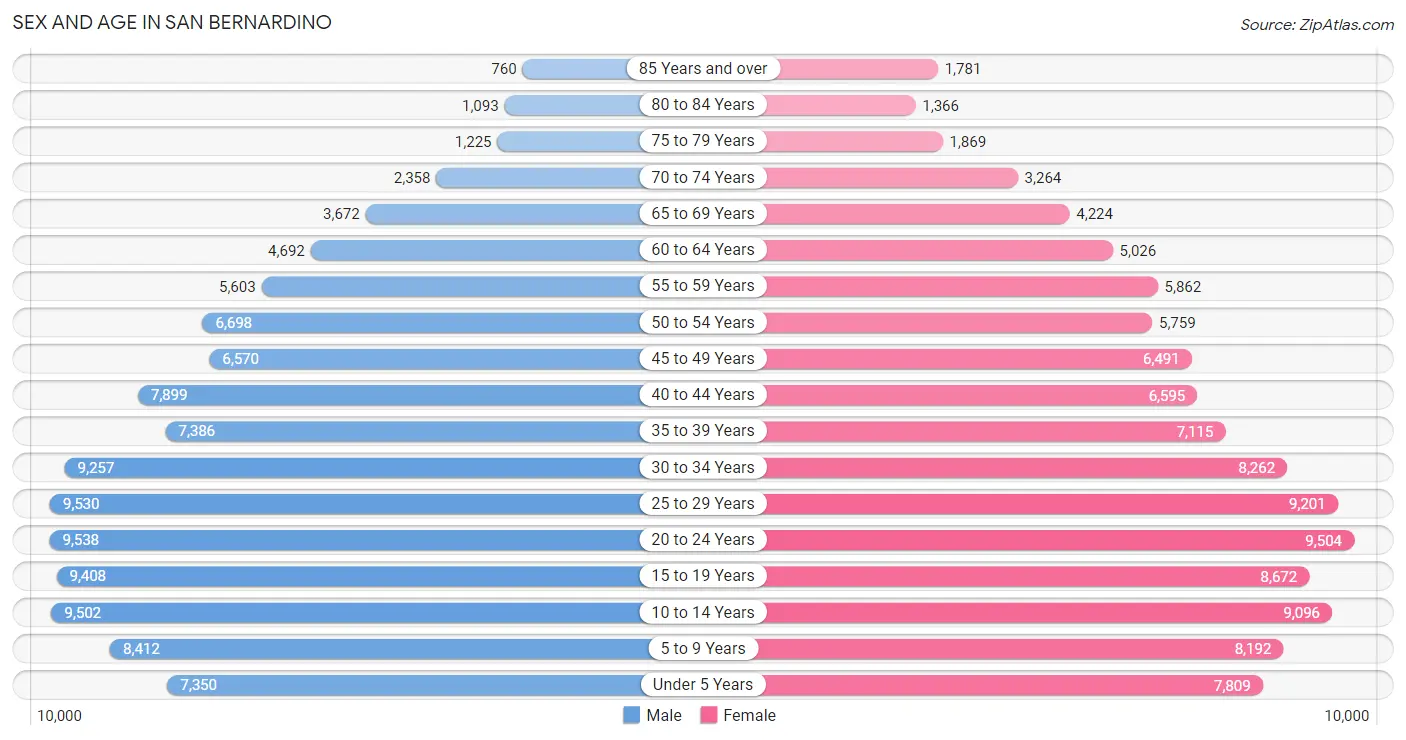
| Age Bracket | Male | Female |
| Under 5 Years | 7,350 (6.6%) | 7,809 (7.1%) |
| 5 to 9 Years | 8,412 (7.6%) | 8,192 (7.4%) |
| 10 to 14 Years | 9,502 (8.6%) | 9,096 (8.3%) |
| 15 to 19 Years | 9,408 (8.5%) | 8,672 (7.9%) |
| 20 to 24 Years | 9,538 (8.6%) | 9,504 (8.6%) |
| 25 to 29 Years | 9,530 (8.6%) | 9,201 (8.4%) |
| 30 to 34 Years | 9,257 (8.3%) | 8,262 (7.5%) |
| 35 to 39 Years | 7,386 (6.7%) | 7,115 (6.5%) |
| 40 to 44 Years | 7,899 (7.1%) | 6,595 (6.0%) |
| 45 to 49 Years | 6,570 (5.9%) | 6,491 (5.9%) |
| 50 to 54 Years | 6,698 (6.0%) | 5,759 (5.2%) |
| 55 to 59 Years | 5,603 (5.1%) | 5,862 (5.3%) |
| 60 to 64 Years | 4,692 (4.2%) | 5,026 (4.6%) |
| 65 to 69 Years | 3,672 (3.3%) | 4,224 (3.8%) |
| 70 to 74 Years | 2,358 (2.1%) | 3,264 (3.0%) |
| 75 to 79 Years | 1,225 (1.1%) | 1,869 (1.7%) |
| 80 to 84 Years | 1,093 (1.0%) | 1,366 (1.2%) |
| 85 Years and over | 760 (0.7%) | 1,781 (1.6%) |
| Total | 110,953 (100.0%) | 110,088 (100.0%) |
Families and Households in San Bernardino
Median Family Size in San Bernardino
The median family size in San Bernardino is 3.92 persons per family, with married-couple families (26,609 | 57.6%) accounting for the largest median family size of 4.14 persons per family. On the other hand, single male/father families (6,323 | 13.7%) represent the smallest median family size with 3.41 persons per family.
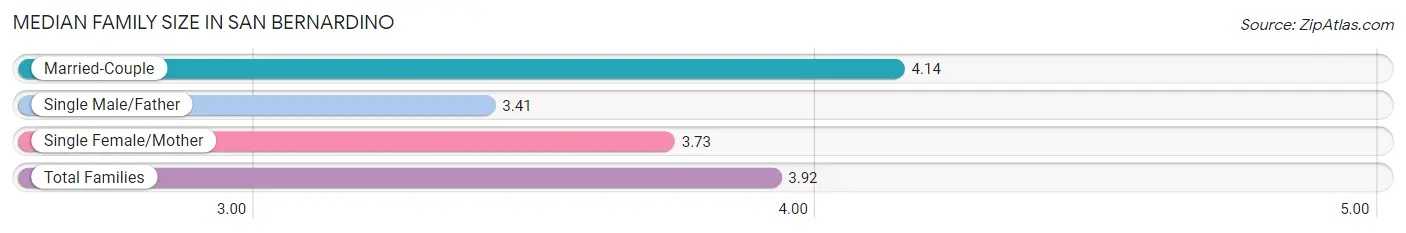
| Family Type | # Families | Family Size |
| Married-Couple | 26,609 (57.6%) | 4.14 |
| Single Male/Father | 6,323 (13.7%) | 3.41 |
| Single Female/Mother | 13,302 (28.8%) | 3.73 |
| Total Families | 46,234 (100.0%) | 3.92 |
Median Household Size in San Bernardino
The median household size in San Bernardino is 3.40 persons per household, with married-couple households (26,609 | 42.6%) accounting for the largest median household size of 4.22 persons per household. non-family households (16,252 | 26.0%) represent the smallest median household size with 1.33 persons per household.
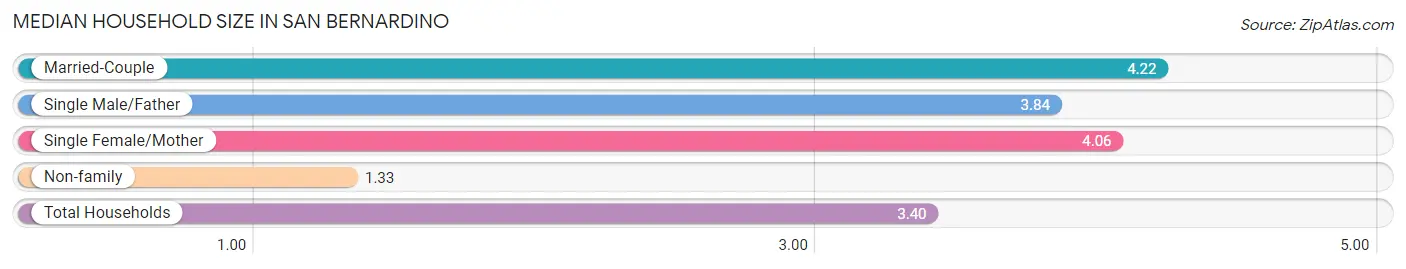
| Household Type | # Households | Household Size |
| Married-Couple | 26,609 (42.6%) | 4.22 |
| Single Male/Father | 6,323 (10.1%) | 3.84 |
| Single Female/Mother | 13,302 (21.3%) | 4.06 |
| Non-family | 16,252 (26.0%) | 1.33 |
| Total Households | 62,486 (100.0%) | 3.40 |
Household Size by Marriage Status in San Bernardino
Out of a total of 62,486 households in San Bernardino, 46,234 (74.0%) are family households, while 16,252 (26.0%) are nonfamily households. The most numerous type of family households are 4-person households, comprising 11,572, and the most common type of nonfamily households are 1-person households, comprising 12,359.
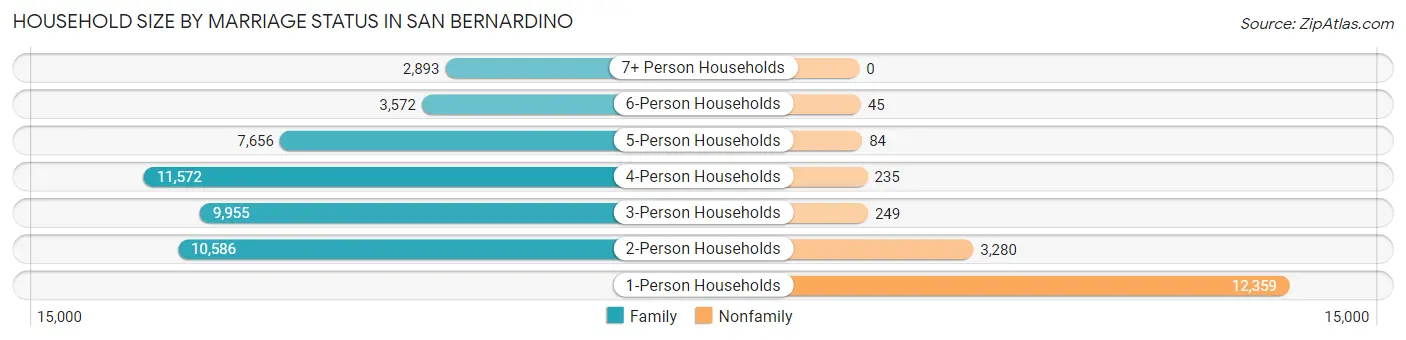
| Household Size | Family Households | Nonfamily Households |
| 1-Person Households | - | 12,359 (19.8%) |
| 2-Person Households | 10,586 (16.9%) | 3,280 (5.2%) |
| 3-Person Households | 9,955 (15.9%) | 249 (0.4%) |
| 4-Person Households | 11,572 (18.5%) | 235 (0.4%) |
| 5-Person Households | 7,656 (12.2%) | 84 (0.1%) |
| 6-Person Households | 3,572 (5.7%) | 45 (0.1%) |
| 7+ Person Households | 2,893 (4.6%) | 0 (0.0%) |
| Total | 46,234 (74.0%) | 16,252 (26.0%) |
Female Fertility in San Bernardino
Fertility by Age in San Bernardino
Average fertility rate in San Bernardino is 48.0 births per 1,000 women. Women in the age bracket of 20 to 34 years have the highest fertility rate with 82.0 births per 1,000 women. Women in the age bracket of 20 to 34 years acount for 80.4% of all women with births.
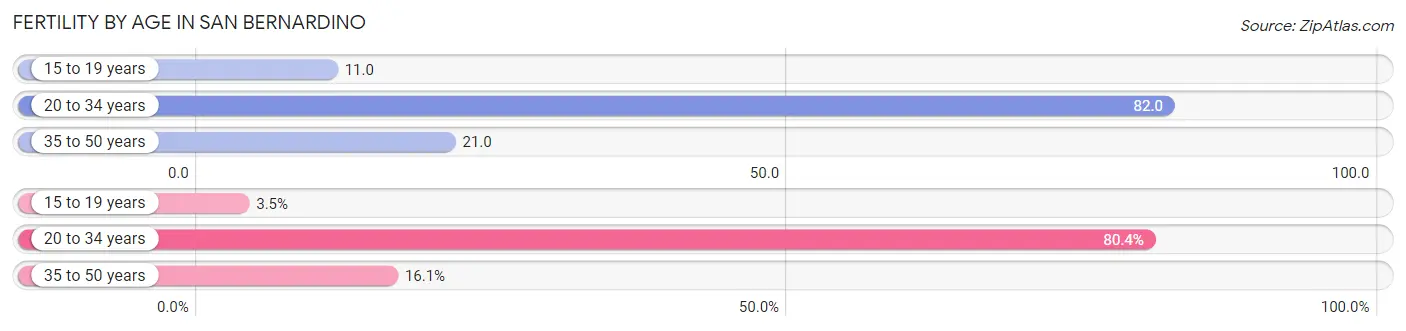
| Age Bracket | Women with Births | Births / 1,000 Women |
| 15 to 19 years | 96 (3.5%) | 11.0 |
| 20 to 34 years | 2,206 (80.4%) | 82.0 |
| 35 to 50 years | 442 (16.1%) | 21.0 |
| Total | 2,744 (100.0%) | 48.0 |
Fertility by Age by Marriage Status in San Bernardino
46.4% of women with births (2,744) in San Bernardino are married. The highest percentage of unmarried women with births falls into 15 to 19 years age bracket with 100.0% of them unmarried at the time of birth, while the lowest percentage of unmarried women with births belong to 35 to 50 years age bracket with 20.6% of them unmarried.
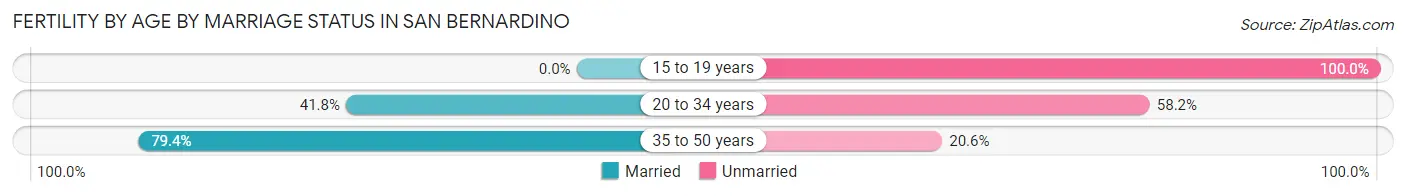
| Age Bracket | Married | Unmarried |
| 15 to 19 years | 0 (0.0%) | 96 (100.0%) |
| 20 to 34 years | 922 (41.8%) | 1,284 (58.2%) |
| 35 to 50 years | 351 (79.4%) | 91 (20.6%) |
| Total | 1,273 (46.4%) | 1,471 (53.6%) |
Fertility by Education in San Bernardino
Average fertility rate in San Bernardino is 48.0 births per 1,000 women. Women with the education attainment of graduate degree have the highest fertility rate of 65.0 births per 1,000 women, while women with the education attainment of less than high school have the lowest fertility at 27.0 births per 1,000 women. Women with the education attainment of high school diploma represent 35.8% of all women with births.
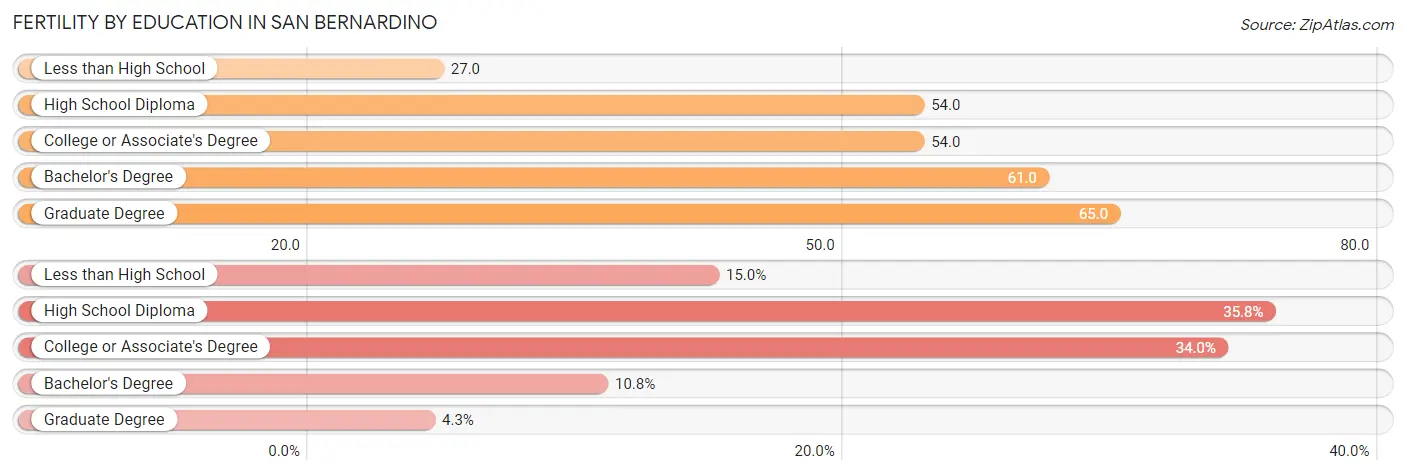
| Educational Attainment | Women with Births | Births / 1,000 Women |
| Less than High School | 411 (15.0%) | 27.0 |
| High School Diploma | 983 (35.8%) | 54.0 |
| College or Associate's Degree | 934 (34.0%) | 54.0 |
| Bachelor's Degree | 297 (10.8%) | 61.0 |
| Graduate Degree | 119 (4.3%) | 65.0 |
| Total | 2,744 (100.0%) | 48.0 |
Fertility by Education by Marriage Status in San Bernardino
53.6% of women with births in San Bernardino are unmarried. Women with the educational attainment of graduate degree are most likely to be married with 97.5% of them married at childbirth, while women with the educational attainment of high school diploma are least likely to be married with 67.7% of them unmarried at childbirth.
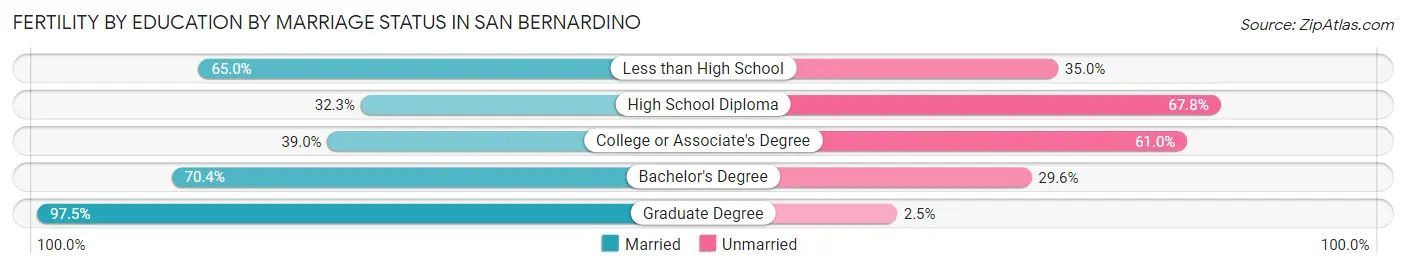
| Educational Attainment | Married | Unmarried |
| Less than High School | 267 (65.0%) | 144 (35.0%) |
| High School Diploma | 317 (32.3%) | 666 (67.7%) |
| College or Associate's Degree | 364 (39.0%) | 570 (61.0%) |
| Bachelor's Degree | 209 (70.4%) | 88 (29.6%) |
| Graduate Degree | 116 (97.5%) | 3 (2.5%) |
| Total | 1,273 (46.4%) | 1,471 (53.6%) |
Employment Characteristics in San Bernardino
Employment by Class of Employer in San Bernardino
Among the 91,529 employed individuals in San Bernardino, private company employees (67,246 | 73.5%), local government employees (7,328 | 8.0%), and self-employed (not incorporated) (4,810 | 5.3%) make up the most common classes of employment.
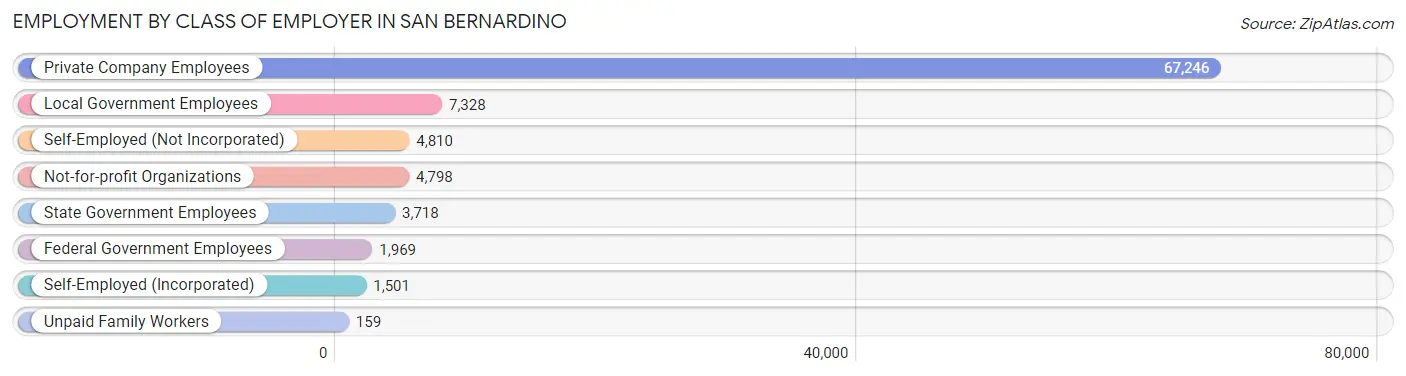
| Employer Class | # Employees | % Employees |
| Private Company Employees | 67,246 | 73.5% |
| Self-Employed (Incorporated) | 1,501 | 1.6% |
| Self-Employed (Not Incorporated) | 4,810 | 5.3% |
| Not-for-profit Organizations | 4,798 | 5.2% |
| Local Government Employees | 7,328 | 8.0% |
| State Government Employees | 3,718 | 4.1% |
| Federal Government Employees | 1,969 | 2.1% |
| Unpaid Family Workers | 159 | 0.2% |
| Total | 91,529 | 100.0% |
Employment Status by Age in San Bernardino
According to the labor force statistics for San Bernardino, out of the total population over 16 years of age (166,947), 60.9% or 101,671 individuals are in the labor force, with 7.6% or 7,727 of them unemployed. The age group with the highest labor force participation rate is 25 to 29 years, with 76.1% or 14,254 individuals in the labor force. Within the labor force, the 16 to 19 years age range has the highest percentage of unemployed individuals, with 14.9% or 686 of them being unemployed.
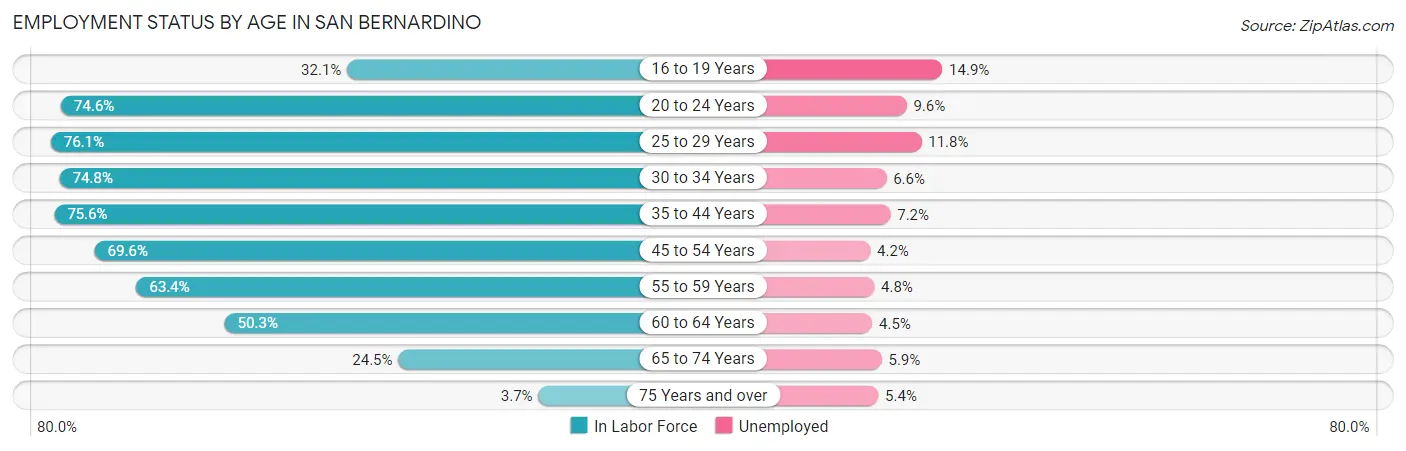
| Age Bracket | In Labor Force | Unemployed |
| 16 to 19 Years | 4,605 (32.1%) | 686 (14.9%) |
| 20 to 24 Years | 14,205 (74.6%) | 1,364 (9.6%) |
| 25 to 29 Years | 14,254 (76.1%) | 1,682 (11.8%) |
| 30 to 34 Years | 13,104 (74.8%) | 865 (6.6%) |
| 35 to 44 Years | 21,920 (75.6%) | 1,578 (7.2%) |
| 45 to 54 Years | 17,761 (69.6%) | 746 (4.2%) |
| 55 to 59 Years | 7,269 (63.4%) | 349 (4.8%) |
| 60 to 64 Years | 4,888 (50.3%) | 220 (4.5%) |
| 65 to 74 Years | 3,312 (24.5%) | 195 (5.9%) |
| 75 Years and over | 299 (3.7%) | 16 (5.4%) |
| Total | 101,671 (60.9%) | 7,727 (7.6%) |
Employment Status by Educational Attainment in San Bernardino
According to labor force statistics for San Bernardino, 70.8% of individuals (79,258) out of the total population between 25 and 64 years of age (111,946) are in the labor force, with 6.9% or 5,469 of them being unemployed. The group with the highest labor force participation rate are those with the educational attainment of bachelor's degree or higher, with 84.6% or 12,237 individuals in the labor force. Within the labor force, individuals with less than high school education have the highest percentage of unemployment, with 8.6% or 1,557 of them being unemployed.
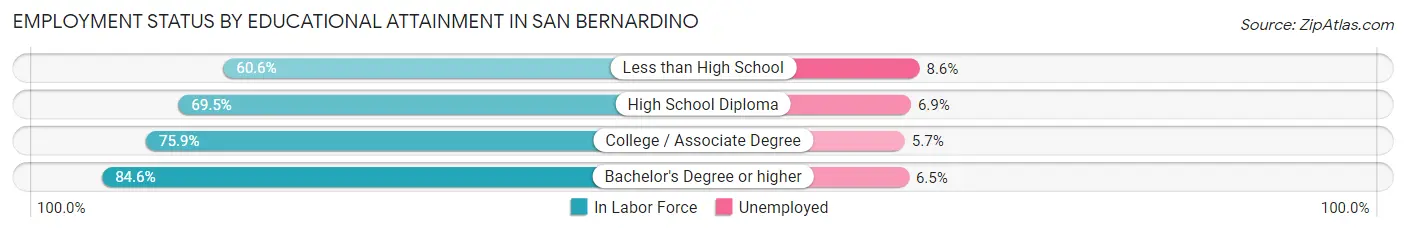
| Educational Attainment | In Labor Force | Unemployed |
| Less than High School | 18,110 (60.6%) | 2,570 (8.6%) |
| High School Diploma | 26,650 (69.5%) | 2,646 (6.9%) |
| College / Associate Degree | 22,202 (75.9%) | 1,667 (5.7%) |
| Bachelor's Degree or higher | 12,237 (84.6%) | 940 (6.5%) |
| Total | 79,258 (70.8%) | 7,724 (6.9%) |
Employment Occupations by Sex in San Bernardino
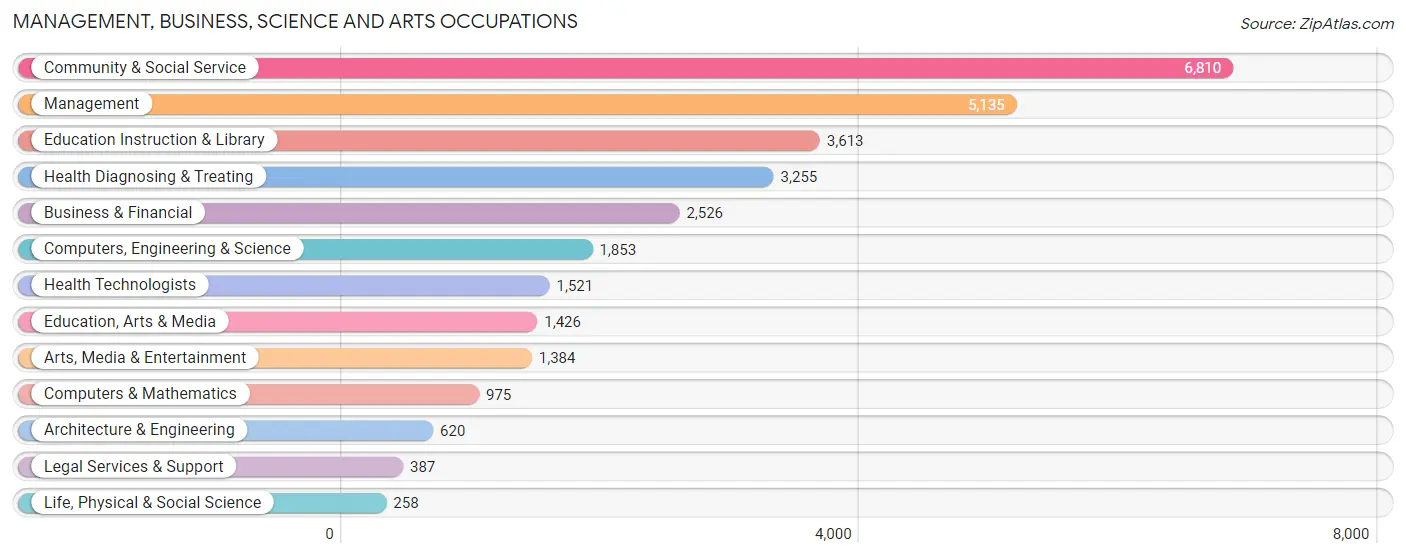
Management, Business, Science and Arts Occupations
The most common Management, Business, Science and Arts occupations in San Bernardino are Community & Social Service (6,810 | 7.3%), Management (5,135 | 5.5%), Education Instruction & Library (3,613 | 3.9%), Health Diagnosing & Treating (3,255 | 3.5%), and Business & Financial (2,526 | 2.7%).
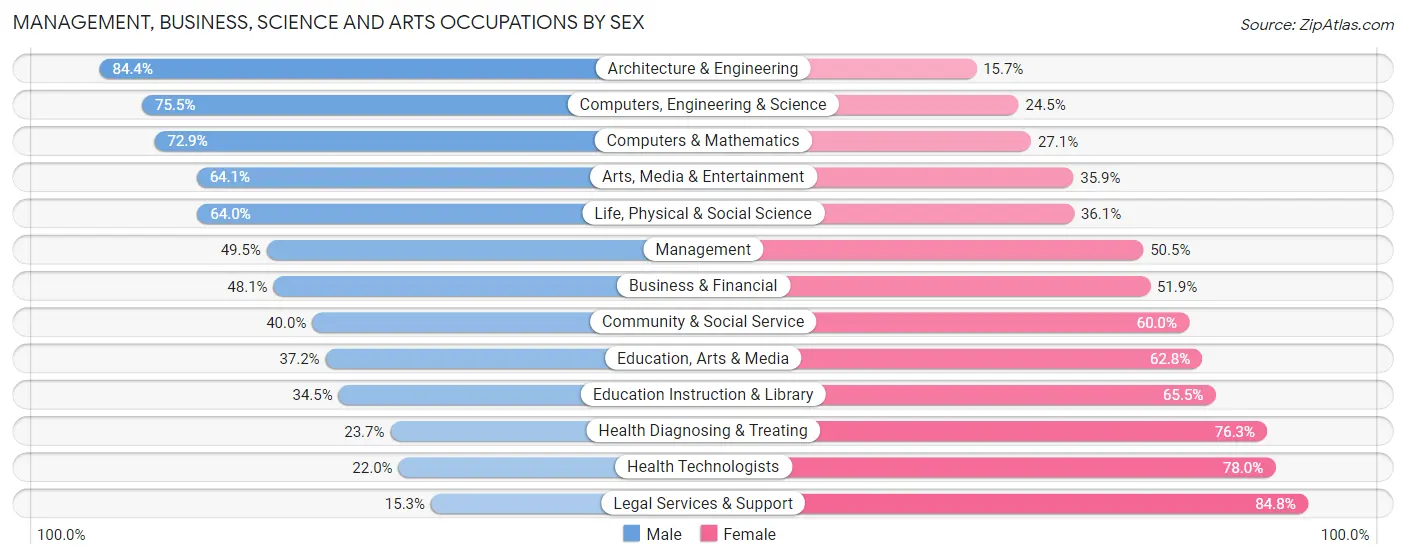
Management, Business, Science and Arts Occupations by Sex
Within the Management, Business, Science and Arts occupations in San Bernardino, the most male-oriented occupations are Architecture & Engineering (84.4%), Computers, Engineering & Science (75.5%), and Computers & Mathematics (72.9%), while the most female-oriented occupations are Legal Services & Support (84.8%), Health Technologists (78.0%), and Health Diagnosing & Treating (76.3%).
| Occupation | Male | Female |
| Management | 2,542 (49.5%) | 2,593 (50.5%) |
| Business & Financial | 1,215 (48.1%) | 1,311 (51.9%) |
| Computers, Engineering & Science | 1,399 (75.5%) | 454 (24.5%) |
| Computers & Mathematics | 711 (72.9%) | 264 (27.1%) |
| Architecture & Engineering | 523 (84.4%) | 97 (15.7%) |
| Life, Physical & Social Science | 165 (63.9%) | 93 (36.0%) |
| Community & Social Service | 2,724 (40.0%) | 4,086 (60.0%) |
| Education, Arts & Media | 531 (37.2%) | 895 (62.8%) |
| Legal Services & Support | 59 (15.2%) | 328 (84.8%) |
| Education Instruction & Library | 1,247 (34.5%) | 2,366 (65.5%) |
| Arts, Media & Entertainment | 887 (64.1%) | 497 (35.9%) |
| Health Diagnosing & Treating | 772 (23.7%) | 2,483 (76.3%) |
| Health Technologists | 335 (22.0%) | 1,186 (78.0%) |
| Total (Category) | 8,652 (44.2%) | 10,927 (55.8%) |
| Total (Overall) | 51,914 (55.5%) | 41,566 (44.5%) |
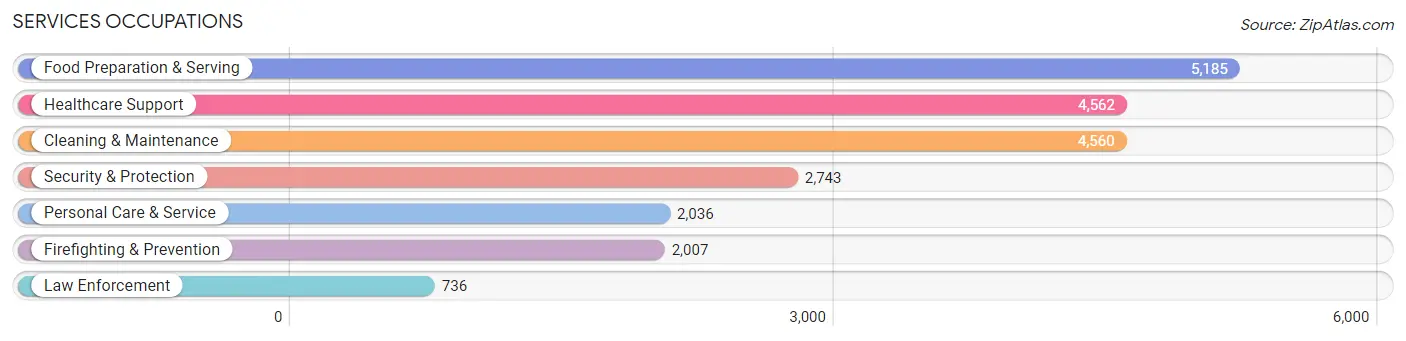
Services Occupations
The most common Services occupations in San Bernardino are Food Preparation & Serving (5,185 | 5.6%), Healthcare Support (4,562 | 4.9%), Cleaning & Maintenance (4,560 | 4.9%), Security & Protection (2,743 | 2.9%), and Personal Care & Service (2,036 | 2.2%).
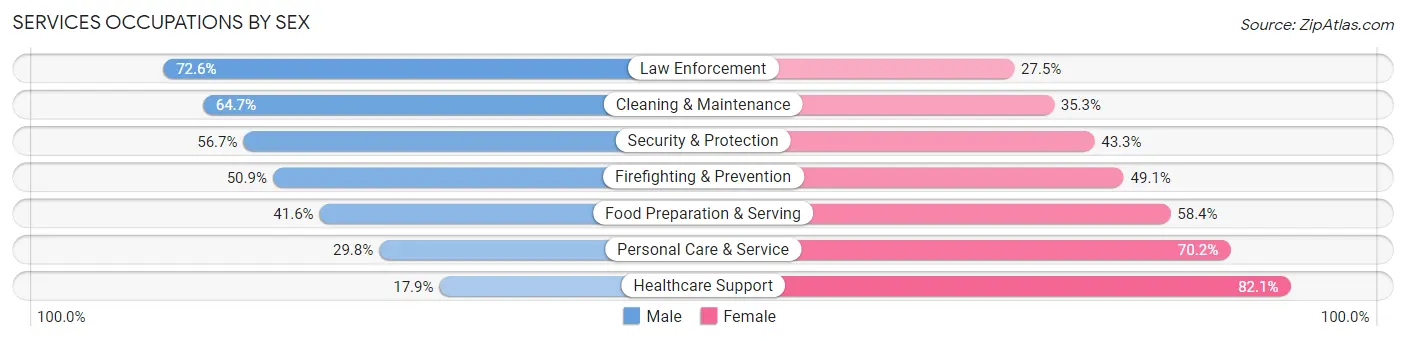
Services Occupations by Sex
Within the Services occupations in San Bernardino, the most male-oriented occupations are Law Enforcement (72.6%), Cleaning & Maintenance (64.7%), and Security & Protection (56.7%), while the most female-oriented occupations are Healthcare Support (82.1%), Personal Care & Service (70.2%), and Food Preparation & Serving (58.4%).
| Occupation | Male | Female |
| Healthcare Support | 816 (17.9%) | 3,746 (82.1%) |
| Security & Protection | 1,555 (56.7%) | 1,188 (43.3%) |
| Firefighting & Prevention | 1,021 (50.9%) | 986 (49.1%) |
| Law Enforcement | 534 (72.6%) | 202 (27.5%) |
| Food Preparation & Serving | 2,158 (41.6%) | 3,027 (58.4%) |
| Cleaning & Maintenance | 2,951 (64.7%) | 1,609 (35.3%) |
| Personal Care & Service | 607 (29.8%) | 1,429 (70.2%) |
| Total (Category) | 8,087 (42.4%) | 10,999 (57.6%) |
| Total (Overall) | 51,914 (55.5%) | 41,566 (44.5%) |
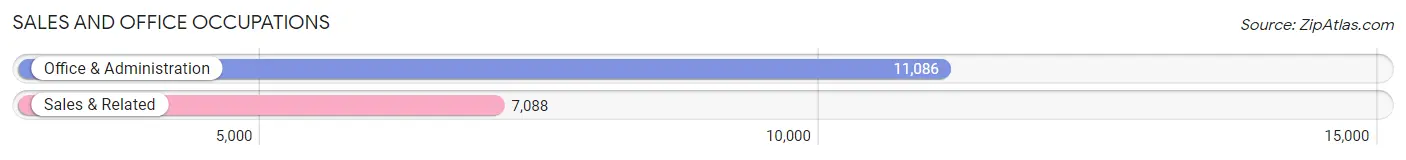
Sales and Office Occupations
The most common Sales and Office occupations in San Bernardino are Office & Administration (11,086 | 11.9%), and Sales & Related (7,088 | 7.6%).
Sales and Office Occupations by Sex
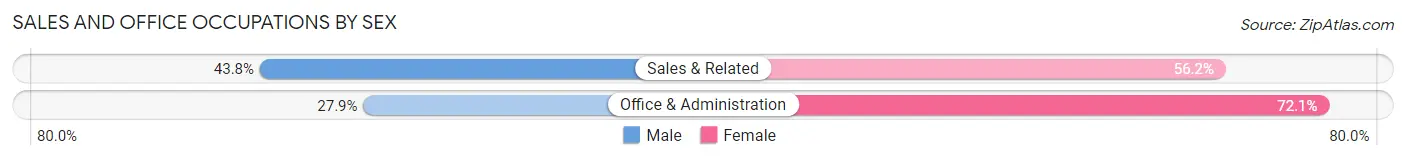
| Occupation | Male | Female |
| Sales & Related | 3,105 (43.8%) | 3,983 (56.2%) |
| Office & Administration | 3,091 (27.9%) | 7,995 (72.1%) |
| Total (Category) | 6,196 (34.1%) | 11,978 (65.9%) |
| Total (Overall) | 51,914 (55.5%) | 41,566 (44.5%) |
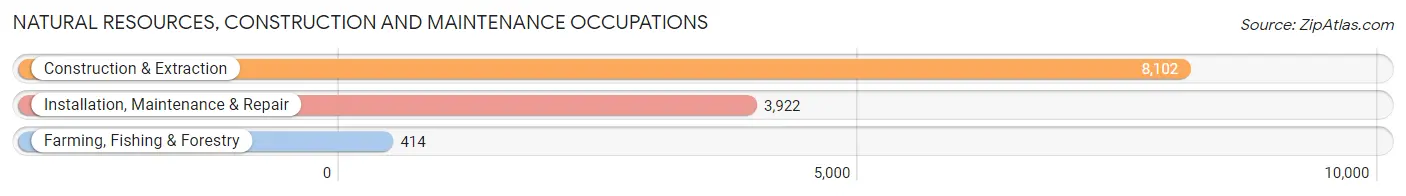
Natural Resources, Construction and Maintenance Occupations
The most common Natural Resources, Construction and Maintenance occupations in San Bernardino are Construction & Extraction (8,102 | 8.7%), Installation, Maintenance & Repair (3,922 | 4.2%), and Farming, Fishing & Forestry (414 | 0.4%).
Natural Resources, Construction and Maintenance Occupations by Sex
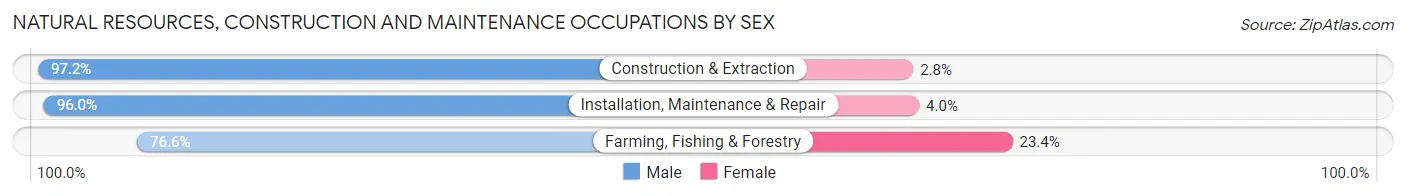
| Occupation | Male | Female |
| Farming, Fishing & Forestry | 317 (76.6%) | 97 (23.4%) |
| Construction & Extraction | 7,877 (97.2%) | 225 (2.8%) |
| Installation, Maintenance & Repair | 3,765 (96.0%) | 157 (4.0%) |
| Total (Category) | 11,959 (96.2%) | 479 (3.8%) |
| Total (Overall) | 51,914 (55.5%) | 41,566 (44.5%) |
Production, Transportation and Moving Occupations
The most common Production, Transportation and Moving occupations in San Bernardino are Material Moving (12,297 | 13.2%), Production (6,536 | 7.0%), and Transportation (5,370 | 5.7%).
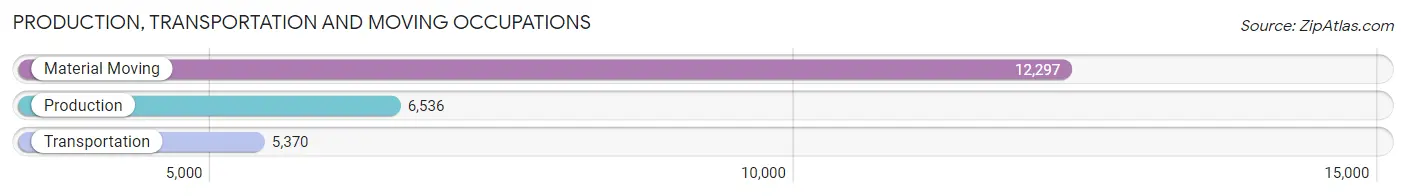
Production, Transportation and Moving Occupations by Sex
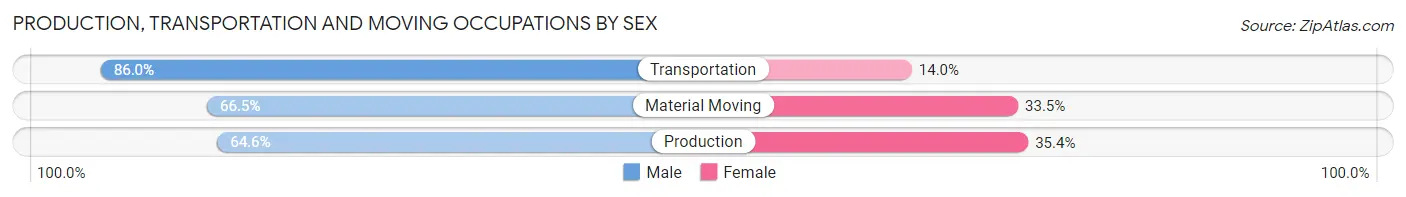
| Occupation | Male | Female |
| Production | 4,225 (64.6%) | 2,311 (35.4%) |
| Transportation | 4,618 (86.0%) | 752 (14.0%) |
| Material Moving | 8,177 (66.5%) | 4,120 (33.5%) |
| Total (Category) | 17,020 (70.3%) | 7,183 (29.7%) |
| Total (Overall) | 51,914 (55.5%) | 41,566 (44.5%) |
Employment Industries by Sex in San Bernardino
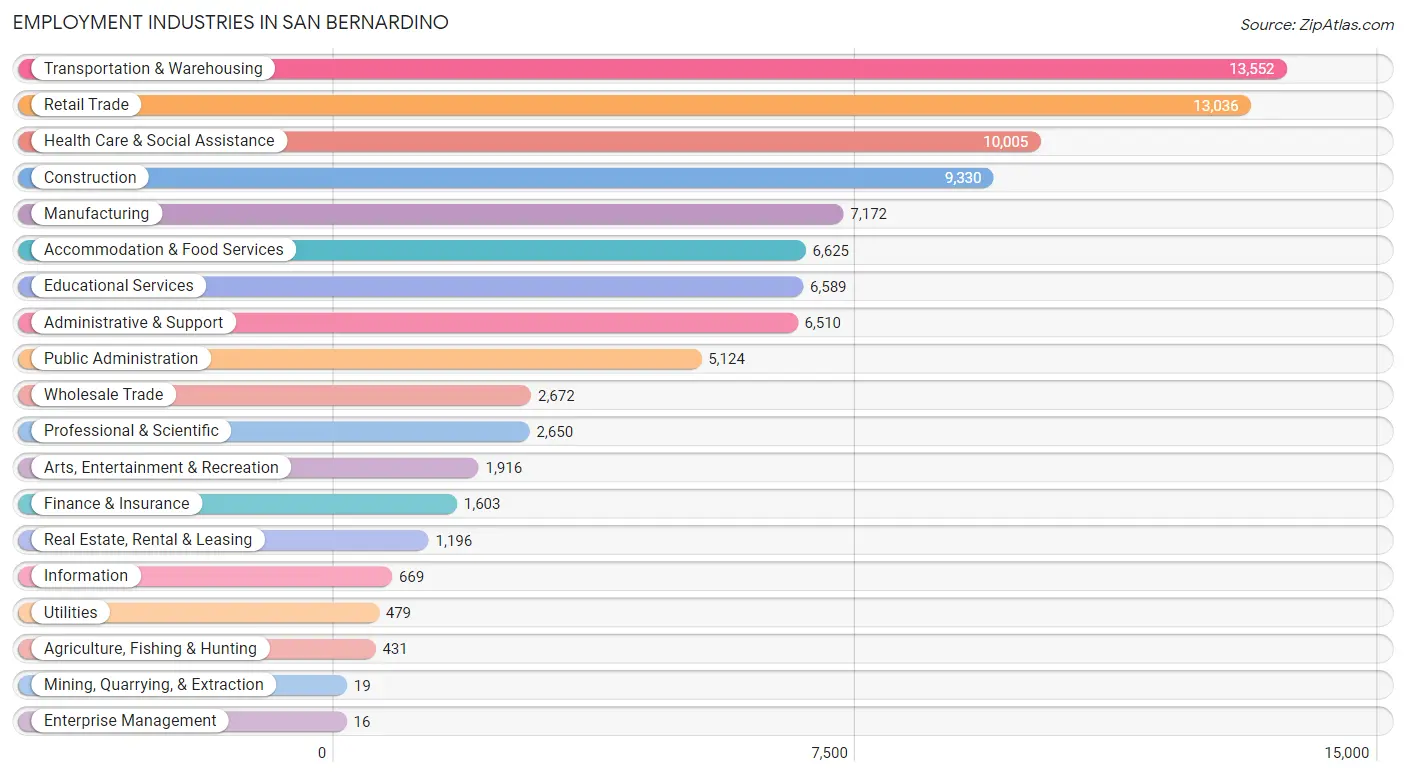
Employment Industries in San Bernardino
The major employment industries in San Bernardino include Transportation & Warehousing (13,552 | 14.5%), Retail Trade (13,036 | 14.0%), Health Care & Social Assistance (10,005 | 10.7%), Construction (9,330 | 10.0%), and Manufacturing (7,172 | 7.7%).
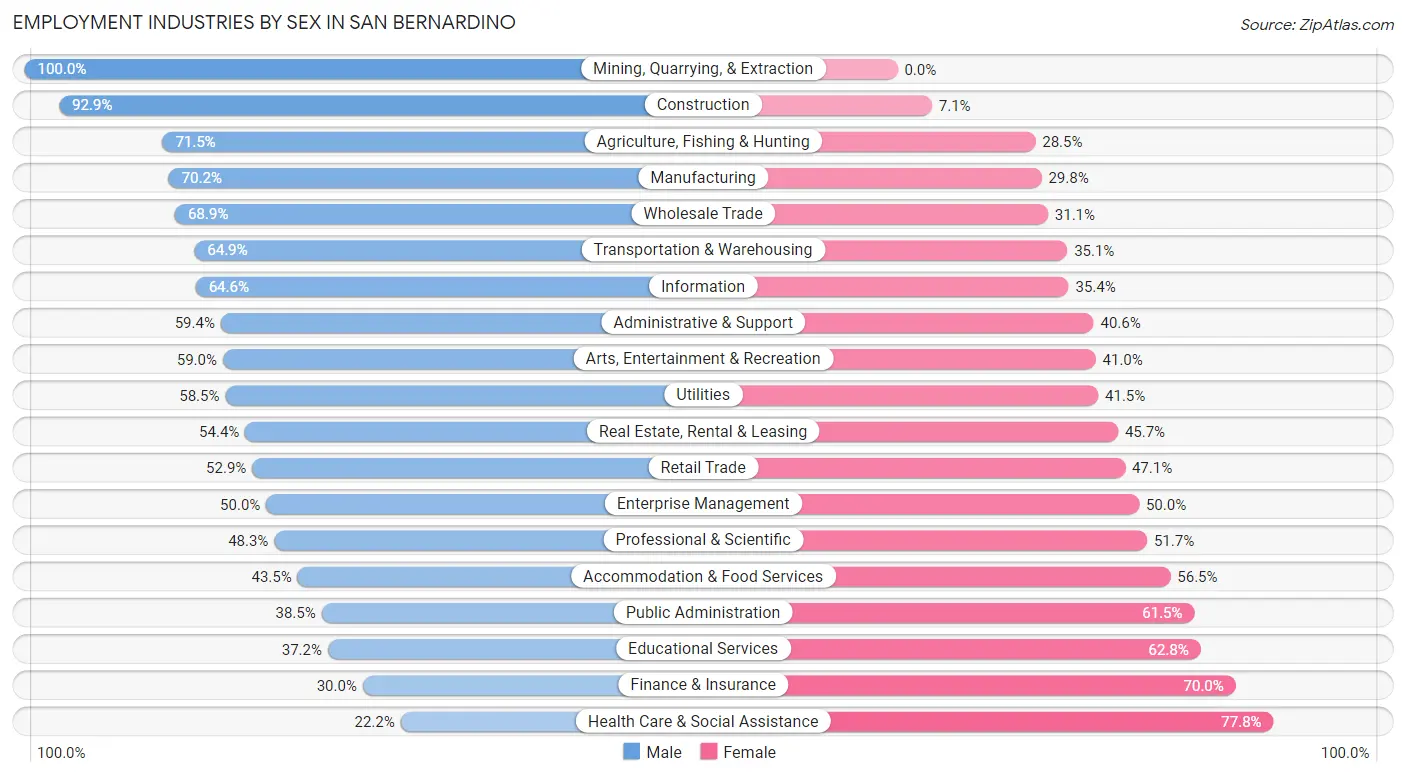
Employment Industries by Sex in San Bernardino
The San Bernardino industries that see more men than women are Mining, Quarrying, & Extraction (100.0%), Construction (92.9%), and Agriculture, Fishing & Hunting (71.5%), whereas the industries that tend to have a higher number of women are Health Care & Social Assistance (77.8%), Finance & Insurance (70.0%), and Educational Services (62.8%).
| Industry | Male | Female |
| Agriculture, Fishing & Hunting | 308 (71.5%) | 123 (28.5%) |
| Mining, Quarrying, & Extraction | 19 (100.0%) | 0 (0.0%) |
| Construction | 8,665 (92.9%) | 665 (7.1%) |
| Manufacturing | 5,033 (70.2%) | 2,139 (29.8%) |
| Wholesale Trade | 1,840 (68.9%) | 832 (31.1%) |
| Retail Trade | 6,896 (52.9%) | 6,140 (47.1%) |
| Transportation & Warehousing | 8,790 (64.9%) | 4,762 (35.1%) |
| Utilities | 280 (58.5%) | 199 (41.5%) |
| Information | 432 (64.6%) | 237 (35.4%) |
| Finance & Insurance | 481 (30.0%) | 1,122 (70.0%) |
| Real Estate, Rental & Leasing | 650 (54.3%) | 546 (45.7%) |
| Professional & Scientific | 1,281 (48.3%) | 1,369 (51.7%) |
| Enterprise Management | 8 (50.0%) | 8 (50.0%) |
| Administrative & Support | 3,867 (59.4%) | 2,643 (40.6%) |
| Educational Services | 2,454 (37.2%) | 4,135 (62.8%) |
| Health Care & Social Assistance | 2,219 (22.2%) | 7,786 (77.8%) |
| Arts, Entertainment & Recreation | 1,130 (59.0%) | 786 (41.0%) |
| Accommodation & Food Services | 2,882 (43.5%) | 3,743 (56.5%) |
| Public Administration | 1,975 (38.5%) | 3,149 (61.5%) |
| Total | 51,914 (55.5%) | 41,566 (44.5%) |
Education in San Bernardino
School Enrollment in San Bernardino
The most common levels of schooling among the 65,080 students in San Bernardino are college / undergraduate (14,674 | 22.6%), high school (14,640 | 22.5%), and middle school (14,260 | 21.9%).
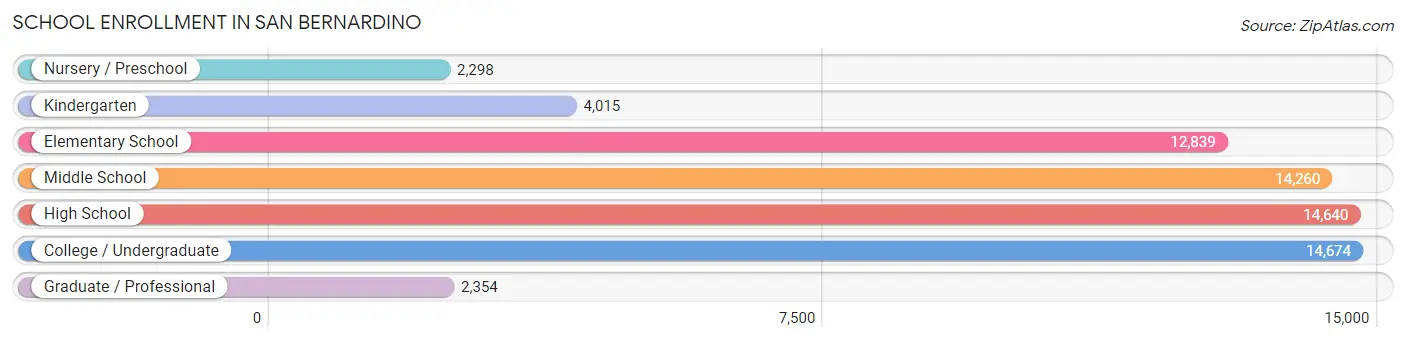
| School Level | # Students | % Students |
| Nursery / Preschool | 2,298 | 3.5% |
| Kindergarten | 4,015 | 6.2% |
| Elementary School | 12,839 | 19.7% |
| Middle School | 14,260 | 21.9% |
| High School | 14,640 | 22.5% |
| College / Undergraduate | 14,674 | 22.6% |
| Graduate / Professional | 2,354 | 3.6% |
| Total | 65,080 | 100.0% |
School Enrollment by Age by Funding Source in San Bernardino
Out of a total of 65,080 students who are enrolled in schools in San Bernardino, 4,686 (7.2%) attend a private institution, while the remaining 60,394 (92.8%) are enrolled in public schools. The age group of 25 to 34 year olds has the highest likelihood of being enrolled in private schools, with 923 (20.6% in the age bracket) enrolled. Conversely, the age group of 10 to 14 year olds has the lowest likelihood of being enrolled in a private school, with 17,257 (96.6% in the age bracket) attending a public institution.
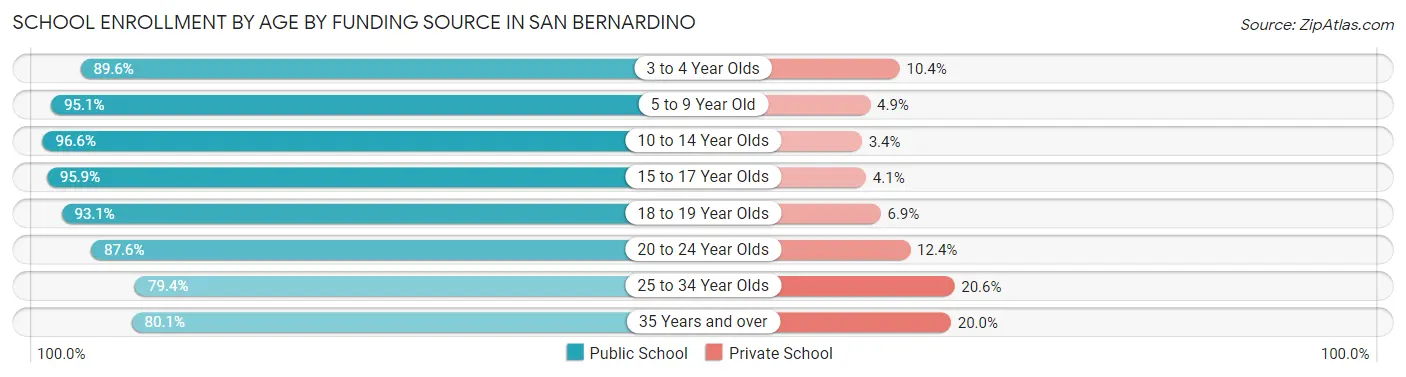
| Age Bracket | Public School | Private School |
| 3 to 4 Year Olds | 1,695 (89.6%) | 197 (10.4%) |
| 5 to 9 Year Old | 14,777 (95.1%) | 764 (4.9%) |
| 10 to 14 Year Olds | 17,257 (96.6%) | 600 (3.4%) |
| 15 to 17 Year Olds | 10,485 (95.9%) | 453 (4.1%) |
| 18 to 19 Year Olds | 3,847 (93.1%) | 284 (6.9%) |
| 20 to 24 Year Olds | 6,729 (87.6%) | 951 (12.4%) |
| 25 to 34 Year Olds | 3,557 (79.4%) | 923 (20.6%) |
| 35 Years and over | 2,050 (80.0%) | 511 (20.0%) |
| Total | 60,394 (92.8%) | 4,686 (7.2%) |
Educational Attainment by Field of Study in San Bernardino
Business (3,101 | 17.3%), social sciences (2,088 | 11.6%), education (1,908 | 10.6%), arts & humanities (1,796 | 10.0%), and science & technology (1,490 | 8.3%) are the most common fields of study among 17,971 individuals in San Bernardino who have obtained a bachelor's degree or higher.
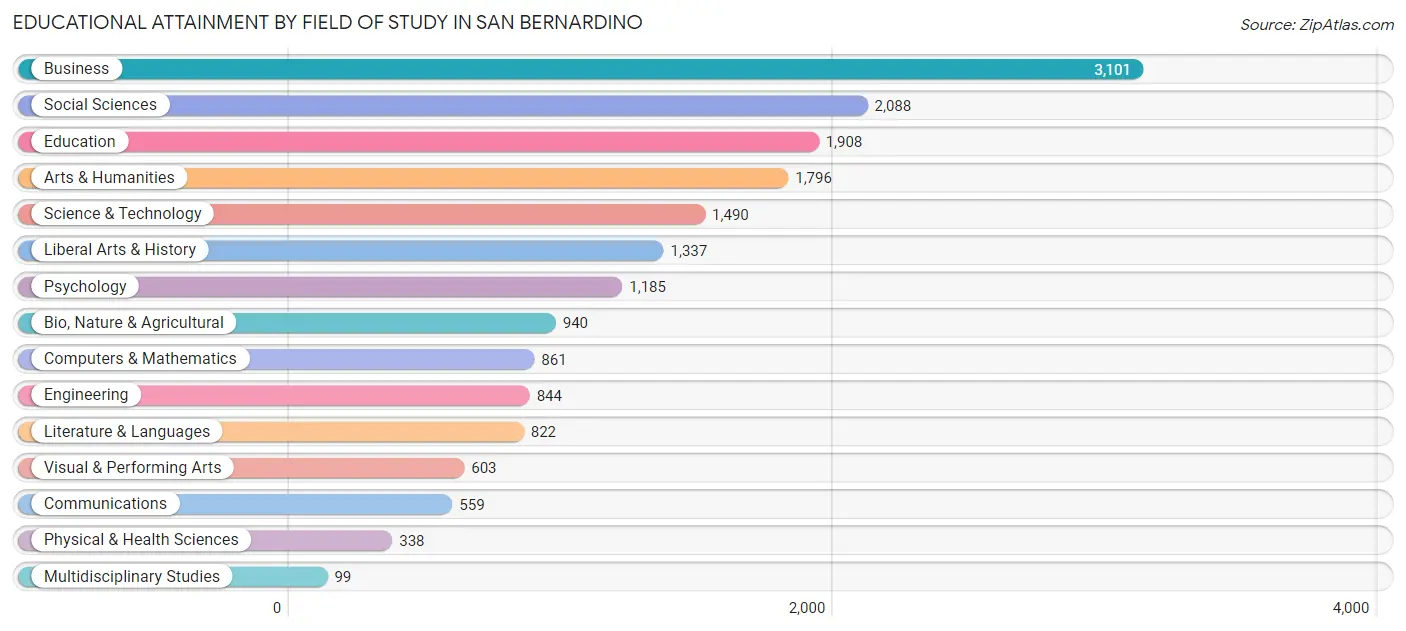
| Field of Study | # Graduates | % Graduates |
| Computers & Mathematics | 861 | 4.8% |
| Bio, Nature & Agricultural | 940 | 5.2% |
| Physical & Health Sciences | 338 | 1.9% |
| Psychology | 1,185 | 6.6% |
| Social Sciences | 2,088 | 11.6% |
| Engineering | 844 | 4.7% |
| Multidisciplinary Studies | 99 | 0.5% |
| Science & Technology | 1,490 | 8.3% |
| Business | 3,101 | 17.3% |
| Education | 1,908 | 10.6% |
| Literature & Languages | 822 | 4.6% |
| Liberal Arts & History | 1,337 | 7.4% |
| Visual & Performing Arts | 603 | 3.4% |
| Communications | 559 | 3.1% |
| Arts & Humanities | 1,796 | 10.0% |
| Total | 17,971 | 100.0% |
Transportation & Commute in San Bernardino
Vehicle Availability by Sex in San Bernardino
The most prevalent vehicle ownership categories in San Bernardino are males with 2 vehicles (16,976, accounting for 33.3%) and females with 2 vehicles (13,125, making up 42.6%).
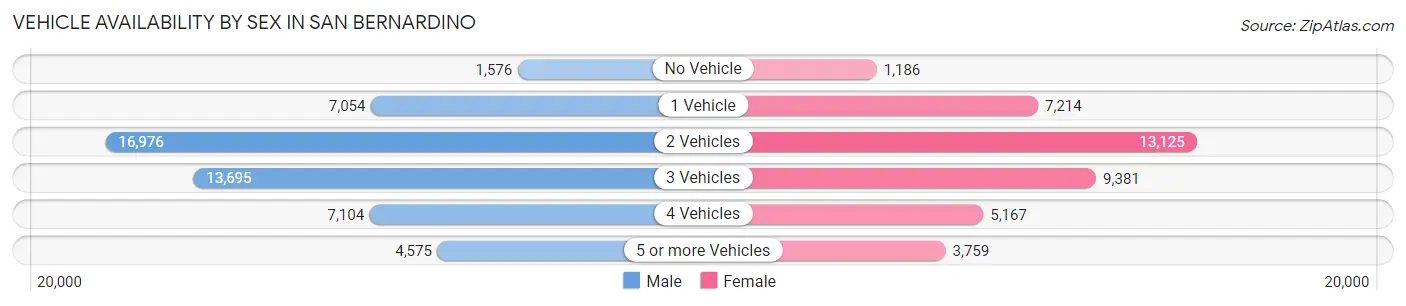
| Vehicles Available | Male | Female |
| No Vehicle | 1,576 (3.1%) | 1,186 (3.0%) |
| 1 Vehicle | 7,054 (13.8%) | 7,214 (18.1%) |
| 2 Vehicles | 16,976 (33.3%) | 13,125 (33.0%) |
| 3 Vehicles | 13,695 (26.9%) | 9,381 (23.5%) |
| 4 Vehicles | 7,104 (13.9%) | 5,167 (13.0%) |
| 5 or more Vehicles | 4,575 (9.0%) | 3,759 (9.4%) |
| Total | 50,980 (100.0%) | 39,832 (100.0%) |
Commute Time in San Bernardino
The most frequently occuring commute durations in San Bernardino are 15 to 19 minutes (16,222 commuters, 18.7%), 20 to 24 minutes (14,421 commuters, 16.6%), and 30 to 34 minutes (14,202 commuters, 16.4%).
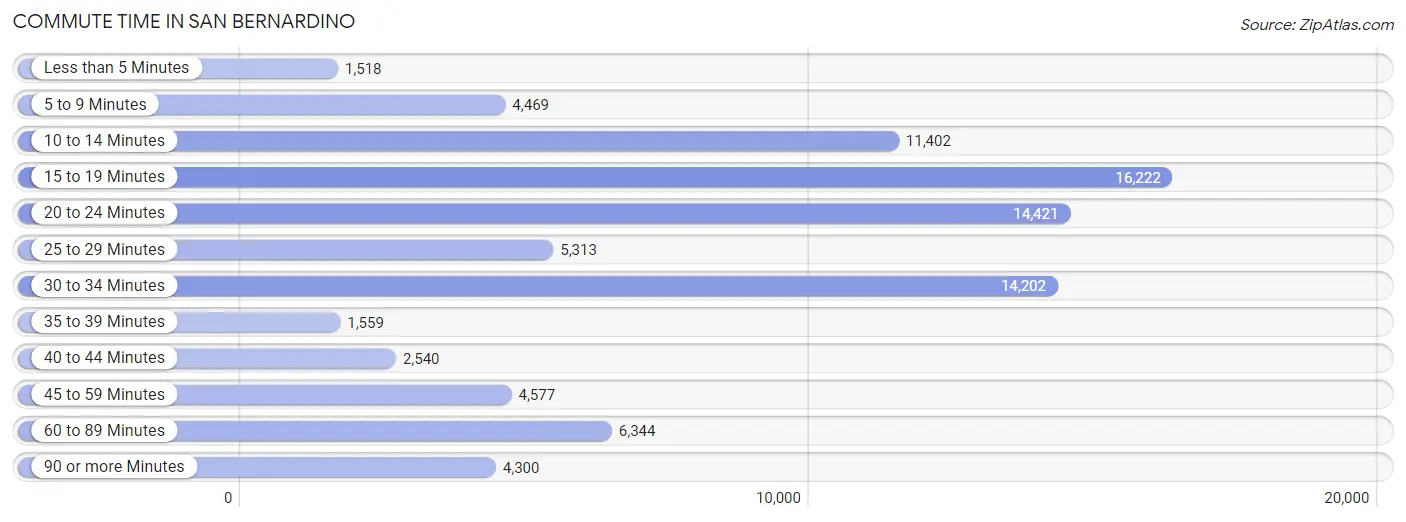
| Commute Time | # Commuters | % Commuters |
| Less than 5 Minutes | 1,518 | 1.8% |
| 5 to 9 Minutes | 4,469 | 5.1% |
| 10 to 14 Minutes | 11,402 | 13.1% |
| 15 to 19 Minutes | 16,222 | 18.7% |
| 20 to 24 Minutes | 14,421 | 16.6% |
| 25 to 29 Minutes | 5,313 | 6.1% |
| 30 to 34 Minutes | 14,202 | 16.4% |
| 35 to 39 Minutes | 1,559 | 1.8% |
| 40 to 44 Minutes | 2,540 | 2.9% |
| 45 to 59 Minutes | 4,577 | 5.3% |
| 60 to 89 Minutes | 6,344 | 7.3% |
| 90 or more Minutes | 4,300 | 5.0% |
Commute Time by Sex in San Bernardino
The most common commute times in San Bernardino are 15 to 19 minutes (8,537 commuters, 17.3%) for males and 15 to 19 minutes (7,685 commuters, 20.5%) for females.
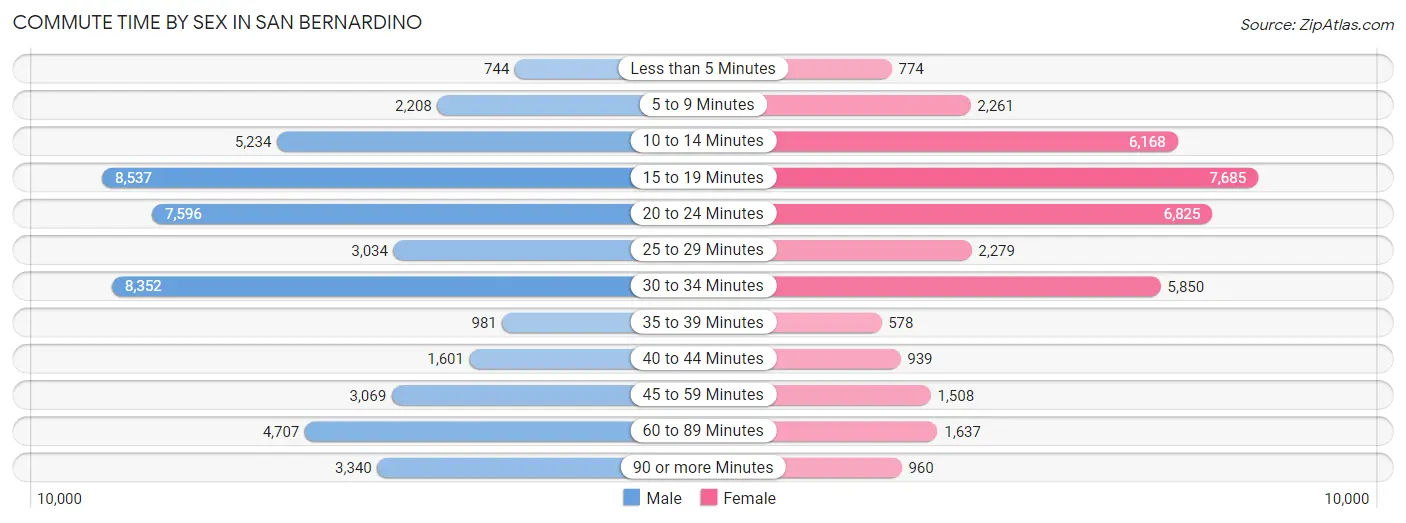
| Commute Time | Male | Female |
| Less than 5 Minutes | 744 (1.5%) | 774 (2.1%) |
| 5 to 9 Minutes | 2,208 (4.5%) | 2,261 (6.0%) |
| 10 to 14 Minutes | 5,234 (10.6%) | 6,168 (16.5%) |
| 15 to 19 Minutes | 8,537 (17.3%) | 7,685 (20.5%) |
| 20 to 24 Minutes | 7,596 (15.4%) | 6,825 (18.2%) |
| 25 to 29 Minutes | 3,034 (6.1%) | 2,279 (6.1%) |
| 30 to 34 Minutes | 8,352 (16.9%) | 5,850 (15.6%) |
| 35 to 39 Minutes | 981 (2.0%) | 578 (1.5%) |
| 40 to 44 Minutes | 1,601 (3.2%) | 939 (2.5%) |
| 45 to 59 Minutes | 3,069 (6.2%) | 1,508 (4.0%) |
| 60 to 89 Minutes | 4,707 (9.5%) | 1,637 (4.4%) |
| 90 or more Minutes | 3,340 (6.8%) | 960 (2.6%) |
Time of Departure to Work by Sex in San Bernardino
The most frequent times of departure to work in San Bernardino are 12:00 AM to 4:59 AM (8,236, 16.7%) for males and 7:00 AM to 7:29 AM (4,609, 12.3%) for females.
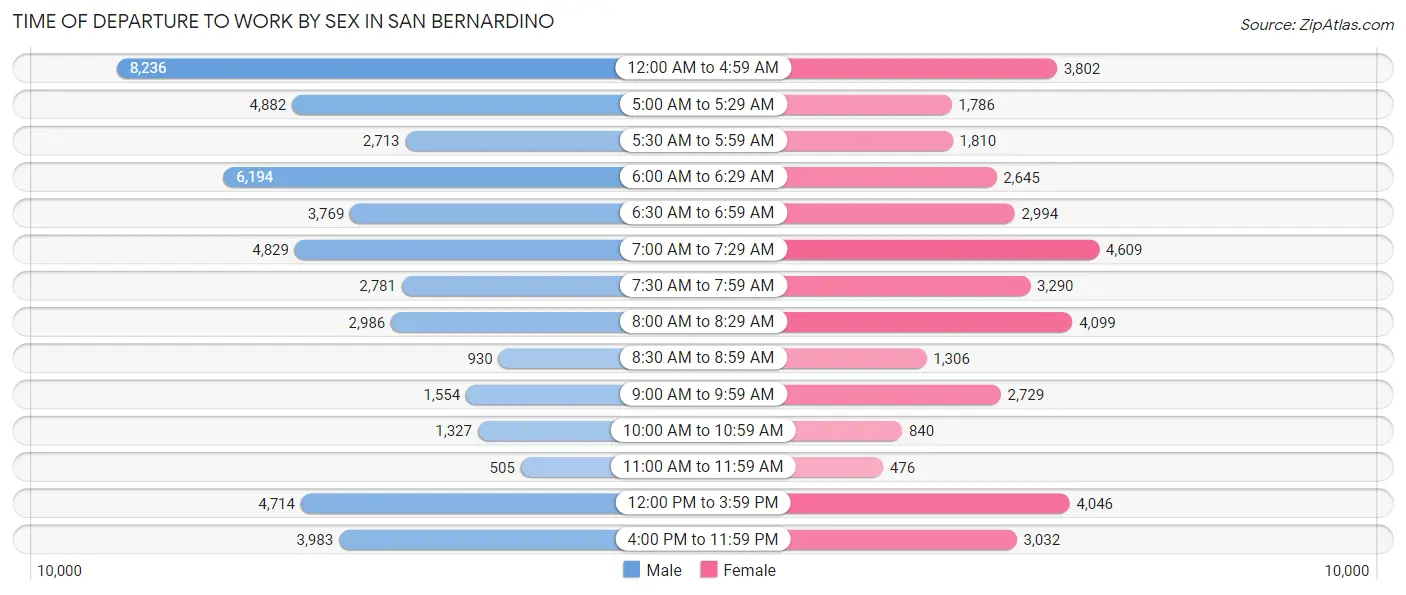
| Time of Departure | Male | Female |
| 12:00 AM to 4:59 AM | 8,236 (16.7%) | 3,802 (10.2%) |
| 5:00 AM to 5:29 AM | 4,882 (9.9%) | 1,786 (4.8%) |
| 5:30 AM to 5:59 AM | 2,713 (5.5%) | 1,810 (4.8%) |
| 6:00 AM to 6:29 AM | 6,194 (12.5%) | 2,645 (7.1%) |
| 6:30 AM to 6:59 AM | 3,769 (7.6%) | 2,994 (8.0%) |
| 7:00 AM to 7:29 AM | 4,829 (9.8%) | 4,609 (12.3%) |
| 7:30 AM to 7:59 AM | 2,781 (5.6%) | 3,290 (8.8%) |
| 8:00 AM to 8:29 AM | 2,986 (6.0%) | 4,099 (10.9%) |
| 8:30 AM to 8:59 AM | 930 (1.9%) | 1,306 (3.5%) |
| 9:00 AM to 9:59 AM | 1,554 (3.2%) | 2,729 (7.3%) |
| 10:00 AM to 10:59 AM | 1,327 (2.7%) | 840 (2.2%) |
| 11:00 AM to 11:59 AM | 505 (1.0%) | 476 (1.3%) |
| 12:00 PM to 3:59 PM | 4,714 (9.5%) | 4,046 (10.8%) |
| 4:00 PM to 11:59 PM | 3,983 (8.1%) | 3,032 (8.1%) |
| Total | 49,403 (100.0%) | 37,464 (100.0%) |
Housing Occupancy in San Bernardino
Occupancy by Ownership in San Bernardino
Of the total 62,486 dwellings in San Bernardino, owner-occupied units account for 30,532 (48.9%), while renter-occupied units make up 31,954 (51.1%).
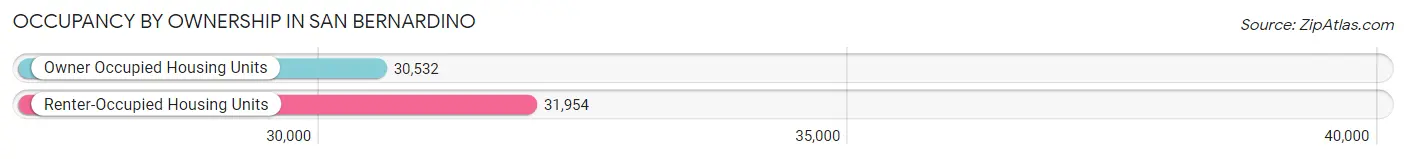
| Occupancy | # Housing Units | % Housing Units |
| Owner Occupied Housing Units | 30,532 | 48.9% |
| Renter-Occupied Housing Units | 31,954 | 51.1% |
| Total Occupied Housing Units | 62,486 | 100.0% |
Occupancy by Household Size in San Bernardino
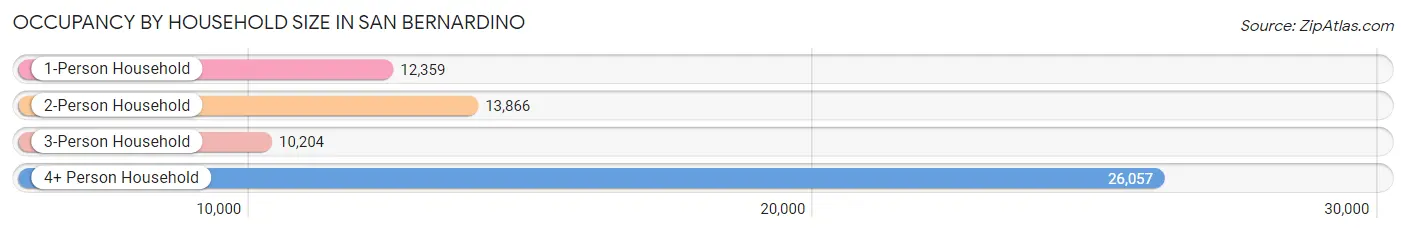
| Household Size | # Housing Units | % Housing Units |
| 1-Person Household | 12,359 | 19.8% |
| 2-Person Household | 13,866 | 22.2% |
| 3-Person Household | 10,204 | 16.3% |
| 4+ Person Household | 26,057 | 41.7% |
| Total Housing Units | 62,486 | 100.0% |
Occupancy by Ownership by Household Size in San Bernardino
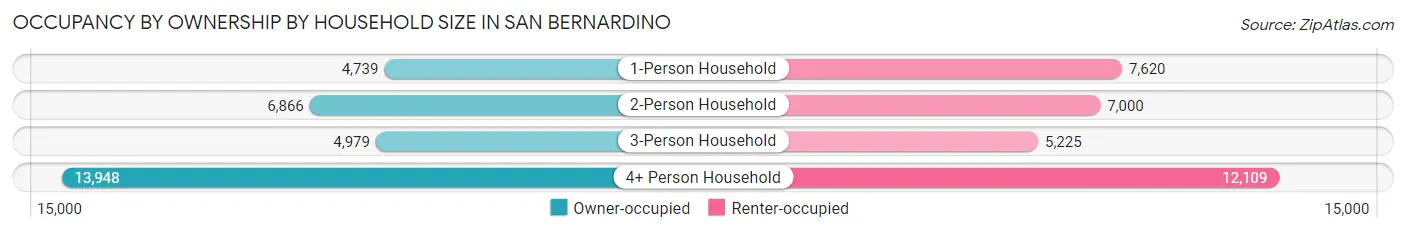
| Household Size | Owner-occupied | Renter-occupied |
| 1-Person Household | 4,739 (38.3%) | 7,620 (61.7%) |
| 2-Person Household | 6,866 (49.5%) | 7,000 (50.5%) |
| 3-Person Household | 4,979 (48.8%) | 5,225 (51.2%) |
| 4+ Person Household | 13,948 (53.5%) | 12,109 (46.5%) |
| Total Housing Units | 30,532 (48.9%) | 31,954 (51.1%) |
Occupancy by Educational Attainment in San Bernardino
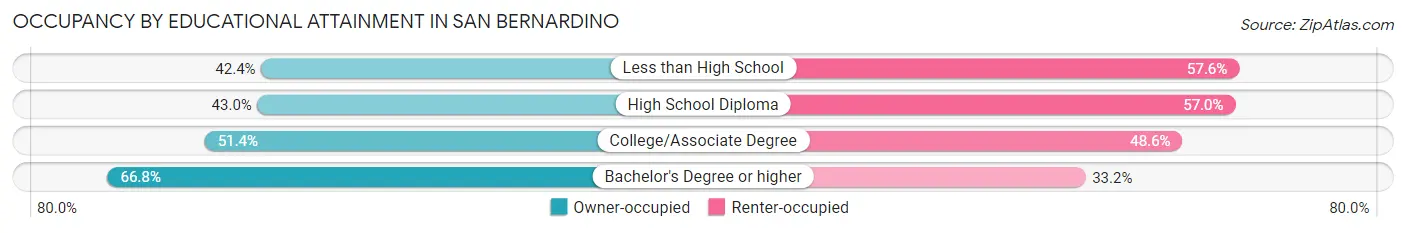
| Household Size | Owner-occupied | Renter-occupied |
| Less than High School | 6,185 (42.4%) | 8,387 (57.6%) |
| High School Diploma | 8,438 (43.0%) | 11,173 (57.0%) |
| College/Associate Degree | 10,040 (51.4%) | 9,482 (48.6%) |
| Bachelor's Degree or higher | 5,869 (66.8%) | 2,912 (33.2%) |
Occupancy by Age of Householder in San Bernardino
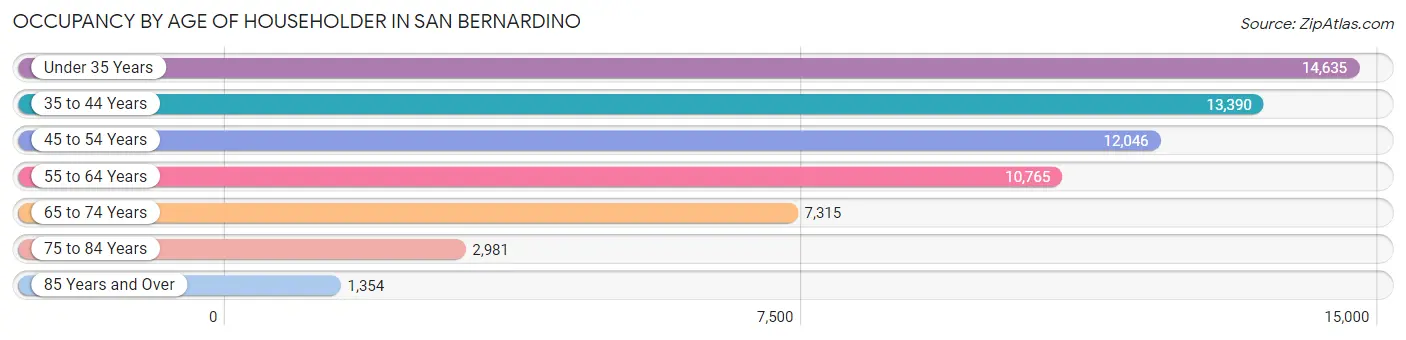
| Age Bracket | # Households | % Households |
| Under 35 Years | 14,635 | 23.4% |
| 35 to 44 Years | 13,390 | 21.4% |
| 45 to 54 Years | 12,046 | 19.3% |
| 55 to 64 Years | 10,765 | 17.2% |
| 65 to 74 Years | 7,315 | 11.7% |
| 75 to 84 Years | 2,981 | 4.8% |
| 85 Years and Over | 1,354 | 2.2% |
| Total | 62,486 | 100.0% |
Housing Finances in San Bernardino
Median Income by Occupancy in San Bernardino
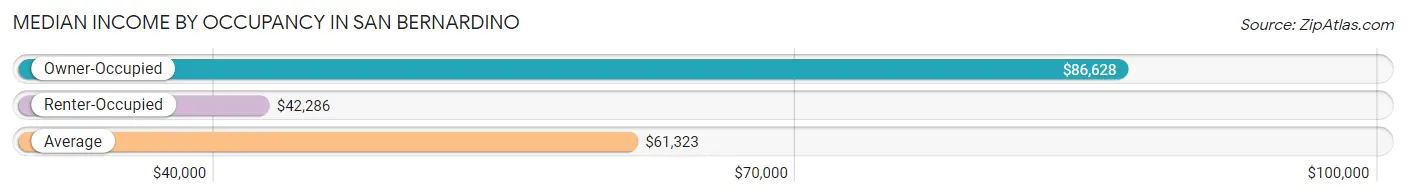
| Occupancy Type | # Households | Median Income |
| Owner-Occupied | 30,532 (48.9%) | $86,628 |
| Renter-Occupied | 31,954 (51.1%) | $42,286 |
| Average | 62,486 (100.0%) | $61,323 |
Occupancy by Householder Income Bracket in San Bernardino
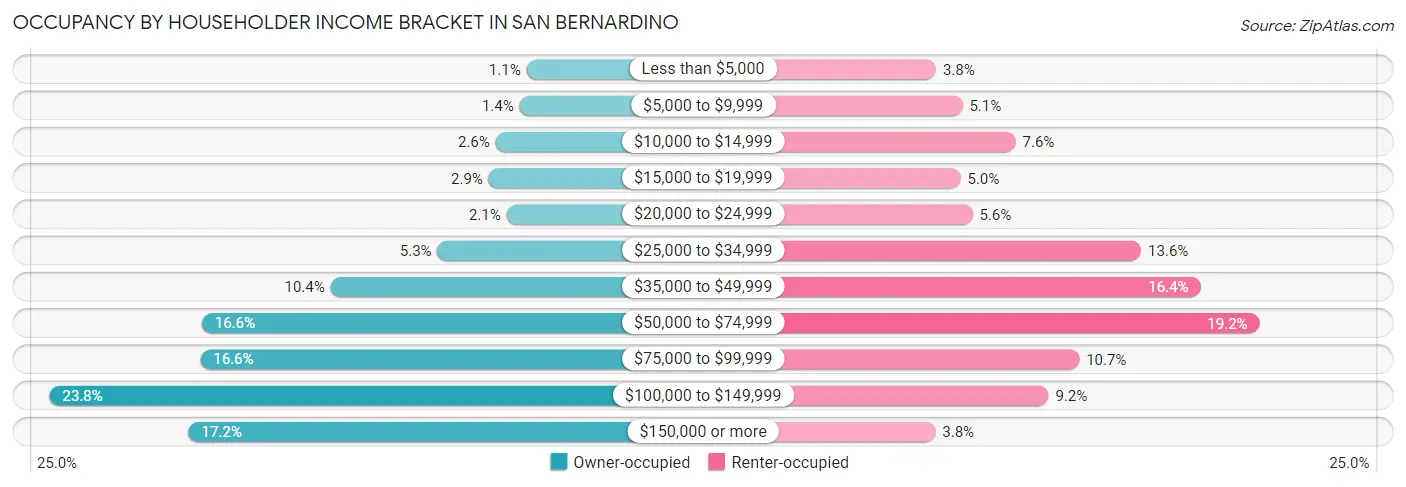
| Income Bracket | Owner-occupied | Renter-occupied |
| Less than $5,000 | 335 (1.1%) | 1,225 (3.8%) |
| $5,000 to $9,999 | 436 (1.4%) | 1,625 (5.1%) |
| $10,000 to $14,999 | 784 (2.6%) | 2,436 (7.6%) |
| $15,000 to $19,999 | 884 (2.9%) | 1,598 (5.0%) |
| $20,000 to $24,999 | 627 (2.1%) | 1,779 (5.6%) |
| $25,000 to $34,999 | 1,629 (5.3%) | 4,347 (13.6%) |
| $35,000 to $49,999 | 3,183 (10.4%) | 5,246 (16.4%) |
| $50,000 to $74,999 | 5,055 (16.6%) | 6,145 (19.2%) |
| $75,000 to $99,999 | 5,076 (16.6%) | 3,404 (10.6%) |
| $100,000 to $149,999 | 7,274 (23.8%) | 2,936 (9.2%) |
| $150,000 or more | 5,249 (17.2%) | 1,213 (3.8%) |
| Total | 30,532 (100.0%) | 31,954 (100.0%) |
Monthly Housing Cost Tiers in San Bernardino
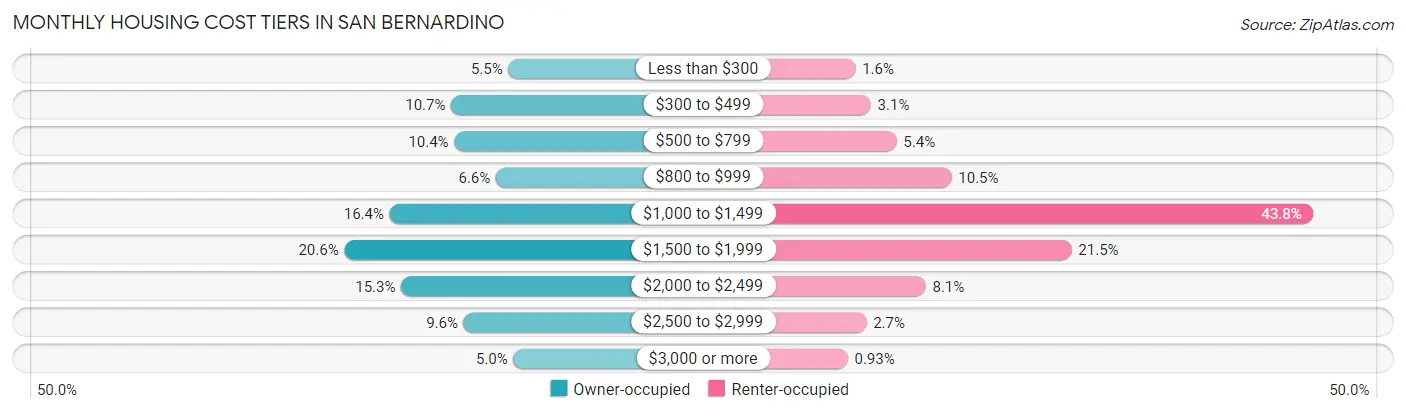
| Monthly Cost | Owner-occupied | Renter-occupied |
| Less than $300 | 1,664 (5.4%) | 525 (1.6%) |
| $300 to $499 | 3,274 (10.7%) | 979 (3.1%) |
| $500 to $799 | 3,186 (10.4%) | 1,734 (5.4%) |
| $800 to $999 | 2,011 (6.6%) | 3,353 (10.5%) |
| $1,000 to $1,499 | 5,002 (16.4%) | 14,006 (43.8%) |
| $1,500 to $1,999 | 6,275 (20.5%) | 6,884 (21.5%) |
| $2,000 to $2,499 | 4,678 (15.3%) | 2,593 (8.1%) |
| $2,500 to $2,999 | 2,923 (9.6%) | 846 (2.6%) |
| $3,000 or more | 1,519 (5.0%) | 296 (0.9%) |
| Total | 30,532 (100.0%) | 31,954 (100.0%) |
Physical Housing Characteristics in San Bernardino
Housing Structures in San Bernardino
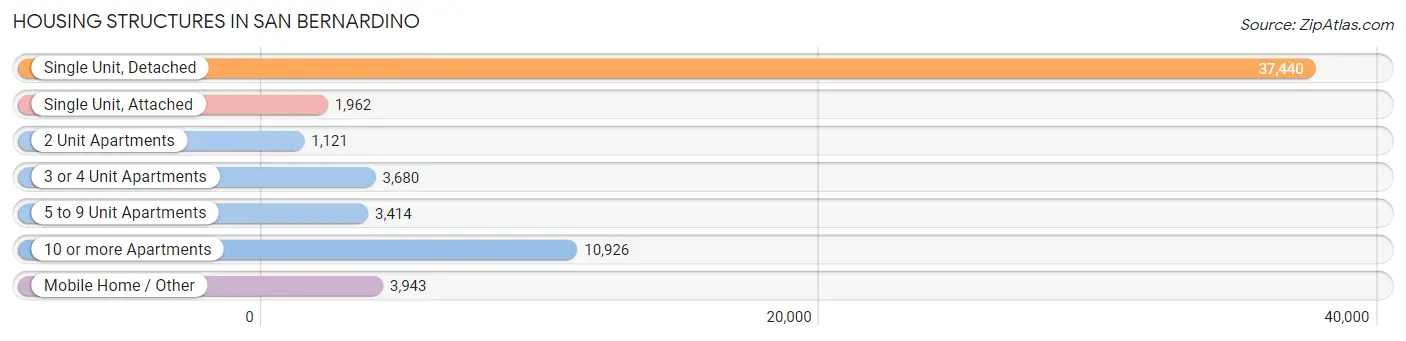
| Structure Type | # Housing Units | % Housing Units |
| Single Unit, Detached | 37,440 | 59.9% |
| Single Unit, Attached | 1,962 | 3.1% |
| 2 Unit Apartments | 1,121 | 1.8% |
| 3 or 4 Unit Apartments | 3,680 | 5.9% |
| 5 to 9 Unit Apartments | 3,414 | 5.5% |
| 10 or more Apartments | 10,926 | 17.5% |
| Mobile Home / Other | 3,943 | 6.3% |
| Total | 62,486 | 100.0% |
Housing Structures by Occupancy in San Bernardino
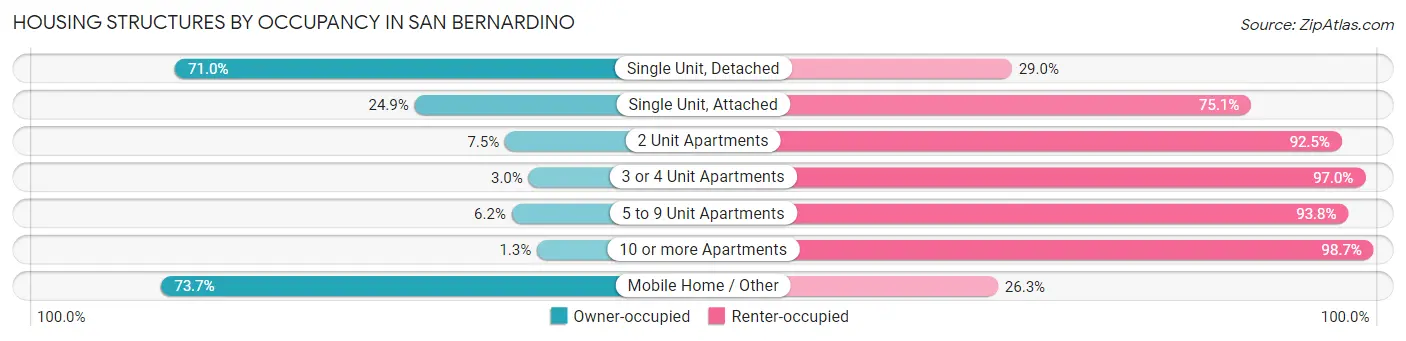
| Structure Type | Owner-occupied | Renter-occupied |
| Single Unit, Detached | 26,588 (71.0%) | 10,852 (29.0%) |
| Single Unit, Attached | 489 (24.9%) | 1,473 (75.1%) |
| 2 Unit Apartments | 84 (7.5%) | 1,037 (92.5%) |
| 3 or 4 Unit Apartments | 109 (3.0%) | 3,571 (97.0%) |
| 5 to 9 Unit Apartments | 212 (6.2%) | 3,202 (93.8%) |
| 10 or more Apartments | 145 (1.3%) | 10,781 (98.7%) |
| Mobile Home / Other | 2,905 (73.7%) | 1,038 (26.3%) |
| Total | 30,532 (48.9%) | 31,954 (51.1%) |
Housing Structures by Number of Rooms in San Bernardino
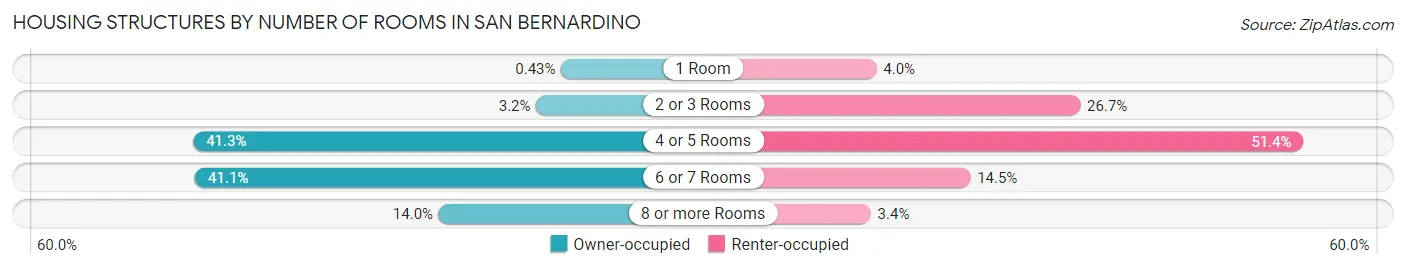
| Number of Rooms | Owner-occupied | Renter-occupied |
| 1 Room | 130 (0.4%) | 1,290 (4.0%) |
| 2 or 3 Rooms | 977 (3.2%) | 8,519 (26.7%) |
| 4 or 5 Rooms | 12,604 (41.3%) | 16,437 (51.4%) |
| 6 or 7 Rooms | 12,539 (41.1%) | 4,619 (14.5%) |
| 8 or more Rooms | 4,282 (14.0%) | 1,089 (3.4%) |
| Total | 30,532 (100.0%) | 31,954 (100.0%) |
Housing Structure by Heating Type in San Bernardino
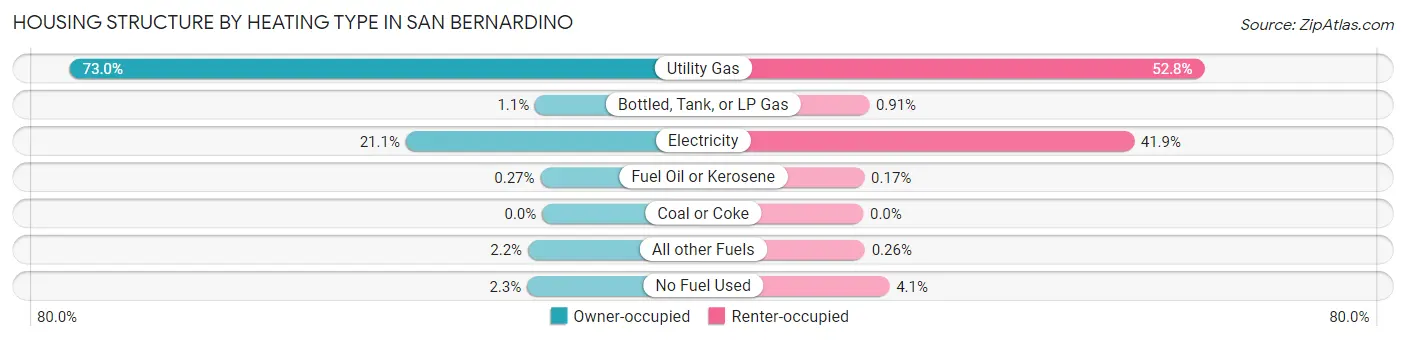
| Heating Type | Owner-occupied | Renter-occupied |
| Utility Gas | 22,301 (73.0%) | 16,858 (52.8%) |
| Bottled, Tank, or LP Gas | 333 (1.1%) | 291 (0.9%) |
| Electricity | 6,435 (21.1%) | 13,374 (41.8%) |
| Fuel Oil or Kerosene | 82 (0.3%) | 55 (0.2%) |
| Coal or Coke | 0 (0.0%) | 0 (0.0%) |
| All other Fuels | 669 (2.2%) | 82 (0.3%) |
| No Fuel Used | 712 (2.3%) | 1,294 (4.1%) |
| Total | 30,532 (100.0%) | 31,954 (100.0%) |
Household Vehicle Usage in San Bernardino
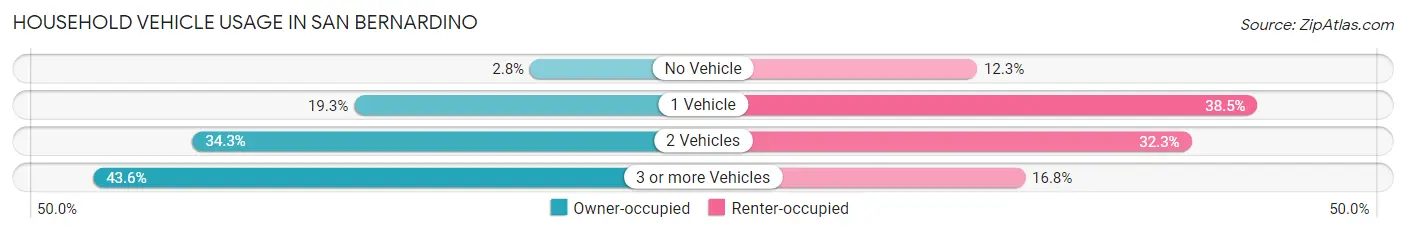
| Vehicles per Household | Owner-occupied | Renter-occupied |
| No Vehicle | 865 (2.8%) | 3,941 (12.3%) |
| 1 Vehicle | 5,876 (19.3%) | 12,303 (38.5%) |
| 2 Vehicles | 10,482 (34.3%) | 10,335 (32.3%) |
| 3 or more Vehicles | 13,309 (43.6%) | 5,375 (16.8%) |
| Total | 30,532 (100.0%) | 31,954 (100.0%) |
Real Estate & Mortgages in San Bernardino
Real Estate and Mortgage Overview in San Bernardino
| Characteristic | Without Mortgage | With Mortgage |
| Housing Units | 9,721 | 20,811 |
| Median Property Value | $301,400 | $362,600 |
| Median Household Income | $57,640 | $4,344 |
| Monthly Housing Costs | $496 | $1,507 |
| Real Estate Taxes | $1,726 | $389 |
Property Value by Mortgage Status in San Bernardino
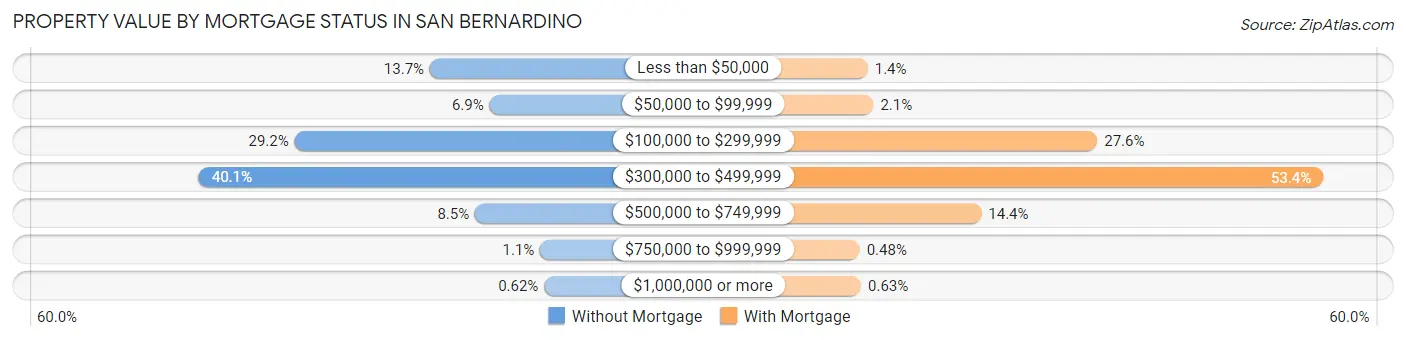
| Property Value | Without Mortgage | With Mortgage |
| Less than $50,000 | 1,330 (13.7%) | 291 (1.4%) |
| $50,000 to $99,999 | 667 (6.9%) | 427 (2.1%) |
| $100,000 to $299,999 | 2,834 (29.1%) | 5,750 (27.6%) |
| $300,000 to $499,999 | 3,897 (40.1%) | 11,120 (53.4%) |
| $500,000 to $749,999 | 828 (8.5%) | 2,992 (14.4%) |
| $750,000 to $999,999 | 105 (1.1%) | 99 (0.5%) |
| $1,000,000 or more | 60 (0.6%) | 132 (0.6%) |
| Total | 9,721 (100.0%) | 20,811 (100.0%) |
Household Income by Mortgage Status in San Bernardino
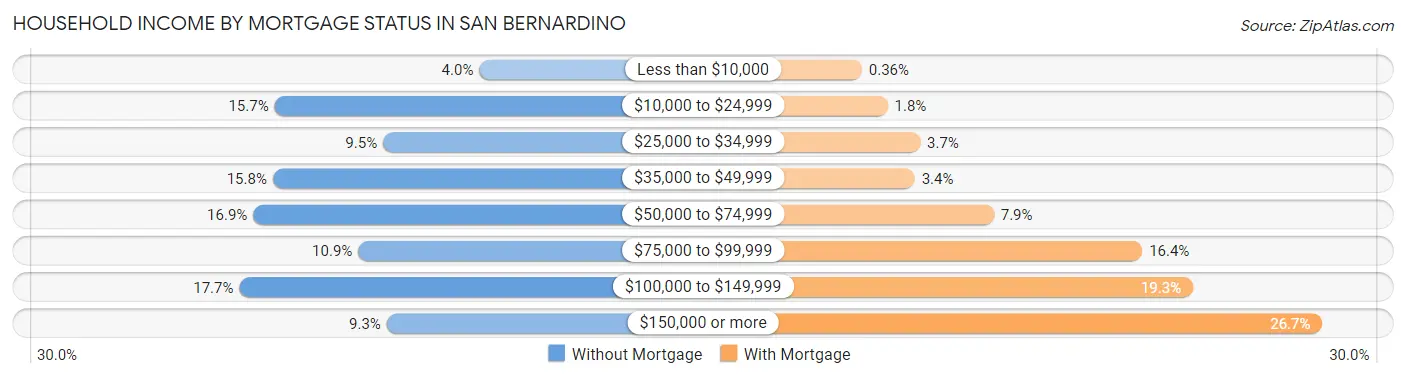
| Household Income | Without Mortgage | With Mortgage |
| Less than $10,000 | 391 (4.0%) | 75 (0.4%) |
| $10,000 to $24,999 | 1,528 (15.7%) | 380 (1.8%) |
| $25,000 to $34,999 | 925 (9.5%) | 767 (3.7%) |
| $35,000 to $49,999 | 1,538 (15.8%) | 704 (3.4%) |
| $50,000 to $74,999 | 1,647 (16.9%) | 1,645 (7.9%) |
| $75,000 to $99,999 | 1,063 (10.9%) | 3,408 (16.4%) |
| $100,000 to $149,999 | 1,724 (17.7%) | 4,013 (19.3%) |
| $150,000 or more | 905 (9.3%) | 5,550 (26.7%) |
| Total | 9,721 (100.0%) | 20,811 (100.0%) |
Property Value to Household Income Ratio in San Bernardino
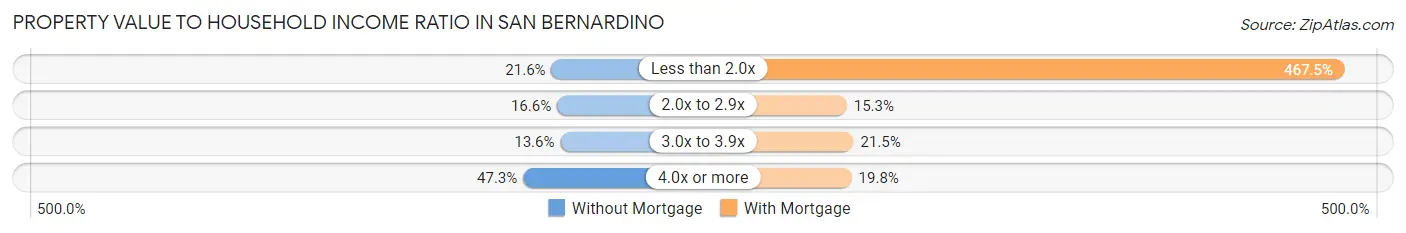
| Value-to-Income Ratio | Without Mortgage | With Mortgage |
| Less than 2.0x | 2,104 (21.6%) | 97,291 (467.5%) |
| 2.0x to 2.9x | 1,612 (16.6%) | 3,184 (15.3%) |
| 3.0x to 3.9x | 1,320 (13.6%) | 4,468 (21.5%) |
| 4.0x or more | 4,602 (47.3%) | 4,110 (19.8%) |
| Total | 9,721 (100.0%) | 20,811 (100.0%) |
Real Estate Taxes by Mortgage Status in San Bernardino
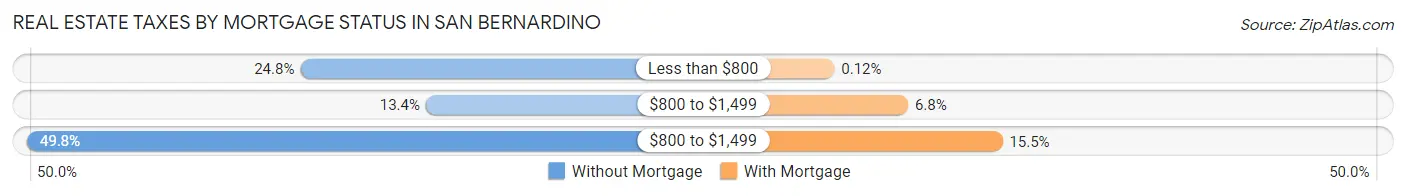
| Property Taxes | Without Mortgage | With Mortgage |
| Less than $800 | 2,414 (24.8%) | 25 (0.1%) |
| $800 to $1,499 | 1,299 (13.4%) | 1,424 (6.8%) |
| $800 to $1,499 | 4,840 (49.8%) | 3,219 (15.5%) |
| Total | 9,721 (100.0%) | 20,811 (100.0%) |
Health & Disability in San Bernardino
Health Insurance Coverage by Age in San Bernardino
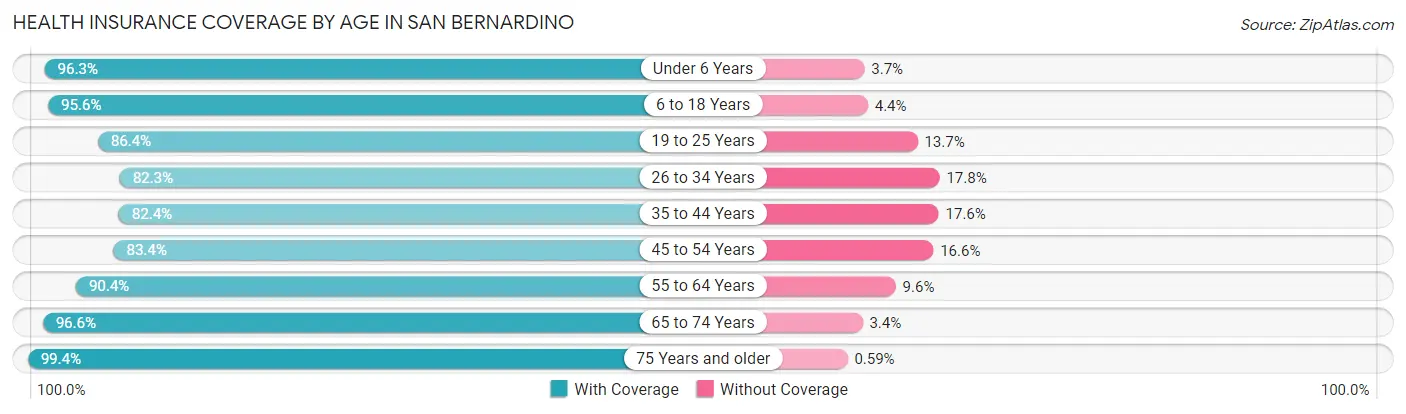
| Age Bracket | With Coverage | Without Coverage |
| Under 6 Years | 18,037 (96.3%) | 700 (3.7%) |
| 6 to 18 Years | 44,782 (95.6%) | 2,053 (4.4%) |
| 19 to 25 Years | 21,030 (86.4%) | 3,325 (13.7%) |
| 26 to 34 Years | 26,249 (82.3%) | 5,666 (17.7%) |
| 35 to 44 Years | 22,692 (82.4%) | 4,844 (17.6%) |
| 45 to 54 Years | 20,303 (83.4%) | 4,039 (16.6%) |
| 55 to 64 Years | 17,942 (90.4%) | 1,901 (9.6%) |
| 65 to 74 Years | 12,557 (96.6%) | 440 (3.4%) |
| 75 Years and older | 7,687 (99.4%) | 46 (0.6%) |
| Total | 191,279 (89.3%) | 23,014 (10.7%) |
Health Insurance Coverage by Citizenship Status in San Bernardino
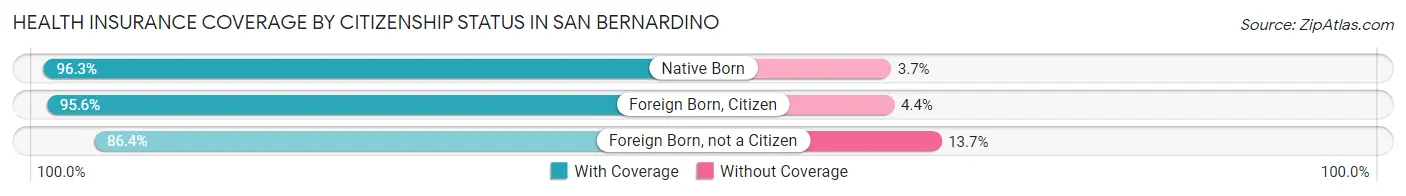
| Citizenship Status | With Coverage | Without Coverage |
| Native Born | 18,037 (96.3%) | 700 (3.7%) |
| Foreign Born, Citizen | 44,782 (95.6%) | 2,053 (4.4%) |
| Foreign Born, not a Citizen | 21,030 (86.4%) | 3,325 (13.7%) |
Health Insurance Coverage by Household Income in San Bernardino
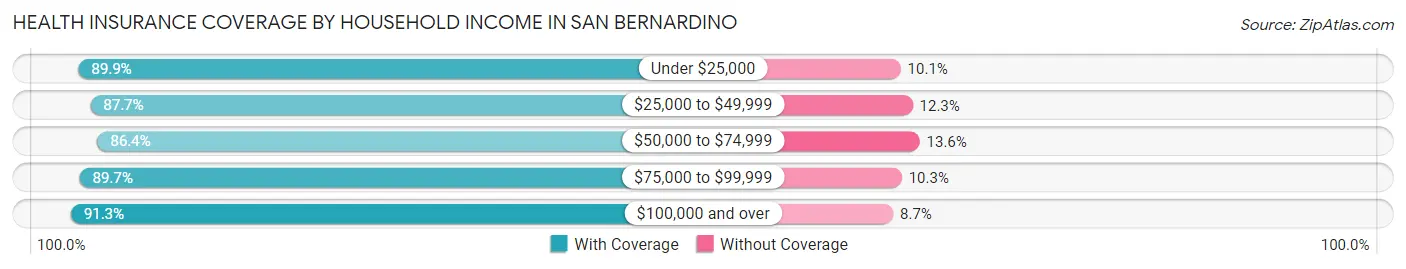
| Household Income | With Coverage | Without Coverage |
| Under $25,000 | 24,778 (89.9%) | 2,782 (10.1%) |
| $25,000 to $49,999 | 39,318 (87.7%) | 5,530 (12.3%) |
| $50,000 to $74,999 | 33,682 (86.4%) | 5,320 (13.6%) |
| $75,000 to $99,999 | 27,565 (89.7%) | 3,161 (10.3%) |
| $100,000 and over | 63,487 (91.3%) | 6,024 (8.7%) |
Public vs Private Health Insurance Coverage by Age in San Bernardino
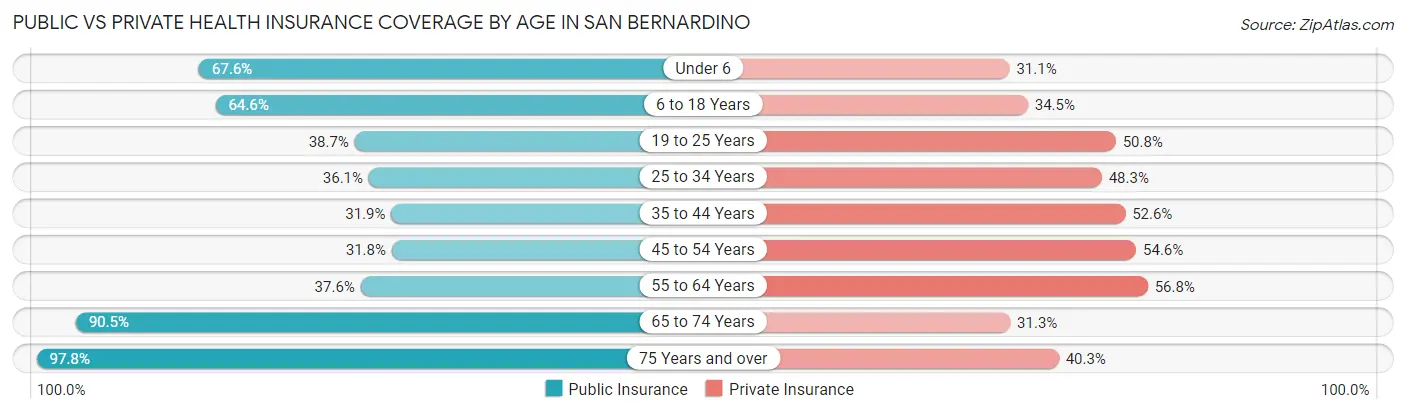
| Age Bracket | Public Insurance | Private Insurance |
| Under 6 | 12,674 (67.6%) | 5,833 (31.1%) |
| 6 to 18 Years | 30,238 (64.6%) | 16,173 (34.5%) |
| 19 to 25 Years | 9,432 (38.7%) | 12,383 (50.8%) |
| 25 to 34 Years | 11,520 (36.1%) | 15,398 (48.2%) |
| 35 to 44 Years | 8,794 (31.9%) | 14,485 (52.6%) |
| 45 to 54 Years | 7,750 (31.8%) | 13,297 (54.6%) |
| 55 to 64 Years | 7,464 (37.6%) | 11,267 (56.8%) |
| 65 to 74 Years | 11,764 (90.5%) | 4,062 (31.2%) |
| 75 Years and over | 7,561 (97.8%) | 3,113 (40.3%) |
| Total | 107,197 (50.0%) | 96,011 (44.8%) |
Disability Status by Sex by Age in San Bernardino
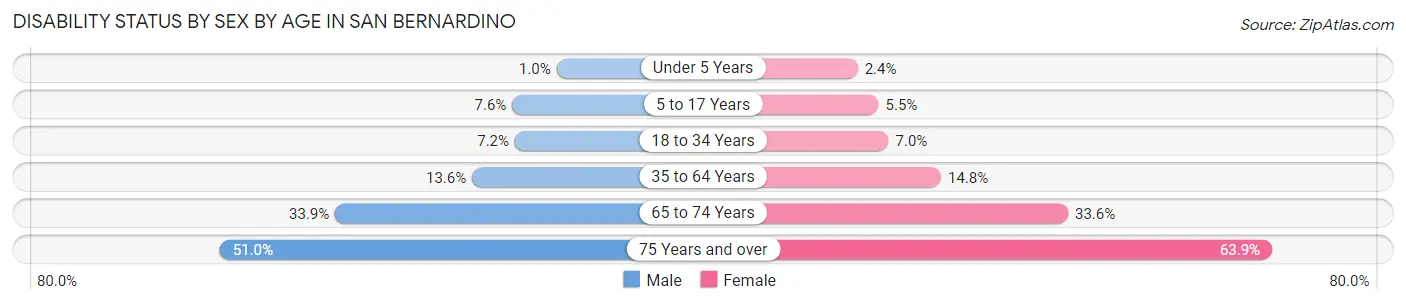
| Age Bracket | Male | Female |
| Under 5 Years | 73 (1.0%) | 184 (2.4%) |
| 5 to 17 Years | 1,815 (7.6%) | 1,229 (5.5%) |
| 18 to 34 Years | 2,172 (7.2%) | 2,097 (7.0%) |
| 35 to 64 Years | 4,863 (13.6%) | 5,290 (14.7%) |
| 65 to 74 Years | 1,924 (33.9%) | 2,459 (33.6%) |
| 75 Years and over | 1,498 (51.0%) | 3,064 (63.9%) |
Disability Class by Sex by Age in San Bernardino
Disability Class: Hearing Difficulty
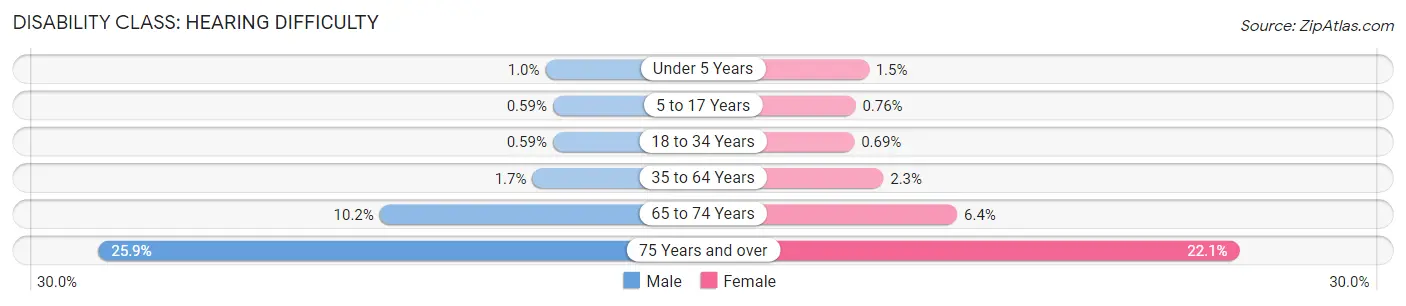
| Age Bracket | Male | Female |
| Under 5 Years | 73 (1.0%) | 117 (1.5%) |
| 5 to 17 Years | 141 (0.6%) | 172 (0.8%) |
| 18 to 34 Years | 178 (0.6%) | 209 (0.7%) |
| 35 to 64 Years | 620 (1.7%) | 829 (2.3%) |
| 65 to 74 Years | 581 (10.2%) | 470 (6.4%) |
| 75 Years and over | 760 (25.9%) | 1,062 (22.1%) |
Disability Class: Vision Difficulty
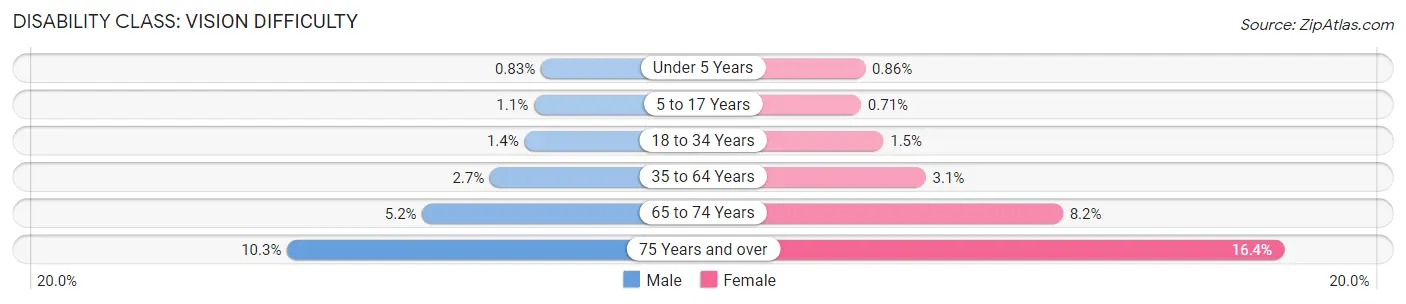
| Age Bracket | Male | Female |
| Under 5 Years | 61 (0.8%) | 67 (0.9%) |
| 5 to 17 Years | 261 (1.1%) | 159 (0.7%) |
| 18 to 34 Years | 435 (1.4%) | 464 (1.5%) |
| 35 to 64 Years | 974 (2.7%) | 1,114 (3.1%) |
| 65 to 74 Years | 297 (5.2%) | 600 (8.2%) |
| 75 Years and over | 301 (10.2%) | 787 (16.4%) |
Disability Class: Cognitive Difficulty
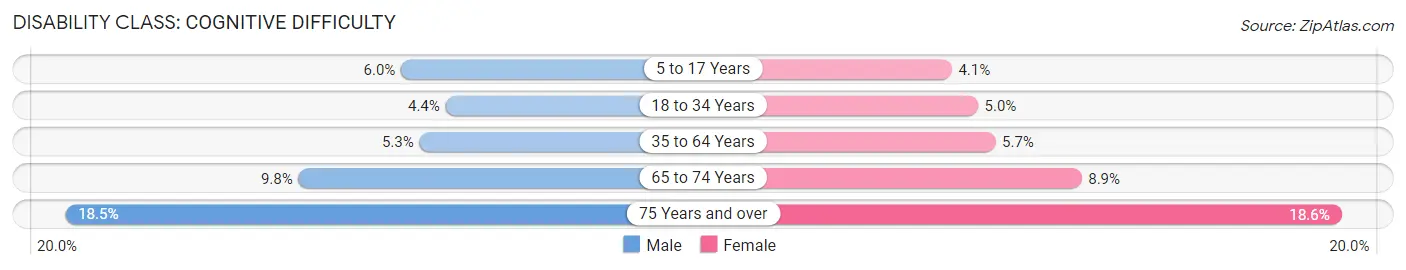
| Age Bracket | Male | Female |
| 5 to 17 Years | 1,437 (6.0%) | 916 (4.1%) |
| 18 to 34 Years | 1,318 (4.4%) | 1,520 (5.0%) |
| 35 to 64 Years | 1,914 (5.3%) | 2,041 (5.7%) |
| 65 to 74 Years | 558 (9.8%) | 651 (8.9%) |
| 75 Years and over | 543 (18.5%) | 890 (18.5%) |
Disability Class: Ambulatory Difficulty
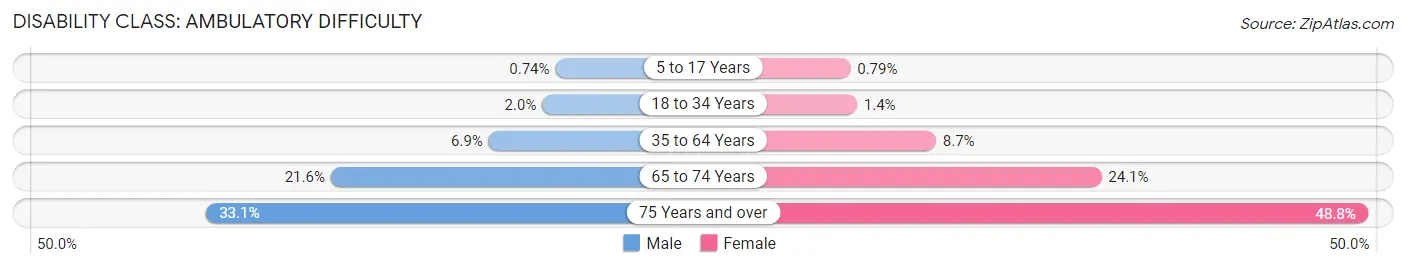
| Age Bracket | Male | Female |
| 5 to 17 Years | 176 (0.7%) | 179 (0.8%) |
| 18 to 34 Years | 590 (2.0%) | 423 (1.4%) |
| 35 to 64 Years | 2,485 (6.9%) | 3,132 (8.7%) |
| 65 to 74 Years | 1,226 (21.6%) | 1,763 (24.1%) |
| 75 Years and over | 973 (33.1%) | 2,341 (48.8%) |
Disability Class: Self-Care Difficulty
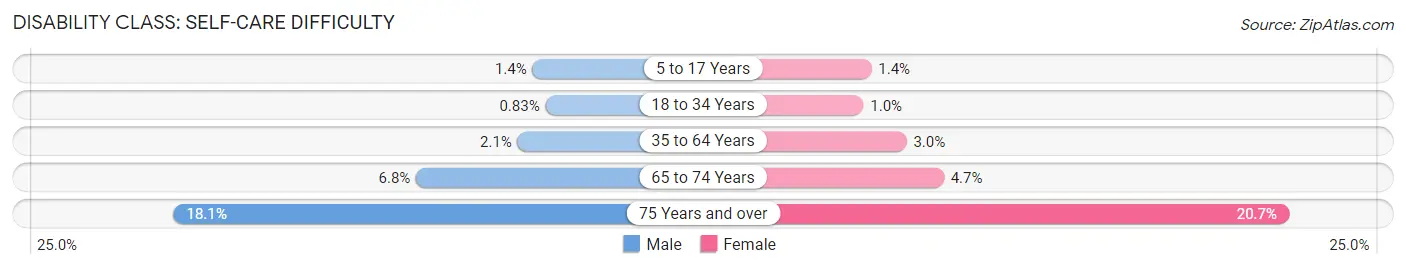
| Age Bracket | Male | Female |
| 5 to 17 Years | 341 (1.4%) | 308 (1.4%) |
| 18 to 34 Years | 251 (0.8%) | 303 (1.0%) |
| 35 to 64 Years | 760 (2.1%) | 1,077 (3.0%) |
| 65 to 74 Years | 388 (6.8%) | 346 (4.7%) |
| 75 Years and over | 531 (18.1%) | 995 (20.7%) |
Technology Access in San Bernardino
Computing Device Access in San Bernardino
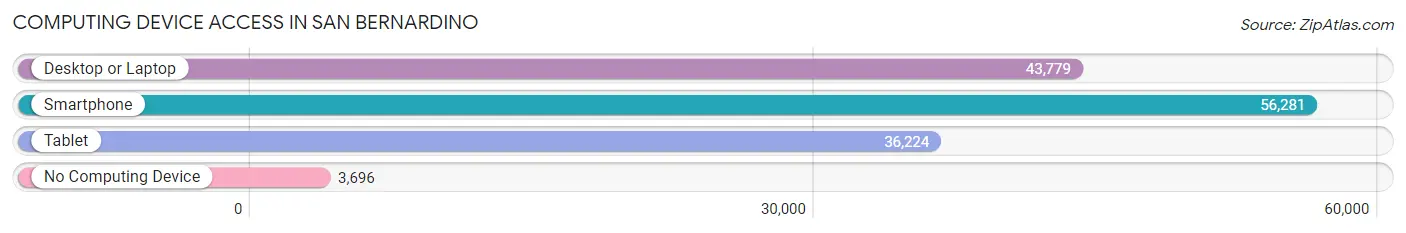
| Device Type | # Households | % Households |
| Desktop or Laptop | 43,779 | 70.1% |
| Smartphone | 56,281 | 90.1% |
| Tablet | 36,224 | 58.0% |
| No Computing Device | 3,696 | 5.9% |
| Total | 62,486 | 100.0% |
Internet Access in San Bernardino
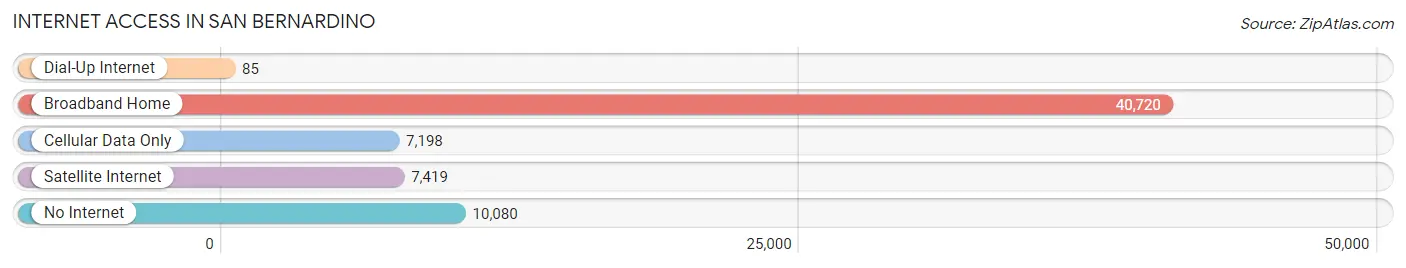
| Internet Type | # Households | % Households |
| Dial-Up Internet | 85 | 0.1% |
| Broadband Home | 40,720 | 65.2% |
| Cellular Data Only | 7,198 | 11.5% |
| Satellite Internet | 7,419 | 11.9% |
| No Internet | 10,080 | 16.1% |
| Total | 62,486 | 100.0% |
San Bernardino Summary
San Bernardino, California is a city located in the Inland Empire region of Southern California. It is the county seat of San Bernardino County and the 17th largest city in the state. The city is situated at the base of the San Bernardino Mountains and is surrounded by the San Bernardino National Forest. The city is home to a population of over 216,000 people, making it the largest city in the county.
History
San Bernardino was founded in 1810 by Spanish missionaries and was named after Saint Bernardino of Siena. The city was incorporated in 1857 and was the first city in California to be incorporated. During the late 19th century, the city experienced a period of growth and development, becoming a major hub for the railroad industry. The city was also a major center for citrus production and was home to the world’s largest orange packing plant.
In the early 20th century, the city experienced a period of decline due to the Great Depression and World War II. The city was also affected by the relocation of the railroad industry to Los Angeles. However, the city experienced a period of revitalization in the 1950s and 1960s, with the construction of new highways and the development of the University of California, Riverside.
Geography
San Bernardino is located in the Inland Empire region of Southern California. The city is situated at the base of the San Bernardino Mountains and is surrounded by the San Bernardino National Forest. The city is located at an elevation of 1,077 feet and has a total area of 59.6 square miles. The city is located in the Mojave Desert and has a semi-arid climate with hot summers and mild winters.
Economy
San Bernardino’s economy is largely based on the service industry, with the largest employers being the County of San Bernardino, the San Bernardino City Unified School District, and the University of California, Riverside. The city is also home to several major corporations, including Stater Bros. Markets, Amazon, and Walmart. The city is also home to the San Manuel Indian Bingo and Casino, which is one of the largest employers in the city.
Demographics
As of the 2010 census, San Bernardino had a population of 216,000 people. The racial makeup of the city was 57.2% White, 11.2% African American, 1.2% Native American, 5.2% Asian, 0.3% Pacific Islander, and 24.9% from other races. The median household income was $37,000 and the median family income was $41,000. The city’s poverty rate was 24.7%.
San Bernardino is a diverse city with a rich history and culture. The city is home to a variety of attractions, including the San Bernardino National Forest, the San Manuel Indian Bingo and Casino, and the University of California, Riverside. The city is also home to a variety of businesses and industries, making it a great place to live and work.
Common Questions
What is Per Capita Income in San Bernardino?
Per Capita income in San Bernardino is $22,865.
What is the Median Family Income in San Bernardino?
Median Family Income in San Bernardino is $66,810.
What is the Median Household income in San Bernardino?
Median Household Income in San Bernardino is $61,323.
What is Income or Wage Gap in San Bernardino?
Income or Wage Gap in San Bernardino is 24.0%.
Women in San Bernardino earn 76.0 cents for every dollar earned by a man.
What is Family Income Deficit in San Bernardino?
Family Income Deficit in San Bernardino is $12,956.
Families that are below poverty line in San Bernardino earn $12,956 less on average than the poverty threshold level.
What is Inequality or Gini Index in San Bernardino?
Inequality or Gini Index in San Bernardino is 0.43.
What is the Total Population of San Bernardino?
Total Population of San Bernardino is 221,041.
What is the Total Male Population of San Bernardino?
Total Male Population of San Bernardino is 110,953.
What is the Total Female Population of San Bernardino?
Total Female Population of San Bernardino is 110,088.
What is the Ratio of Males per 100 Females in San Bernardino?
There are 100.79 Males per 100 Females in San Bernardino.
What is the Ratio of Females per 100 Males in San Bernardino?
There are 99.22 Females per 100 Males in San Bernardino.
What is the Median Population Age in San Bernardino?
Median Population Age in San Bernardino is 31.2 Years.
What is the Average Family Size in San Bernardino
Average Family Size in San Bernardino is 3.9 People.
What is the Average Household Size in San Bernardino
Average Household Size in San Bernardino is 3.4 People.
How Large is the Labor Force in San Bernardino?
There are 101,671 People in the Labor Forcein in San Bernardino.
What is the Percentage of People in the Labor Force in San Bernardino?
60.9% of People are in the Labor Force in San Bernardino.
What is the Unemployment Rate in San Bernardino?
Unemployment Rate in San Bernardino is 7.6%.