Cities with the Highest Percentage of Black / African American Population in North Carolina
RELATED REPORTS & OPTIONS
Black / African American
North Carolina
Compare Cities
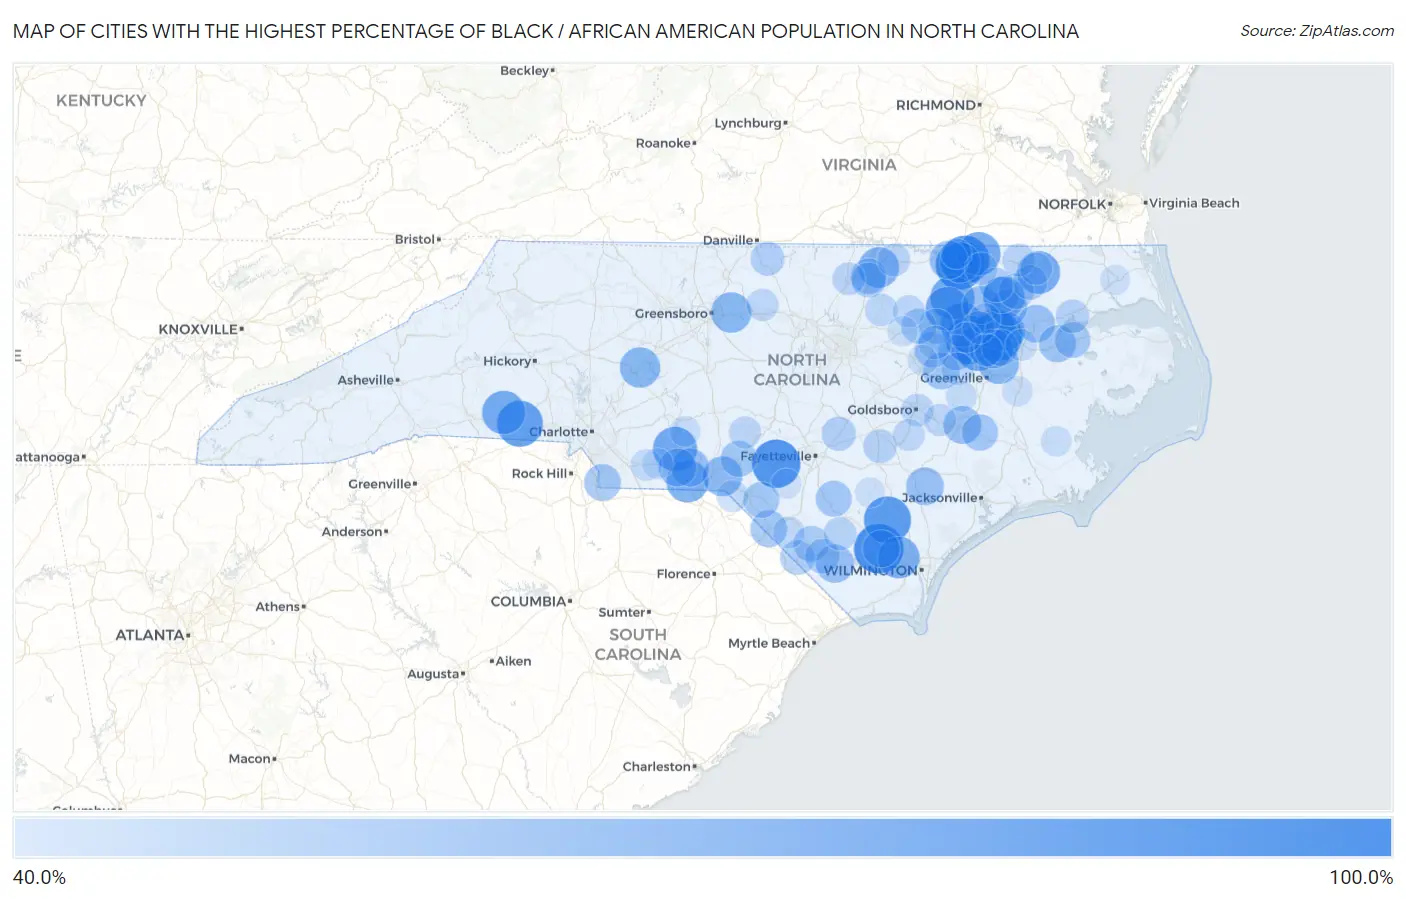
Map of Cities with the Highest Percentage of Black / African American Population in North Carolina
0.0%
100.0%
Cities with the Highest Percentage of Black / African American Population in North Carolina
| City | Black / African American | vs State | vs National | |
| 1. | East Arcadia | 100.0% | 20.9%(+79.1)#1 | 12.5%(+87.5)#11 |
| 2. | Hassell | 100.0% | 20.9%(+79.1)#2 | 12.5%(+87.5)#51 |
| 3. | South Weldon | 98.4% | 20.9%(+77.4)#3 | 12.5%(+85.9)#75 |
| 4. | Garysburg | 97.9% | 20.9%(+77.0)#4 | 12.5%(+85.4)#83 |
| 5. | Silver City | 97.1% | 20.9%(+76.1)#5 | 12.5%(+84.6)#92 |
| 6. | Princeville | 95.5% | 20.9%(+74.5)#6 | 12.5%(+83.0)#109 |
| 7. | Ivanhoe | 93.5% | 20.9%(+72.6)#7 | 12.5%(+81.1)#130 |
| 8. | Light Oak | 90.3% | 20.9%(+69.3)#8 | 12.5%(+77.8)#181 |
| 9. | Conetoe | 86.0% | 20.9%(+65.1)#9 | 12.5%(+73.5)#260 |
| 10. | Leggett | 85.5% | 20.9%(+64.5)#10 | 12.5%(+73.0)#271 |
| 11. | Ansonville | 85.4% | 20.9%(+64.5)#11 | 12.5%(+72.9)#273 |
| 12. | Enfield | 85.1% | 20.9%(+64.2)#12 | 12.5%(+72.6)#278 |
| 13. | Whitakers | 85.1% | 20.9%(+64.1)#13 | 12.5%(+72.6)#281 |
| 14. | Seaboard | 83.9% | 20.9%(+63.0)#14 | 12.5%(+71.4)#306 |
| 15. | Kingstown | 83.5% | 20.9%(+62.5)#15 | 12.5%(+71.0)#316 |
| 16. | Cofield | 81.8% | 20.9%(+60.8)#16 | 12.5%(+69.3)#353 |
| 17. | Morven | 80.3% | 20.9%(+59.3)#17 | 12.5%(+67.8)#386 |
| 18. | Northwest | 79.5% | 20.9%(+58.5)#18 | 12.5%(+67.0)#404 |
| 19. | Kelford | 79.4% | 20.9%(+58.5)#19 | 12.5%(+67.0)#405 |
| 20. | Oak City | 76.7% | 20.9%(+55.7)#20 | 12.5%(+64.2)#458 |
| 21. | Weldon | 76.3% | 20.9%(+55.4)#21 | 12.5%(+63.8)#467 |
| 22. | Middleburg | 76.2% | 20.9%(+55.3)#22 | 12.5%(+63.8)#469 |
| 23. | Stokes | 75.7% | 20.9%(+54.7)#23 | 12.5%(+63.2)#482 |
| 24. | Sedalia | 75.6% | 20.9%(+54.7)#24 | 12.5%(+63.1)#485 |
| 25. | East Spencer | 75.3% | 20.9%(+54.4)#25 | 12.5%(+62.9)#491 |
| 26. | Hamilton | 74.3% | 20.9%(+53.3)#26 | 12.5%(+61.8)#519 |
| 27. | Dobbins Heights | 73.8% | 20.9%(+52.9)#27 | 12.5%(+61.3)#534 |
| 28. | Parmele | 71.9% | 20.9%(+51.0)#28 | 12.5%(+59.5)#570 |
| 29. | South Rosemary | 70.1% | 20.9%(+49.2)#29 | 12.5%(+57.6)#619 |
| 30. | Lilesville | 69.7% | 20.9%(+48.8)#30 | 12.5%(+57.2)#627 |
| 31. | Brunswick | 69.7% | 20.9%(+48.7)#31 | 12.5%(+57.2)#629 |
| 32. | Scotland Neck | 69.5% | 20.9%(+48.6)#32 | 12.5%(+57.1)#633 |
| 33. | Kinston | 69.2% | 20.9%(+48.2)#33 | 12.5%(+56.7)#640 |
| 34. | Wadesboro | 69.1% | 20.9%(+48.2)#34 | 12.5%(+56.7)#641 |
| 35. | Greenevers | 68.7% | 20.9%(+47.8)#35 | 12.5%(+56.2)#654 |
| 36. | Windsor | 68.2% | 20.9%(+47.2)#36 | 12.5%(+55.7)#665 |
| 37. | Sandyfield | 67.5% | 20.9%(+46.6)#37 | 12.5%(+55.0)#680 |
| 38. | Lewiston Woodville | 66.8% | 20.9%(+45.9)#38 | 12.5%(+54.3)#692 |
| 39. | Plymouth | 66.5% | 20.9%(+45.6)#39 | 12.5%(+54.1)#698 |
| 40. | Rowland | 66.1% | 20.9%(+45.2)#40 | 12.5%(+53.6)#704 |
| 41. | Jaars | 66.1% | 20.9%(+45.1)#41 | 12.5%(+53.6)#706 |
| 42. | Robersonville | 65.9% | 20.9%(+45.0)#42 | 12.5%(+53.5)#711 |
| 43. | Roxobel | 65.0% | 20.9%(+44.1)#43 | 12.5%(+52.5)#743 |
| 44. | Saratoga | 64.9% | 20.9%(+44.0)#44 | 12.5%(+52.5)#746 |
| 45. | Dover | 64.6% | 20.9%(+43.7)#45 | 12.5%(+52.2)#751 |
| 46. | Hoffman | 64.5% | 20.9%(+43.6)#46 | 12.5%(+52.1)#756 |
| 47. | White Oak | 64.1% | 20.9%(+43.1)#47 | 12.5%(+51.6)#768 |
| 48. | Maxton | 63.9% | 20.9%(+43.0)#48 | 12.5%(+51.4)#776 |
| 49. | Roper | 63.3% | 20.9%(+42.4)#49 | 12.5%(+50.9)#796 |
| 50. | Henderson | 63.2% | 20.9%(+42.2)#50 | 12.5%(+50.7)#799 |
| 51. | Evergreen | 63.0% | 20.9%(+42.1)#51 | 12.5%(+50.5)#802 |
| 52. | Aulander | 62.8% | 20.9%(+41.8)#52 | 12.5%(+50.3)#810 |
| 53. | Pinetops | 62.7% | 20.9%(+41.7)#53 | 12.5%(+50.2)#813 |
| 54. | Elm City | 62.7% | 20.9%(+41.7)#54 | 12.5%(+50.2)#814 |
| 55. | Rocky Mount | 62.1% | 20.9%(+41.2)#55 | 12.5%(+49.7)#832 |
| 56. | Nashville | 61.7% | 20.9%(+40.8)#56 | 12.5%(+49.2)#844 |
| 57. | Fair Bluff | 60.9% | 20.9%(+39.9)#57 | 12.5%(+48.4)#867 |
| 58. | South Henderson | 60.8% | 20.9%(+39.9)#58 | 12.5%(+48.4)#869 |
| 59. | Chadbourn | 60.7% | 20.9%(+39.8)#59 | 12.5%(+48.3)#874 |
| 60. | Ahoskie | 60.4% | 20.9%(+39.4)#60 | 12.5%(+47.9)#882 |
| 61. | Rich Square | 60.2% | 20.9%(+39.2)#61 | 12.5%(+47.7)#887 |
| 62. | Godwin | 59.2% | 20.9%(+38.2)#62 | 12.5%(+46.7)#920 |
| 63. | Yanceyville | 58.8% | 20.9%(+37.8)#63 | 12.5%(+46.3)#932 |
| 64. | Sharpsburg | 58.1% | 20.9%(+37.2)#64 | 12.5%(+45.6)#964 |
| 65. | Keener | 57.8% | 20.9%(+36.9)#65 | 12.5%(+45.3)#974 |
| 66. | Edenton | 57.7% | 20.9%(+36.8)#66 | 12.5%(+45.3)#977 |
| 67. | Clarkton | 56.6% | 20.9%(+35.6)#67 | 12.5%(+44.1)#1,017 |
| 68. | Murfreesboro | 56.2% | 20.9%(+35.2)#68 | 12.5%(+43.7)#1,027 |
| 69. | Speed | 55.9% | 20.9%(+35.0)#69 | 12.5%(+43.5)#1,037 |
| 70. | Norlina | 55.9% | 20.9%(+35.0)#70 | 12.5%(+43.4)#1,039 |
| 71. | Bethel | 55.8% | 20.9%(+34.9)#71 | 12.5%(+43.3)#1,041 |
| 72. | Oxford | 55.6% | 20.9%(+34.7)#72 | 12.5%(+43.2)#1,044 |
| 73. | Jackson | 55.3% | 20.9%(+34.4)#73 | 12.5%(+42.8)#1,058 |
| 74. | Fountain | 54.8% | 20.9%(+33.9)#74 | 12.5%(+42.4)#1,077 |
| 75. | Louisburg | 54.8% | 20.9%(+33.9)#75 | 12.5%(+42.3)#1,078 |
| 76. | Goldsboro | 54.6% | 20.9%(+33.6)#76 | 12.5%(+42.1)#1,082 |
| 77. | Taylortown | 54.4% | 20.9%(+33.5)#77 | 12.5%(+41.9)#1,087 |
| 78. | Green Level | 54.4% | 20.9%(+33.4)#78 | 12.5%(+41.9)#1,088 |
| 79. | La Grange | 54.3% | 20.9%(+33.4)#79 | 12.5%(+41.8)#1,092 |
| 80. | Winton | 54.3% | 20.9%(+33.4)#80 | 12.5%(+41.8)#1,094 |
| 81. | Castalia | 54.1% | 20.9%(+33.1)#81 | 12.5%(+41.6)#1,101 |
| 82. | Mount Olive | 53.7% | 20.9%(+32.7)#82 | 12.5%(+41.2)#1,119 |
| 83. | Fairmont | 53.4% | 20.9%(+32.5)#83 | 12.5%(+41.0)#1,130 |
| 84. | Gibson | 53.4% | 20.9%(+32.5)#84 | 12.5%(+40.9)#1,131 |
| 85. | Marshville | 52.8% | 20.9%(+31.8)#85 | 12.5%(+40.3)#1,147 |
| 86. | Williamston | 52.7% | 20.9%(+31.8)#86 | 12.5%(+40.2)#1,151 |
| 87. | Maury | 51.4% | 20.9%(+30.4)#87 | 12.5%(+38.9)#1,195 |
| 88. | New Hope | 51.0% | 20.9%(+30.0)#88 | 12.5%(+38.5)#1,208 |
| 89. | Hobgood | 50.9% | 20.9%(+30.0)#89 | 12.5%(+38.4)#1,210 |
| 90. | Mount Gilead | 50.6% | 20.9%(+29.7)#90 | 12.5%(+38.2)#1,222 |
| 91. | Peachland | 50.5% | 20.9%(+29.6)#91 | 12.5%(+38.1)#1,229 |
| 92. | Bayboro | 50.5% | 20.9%(+29.5)#92 | 12.5%(+38.0)#1,232 |
| 93. | Chocowinity | 50.2% | 20.9%(+29.3)#93 | 12.5%(+37.8)#1,242 |
| 94. | Gaston | 49.9% | 20.9%(+29.0)#94 | 12.5%(+37.5)#1,257 |
| 95. | Tarboro | 49.7% | 20.9%(+28.8)#95 | 12.5%(+37.2)#1,267 |
| 96. | Wilson | 49.7% | 20.9%(+28.7)#96 | 12.5%(+37.2)#1,268 |
| 97. | Spring Hope | 49.6% | 20.9%(+28.7)#97 | 12.5%(+37.1)#1,270 |
| 98. | Elizabeth City | 49.4% | 20.9%(+28.4)#98 | 12.5%(+36.9)#1,276 |
| 99. | Garland | 49.0% | 20.9%(+28.1)#99 | 12.5%(+36.5)#1,289 |
| 100. | Shannon | 49.0% | 20.9%(+28.0)#100 | 12.5%(+36.5)#1,291 |
Common Questions
What are the Top 10 Cities with the Highest Percentage of Black / African American Population in North Carolina?
Top 10 Cities with the Highest Percentage of Black / African American Population in North Carolina are:
#1
100.0%
#2
100.0%
#3
98.4%
#4
97.9%
#5
97.1%
#6
95.5%
#7
93.5%
#8
90.3%
#9
86.0%
#10
85.5%
What city has the Highest Percentage of Black / African American Population in North Carolina?
East Arcadia has the Highest Percentage of Black / African American Population in North Carolina with 100.0%.
What is the Percentage of Black / African American Population in the State of North Carolina?
Percentage of Black / African American Population in North Carolina is 20.9%.
What is the Percentage of Black / African American Population in the United States?
Percentage of Black / African American Population in the United States is 12.5%.