Barstow, CA Map & Demographics
Barstow Map
Barstow Overview
$24,761
PER CAPITA INCOME
$64,563
AVG FAMILY INCOME
$52,200
AVG HOUSEHOLD INCOME
11.4%
WAGE / INCOME GAP [ % ]
88.6¢/ $1
WAGE / INCOME GAP [ $ ]
$14,532
FAMILY INCOME DEFICIT
0.46
INEQUALITY / GINI INDEX
25,235
TOTAL POPULATION
12,002
MALE POPULATION
13,233
FEMALE POPULATION
90.70
MALES / 100 FEMALES
110.26
FEMALES / 100 MALES
31.7
MEDIAN AGE
3.4
AVG FAMILY SIZE
2.8
AVG HOUSEHOLD SIZE
10,119
LABOR FORCE [ PEOPLE ]
55.3%
PERCENT IN LABOR FORCE
9.1%
UNEMPLOYMENT RATE
Barstow Zip Codes
Barstow Area Codes
Income in Barstow
Income Overview in Barstow
Per Capita Income in Barstow is $24,761, while median incomes of families and households are $64,563 and $52,200 respectively.
| Characteristic | Number | Measure |
| Per Capita Income | 25,235 | $24,761 |
| Median Family Income | 5,932 | $64,563 |
| Mean Family Income | 5,932 | $74,381 |
| Median Household Income | 8,952 | $52,200 |
| Mean Household Income | 8,952 | $66,737 |
| Income Deficit | 5,932 | $14,532 |
| Wage / Income Gap (%) | 25,235 | 11.43% |
| Wage / Income Gap ($) | 25,235 | 88.57¢ per $1 |
| Gini / Inequality Index | 25,235 | 0.46 |
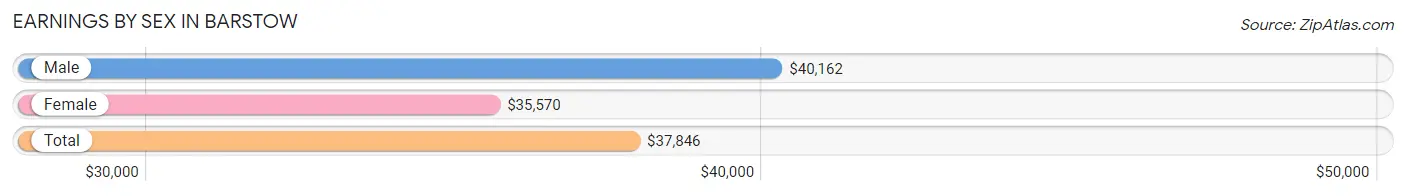
Earnings by Sex in Barstow
Average Earnings in Barstow are $37,846, $40,162 for men and $35,570 for women, a difference of 11.4%.
| Sex | Number | Average Earnings |
| Male | 5,649 (55.0%) | $40,162 |
| Female | 4,625 (45.0%) | $35,570 |
| Total | 10,274 (100.0%) | $37,846 |
Earnings by Sex by Income Bracket in Barstow
The most common earnings brackets in Barstow are $75,000 to $99,999 for men (766 | 13.6%) and $65,000 to $74,999 for women (644 | 13.9%).
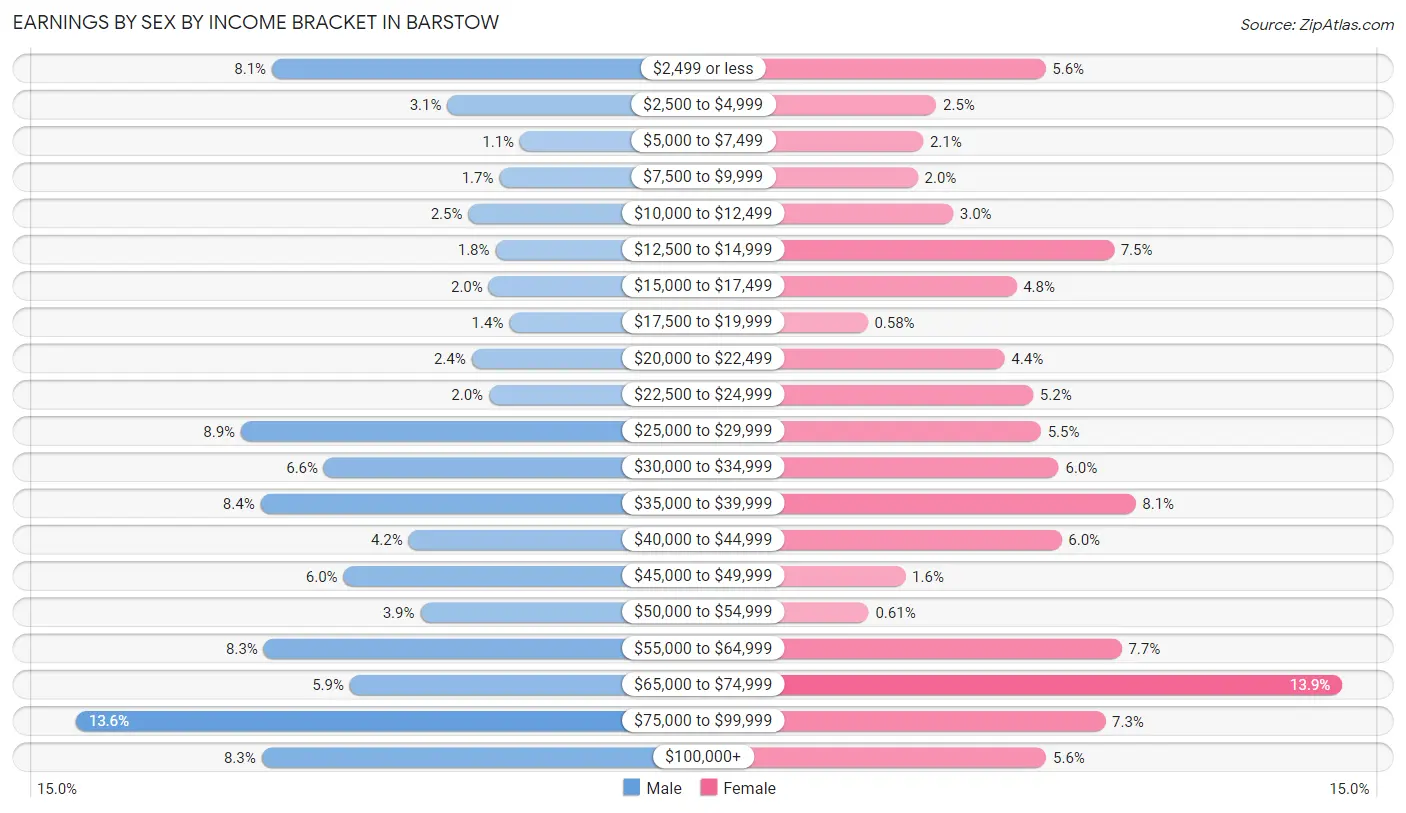
| Income | Male | Female |
| $2,499 or less | 455 (8.1%) | 258 (5.6%) |
| $2,500 to $4,999 | 176 (3.1%) | 116 (2.5%) |
| $5,000 to $7,499 | 61 (1.1%) | 99 (2.1%) |
| $7,500 to $9,999 | 94 (1.7%) | 92 (2.0%) |
| $10,000 to $12,499 | 143 (2.5%) | 138 (3.0%) |
| $12,500 to $14,999 | 100 (1.8%) | 347 (7.5%) |
| $15,000 to $17,499 | 111 (2.0%) | 220 (4.8%) |
| $17,500 to $19,999 | 78 (1.4%) | 27 (0.6%) |
| $20,000 to $22,499 | 138 (2.4%) | 205 (4.4%) |
| $22,500 to $24,999 | 110 (1.9%) | 242 (5.2%) |
| $25,000 to $29,999 | 504 (8.9%) | 252 (5.4%) |
| $30,000 to $34,999 | 372 (6.6%) | 275 (5.9%) |
| $35,000 to $39,999 | 473 (8.4%) | 375 (8.1%) |
| $40,000 to $44,999 | 238 (4.2%) | 279 (6.0%) |
| $45,000 to $49,999 | 341 (6.0%) | 76 (1.6%) |
| $50,000 to $54,999 | 219 (3.9%) | 28 (0.6%) |
| $55,000 to $64,999 | 468 (8.3%) | 357 (7.7%) |
| $65,000 to $74,999 | 331 (5.9%) | 644 (13.9%) |
| $75,000 to $99,999 | 766 (13.6%) | 336 (7.3%) |
| $100,000+ | 471 (8.3%) | 259 (5.6%) |
| Total | 5,649 (100.0%) | 4,625 (100.0%) |
Earnings by Sex by Educational Attainment in Barstow
Average earnings in Barstow are $48,138 for men and $37,827 for women, a difference of 21.4%. Men with an educational attainment of bachelor's degree enjoy the highest average annual earnings of $101,667, while those with less than high school education earn the least with $26,780. Women with an educational attainment of graduate degree earn the most with the average annual earnings of $77,083, while those with less than high school education have the smallest earnings of $23,147.
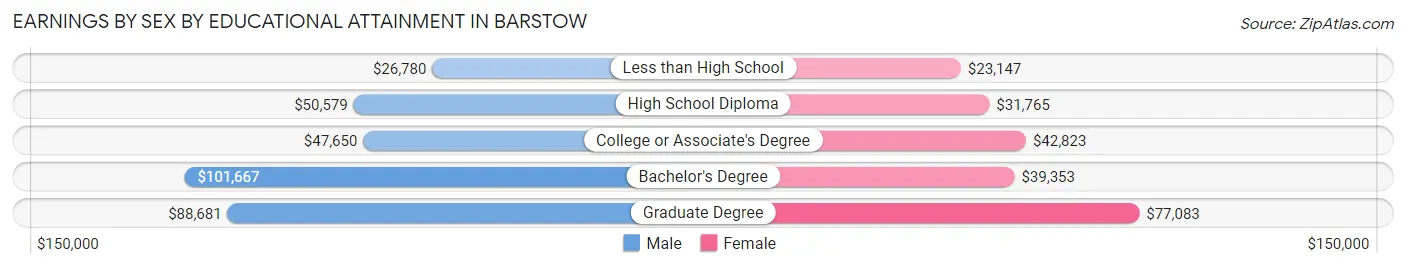
| Educational Attainment | Male Income | Female Income |
| Less than High School | $26,780 | $23,147 |
| High School Diploma | $50,579 | $31,765 |
| College or Associate's Degree | $47,650 | $42,823 |
| Bachelor's Degree | $101,667 | $39,353 |
| Graduate Degree | $88,681 | $77,083 |
| Total | $48,138 | $37,827 |
Family Income in Barstow
Family Income Brackets in Barstow
According to the Barstow family income data, there are 1,222 families falling into the $50,000 to $74,999 income range, which is the most common income bracket and makes up 20.6% of all families. Conversely, the $10,000 to $14,999 income bracket is the least frequent group with only 125 families (2.1%) belonging to this category.
| Income Bracket | # Families | % Families |
| Less than $10,000 | 457 | 7.7% |
| $10,000 to $14,999 | 125 | 2.1% |
| $15,000 to $24,999 | 451 | 7.6% |
| $25,000 to $34,999 | 617 | 10.4% |
| $35,000 to $49,999 | 830 | 14.0% |
| $50,000 to $74,999 | 1,222 | 20.6% |
| $75,000 to $99,999 | 813 | 13.7% |
| $100,000 to $149,999 | 908 | 15.3% |
| $150,000 to $199,999 | 202 | 3.4% |
| $200,000+ | 314 | 5.3% |
Family Income by Famaliy Size in Barstow
6-person families (410 | 6.9%) account for the highest median family income in Barstow with $110,278 per family, while 2-person families (2,740 | 46.2%) have the highest median income of $29,713 per family member.
| Income Bracket | # Families | Median Income |
| 2-Person Families | 2,740 (46.2%) | $59,426 |
| 3-Person Families | 1,210 (20.4%) | $52,880 |
| 4-Person Families | 898 (15.1%) | $89,773 |
| 5-Person Families | 542 (9.1%) | $74,122 |
| 6-Person Families | 410 (6.9%) | $110,278 |
| 7+ Person Families | 132 (2.2%) | $0 |
| Total | 5,932 (100.0%) | $64,563 |
Family Income by Number of Earners in Barstow
The median family income in Barstow is $64,563, with families comprising 2 earners (1,519) having the highest median family income of $103,609, while families with no earners (1,221) have the lowest median family income of $23,542, accounting for 25.6% and 20.6% of families, respectively.
| Number of Earners | # Families | Median Income |
| No Earners | 1,221 (20.6%) | $23,542 |
| 1 Earner | 2,758 (46.5%) | $51,968 |
| 2 Earners | 1,519 (25.6%) | $103,609 |
| 3+ Earners | 434 (7.3%) | $79,318 |
| Total | 5,932 (100.0%) | $64,563 |
Household Income in Barstow
Household Income Brackets in Barstow
With 1,683 households falling in the category, the $50,000 to $74,999 income range is the most frequent in Barstow, accounting for 18.8% of all households. In contrast, only 304 households (3.4%) fall into the $150,000 to $199,999 income bracket, making it the least populous group.
| Income Bracket | # Households | % Households |
| Less than $10,000 | 949 | 10.6% |
| $10,000 to $14,999 | 474 | 5.3% |
| $15,000 to $24,999 | 689 | 7.7% |
| $25,000 to $34,999 | 1,074 | 12.0% |
| $35,000 to $49,999 | 1,235 | 13.8% |
| $50,000 to $74,999 | 1,683 | 18.8% |
| $75,000 to $99,999 | 1,200 | 13.4% |
| $100,000 to $149,999 | 1,003 | 11.2% |
| $150,000 to $199,999 | 304 | 3.4% |
| $200,000+ | 340 | 3.8% |
Household Income by Householder Age in Barstow
The median household income in Barstow is $52,200, with the highest median household income of $60,429 found in the 25 to 44 years age bracket for the primary householder. A total of 3,630 households (40.6%) fall into this category. Meanwhile, the 15 to 24 years age bracket for the primary householder has the lowest median household income of $0, with 430 households (4.8%) in this group.
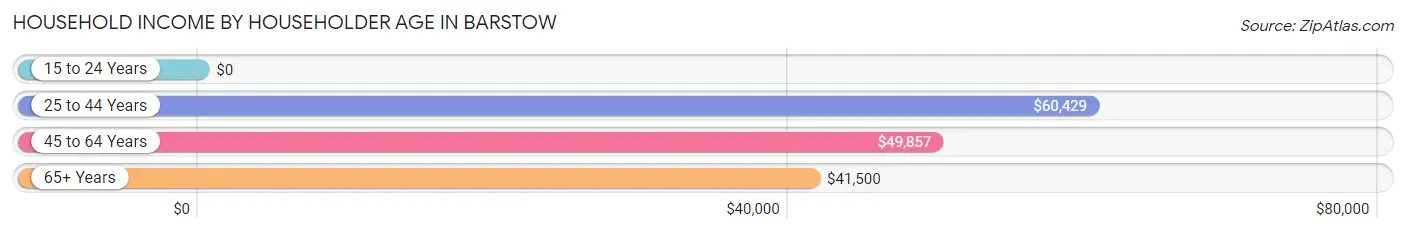
| Income Bracket | # Households | Median Income |
| 15 to 24 Years | 430 (4.8%) | $0 |
| 25 to 44 Years | 3,630 (40.6%) | $60,429 |
| 45 to 64 Years | 3,038 (33.9%) | $49,857 |
| 65+ Years | 1,854 (20.7%) | $41,500 |
| Total | 8,952 (100.0%) | $52,200 |
Poverty in Barstow
Income Below Poverty by Sex and Age in Barstow
With 21.0% poverty level for males and 23.9% for females among the residents of Barstow, 5 year old males and 18 to 24 year old females are the most vulnerable to poverty, with 41 males (50.6%) and 375 females (38.9%) in their respective age groups living below the poverty level.
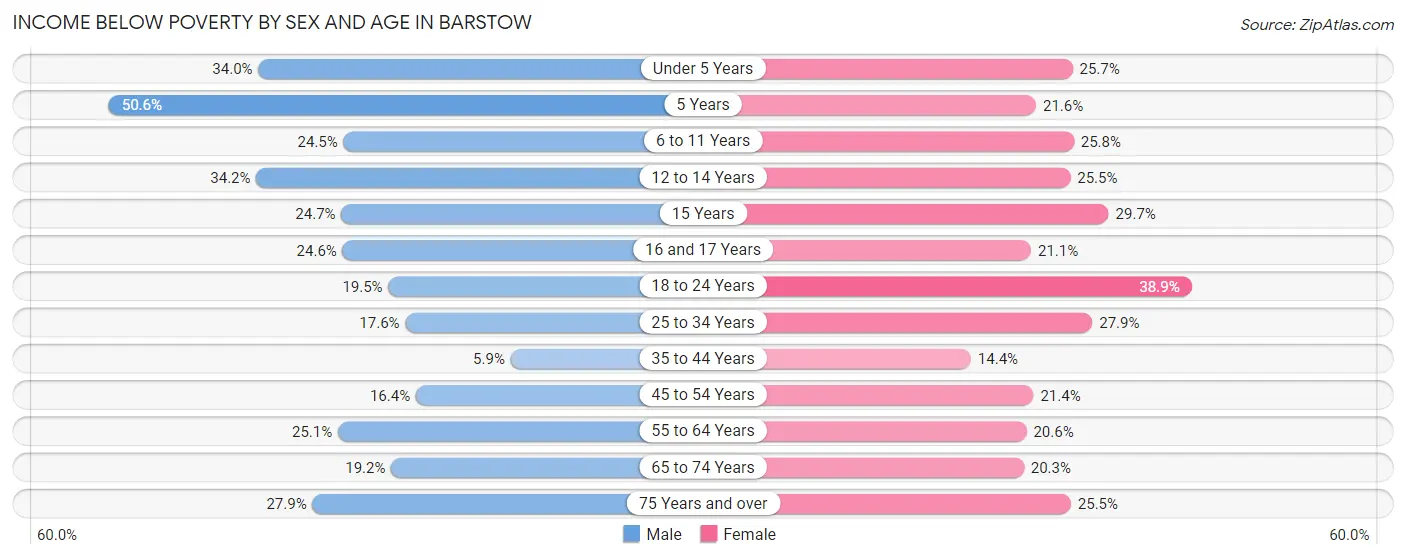
| Age Bracket | Male | Female |
| Under 5 Years | 287 (34.0%) | 310 (25.7%) |
| 5 Years | 41 (50.6%) | 45 (21.6%) |
| 6 to 11 Years | 343 (24.5%) | 402 (25.8%) |
| 12 to 14 Years | 200 (34.2%) | 127 (25.5%) |
| 15 Years | 22 (24.7%) | 85 (29.7%) |
| 16 and 17 Years | 175 (24.6%) | 35 (21.1%) |
| 18 to 24 Years | 249 (19.5%) | 375 (38.9%) |
| 25 to 34 Years | 320 (17.6%) | 553 (27.9%) |
| 35 to 44 Years | 84 (5.9%) | 271 (14.4%) |
| 45 to 54 Years | 179 (16.4%) | 250 (21.3%) |
| 55 to 64 Years | 287 (25.1%) | 333 (20.6%) |
| 65 to 74 Years | 173 (19.2%) | 194 (20.3%) |
| 75 Years and over | 107 (27.9%) | 162 (25.5%) |
| Total | 2,467 (21.0%) | 3,142 (23.9%) |
Income Above Poverty by Sex and Age in Barstow
According to the poverty statistics in Barstow, males aged 35 to 44 years and females aged 35 to 44 years are the age groups that are most secure financially, with 94.1% of males and 85.6% of females in these age groups living above the poverty line.
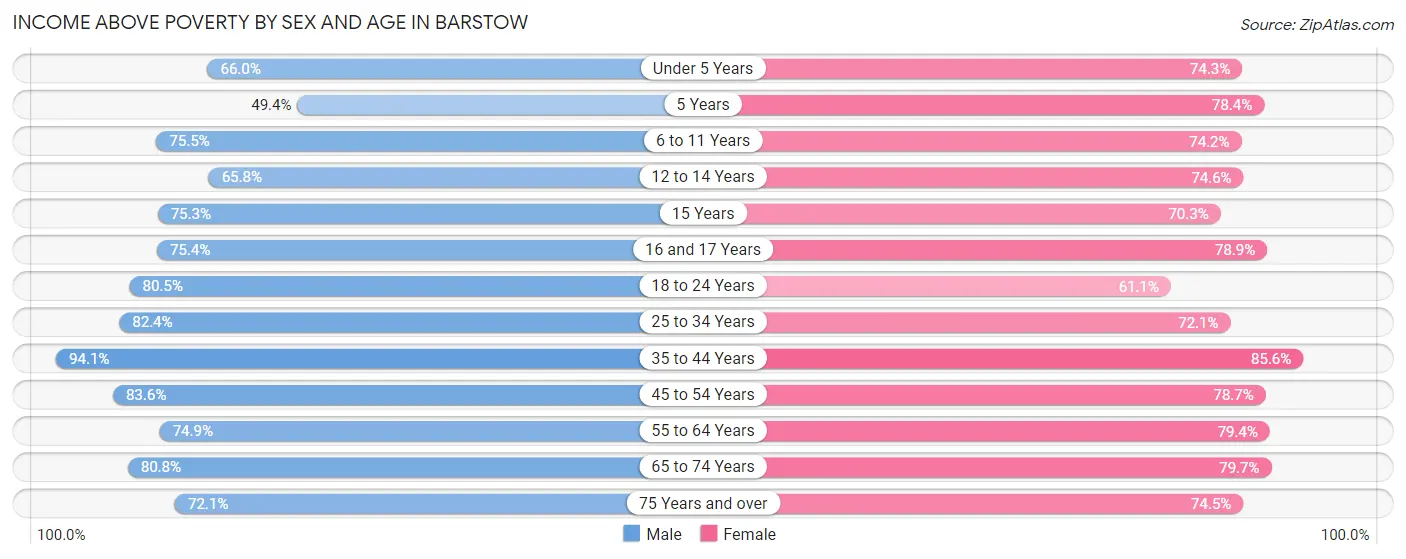
| Age Bracket | Male | Female |
| Under 5 Years | 558 (66.0%) | 896 (74.3%) |
| 5 Years | 40 (49.4%) | 163 (78.4%) |
| 6 to 11 Years | 1,059 (75.5%) | 1,154 (74.2%) |
| 12 to 14 Years | 385 (65.8%) | 372 (74.6%) |
| 15 Years | 67 (75.3%) | 201 (70.3%) |
| 16 and 17 Years | 537 (75.4%) | 131 (78.9%) |
| 18 to 24 Years | 1,029 (80.5%) | 588 (61.1%) |
| 25 to 34 Years | 1,499 (82.4%) | 1,429 (72.1%) |
| 35 to 44 Years | 1,349 (94.1%) | 1,613 (85.6%) |
| 45 to 54 Years | 912 (83.6%) | 921 (78.6%) |
| 55 to 64 Years | 857 (74.9%) | 1,286 (79.4%) |
| 65 to 74 Years | 730 (80.8%) | 763 (79.7%) |
| 75 Years and over | 276 (72.1%) | 473 (74.5%) |
| Total | 9,298 (79.0%) | 9,990 (76.1%) |
Income Below Poverty Among Married-Couple Families in Barstow
The poverty statistics for married-couple families in Barstow show that 9.8% or 287 of the total 2,945 families live below the poverty line. Families with 3 or 4 children have the highest poverty rate of 22.5%, comprising of 110 families. On the other hand, families with 5 or more children have the lowest poverty rate of 0.0%, which includes 0 families.
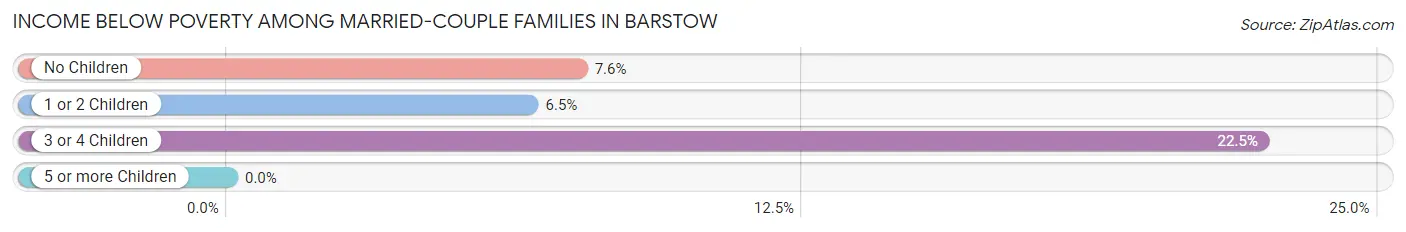
| Children | Above Poverty | Below Poverty |
| No Children | 1,457 (92.4%) | 120 (7.6%) |
| 1 or 2 Children | 814 (93.5%) | 57 (6.5%) |
| 3 or 4 Children | 380 (77.5%) | 110 (22.5%) |
| 5 or more Children | 7 (100.0%) | 0 (0.0%) |
| Total | 2,658 (90.2%) | 287 (9.8%) |
Income Below Poverty Among Single-Parent Households in Barstow
According to the poverty data in Barstow, 23.0% or 192 single-father households and 22.2% or 478 single-mother households are living below the poverty line. Among single-father households, those with 3 or 4 children have the highest poverty rate, with 82 households (70.1%) experiencing poverty. Likewise, among single-mother households, those with 5 or more children have the highest poverty rate, with 52 households (100.0%) falling below the poverty line.
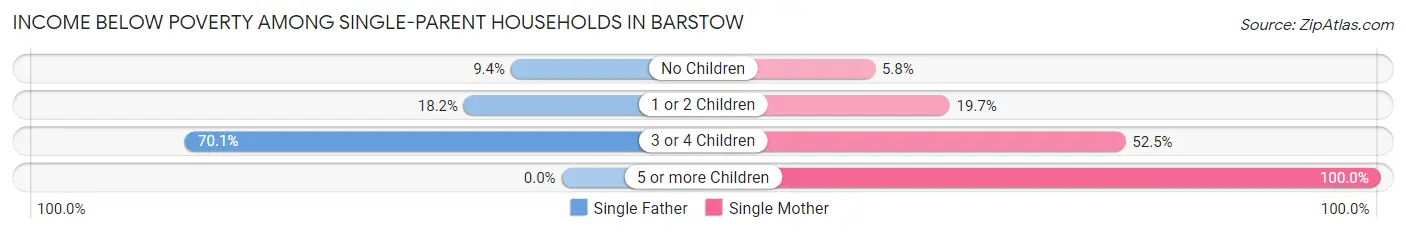
| Children | Single Father | Single Mother |
| No Children | 22 (9.4%) | 34 (5.8%) |
| 1 or 2 Children | 88 (18.2%) | 244 (19.7%) |
| 3 or 4 Children | 82 (70.1%) | 148 (52.5%) |
| 5 or more Children | 0 (0.0%) | 52 (100.0%) |
| Total | 192 (23.0%) | 478 (22.2%) |
Income Below Poverty Among Married-Couple vs Single-Parent Households in Barstow
The poverty data for Barstow shows that 287 of the married-couple family households (9.8%) and 670 of the single-parent households (22.4%) are living below the poverty level. Within the married-couple family households, those with 3 or 4 children have the highest poverty rate, with 110 households (22.5%) falling below the poverty line. Among the single-parent households, those with 5 or more children have the highest poverty rate, with 52 household (100.0%) living below poverty.
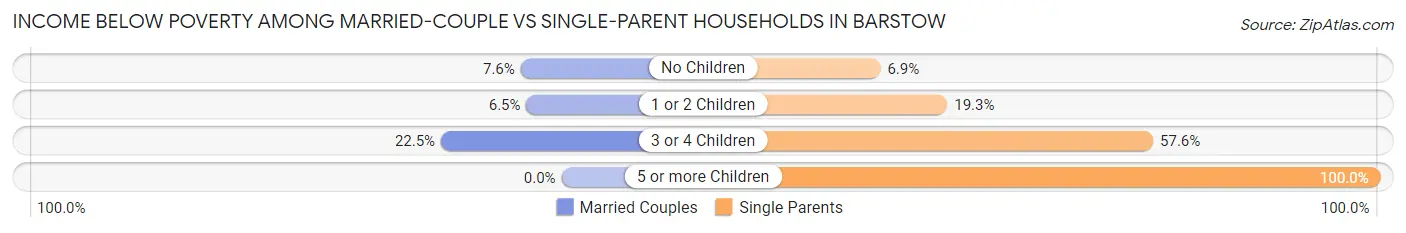
| Children | Married-Couple Families | Single-Parent Households |
| No Children | 120 (7.6%) | 56 (6.9%) |
| 1 or 2 Children | 57 (6.5%) | 332 (19.3%) |
| 3 or 4 Children | 110 (22.5%) | 230 (57.6%) |
| 5 or more Children | 0 (0.0%) | 52 (100.0%) |
| Total | 287 (9.8%) | 670 (22.4%) |
Race in Barstow
The most populous races in Barstow are Hispanic or Latino (13,015 | 51.6%), White / Caucasian (10,222 | 40.5%), and Two or more Races (5,988 | 23.7%).
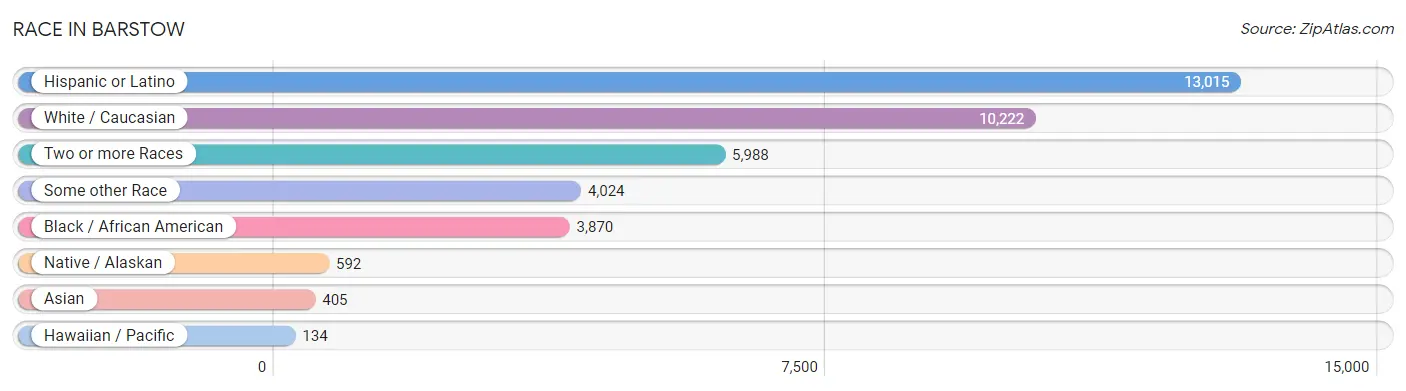
| Race | # Population | % Population |
| Asian | 405 | 1.6% |
| Black / African American | 3,870 | 15.3% |
| Hawaiian / Pacific | 134 | 0.5% |
| Hispanic or Latino | 13,015 | 51.6% |
| Native / Alaskan | 592 | 2.4% |
| White / Caucasian | 10,222 | 40.5% |
| Two or more Races | 5,988 | 23.7% |
| Some other Race | 4,024 | 16.0% |
| Total | 25,235 | 100.0% |
Ancestry in Barstow
The most populous ancestries reported in Barstow are Mexican (11,136 | 44.1%), Irish (1,737 | 6.9%), American (1,230 | 4.9%), German (1,180 | 4.7%), and Italian (828 | 3.3%), together accounting for 63.8% of all Barstow residents.
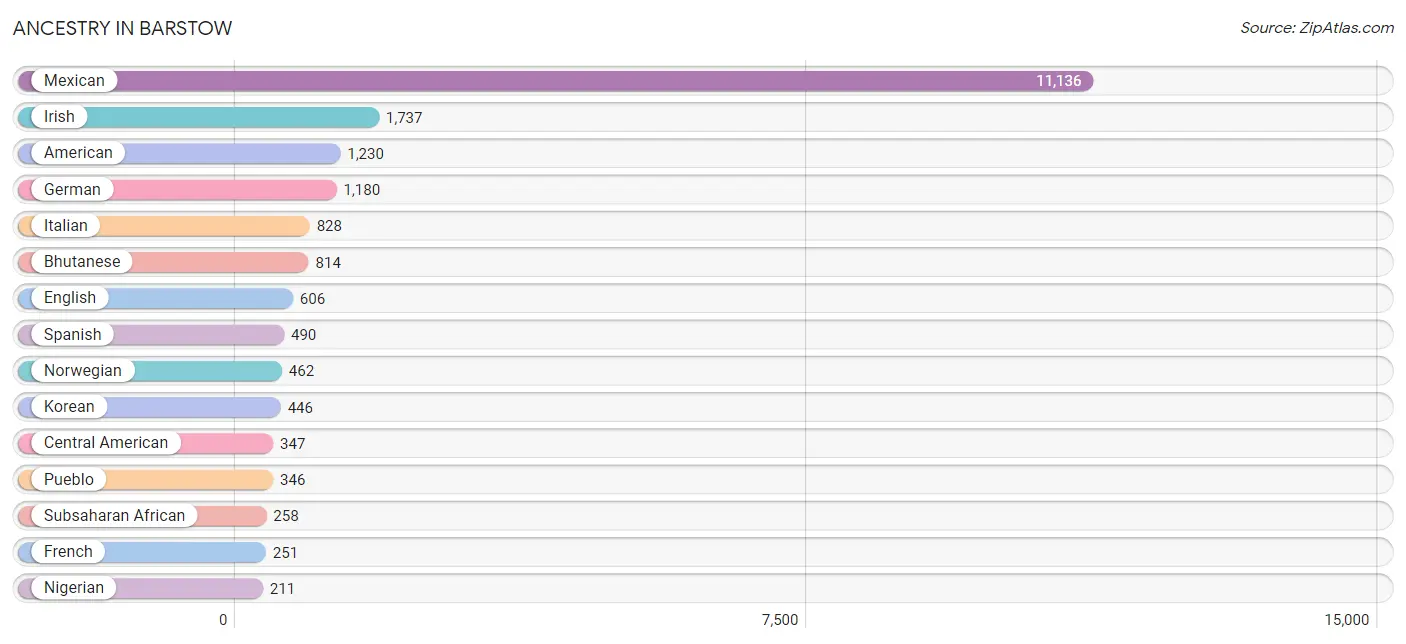
| Ancestry | # Population | % Population |
| African | 47 | 0.2% |
| American | 1,230 | 4.9% |
| Apache | 50 | 0.2% |
| Arab | 64 | 0.3% |
| Australian | 11 | 0.0% |
| Belizean | 21 | 0.1% |
| Bhutanese | 814 | 3.2% |
| Blackfeet | 52 | 0.2% |
| Bolivian | 72 | 0.3% |
| British | 66 | 0.3% |
| Burmese | 144 | 0.6% |
| Central American | 347 | 1.4% |
| Central American Indian | 49 | 0.2% |
| Cherokee | 106 | 0.4% |
| Comanche | 31 | 0.1% |
| Croatian | 48 | 0.2% |
| Cuban | 38 | 0.2% |
| Czech | 60 | 0.2% |
| Czechoslovakian | 22 | 0.1% |
| Danish | 51 | 0.2% |
| Dominican | 42 | 0.2% |
| Dutch | 190 | 0.7% |
| Eastern European | 16 | 0.1% |
| English | 606 | 2.4% |
| European | 129 | 0.5% |
| Finnish | 27 | 0.1% |
| French | 251 | 1.0% |
| French Canadian | 150 | 0.6% |
| German | 1,180 | 4.7% |
| Guamanian / Chamorro | 199 | 0.8% |
| Guatemalan | 71 | 0.3% |
| Honduran | 48 | 0.2% |
| Hungarian | 31 | 0.1% |
| Indian (Asian) | 23 | 0.1% |
| Iranian | 75 | 0.3% |
| Iraqi | 34 | 0.1% |
| Irish | 1,737 | 6.9% |
| Italian | 828 | 3.3% |
| Japanese | 64 | 0.3% |
| Jordanian | 17 | 0.1% |
| Korean | 446 | 1.8% |
| Lebanese | 13 | 0.1% |
| Mexican | 11,136 | 44.1% |
| Mexican American Indian | 24 | 0.1% |
| Native Hawaiian | 143 | 0.6% |
| Navajo | 83 | 0.3% |
| Nicaraguan | 21 | 0.1% |
| Nigerian | 211 | 0.8% |
| Northern European | 43 | 0.2% |
| Norwegian | 462 | 1.8% |
| Paiute | 34 | 0.1% |
| Polish | 108 | 0.4% |
| Portuguese | 10 | 0.0% |
| Pueblo | 346 | 1.4% |
| Puerto Rican | 183 | 0.7% |
| Romanian | 34 | 0.1% |
| Salvadoran | 207 | 0.8% |
| Scotch-Irish | 54 | 0.2% |
| Scottish | 147 | 0.6% |
| Slavic | 5 | 0.0% |
| Slovak | 10 | 0.0% |
| South American | 72 | 0.3% |
| South American Indian | 18 | 0.1% |
| Spaniard | 131 | 0.5% |
| Spanish | 490 | 1.9% |
| Spanish American | 17 | 0.1% |
| Sri Lankan | 29 | 0.1% |
| Subsaharan African | 258 | 1.0% |
| Swedish | 161 | 0.6% |
| Swiss | 119 | 0.5% |
| Thai | 42 | 0.2% |
| Tohono O'Odham | 89 | 0.4% |
| Ukrainian | 28 | 0.1% |
| Welsh | 89 | 0.4% |
| West Indian | 7 | 0.0% |
| Yuman | 59 | 0.2% | View All 76 Rows |
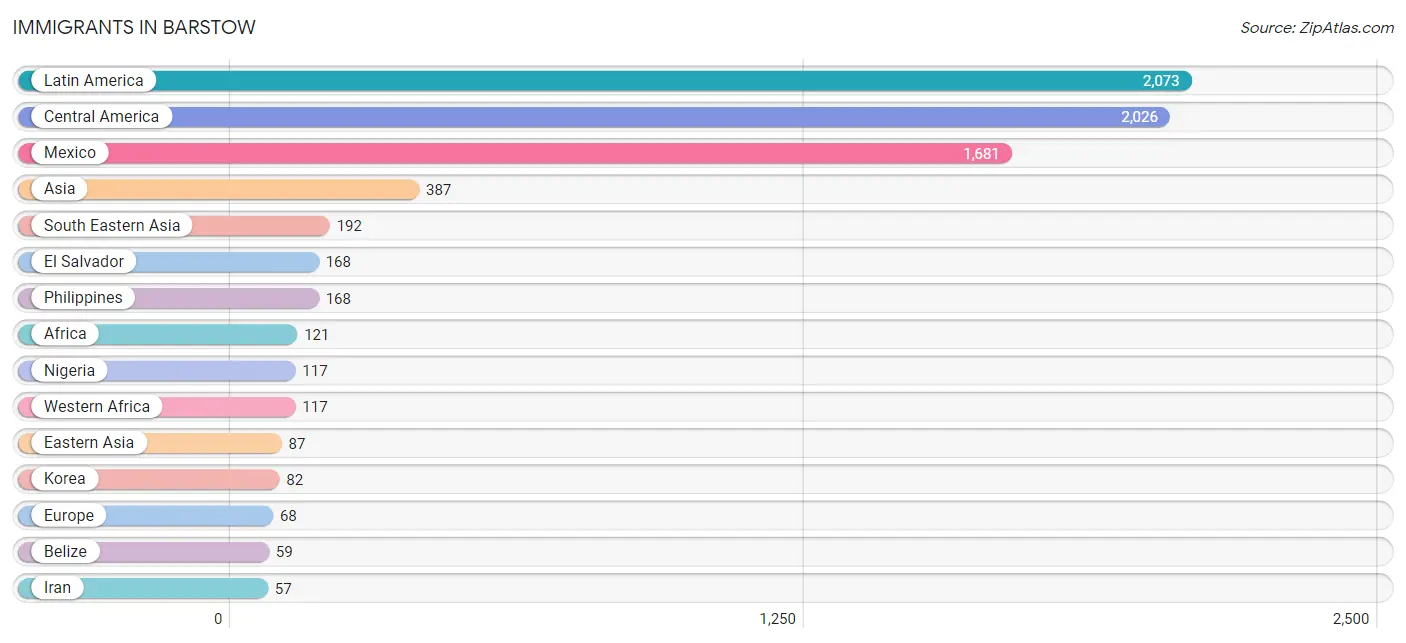
Immigrants in Barstow
The most numerous immigrant groups reported in Barstow came from Latin America (2,073 | 8.2%), Central America (2,026 | 8.0%), Mexico (1,681 | 6.7%), Asia (387 | 1.5%), and South Eastern Asia (192 | 0.8%), together accounting for 25.2% of all Barstow residents.
| Immigration Origin | # Population | % Population |
| Africa | 121 | 0.5% |
| Asia | 387 | 1.5% |
| Australia | 11 | 0.0% |
| Belize | 59 | 0.2% |
| Canada | 8 | 0.0% |
| Caribbean | 35 | 0.1% |
| Central America | 2,026 | 8.0% |
| China | 5 | 0.0% |
| Colombia | 5 | 0.0% |
| Cuba | 10 | 0.0% |
| Dominican Republic | 18 | 0.1% |
| Eastern Asia | 87 | 0.3% |
| Eastern Europe | 28 | 0.1% |
| Egypt | 4 | 0.0% |
| El Salvador | 168 | 0.7% |
| England | 7 | 0.0% |
| Europe | 68 | 0.3% |
| Germany | 24 | 0.1% |
| Guatemala | 53 | 0.2% |
| Honduras | 48 | 0.2% |
| Iran | 57 | 0.2% |
| Iraq | 34 | 0.1% |
| Italy | 9 | 0.0% |
| Jordan | 17 | 0.1% |
| Korea | 82 | 0.3% |
| Latin America | 2,073 | 8.2% |
| Mexico | 1,681 | 6.7% |
| Nicaragua | 17 | 0.1% |
| Nigeria | 117 | 0.5% |
| Northern Africa | 4 | 0.0% |
| Northern Europe | 7 | 0.0% |
| Oceania | 11 | 0.0% |
| Philippines | 168 | 0.7% |
| South America | 12 | 0.1% |
| South Central Asia | 57 | 0.2% |
| South Eastern Asia | 192 | 0.8% |
| Southern Europe | 9 | 0.0% |
| Ukraine | 28 | 0.1% |
| Venezuela | 7 | 0.0% |
| Vietnam | 24 | 0.1% |
| Western Africa | 117 | 0.5% |
| Western Asia | 51 | 0.2% |
| Western Europe | 24 | 0.1% | View All 43 Rows |
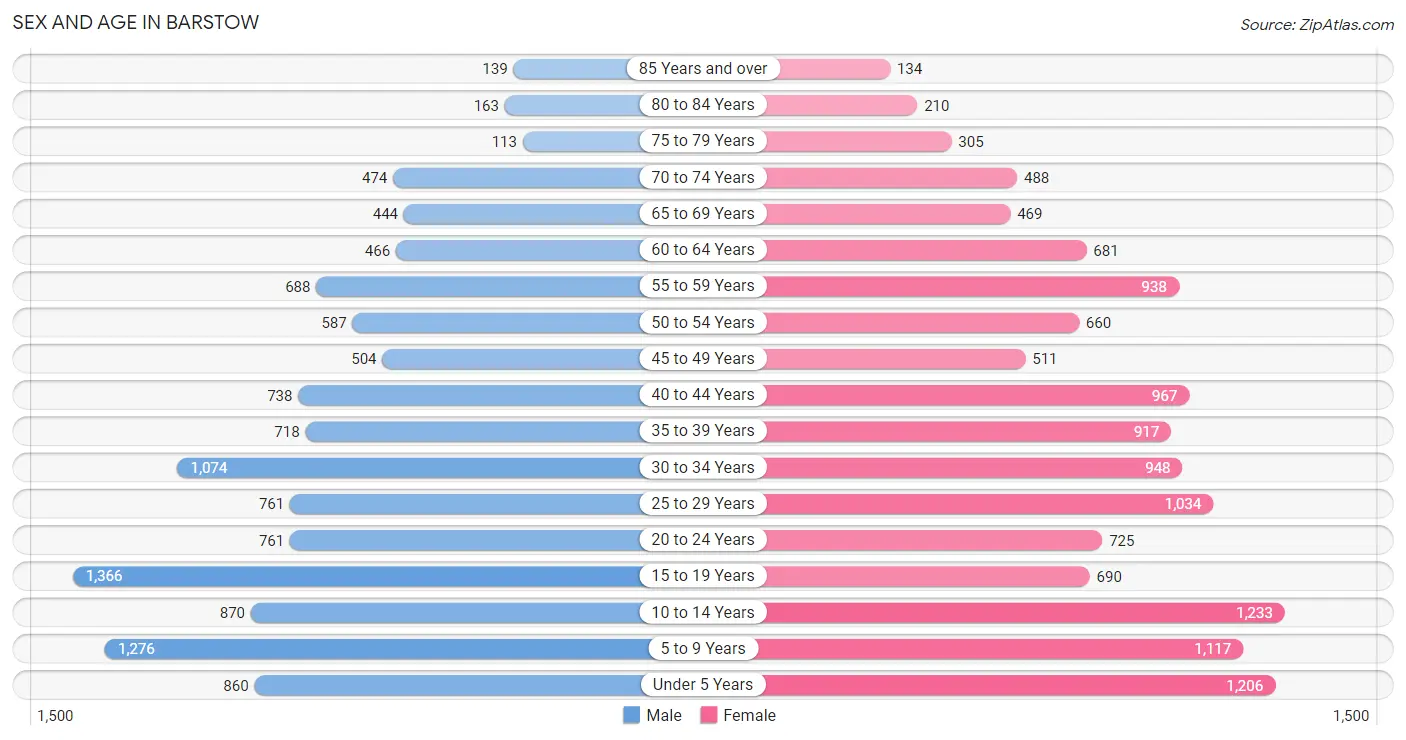
Sex and Age in Barstow
Sex and Age in Barstow
The most populous age groups in Barstow are 15 to 19 Years (1,366 | 11.4%) for men and 10 to 14 Years (1,233 | 9.3%) for women.
| Age Bracket | Male | Female |
| Under 5 Years | 860 (7.2%) | 1,206 (9.1%) |
| 5 to 9 Years | 1,276 (10.6%) | 1,117 (8.4%) |
| 10 to 14 Years | 870 (7.2%) | 1,233 (9.3%) |
| 15 to 19 Years | 1,366 (11.4%) | 690 (5.2%) |
| 20 to 24 Years | 761 (6.3%) | 725 (5.5%) |
| 25 to 29 Years | 761 (6.3%) | 1,034 (7.8%) |
| 30 to 34 Years | 1,074 (8.9%) | 948 (7.2%) |
| 35 to 39 Years | 718 (6.0%) | 917 (6.9%) |
| 40 to 44 Years | 738 (6.1%) | 967 (7.3%) |
| 45 to 49 Years | 504 (4.2%) | 511 (3.9%) |
| 50 to 54 Years | 587 (4.9%) | 660 (5.0%) |
| 55 to 59 Years | 688 (5.7%) | 938 (7.1%) |
| 60 to 64 Years | 466 (3.9%) | 681 (5.1%) |
| 65 to 69 Years | 444 (3.7%) | 469 (3.5%) |
| 70 to 74 Years | 474 (4.0%) | 488 (3.7%) |
| 75 to 79 Years | 113 (0.9%) | 305 (2.3%) |
| 80 to 84 Years | 163 (1.4%) | 210 (1.6%) |
| 85 Years and over | 139 (1.2%) | 134 (1.0%) |
| Total | 12,002 (100.0%) | 13,233 (100.0%) |
Families and Households in Barstow
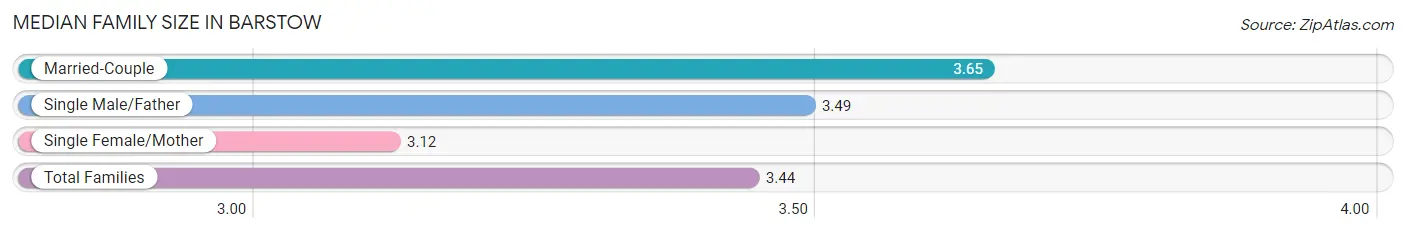
Median Family Size in Barstow
The median family size in Barstow is 3.44 persons per family, with married-couple families (2,945 | 49.6%) accounting for the largest median family size of 3.65 persons per family. On the other hand, single female/mother families (2,153 | 36.3%) represent the smallest median family size with 3.12 persons per family.
| Family Type | # Families | Family Size |
| Married-Couple | 2,945 (49.6%) | 3.65 |
| Single Male/Father | 834 (14.1%) | 3.49 |
| Single Female/Mother | 2,153 (36.3%) | 3.12 |
| Total Families | 5,932 (100.0%) | 3.44 |
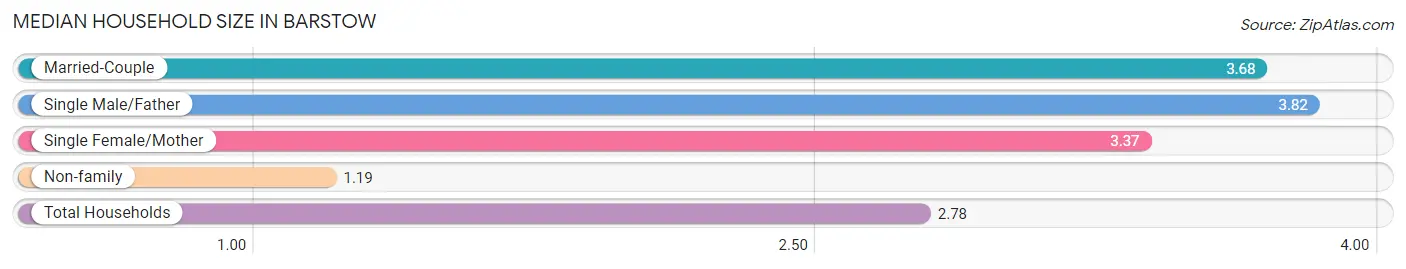
Median Household Size in Barstow
The median household size in Barstow is 2.78 persons per household, with single male/father households (834 | 9.3%) accounting for the largest median household size of 3.82 persons per household. non-family households (3,020 | 33.7%) represent the smallest median household size with 1.19 persons per household.
| Household Type | # Households | Household Size |
| Married-Couple | 2,945 (32.9%) | 3.68 |
| Single Male/Father | 834 (9.3%) | 3.82 |
| Single Female/Mother | 2,153 (24.0%) | 3.37 |
| Non-family | 3,020 (33.7%) | 1.19 |
| Total Households | 8,952 (100.0%) | 2.78 |
Household Size by Marriage Status in Barstow
Out of a total of 8,952 households in Barstow, 5,932 (66.3%) are family households, while 3,020 (33.7%) are nonfamily households. The most numerous type of family households are 2-person households, comprising 2,348, and the most common type of nonfamily households are 1-person households, comprising 2,478.
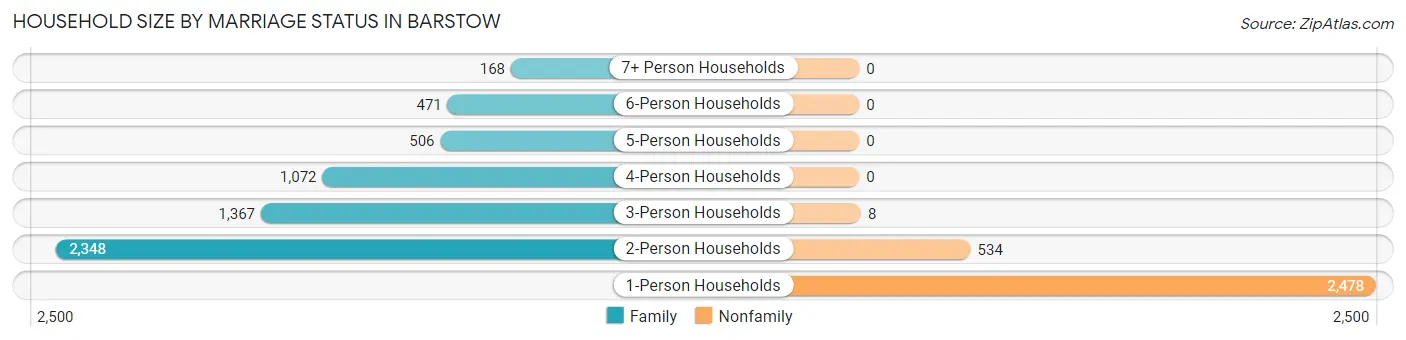
| Household Size | Family Households | Nonfamily Households |
| 1-Person Households | - | 2,478 (27.7%) |
| 2-Person Households | 2,348 (26.2%) | 534 (6.0%) |
| 3-Person Households | 1,367 (15.3%) | 8 (0.1%) |
| 4-Person Households | 1,072 (12.0%) | 0 (0.0%) |
| 5-Person Households | 506 (5.7%) | 0 (0.0%) |
| 6-Person Households | 471 (5.3%) | 0 (0.0%) |
| 7+ Person Households | 168 (1.9%) | 0 (0.0%) |
| Total | 5,932 (66.3%) | 3,020 (33.7%) |
Female Fertility in Barstow
Fertility by Age in Barstow
Average fertility rate in Barstow is 91.0 births per 1,000 women. Women in the age bracket of 20 to 34 years have the highest fertility rate with 140.0 births per 1,000 women. Women in the age bracket of 20 to 34 years acount for 69.0% of all women with births.
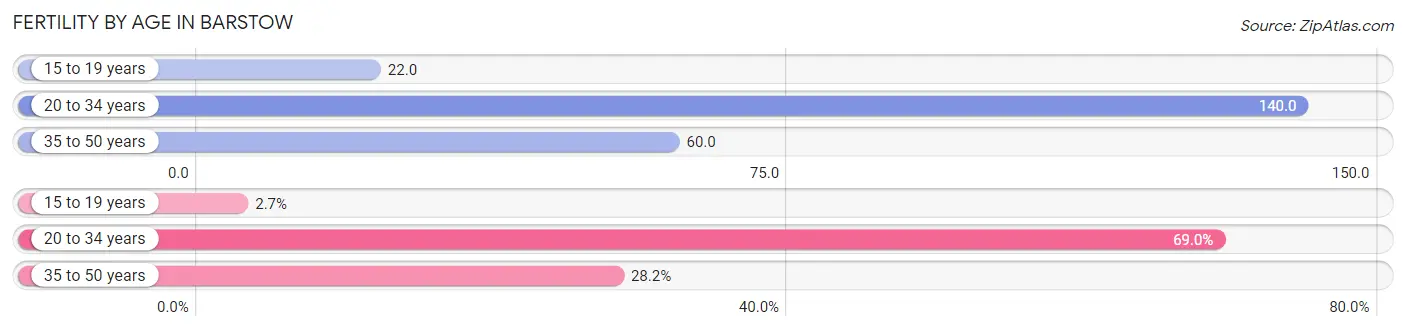
| Age Bracket | Women with Births | Births / 1,000 Women |
| 15 to 19 years | 15 (2.7%) | 22.0 |
| 20 to 34 years | 379 (69.0%) | 140.0 |
| 35 to 50 years | 155 (28.2%) | 60.0 |
| Total | 549 (100.0%) | 91.0 |
Fertility by Age by Marriage Status in Barstow
61.7% of women with births (549) in Barstow are married. The highest percentage of unmarried women with births falls into 20 to 34 years age bracket with 45.9% of them unmarried at the time of birth, while the lowest percentage of unmarried women with births belong to 15 to 19 years age bracket with 0.0% of them unmarried.
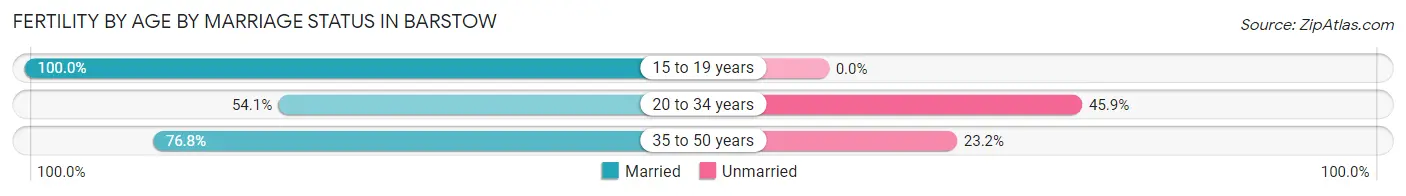
| Age Bracket | Married | Unmarried |
| 15 to 19 years | 15 (100.0%) | 0 (0.0%) |
| 20 to 34 years | 205 (54.1%) | 174 (45.9%) |
| 35 to 50 years | 119 (76.8%) | 36 (23.2%) |
| Total | 339 (61.8%) | 210 (38.3%) |
Fertility by Education in Barstow
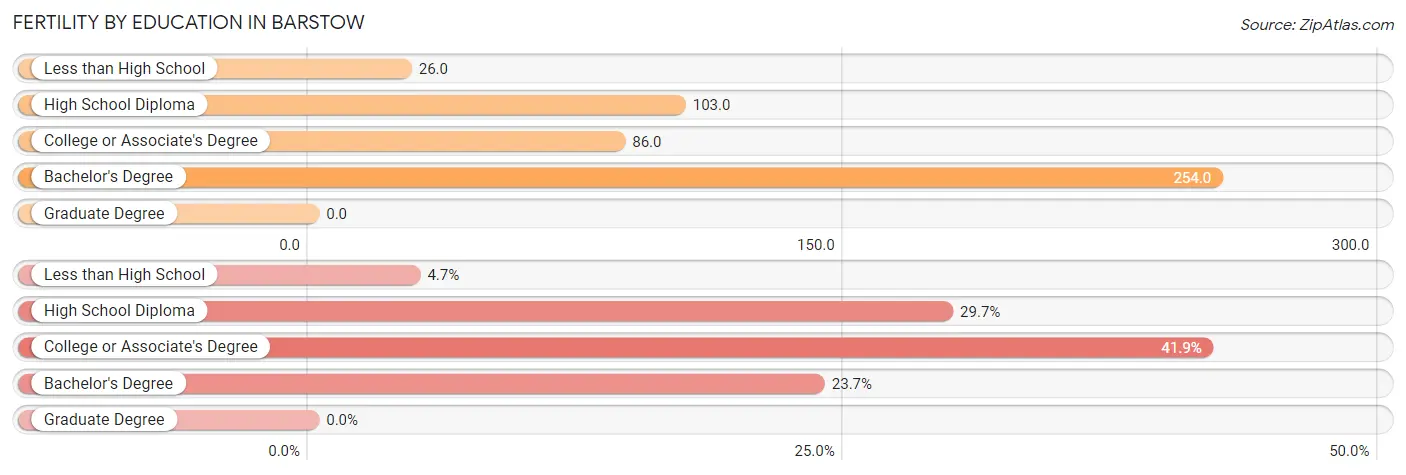
| Educational Attainment | Women with Births | Births / 1,000 Women |
| Less than High School | 26 (4.7%) | 26.0 |
| High School Diploma | 163 (29.7%) | 103.0 |
| College or Associate's Degree | 230 (41.9%) | 86.0 |
| Bachelor's Degree | 130 (23.7%) | 254.0 |
| Graduate Degree | 0 (0.0%) | 0.0 |
| Total | 549 (100.0%) | 91.0 |
Fertility by Education by Marriage Status in Barstow
38.3% of women with births in Barstow are unmarried. Women with the educational attainment of bachelor's degree are most likely to be married with 100.0% of them married at childbirth, while women with the educational attainment of high school diploma are least likely to be married with 78.5% of them unmarried at childbirth.
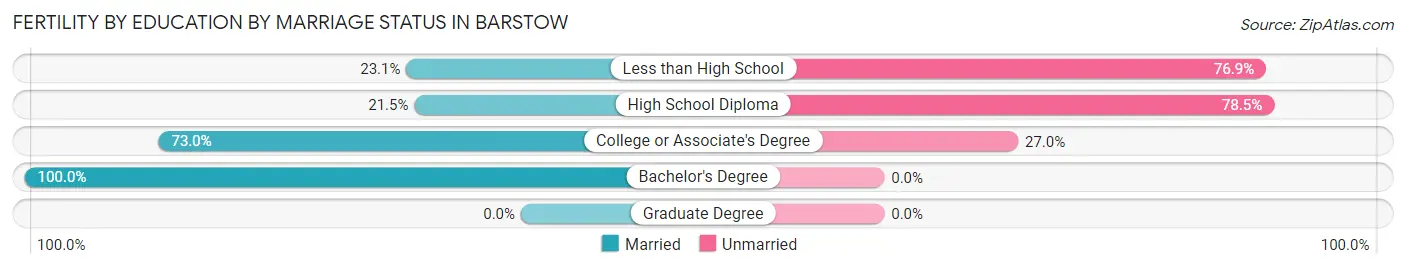
| Educational Attainment | Married | Unmarried |
| Less than High School | 6 (23.1%) | 20 (76.9%) |
| High School Diploma | 35 (21.5%) | 128 (78.5%) |
| College or Associate's Degree | 168 (73.0%) | 62 (27.0%) |
| Bachelor's Degree | 130 (100.0%) | 0 (0.0%) |
| Graduate Degree | 0 (0.0%) | 0 (0.0%) |
| Total | 339 (61.8%) | 210 (38.3%) |
Employment Characteristics in Barstow
Employment by Class of Employer in Barstow
Among the 8,973 employed individuals in Barstow, private company employees (5,116 | 57.0%), federal government employees (1,215 | 13.5%), and local government employees (1,093 | 12.2%) make up the most common classes of employment.

| Employer Class | # Employees | % Employees |
| Private Company Employees | 5,116 | 57.0% |
| Self-Employed (Incorporated) | 134 | 1.5% |
| Self-Employed (Not Incorporated) | 257 | 2.9% |
| Not-for-profit Organizations | 899 | 10.0% |
| Local Government Employees | 1,093 | 12.2% |
| State Government Employees | 259 | 2.9% |
| Federal Government Employees | 1,215 | 13.5% |
| Unpaid Family Workers | 0 | 0.0% |
| Total | 8,973 | 100.0% |
Employment Status by Age in Barstow
According to the labor force statistics for Barstow, out of the total population over 16 years of age (18,298), 55.3% or 10,119 individuals are in the labor force, with 9.1% or 921 of them unemployed. The age group with the highest labor force participation rate is 25 to 29 years, with 80.9% or 1,452 individuals in the labor force. Within the labor force, the 16 to 19 years age range has the highest percentage of unemployed individuals, with 32.3% or 174 of them being unemployed.
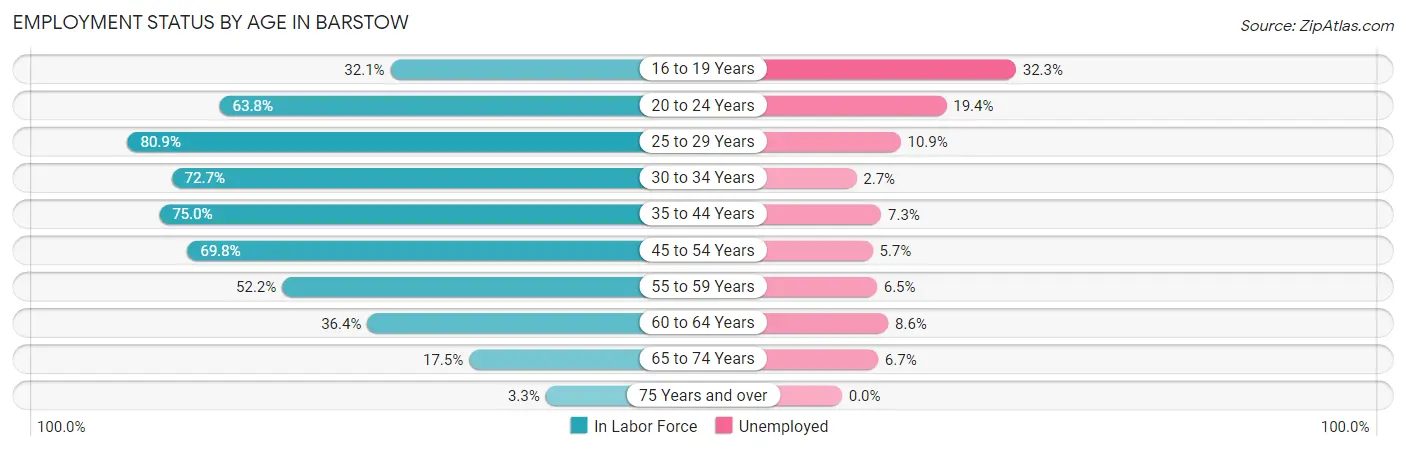
| Age Bracket | In Labor Force | Unemployed |
| 16 to 19 Years | 540 (32.1%) | 174 (32.3%) |
| 20 to 24 Years | 948 (63.8%) | 184 (19.4%) |
| 25 to 29 Years | 1,452 (80.9%) | 158 (10.9%) |
| 30 to 34 Years | 1,470 (72.7%) | 40 (2.7%) |
| 35 to 44 Years | 2,505 (75.0%) | 183 (7.3%) |
| 45 to 54 Years | 1,579 (69.8%) | 90 (5.7%) |
| 55 to 59 Years | 849 (52.2%) | 55 (6.5%) |
| 60 to 64 Years | 418 (36.4%) | 36 (8.6%) |
| 65 to 74 Years | 328 (17.5%) | 22 (6.7%) |
| 75 Years and over | 35 (3.3%) | 0 (0.0%) |
| Total | 10,119 (55.3%) | 921 (9.1%) |
Employment Status by Educational Attainment in Barstow
According to labor force statistics for Barstow, 67.8% of individuals (8,266) out of the total population between 25 and 64 years of age (12,192) are in the labor force, with 6.8% or 562 of them being unemployed. The group with the highest labor force participation rate are those with the educational attainment of bachelor's degree or higher, with 70.7% or 894 individuals in the labor force. Within the labor force, individuals with less than high school education have the highest percentage of unemployment, with 14.5% or 144 of them being unemployed.
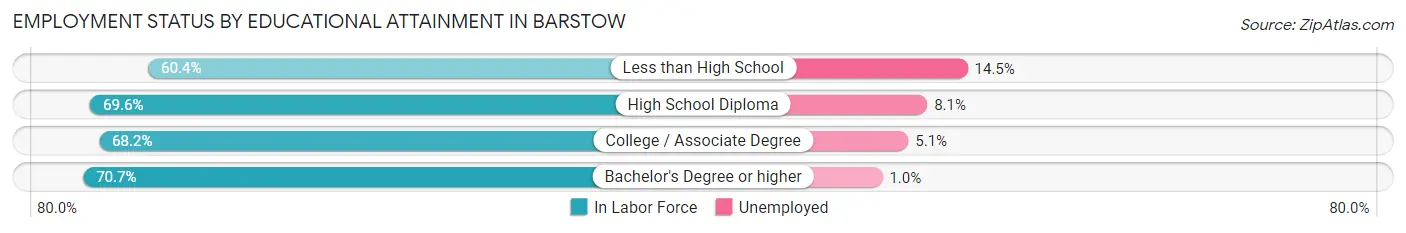
| Educational Attainment | In Labor Force | Unemployed |
| Less than High School | 995 (60.4%) | 239 (14.5%) |
| High School Diploma | 2,666 (69.6%) | 310 (8.1%) |
| College / Associate Degree | 3,716 (68.2%) | 278 (5.1%) |
| Bachelor's Degree or higher | 894 (70.7%) | 13 (1.0%) |
| Total | 8,266 (67.8%) | 829 (6.8%) |
Employment Occupations by Sex in Barstow
Management, Business, Science and Arts Occupations
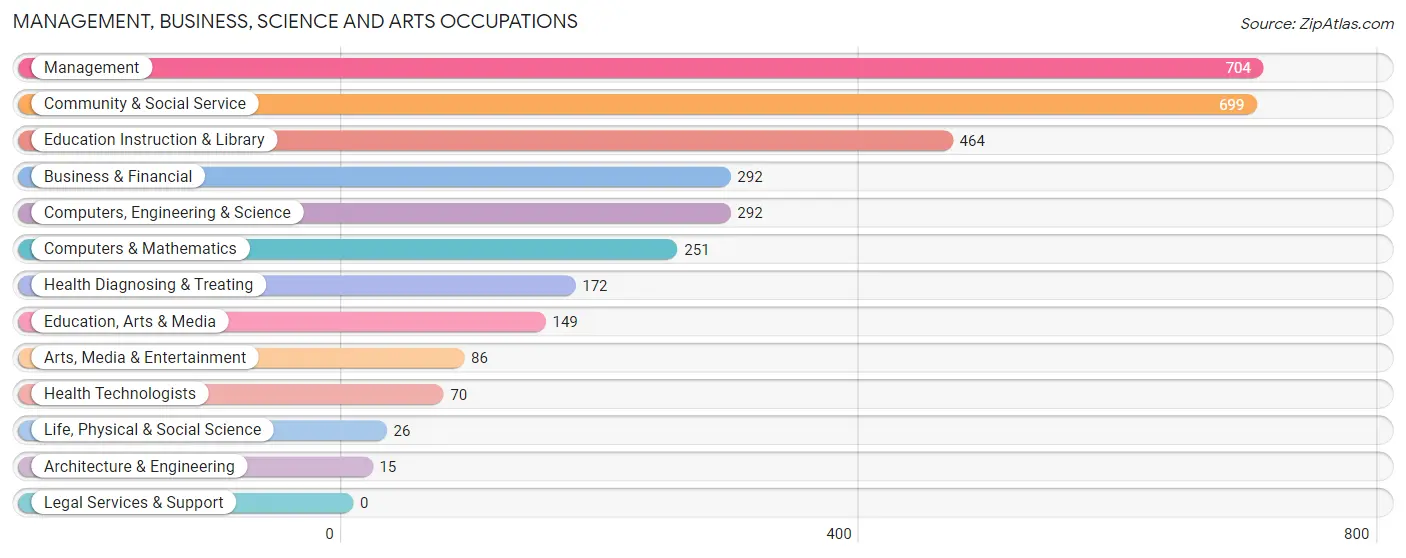
The most common Management, Business, Science and Arts occupations in Barstow are Management (704 | 7.8%), Community & Social Service (699 | 7.8%), Education Instruction & Library (464 | 5.2%), Business & Financial (292 | 3.3%), and Computers, Engineering & Science (292 | 3.3%).
Management, Business, Science and Arts Occupations by Sex
Within the Management, Business, Science and Arts occupations in Barstow, the most male-oriented occupations are Architecture & Engineering (100.0%), Computers & Mathematics (74.9%), and Computers, Engineering & Science (72.6%), while the most female-oriented occupations are Health Diagnosing & Treating (97.7%), Health Technologists (94.3%), and Education Instruction & Library (81.2%).
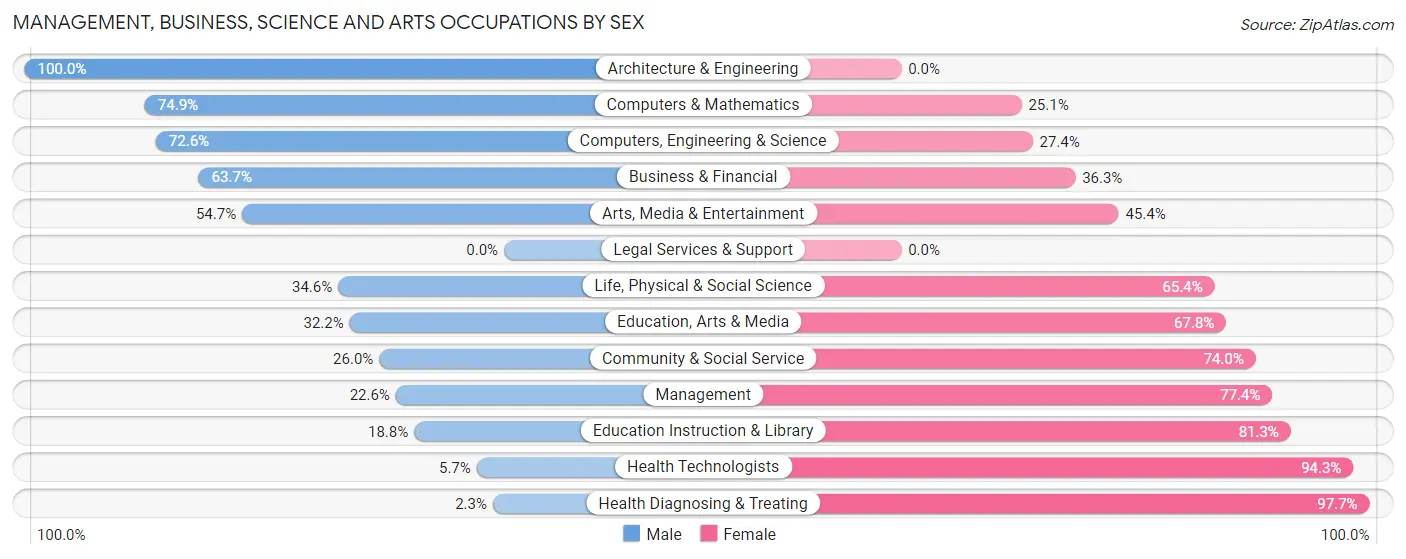
| Occupation | Male | Female |
| Management | 159 (22.6%) | 545 (77.4%) |
| Business & Financial | 186 (63.7%) | 106 (36.3%) |
| Computers, Engineering & Science | 212 (72.6%) | 80 (27.4%) |
| Computers & Mathematics | 188 (74.9%) | 63 (25.1%) |
| Architecture & Engineering | 15 (100.0%) | 0 (0.0%) |
| Life, Physical & Social Science | 9 (34.6%) | 17 (65.4%) |
| Community & Social Service | 182 (26.0%) | 517 (74.0%) |
| Education, Arts & Media | 48 (32.2%) | 101 (67.8%) |
| Legal Services & Support | 0 (0.0%) | 0 (0.0%) |
| Education Instruction & Library | 87 (18.8%) | 377 (81.2%) |
| Arts, Media & Entertainment | 47 (54.6%) | 39 (45.4%) |
| Health Diagnosing & Treating | 4 (2.3%) | 168 (97.7%) |
| Health Technologists | 4 (5.7%) | 66 (94.3%) |
| Total (Category) | 743 (34.4%) | 1,416 (65.6%) |
| Total (Overall) | 4,855 (54.0%) | 4,130 (46.0%) |
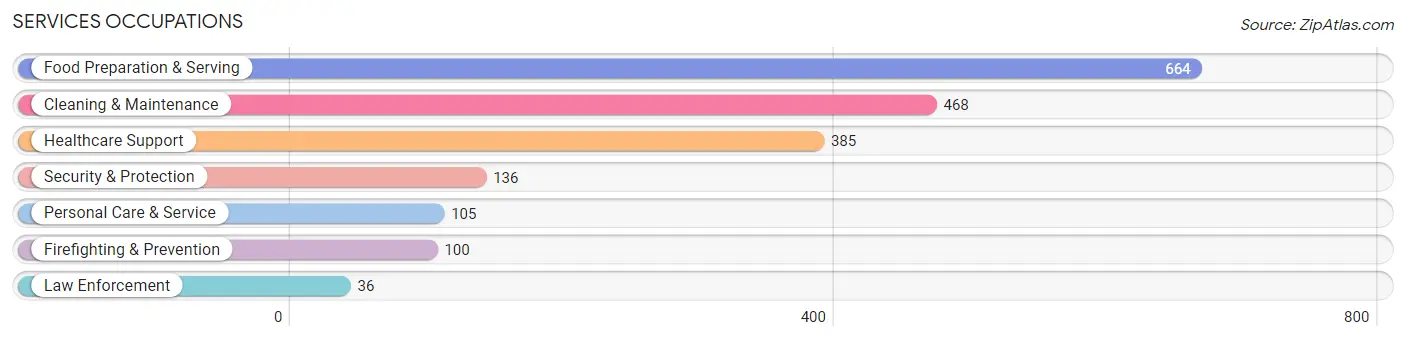
Services Occupations
The most common Services occupations in Barstow are Food Preparation & Serving (664 | 7.4%), Cleaning & Maintenance (468 | 5.2%), Healthcare Support (385 | 4.3%), Security & Protection (136 | 1.5%), and Personal Care & Service (105 | 1.2%).
Services Occupations by Sex
Within the Services occupations in Barstow, the most male-oriented occupations are Law Enforcement (100.0%), Food Preparation & Serving (71.2%), and Cleaning & Maintenance (65.8%), while the most female-oriented occupations are Healthcare Support (97.1%), Personal Care & Service (86.7%), and Firefighting & Prevention (69.0%).
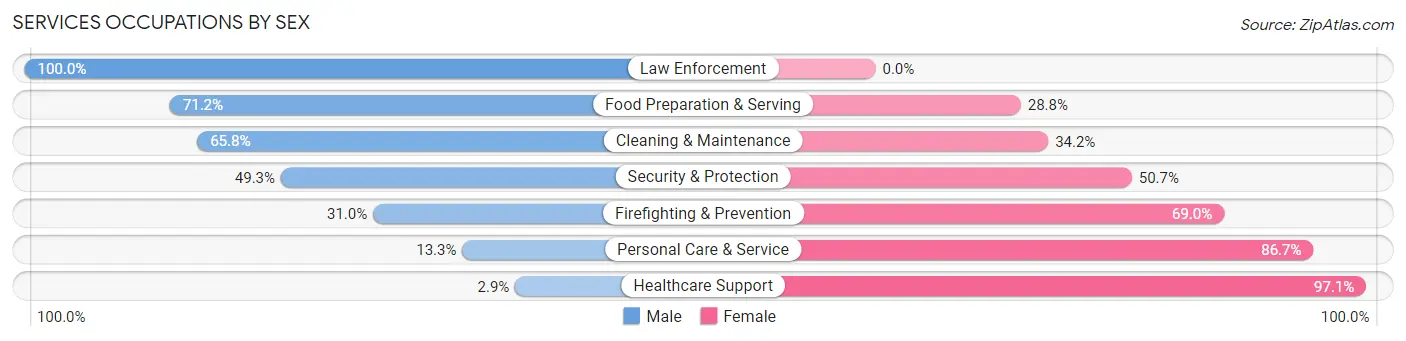
| Occupation | Male | Female |
| Healthcare Support | 11 (2.9%) | 374 (97.1%) |
| Security & Protection | 67 (49.3%) | 69 (50.7%) |
| Firefighting & Prevention | 31 (31.0%) | 69 (69.0%) |
| Law Enforcement | 36 (100.0%) | 0 (0.0%) |
| Food Preparation & Serving | 473 (71.2%) | 191 (28.8%) |
| Cleaning & Maintenance | 308 (65.8%) | 160 (34.2%) |
| Personal Care & Service | 14 (13.3%) | 91 (86.7%) |
| Total (Category) | 873 (49.7%) | 885 (50.3%) |
| Total (Overall) | 4,855 (54.0%) | 4,130 (46.0%) |
Sales and Office Occupations
The most common Sales and Office occupations in Barstow are Sales & Related (1,184 | 13.2%), and Office & Administration (918 | 10.2%).

Sales and Office Occupations by Sex
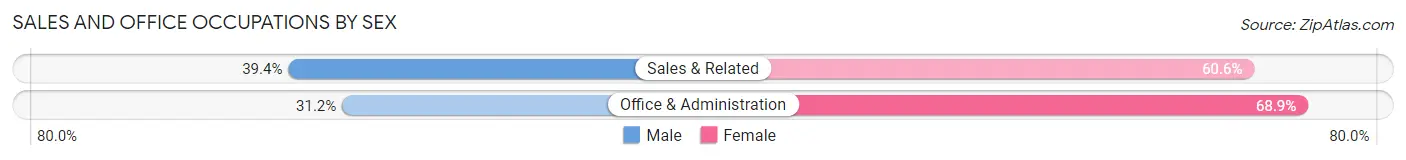
| Occupation | Male | Female |
| Sales & Related | 467 (39.4%) | 717 (60.6%) |
| Office & Administration | 286 (31.1%) | 632 (68.9%) |
| Total (Category) | 753 (35.8%) | 1,349 (64.2%) |
| Total (Overall) | 4,855 (54.0%) | 4,130 (46.0%) |
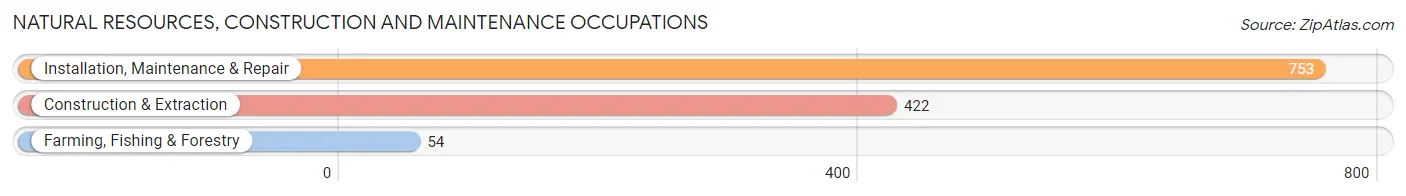
Natural Resources, Construction and Maintenance Occupations
The most common Natural Resources, Construction and Maintenance occupations in Barstow are Installation, Maintenance & Repair (753 | 8.4%), Construction & Extraction (422 | 4.7%), and Farming, Fishing & Forestry (54 | 0.6%).
Natural Resources, Construction and Maintenance Occupations by Sex
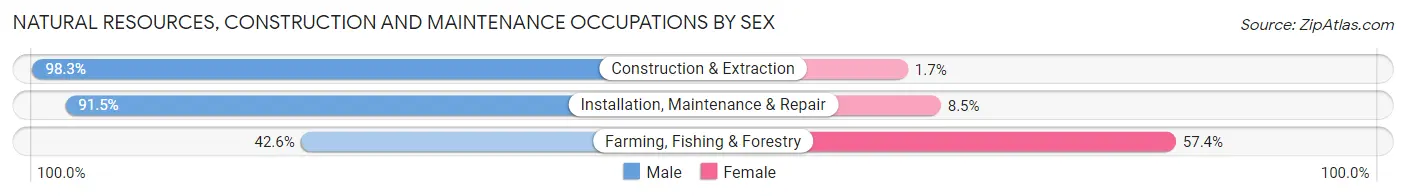
| Occupation | Male | Female |
| Farming, Fishing & Forestry | 23 (42.6%) | 31 (57.4%) |
| Construction & Extraction | 415 (98.3%) | 7 (1.7%) |
| Installation, Maintenance & Repair | 689 (91.5%) | 64 (8.5%) |
| Total (Category) | 1,127 (91.7%) | 102 (8.3%) |
| Total (Overall) | 4,855 (54.0%) | 4,130 (46.0%) |
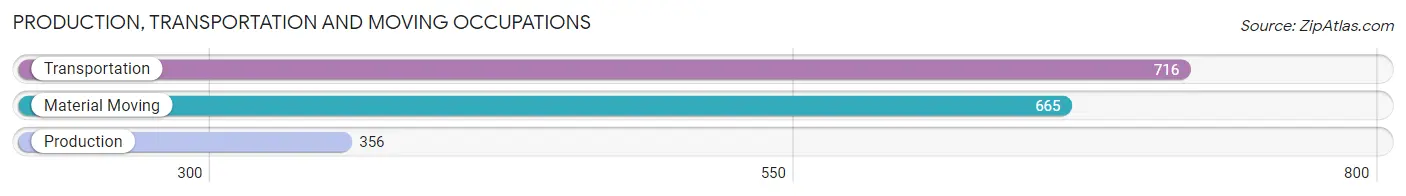
Production, Transportation and Moving Occupations
The most common Production, Transportation and Moving occupations in Barstow are Transportation (716 | 8.0%), Material Moving (665 | 7.4%), and Production (356 | 4.0%).
Production, Transportation and Moving Occupations by Sex
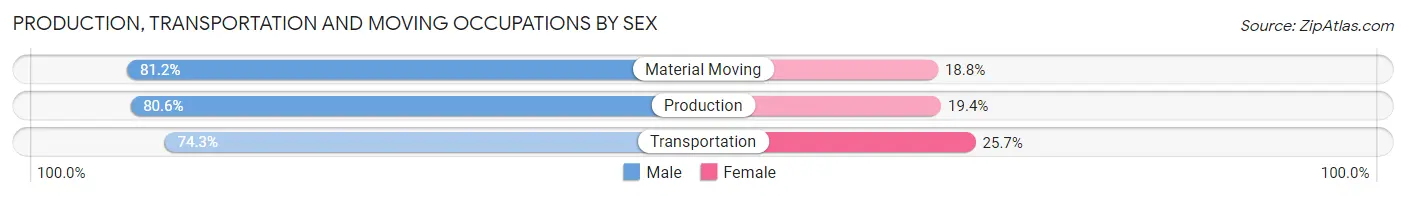
| Occupation | Male | Female |
| Production | 287 (80.6%) | 69 (19.4%) |
| Transportation | 532 (74.3%) | 184 (25.7%) |
| Material Moving | 540 (81.2%) | 125 (18.8%) |
| Total (Category) | 1,359 (78.2%) | 378 (21.8%) |
| Total (Overall) | 4,855 (54.0%) | 4,130 (46.0%) |
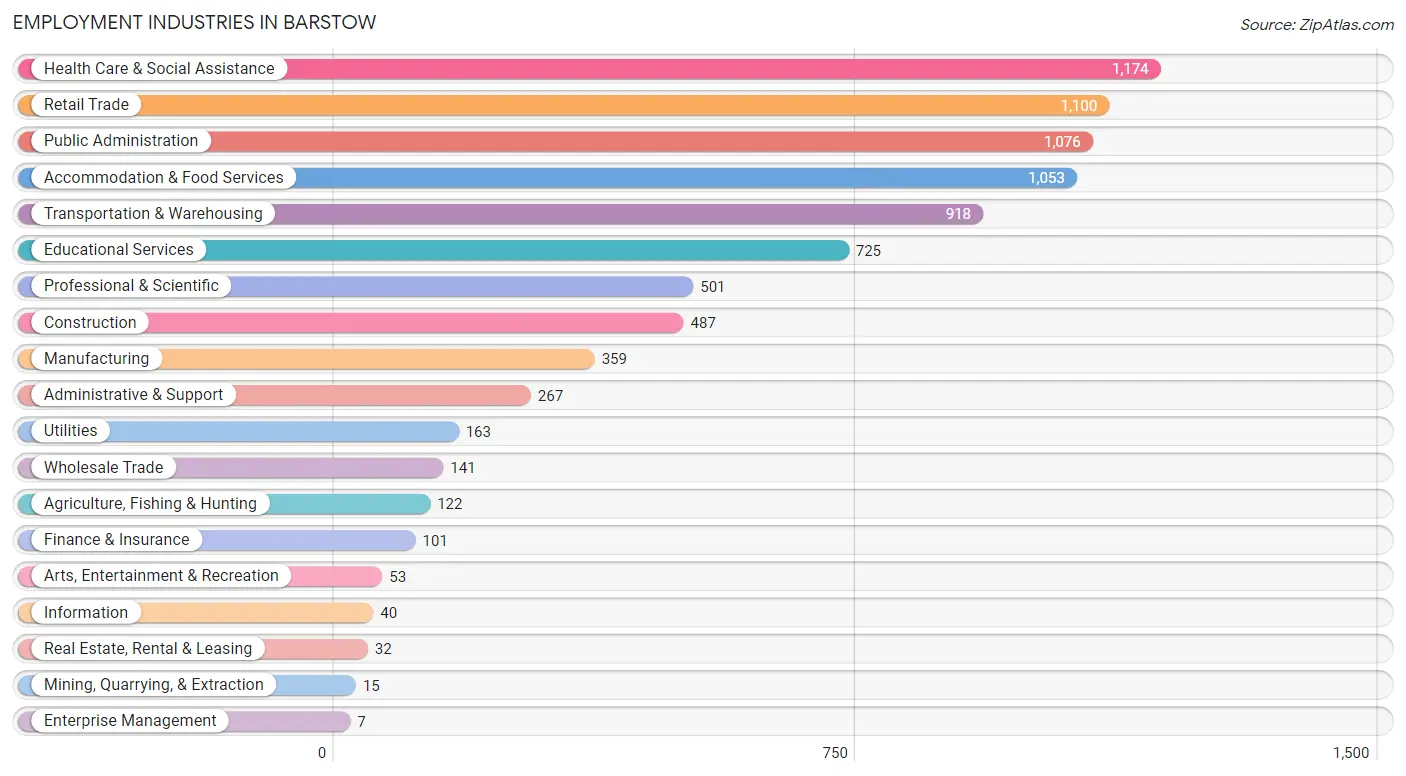
Employment Industries by Sex in Barstow
Employment Industries in Barstow
The major employment industries in Barstow include Health Care & Social Assistance (1,174 | 13.1%), Retail Trade (1,100 | 12.2%), Public Administration (1,076 | 12.0%), Accommodation & Food Services (1,053 | 11.7%), and Transportation & Warehousing (918 | 10.2%).
Employment Industries by Sex in Barstow
The Barstow industries that see more men than women are Wholesale Trade (100.0%), Construction (98.6%), and Mining, Quarrying, & Extraction (80.0%), whereas the industries that tend to have a higher number of women are Information (100.0%), Enterprise Management (100.0%), and Health Care & Social Assistance (85.5%).
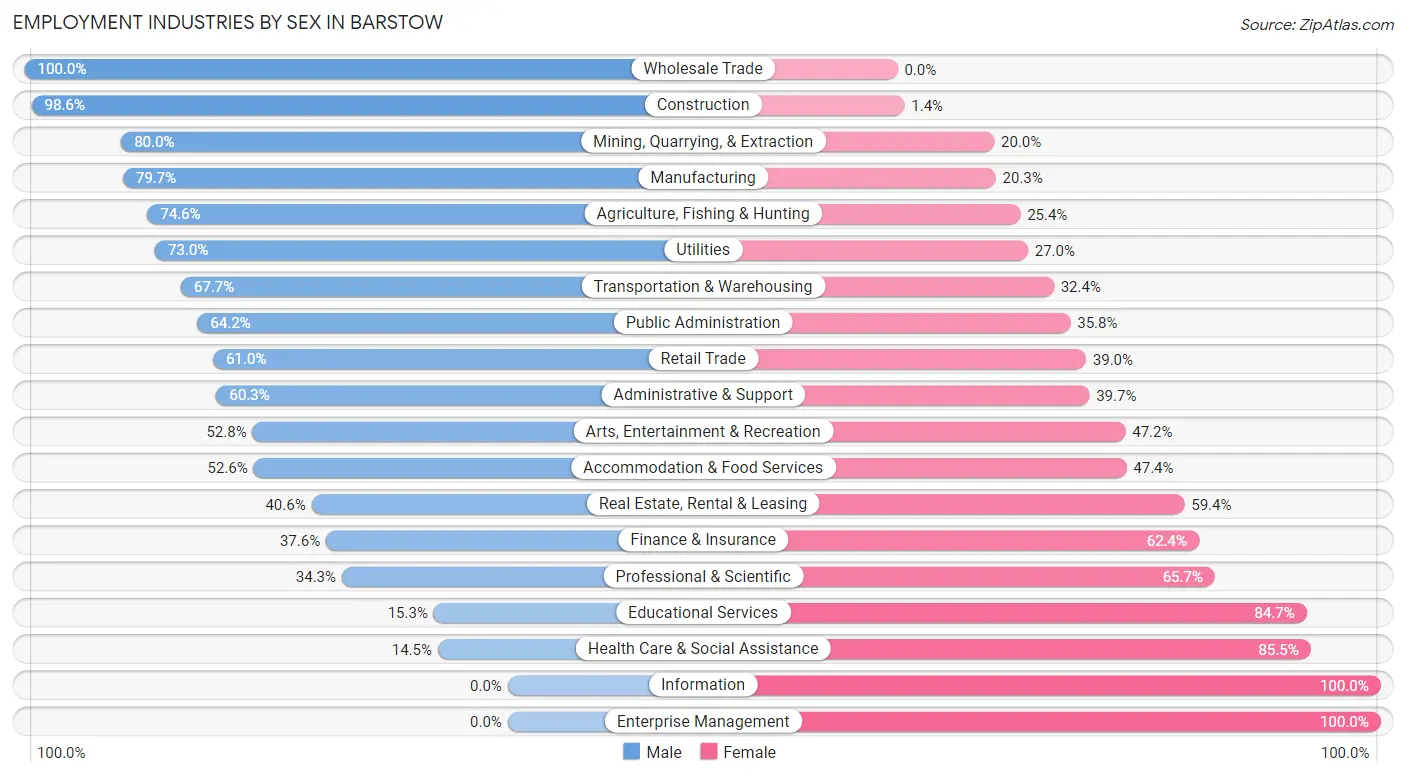
| Industry | Male | Female |
| Agriculture, Fishing & Hunting | 91 (74.6%) | 31 (25.4%) |
| Mining, Quarrying, & Extraction | 12 (80.0%) | 3 (20.0%) |
| Construction | 480 (98.6%) | 7 (1.4%) |
| Manufacturing | 286 (79.7%) | 73 (20.3%) |
| Wholesale Trade | 141 (100.0%) | 0 (0.0%) |
| Retail Trade | 671 (61.0%) | 429 (39.0%) |
| Transportation & Warehousing | 621 (67.6%) | 297 (32.4%) |
| Utilities | 119 (73.0%) | 44 (27.0%) |
| Information | 0 (0.0%) | 40 (100.0%) |
| Finance & Insurance | 38 (37.6%) | 63 (62.4%) |
| Real Estate, Rental & Leasing | 13 (40.6%) | 19 (59.4%) |
| Professional & Scientific | 172 (34.3%) | 329 (65.7%) |
| Enterprise Management | 0 (0.0%) | 7 (100.0%) |
| Administrative & Support | 161 (60.3%) | 106 (39.7%) |
| Educational Services | 111 (15.3%) | 614 (84.7%) |
| Health Care & Social Assistance | 170 (14.5%) | 1,004 (85.5%) |
| Arts, Entertainment & Recreation | 28 (52.8%) | 25 (47.2%) |
| Accommodation & Food Services | 554 (52.6%) | 499 (47.4%) |
| Public Administration | 691 (64.2%) | 385 (35.8%) |
| Total | 4,855 (54.0%) | 4,130 (46.0%) |
Education in Barstow
School Enrollment in Barstow
The most common levels of schooling among the 7,306 students in Barstow are elementary school (1,947 | 26.7%), middle school (1,706 | 23.4%), and high school (1,652 | 22.6%).
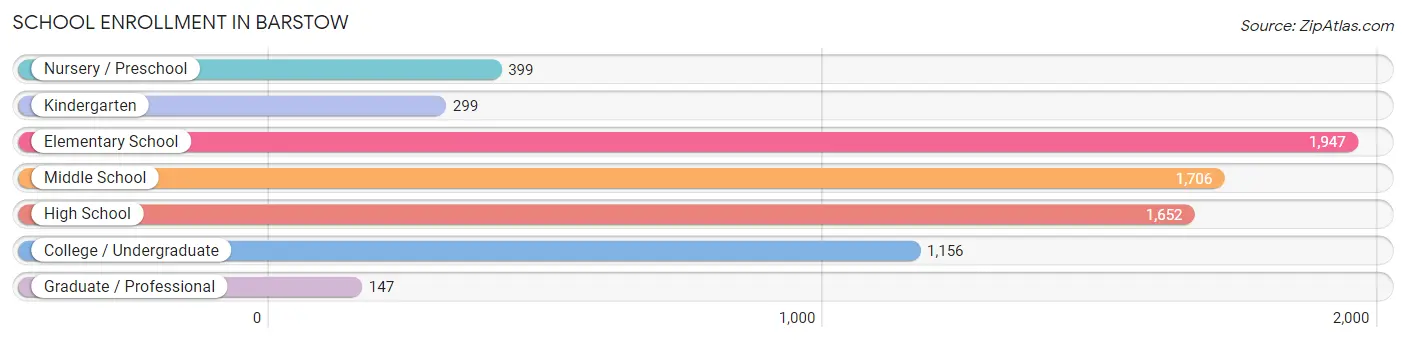
| School Level | # Students | % Students |
| Nursery / Preschool | 399 | 5.5% |
| Kindergarten | 299 | 4.1% |
| Elementary School | 1,947 | 26.7% |
| Middle School | 1,706 | 23.4% |
| High School | 1,652 | 22.6% |
| College / Undergraduate | 1,156 | 15.8% |
| Graduate / Professional | 147 | 2.0% |
| Total | 7,306 | 100.0% |
School Enrollment by Age by Funding Source in Barstow
Out of a total of 7,306 students who are enrolled in schools in Barstow, 862 (11.8%) attend a private institution, while the remaining 6,444 (88.2%) are enrolled in public schools. The age group of 35 years and over has the highest likelihood of being enrolled in private schools, with 175 (50.9% in the age bracket) enrolled. Conversely, the age group of 18 to 19 year olds has the lowest likelihood of being enrolled in a private school, with 429 (100.0% in the age bracket) attending a public institution.
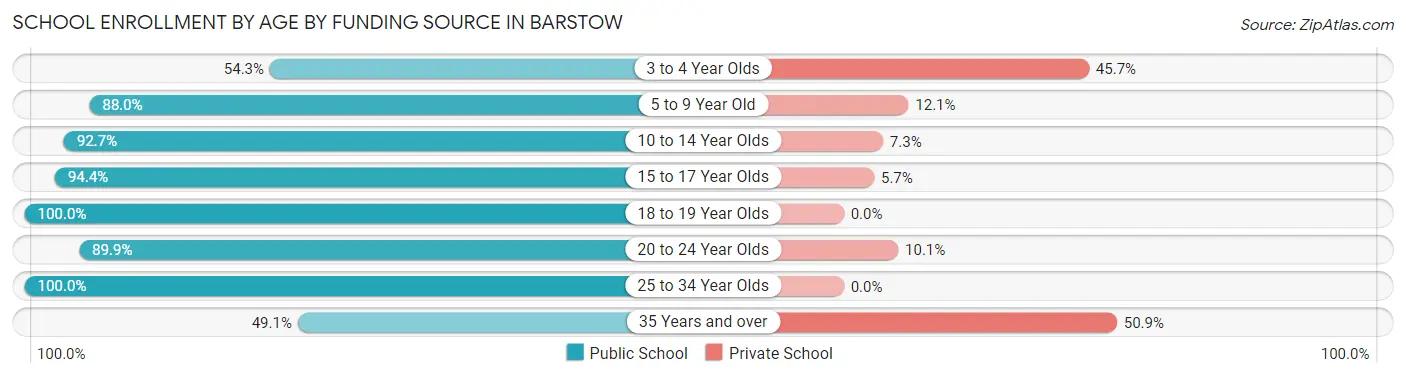
| Age Bracket | Public School | Private School |
| 3 to 4 Year Olds | 195 (54.3%) | 164 (45.7%) |
| 5 to 9 Year Old | 1,847 (87.9%) | 253 (12.0%) |
| 10 to 14 Year Olds | 1,940 (92.7%) | 153 (7.3%) |
| 15 to 17 Year Olds | 1,086 (94.4%) | 65 (5.7%) |
| 18 to 19 Year Olds | 429 (100.0%) | 0 (0.0%) |
| 20 to 24 Year Olds | 434 (89.9%) | 49 (10.1%) |
| 25 to 34 Year Olds | 347 (100.0%) | 0 (0.0%) |
| 35 Years and over | 169 (49.1%) | 175 (50.9%) |
| Total | 6,444 (88.2%) | 862 (11.8%) |
Educational Attainment by Field of Study in Barstow
Business (418 | 25.7%), social sciences (213 | 13.1%), science & technology (194 | 11.9%), arts & humanities (185 | 11.4%), and education (172 | 10.6%) are the most common fields of study among 1,627 individuals in Barstow who have obtained a bachelor's degree or higher.
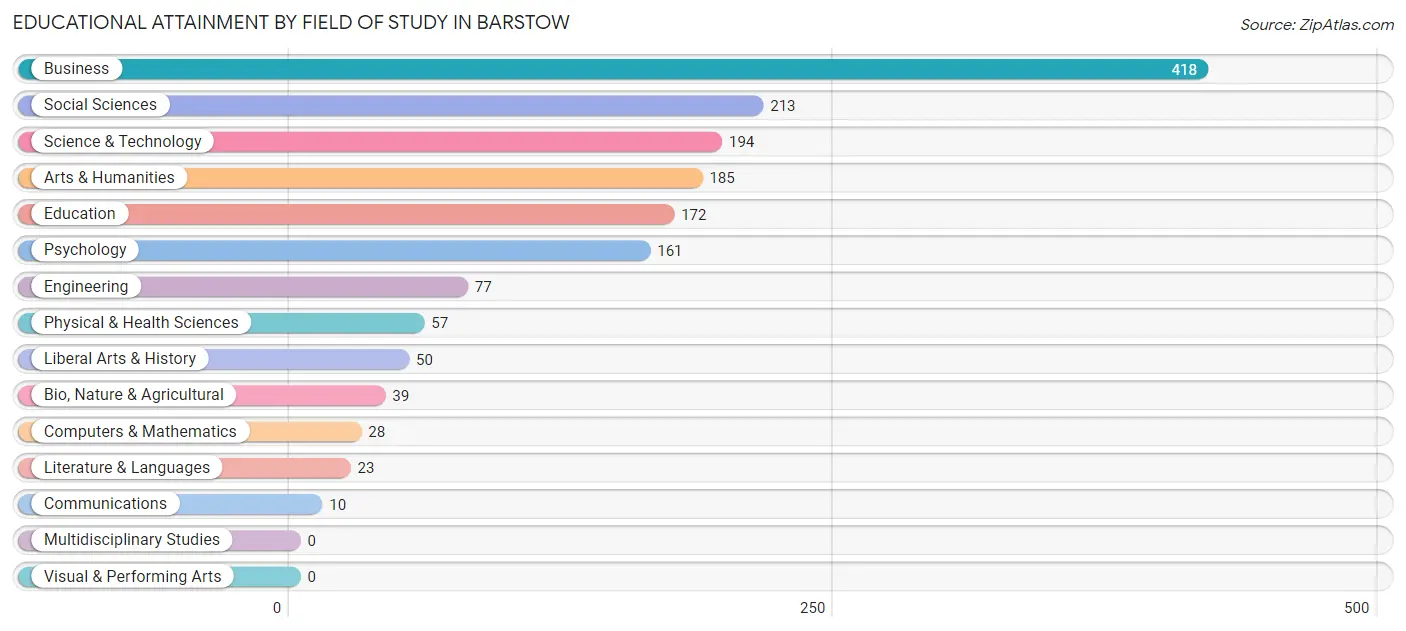
| Field of Study | # Graduates | % Graduates |
| Computers & Mathematics | 28 | 1.7% |
| Bio, Nature & Agricultural | 39 | 2.4% |
| Physical & Health Sciences | 57 | 3.5% |
| Psychology | 161 | 9.9% |
| Social Sciences | 213 | 13.1% |
| Engineering | 77 | 4.7% |
| Multidisciplinary Studies | 0 | 0.0% |
| Science & Technology | 194 | 11.9% |
| Business | 418 | 25.7% |
| Education | 172 | 10.6% |
| Literature & Languages | 23 | 1.4% |
| Liberal Arts & History | 50 | 3.1% |
| Visual & Performing Arts | 0 | 0.0% |
| Communications | 10 | 0.6% |
| Arts & Humanities | 185 | 11.4% |
| Total | 1,627 | 100.0% |
Transportation & Commute in Barstow
Vehicle Availability by Sex in Barstow
The most prevalent vehicle ownership categories in Barstow are males with 2 vehicles (2,058, accounting for 42.1%) and females with 2 vehicles (1,359, making up 51.4%).
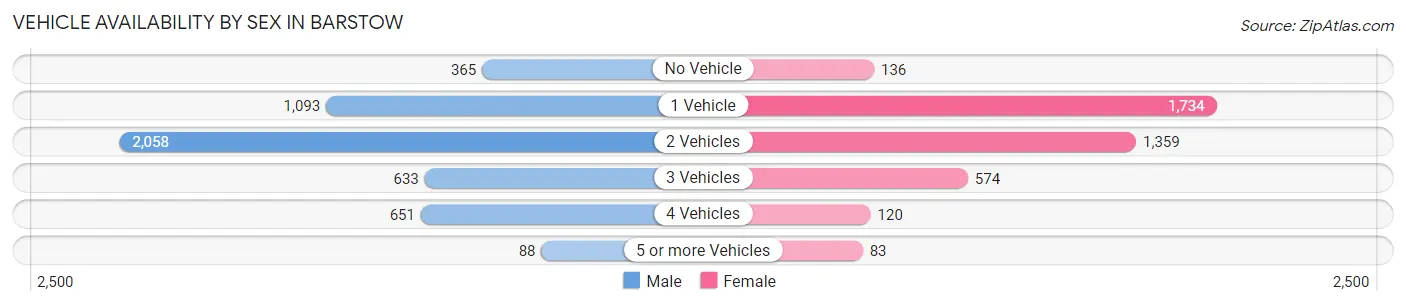
| Vehicles Available | Male | Female |
| No Vehicle | 365 (7.5%) | 136 (3.4%) |
| 1 Vehicle | 1,093 (22.4%) | 1,734 (43.3%) |
| 2 Vehicles | 2,058 (42.1%) | 1,359 (33.9%) |
| 3 Vehicles | 633 (13.0%) | 574 (14.3%) |
| 4 Vehicles | 651 (13.3%) | 120 (3.0%) |
| 5 or more Vehicles | 88 (1.8%) | 83 (2.1%) |
| Total | 4,888 (100.0%) | 4,006 (100.0%) |
Commute Time in Barstow
The most frequently occuring commute durations in Barstow are 5 to 9 minutes (1,819 commuters, 21.1%), 10 to 14 minutes (1,567 commuters, 18.1%), and 45 to 59 minutes (1,461 commuters, 16.9%).
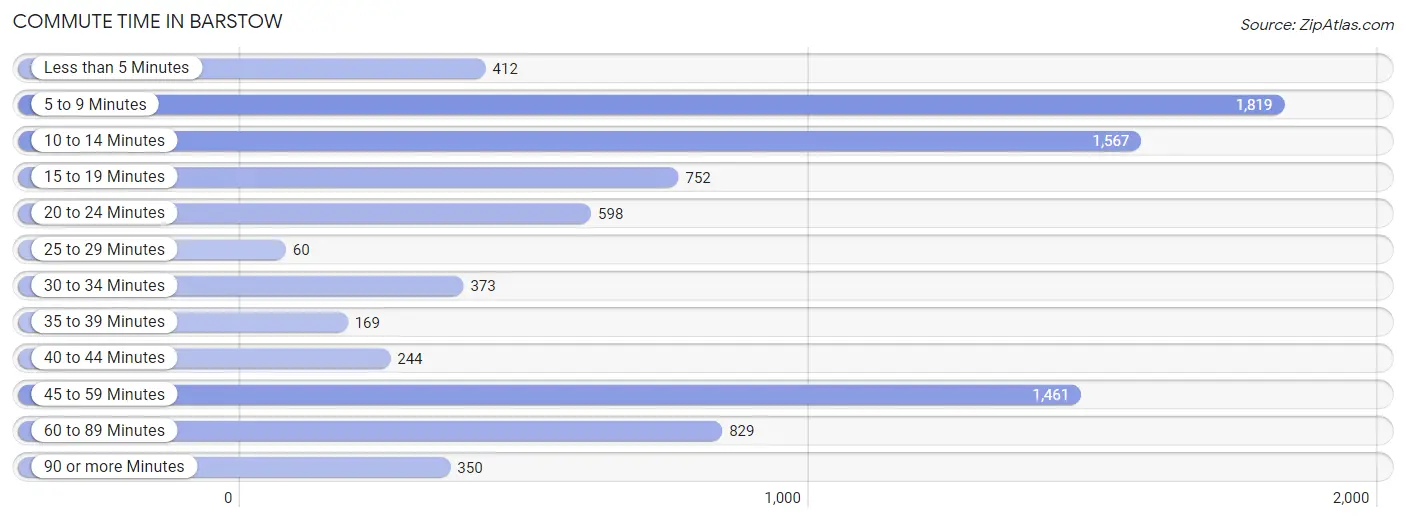
| Commute Time | # Commuters | % Commuters |
| Less than 5 Minutes | 412 | 4.8% |
| 5 to 9 Minutes | 1,819 | 21.1% |
| 10 to 14 Minutes | 1,567 | 18.1% |
| 15 to 19 Minutes | 752 | 8.7% |
| 20 to 24 Minutes | 598 | 6.9% |
| 25 to 29 Minutes | 60 | 0.7% |
| 30 to 34 Minutes | 373 | 4.3% |
| 35 to 39 Minutes | 169 | 2.0% |
| 40 to 44 Minutes | 244 | 2.8% |
| 45 to 59 Minutes | 1,461 | 16.9% |
| 60 to 89 Minutes | 829 | 9.6% |
| 90 or more Minutes | 350 | 4.1% |
Commute Time by Sex in Barstow
The most common commute times in Barstow are 10 to 14 minutes (936 commuters, 19.6%) for males and 5 to 9 minutes (1,102 commuters, 28.6%) for females.
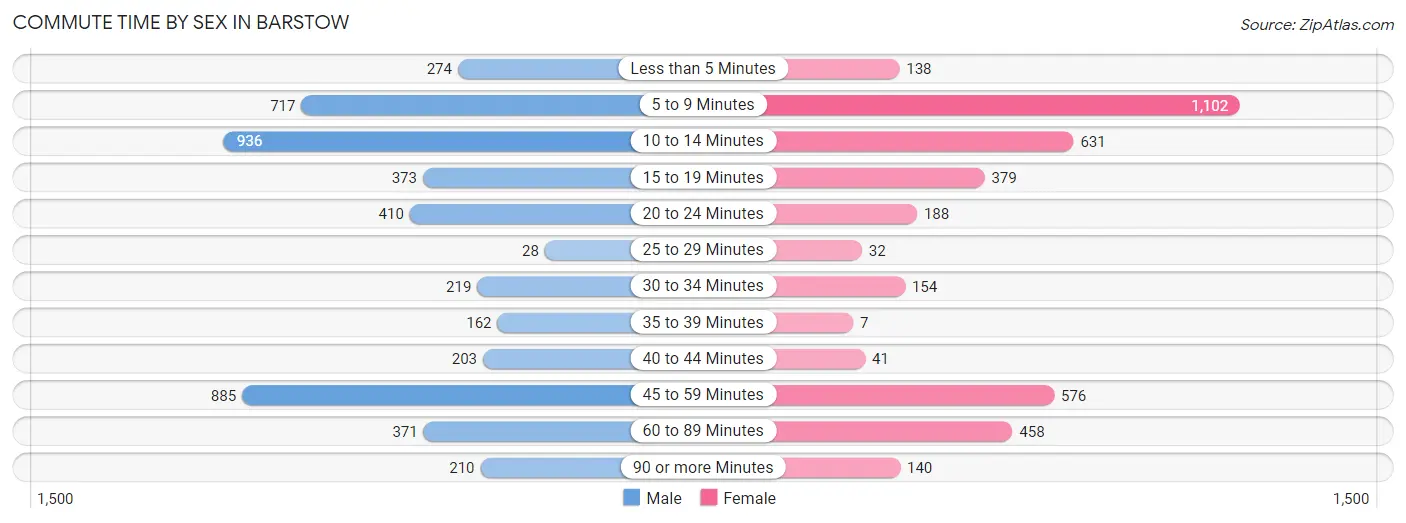
| Commute Time | Male | Female |
| Less than 5 Minutes | 274 (5.7%) | 138 (3.6%) |
| 5 to 9 Minutes | 717 (15.0%) | 1,102 (28.6%) |
| 10 to 14 Minutes | 936 (19.6%) | 631 (16.4%) |
| 15 to 19 Minutes | 373 (7.8%) | 379 (9.9%) |
| 20 to 24 Minutes | 410 (8.6%) | 188 (4.9%) |
| 25 to 29 Minutes | 28 (0.6%) | 32 (0.8%) |
| 30 to 34 Minutes | 219 (4.6%) | 154 (4.0%) |
| 35 to 39 Minutes | 162 (3.4%) | 7 (0.2%) |
| 40 to 44 Minutes | 203 (4.2%) | 41 (1.1%) |
| 45 to 59 Minutes | 885 (18.5%) | 576 (15.0%) |
| 60 to 89 Minutes | 371 (7.7%) | 458 (11.9%) |
| 90 or more Minutes | 210 (4.4%) | 140 (3.6%) |
Time of Departure to Work by Sex in Barstow
The most frequent times of departure to work in Barstow are 12:00 AM to 4:59 AM (664, 13.9%) for males and 6:30 AM to 6:59 AM (607, 15.8%) for females.
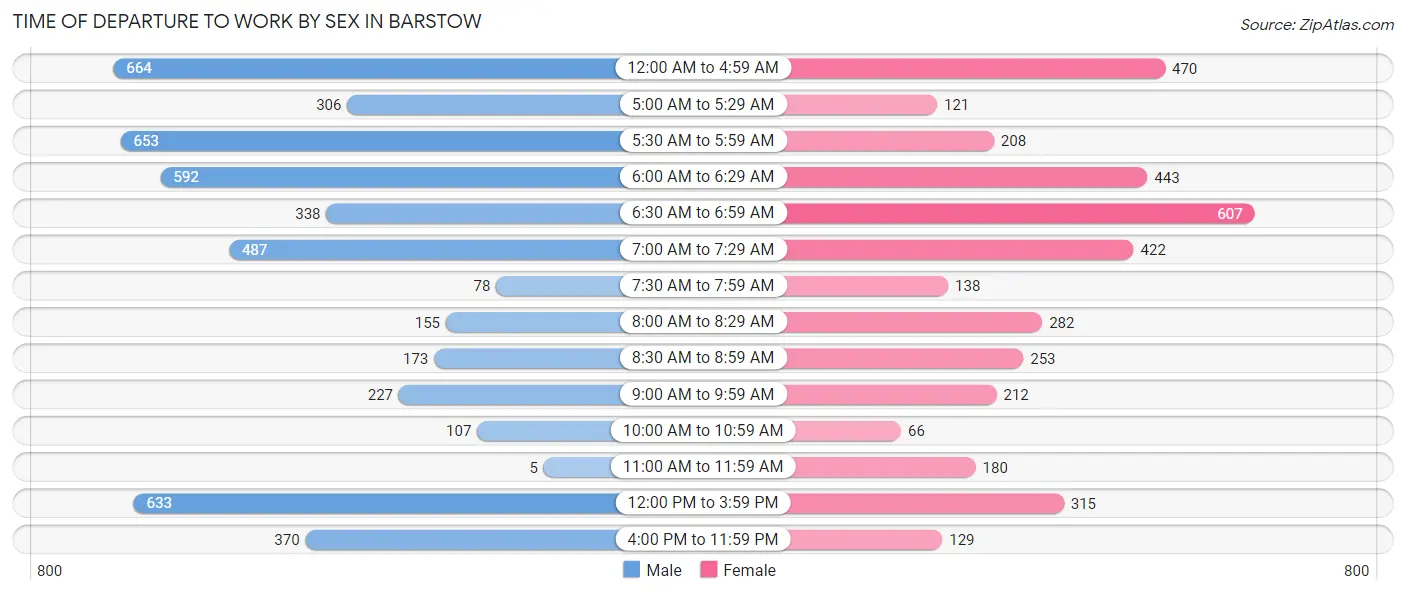
| Time of Departure | Male | Female |
| 12:00 AM to 4:59 AM | 664 (13.9%) | 470 (12.2%) |
| 5:00 AM to 5:29 AM | 306 (6.4%) | 121 (3.2%) |
| 5:30 AM to 5:59 AM | 653 (13.6%) | 208 (5.4%) |
| 6:00 AM to 6:29 AM | 592 (12.4%) | 443 (11.5%) |
| 6:30 AM to 6:59 AM | 338 (7.1%) | 607 (15.8%) |
| 7:00 AM to 7:29 AM | 487 (10.2%) | 422 (11.0%) |
| 7:30 AM to 7:59 AM | 78 (1.6%) | 138 (3.6%) |
| 8:00 AM to 8:29 AM | 155 (3.2%) | 282 (7.3%) |
| 8:30 AM to 8:59 AM | 173 (3.6%) | 253 (6.6%) |
| 9:00 AM to 9:59 AM | 227 (4.7%) | 212 (5.5%) |
| 10:00 AM to 10:59 AM | 107 (2.2%) | 66 (1.7%) |
| 11:00 AM to 11:59 AM | 5 (0.1%) | 180 (4.7%) |
| 12:00 PM to 3:59 PM | 633 (13.2%) | 315 (8.2%) |
| 4:00 PM to 11:59 PM | 370 (7.7%) | 129 (3.4%) |
| Total | 4,788 (100.0%) | 3,846 (100.0%) |
Housing Occupancy in Barstow
Occupancy by Ownership in Barstow
Of the total 8,952 dwellings in Barstow, owner-occupied units account for 3,862 (43.1%), while renter-occupied units make up 5,090 (56.9%).
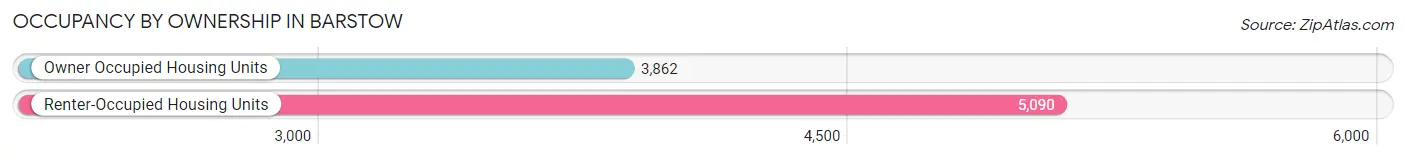
| Occupancy | # Housing Units | % Housing Units |
| Owner Occupied Housing Units | 3,862 | 43.1% |
| Renter-Occupied Housing Units | 5,090 | 56.9% |
| Total Occupied Housing Units | 8,952 | 100.0% |
Occupancy by Household Size in Barstow
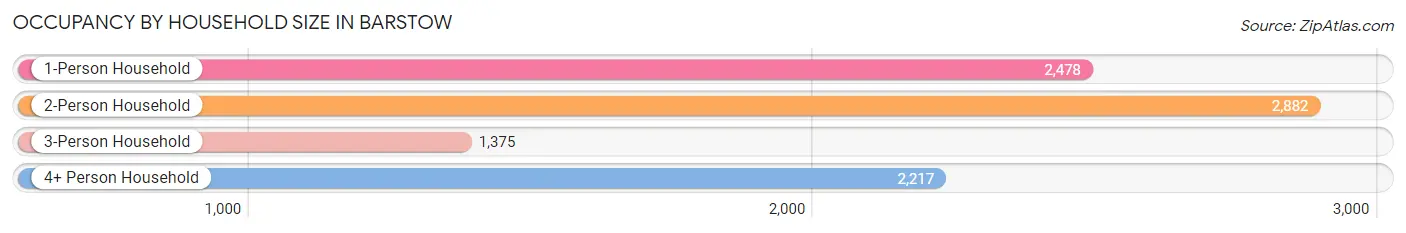
| Household Size | # Housing Units | % Housing Units |
| 1-Person Household | 2,478 | 27.7% |
| 2-Person Household | 2,882 | 32.2% |
| 3-Person Household | 1,375 | 15.4% |
| 4+ Person Household | 2,217 | 24.8% |
| Total Housing Units | 8,952 | 100.0% |
Occupancy by Ownership by Household Size in Barstow
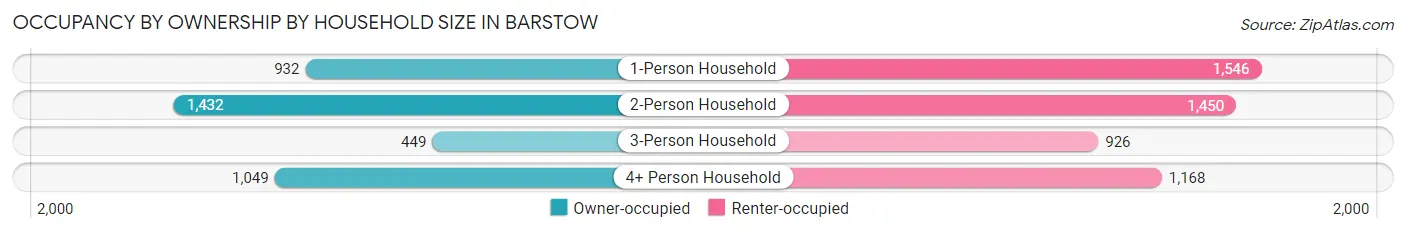
| Household Size | Owner-occupied | Renter-occupied |
| 1-Person Household | 932 (37.6%) | 1,546 (62.4%) |
| 2-Person Household | 1,432 (49.7%) | 1,450 (50.3%) |
| 3-Person Household | 449 (32.7%) | 926 (67.3%) |
| 4+ Person Household | 1,049 (47.3%) | 1,168 (52.7%) |
| Total Housing Units | 3,862 (43.1%) | 5,090 (56.9%) |
Occupancy by Educational Attainment in Barstow
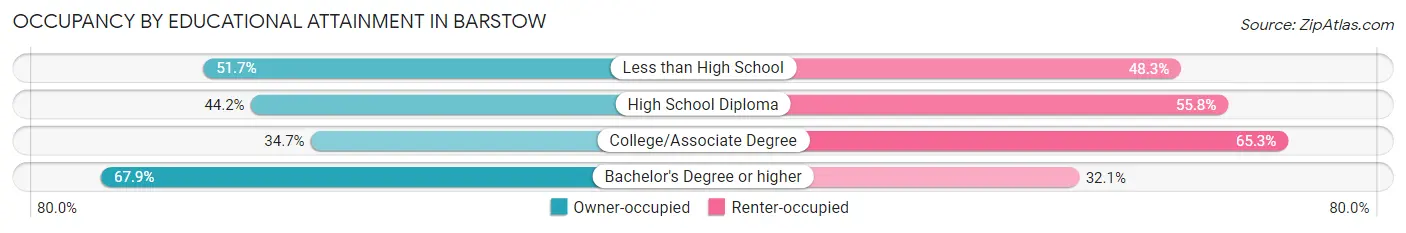
| Household Size | Owner-occupied | Renter-occupied |
| Less than High School | 700 (51.7%) | 655 (48.3%) |
| High School Diploma | 999 (44.2%) | 1,262 (55.8%) |
| College/Associate Degree | 1,523 (34.7%) | 2,870 (65.3%) |
| Bachelor's Degree or higher | 640 (67.9%) | 303 (32.1%) |
Occupancy by Age of Householder in Barstow
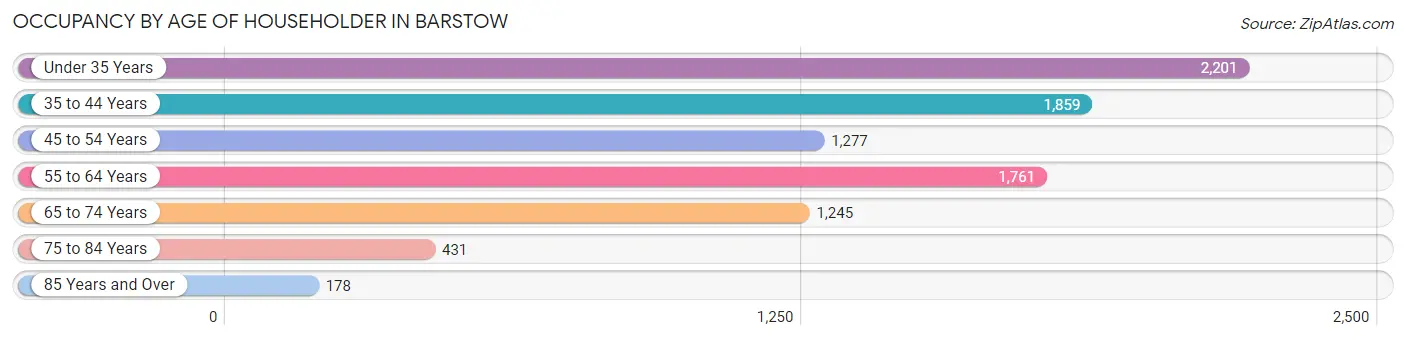
| Age Bracket | # Households | % Households |
| Under 35 Years | 2,201 | 24.6% |
| 35 to 44 Years | 1,859 | 20.8% |
| 45 to 54 Years | 1,277 | 14.3% |
| 55 to 64 Years | 1,761 | 19.7% |
| 65 to 74 Years | 1,245 | 13.9% |
| 75 to 84 Years | 431 | 4.8% |
| 85 Years and Over | 178 | 2.0% |
| Total | 8,952 | 100.0% |
Housing Finances in Barstow
Median Income by Occupancy in Barstow
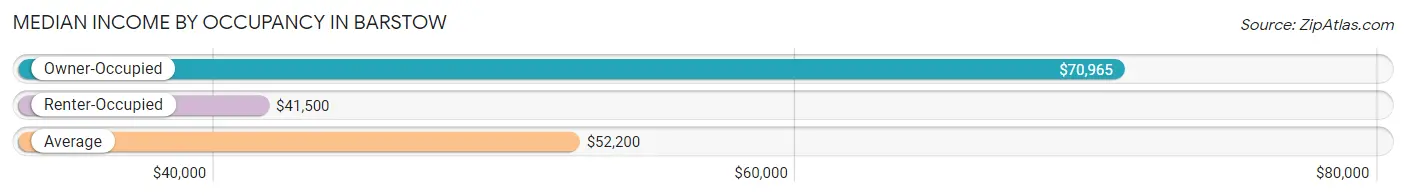
| Occupancy Type | # Households | Median Income |
| Owner-Occupied | 3,862 (43.1%) | $70,965 |
| Renter-Occupied | 5,090 (56.9%) | $41,500 |
| Average | 8,952 (100.0%) | $52,200 |
Occupancy by Householder Income Bracket in Barstow
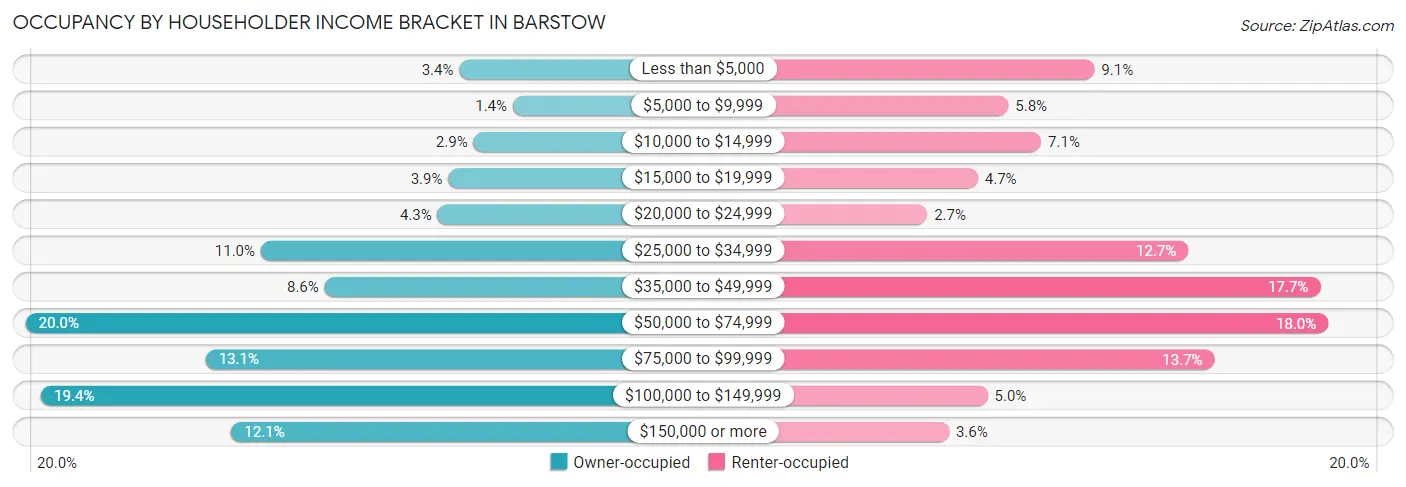
| Income Bracket | Owner-occupied | Renter-occupied |
| Less than $5,000 | 133 (3.4%) | 463 (9.1%) |
| $5,000 to $9,999 | 54 (1.4%) | 296 (5.8%) |
| $10,000 to $14,999 | 112 (2.9%) | 360 (7.1%) |
| $15,000 to $19,999 | 149 (3.9%) | 237 (4.7%) |
| $20,000 to $24,999 | 165 (4.3%) | 139 (2.7%) |
| $25,000 to $34,999 | 425 (11.0%) | 645 (12.7%) |
| $35,000 to $49,999 | 331 (8.6%) | 901 (17.7%) |
| $50,000 to $74,999 | 771 (20.0%) | 916 (18.0%) |
| $75,000 to $99,999 | 506 (13.1%) | 696 (13.7%) |
| $100,000 to $149,999 | 748 (19.4%) | 256 (5.0%) |
| $150,000 or more | 468 (12.1%) | 181 (3.6%) |
| Total | 3,862 (100.0%) | 5,090 (100.0%) |
Monthly Housing Cost Tiers in Barstow
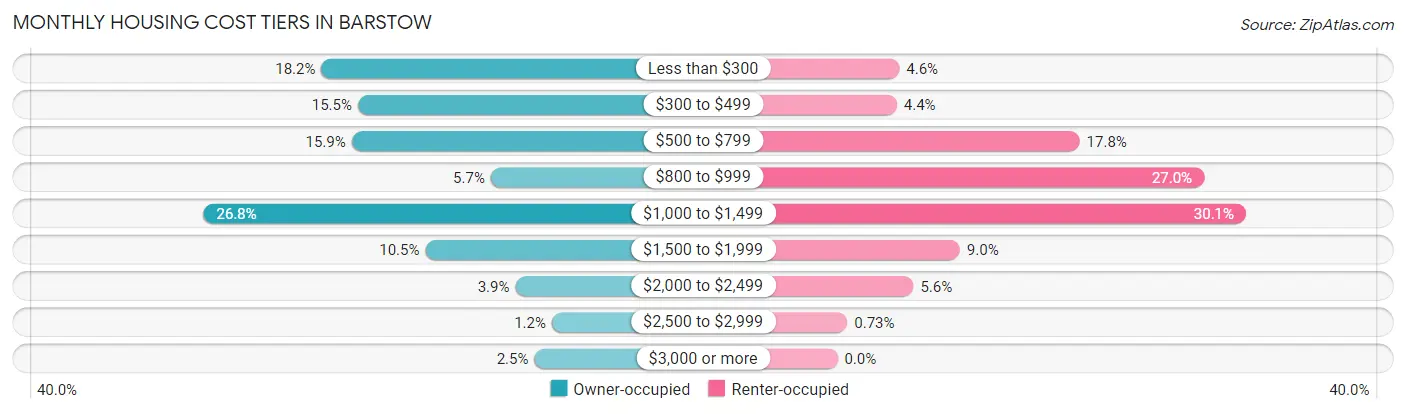
| Monthly Cost | Owner-occupied | Renter-occupied |
| Less than $300 | 701 (18.1%) | 232 (4.6%) |
| $300 to $499 | 597 (15.5%) | 223 (4.4%) |
| $500 to $799 | 615 (15.9%) | 908 (17.8%) |
| $800 to $999 | 219 (5.7%) | 1,374 (27.0%) |
| $1,000 to $1,499 | 1,036 (26.8%) | 1,531 (30.1%) |
| $1,500 to $1,999 | 405 (10.5%) | 459 (9.0%) |
| $2,000 to $2,499 | 149 (3.9%) | 285 (5.6%) |
| $2,500 to $2,999 | 45 (1.2%) | 37 (0.7%) |
| $3,000 or more | 95 (2.5%) | 0 (0.0%) |
| Total | 3,862 (100.0%) | 5,090 (100.0%) |
Physical Housing Characteristics in Barstow
Housing Structures in Barstow
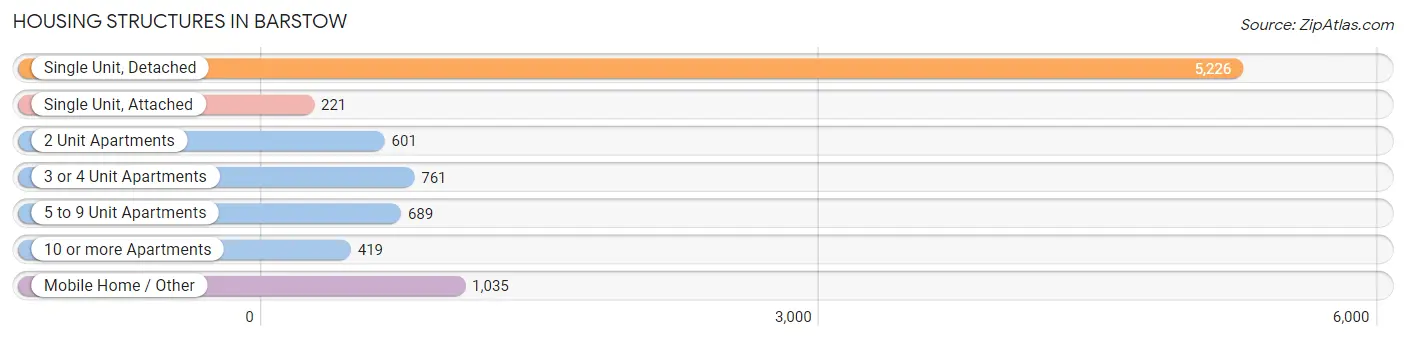
| Structure Type | # Housing Units | % Housing Units |
| Single Unit, Detached | 5,226 | 58.4% |
| Single Unit, Attached | 221 | 2.5% |
| 2 Unit Apartments | 601 | 6.7% |
| 3 or 4 Unit Apartments | 761 | 8.5% |
| 5 to 9 Unit Apartments | 689 | 7.7% |
| 10 or more Apartments | 419 | 4.7% |
| Mobile Home / Other | 1,035 | 11.6% |
| Total | 8,952 | 100.0% |
Housing Structures by Occupancy in Barstow
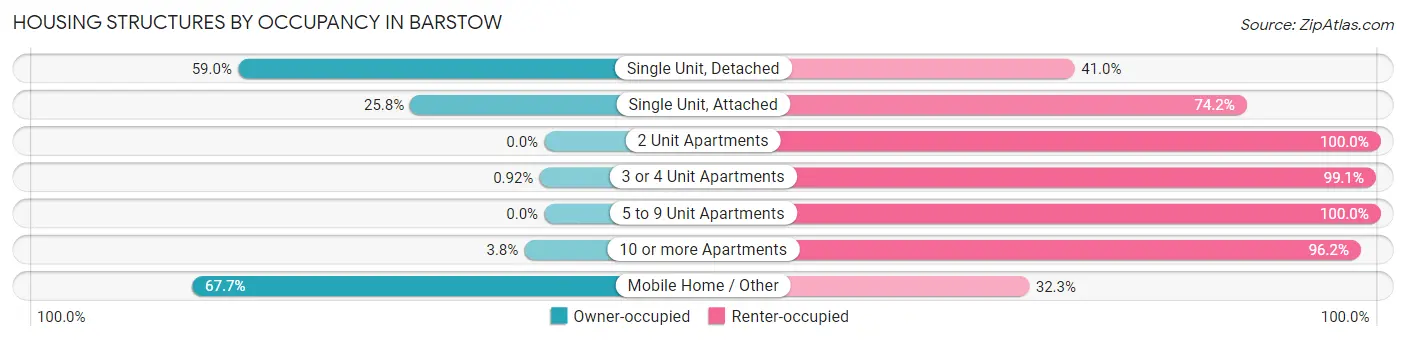
| Structure Type | Owner-occupied | Renter-occupied |
| Single Unit, Detached | 3,081 (59.0%) | 2,145 (41.0%) |
| Single Unit, Attached | 57 (25.8%) | 164 (74.2%) |
| 2 Unit Apartments | 0 (0.0%) | 601 (100.0%) |
| 3 or 4 Unit Apartments | 7 (0.9%) | 754 (99.1%) |
| 5 to 9 Unit Apartments | 0 (0.0%) | 689 (100.0%) |
| 10 or more Apartments | 16 (3.8%) | 403 (96.2%) |
| Mobile Home / Other | 701 (67.7%) | 334 (32.3%) |
| Total | 3,862 (43.1%) | 5,090 (56.9%) |
Housing Structures by Number of Rooms in Barstow
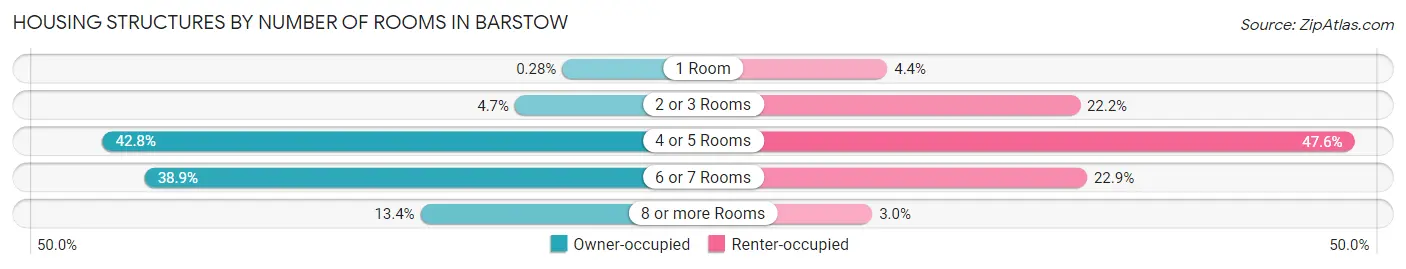
| Number of Rooms | Owner-occupied | Renter-occupied |
| 1 Room | 11 (0.3%) | 223 (4.4%) |
| 2 or 3 Rooms | 180 (4.7%) | 1,130 (22.2%) |
| 4 or 5 Rooms | 1,652 (42.8%) | 2,422 (47.6%) |
| 6 or 7 Rooms | 1,502 (38.9%) | 1,163 (22.9%) |
| 8 or more Rooms | 517 (13.4%) | 152 (3.0%) |
| Total | 3,862 (100.0%) | 5,090 (100.0%) |
Housing Structure by Heating Type in Barstow
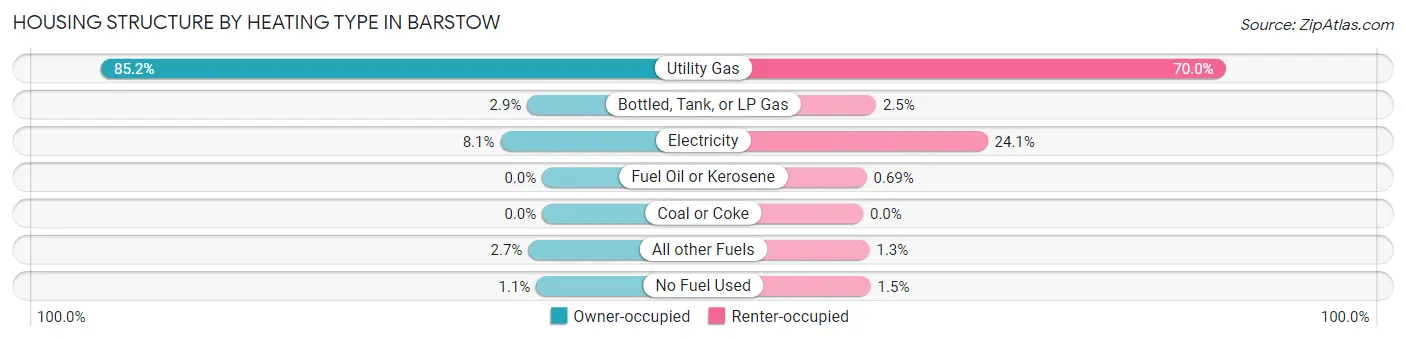
| Heating Type | Owner-occupied | Renter-occupied |
| Utility Gas | 3,291 (85.2%) | 3,564 (70.0%) |
| Bottled, Tank, or LP Gas | 111 (2.9%) | 127 (2.5%) |
| Electricity | 312 (8.1%) | 1,225 (24.1%) |
| Fuel Oil or Kerosene | 0 (0.0%) | 35 (0.7%) |
| Coal or Coke | 0 (0.0%) | 0 (0.0%) |
| All other Fuels | 104 (2.7%) | 64 (1.3%) |
| No Fuel Used | 44 (1.1%) | 75 (1.5%) |
| Total | 3,862 (100.0%) | 5,090 (100.0%) |
Household Vehicle Usage in Barstow
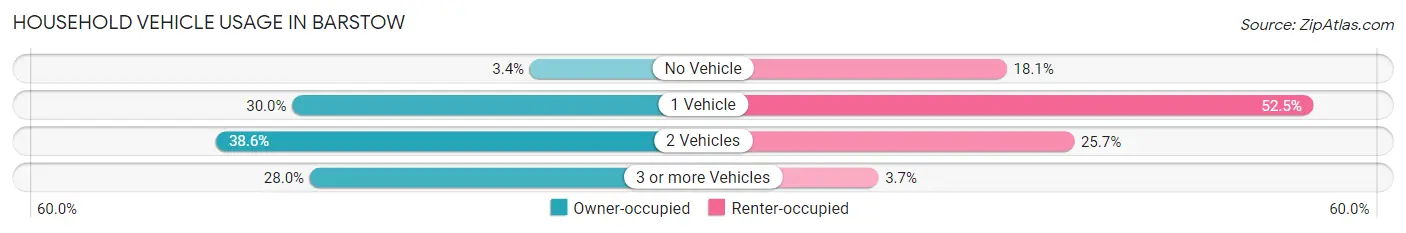
| Vehicles per Household | Owner-occupied | Renter-occupied |
| No Vehicle | 131 (3.4%) | 922 (18.1%) |
| 1 Vehicle | 1,159 (30.0%) | 2,672 (52.5%) |
| 2 Vehicles | 1,489 (38.6%) | 1,306 (25.7%) |
| 3 or more Vehicles | 1,083 (28.0%) | 190 (3.7%) |
| Total | 3,862 (100.0%) | 5,090 (100.0%) |
Real Estate & Mortgages in Barstow
Real Estate and Mortgage Overview in Barstow
| Characteristic | Without Mortgage | With Mortgage |
| Housing Units | 1,887 | 1,975 |
| Median Property Value | $128,800 | $211,400 |
| Median Household Income | $53,607 | $341 |
| Monthly Housing Costs | $376 | $95 |
| Real Estate Taxes | $799 | $8 |
Property Value by Mortgage Status in Barstow
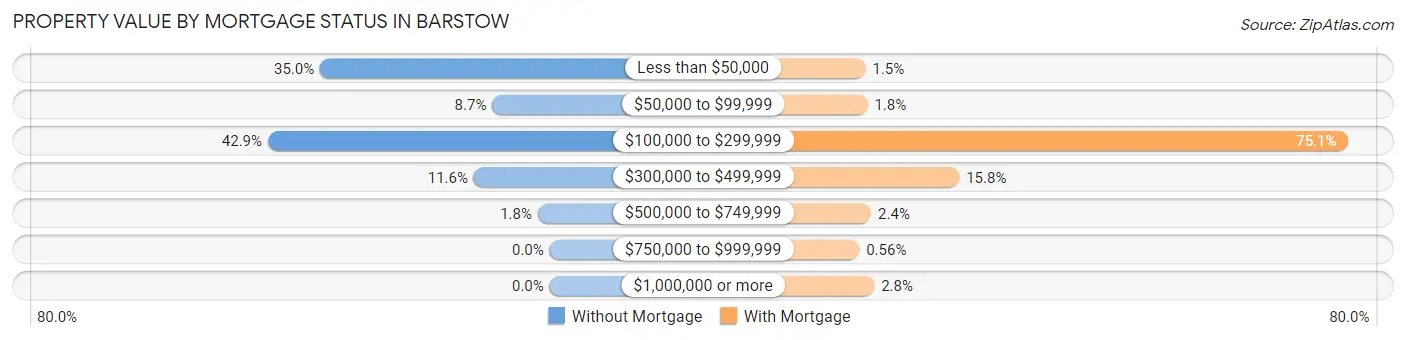
| Property Value | Without Mortgage | With Mortgage |
| Less than $50,000 | 660 (35.0%) | 30 (1.5%) |
| $50,000 to $99,999 | 165 (8.7%) | 36 (1.8%) |
| $100,000 to $299,999 | 810 (42.9%) | 1,483 (75.1%) |
| $300,000 to $499,999 | 218 (11.6%) | 312 (15.8%) |
| $500,000 to $749,999 | 34 (1.8%) | 47 (2.4%) |
| $750,000 to $999,999 | 0 (0.0%) | 11 (0.6%) |
| $1,000,000 or more | 0 (0.0%) | 56 (2.8%) |
| Total | 1,887 (100.0%) | 1,975 (100.0%) |
Household Income by Mortgage Status in Barstow
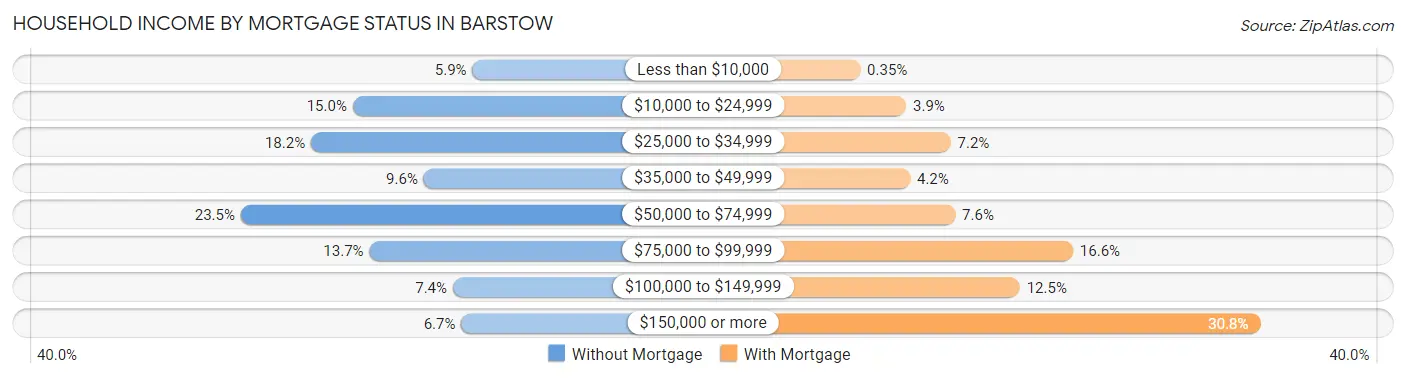
| Household Income | Without Mortgage | With Mortgage |
| Less than $10,000 | 111 (5.9%) | 7 (0.4%) |
| $10,000 to $24,999 | 283 (15.0%) | 76 (3.8%) |
| $25,000 to $34,999 | 343 (18.2%) | 143 (7.2%) |
| $35,000 to $49,999 | 181 (9.6%) | 82 (4.2%) |
| $50,000 to $74,999 | 444 (23.5%) | 150 (7.6%) |
| $75,000 to $99,999 | 259 (13.7%) | 327 (16.6%) |
| $100,000 to $149,999 | 139 (7.4%) | 247 (12.5%) |
| $150,000 or more | 127 (6.7%) | 609 (30.8%) |
| Total | 1,887 (100.0%) | 1,975 (100.0%) |
Property Value to Household Income Ratio in Barstow
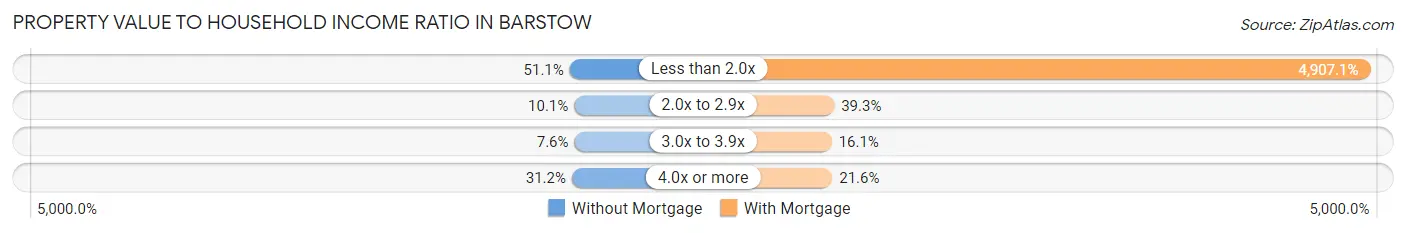
| Value-to-Income Ratio | Without Mortgage | With Mortgage |
| Less than 2.0x | 965 (51.1%) | 96,915 (4,907.1%) |
| 2.0x to 2.9x | 190 (10.1%) | 777 (39.3%) |
| 3.0x to 3.9x | 144 (7.6%) | 318 (16.1%) |
| 4.0x or more | 588 (31.2%) | 427 (21.6%) |
| Total | 1,887 (100.0%) | 1,975 (100.0%) |
Real Estate Taxes by Mortgage Status in Barstow
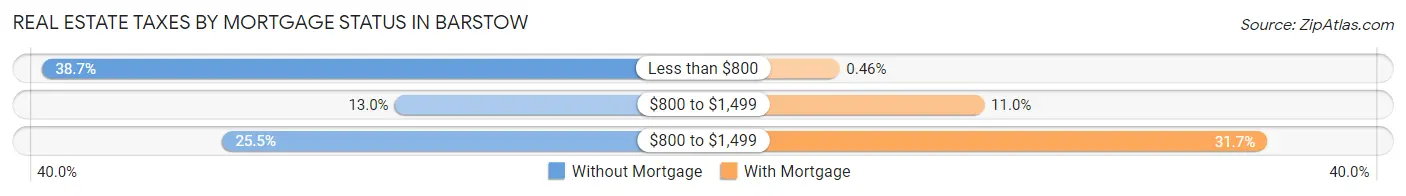
| Property Taxes | Without Mortgage | With Mortgage |
| Less than $800 | 730 (38.7%) | 9 (0.5%) |
| $800 to $1,499 | 245 (13.0%) | 218 (11.0%) |
| $800 to $1,499 | 482 (25.5%) | 626 (31.7%) |
| Total | 1,887 (100.0%) | 1,975 (100.0%) |
Health & Disability in Barstow
Health Insurance Coverage by Age in Barstow
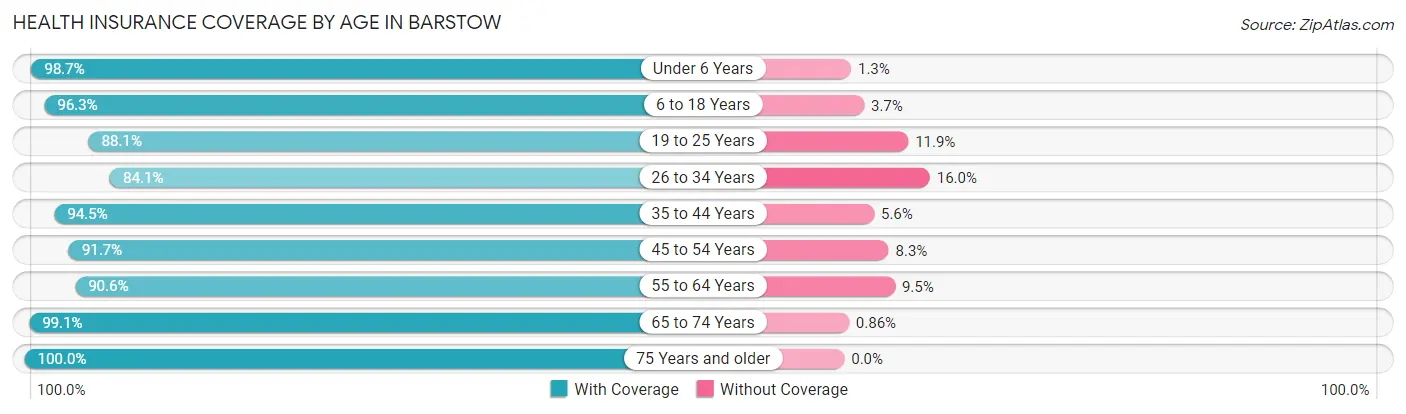
| Age Bracket | With Coverage | Without Coverage |
| Under 6 Years | 2,351 (98.7%) | 30 (1.3%) |
| 6 to 18 Years | 5,581 (96.3%) | 213 (3.7%) |
| 19 to 25 Years | 1,788 (88.1%) | 242 (11.9%) |
| 26 to 34 Years | 2,957 (84.1%) | 561 (16.0%) |
| 35 to 44 Years | 3,133 (94.5%) | 184 (5.6%) |
| 45 to 54 Years | 2,043 (91.7%) | 184 (8.3%) |
| 55 to 64 Years | 2,502 (90.5%) | 261 (9.5%) |
| 65 to 74 Years | 1,844 (99.1%) | 16 (0.9%) |
| 75 Years and older | 1,018 (100.0%) | 0 (0.0%) |
| Total | 23,217 (93.2%) | 1,691 (6.8%) |
Health Insurance Coverage by Citizenship Status in Barstow
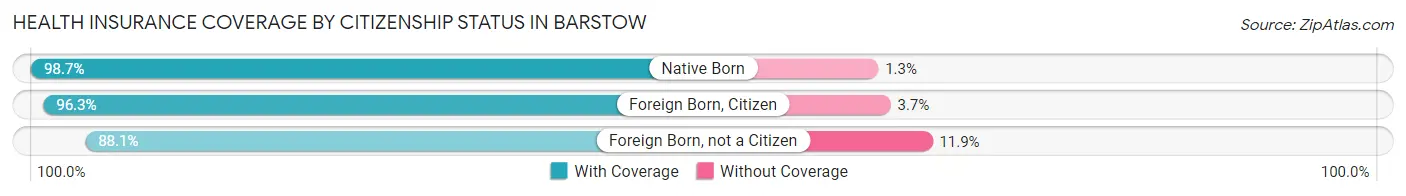
| Citizenship Status | With Coverage | Without Coverage |
| Native Born | 2,351 (98.7%) | 30 (1.3%) |
| Foreign Born, Citizen | 5,581 (96.3%) | 213 (3.7%) |
| Foreign Born, not a Citizen | 1,788 (88.1%) | 242 (11.9%) |
Health Insurance Coverage by Household Income in Barstow
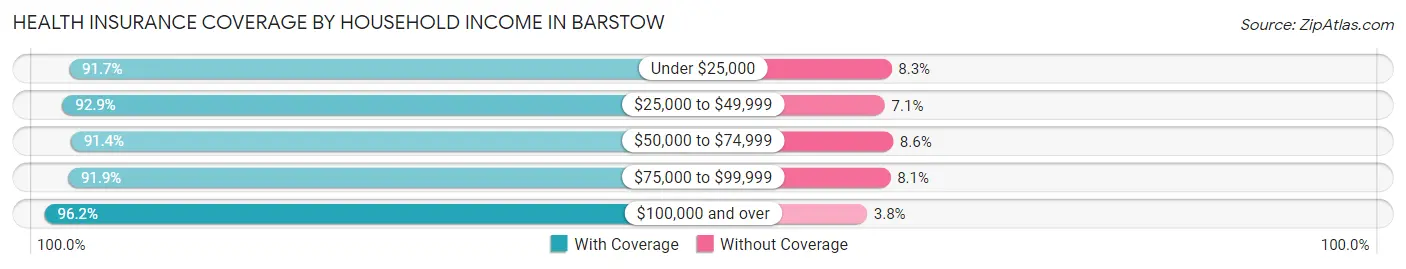
| Household Income | With Coverage | Without Coverage |
| Under $25,000 | 3,878 (91.7%) | 353 (8.3%) |
| $25,000 to $49,999 | 5,453 (92.9%) | 416 (7.1%) |
| $50,000 to $74,999 | 4,134 (91.4%) | 391 (8.6%) |
| $75,000 to $99,999 | 3,196 (91.9%) | 283 (8.1%) |
| $100,000 and over | 6,350 (96.2%) | 248 (3.8%) |
Public vs Private Health Insurance Coverage by Age in Barstow
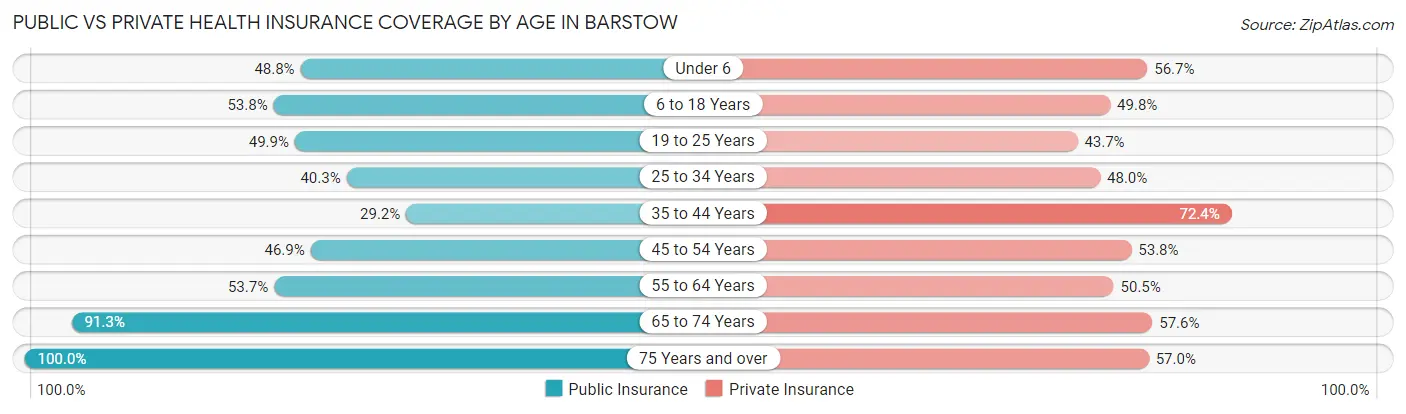
| Age Bracket | Public Insurance | Private Insurance |
| Under 6 | 1,162 (48.8%) | 1,350 (56.7%) |
| 6 to 18 Years | 3,117 (53.8%) | 2,886 (49.8%) |
| 19 to 25 Years | 1,012 (49.8%) | 888 (43.7%) |
| 25 to 34 Years | 1,416 (40.3%) | 1,687 (47.9%) |
| 35 to 44 Years | 968 (29.2%) | 2,400 (72.4%) |
| 45 to 54 Years | 1,045 (46.9%) | 1,197 (53.7%) |
| 55 to 64 Years | 1,484 (53.7%) | 1,394 (50.4%) |
| 65 to 74 Years | 1,698 (91.3%) | 1,072 (57.6%) |
| 75 Years and over | 1,018 (100.0%) | 580 (57.0%) |
| Total | 12,920 (51.9%) | 13,454 (54.0%) |
Disability Status by Sex by Age in Barstow
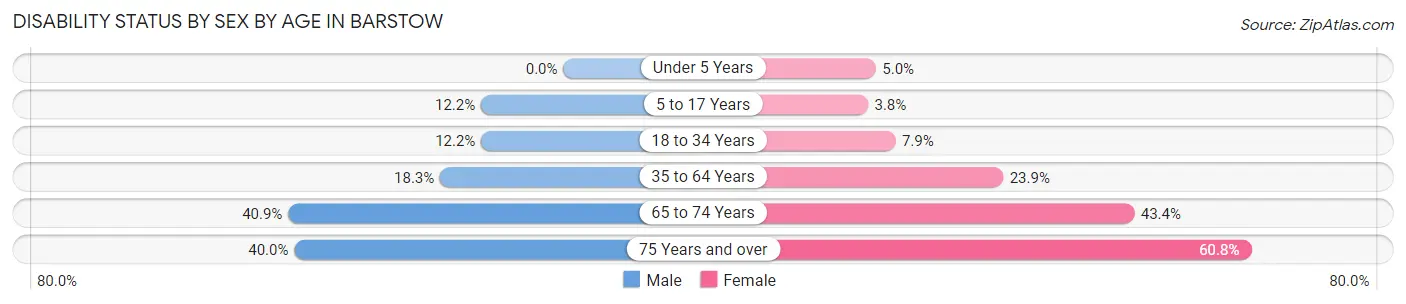
| Age Bracket | Male | Female |
| Under 5 Years | 0 (0.0%) | 60 (5.0%) |
| 5 to 17 Years | 360 (12.2%) | 107 (3.8%) |
| 18 to 34 Years | 365 (12.2%) | 230 (7.9%) |
| 35 to 64 Years | 665 (18.3%) | 1,117 (23.9%) |
| 65 to 74 Years | 369 (40.9%) | 415 (43.4%) |
| 75 Years and over | 153 (40.0%) | 386 (60.8%) |
Disability Class by Sex by Age in Barstow
Disability Class: Hearing Difficulty
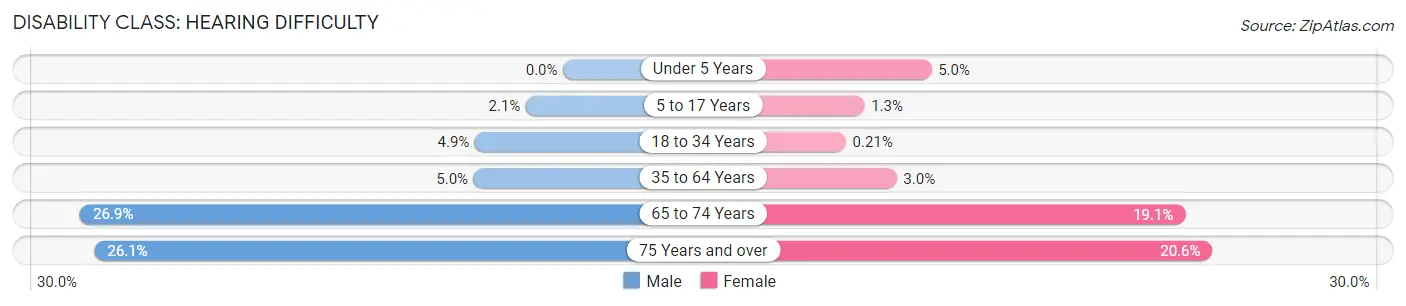
| Age Bracket | Male | Female |
| Under 5 Years | 0 (0.0%) | 60 (5.0%) |
| 5 to 17 Years | 61 (2.1%) | 35 (1.3%) |
| 18 to 34 Years | 147 (4.9%) | 6 (0.2%) |
| 35 to 64 Years | 181 (5.0%) | 142 (3.0%) |
| 65 to 74 Years | 243 (26.9%) | 183 (19.1%) |
| 75 Years and over | 100 (26.1%) | 131 (20.6%) |
Disability Class: Vision Difficulty
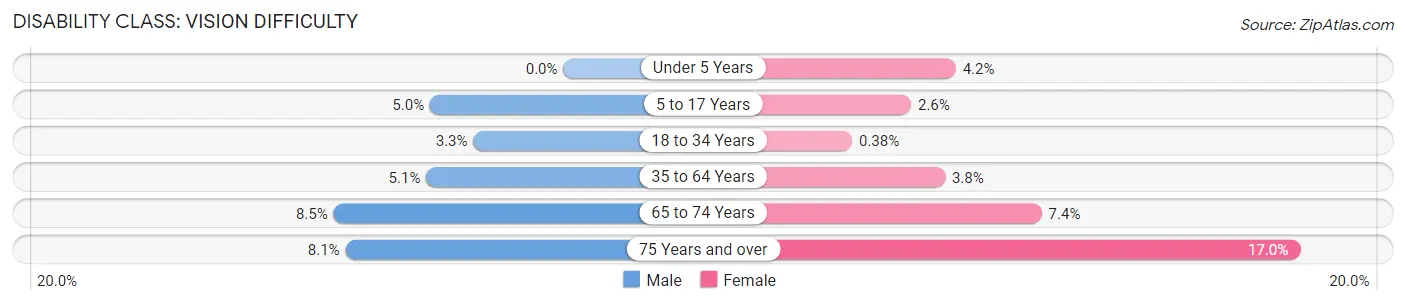
| Age Bracket | Male | Female |
| Under 5 Years | 0 (0.0%) | 51 (4.2%) |
| 5 to 17 Years | 146 (5.0%) | 72 (2.6%) |
| 18 to 34 Years | 100 (3.3%) | 11 (0.4%) |
| 35 to 64 Years | 185 (5.1%) | 179 (3.8%) |
| 65 to 74 Years | 77 (8.5%) | 71 (7.4%) |
| 75 Years and over | 31 (8.1%) | 108 (17.0%) |
Disability Class: Cognitive Difficulty
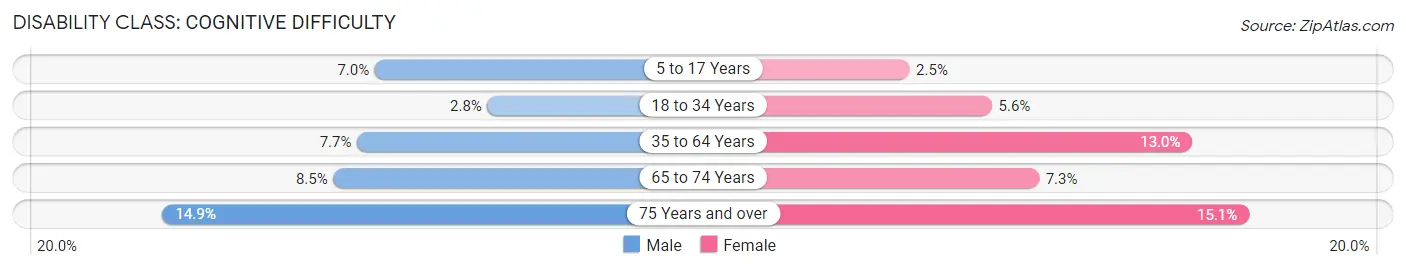
| Age Bracket | Male | Female |
| 5 to 17 Years | 206 (7.0%) | 70 (2.5%) |
| 18 to 34 Years | 84 (2.8%) | 162 (5.6%) |
| 35 to 64 Years | 278 (7.6%) | 608 (13.0%) |
| 65 to 74 Years | 77 (8.5%) | 70 (7.3%) |
| 75 Years and over | 57 (14.9%) | 96 (15.1%) |
Disability Class: Ambulatory Difficulty
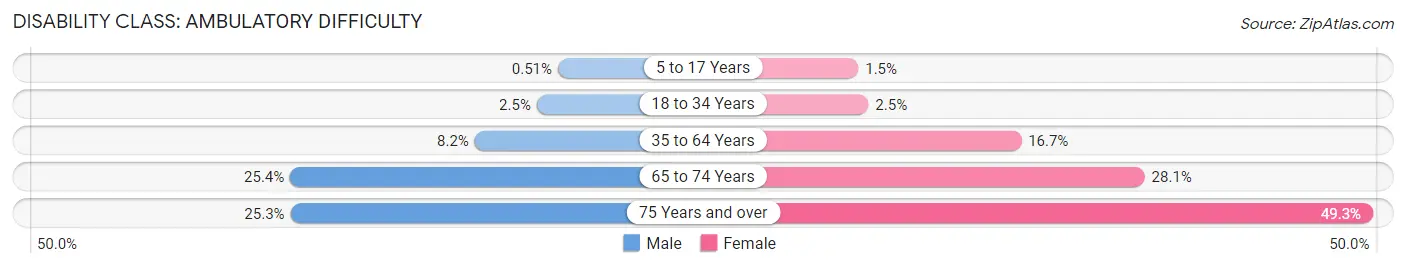
| Age Bracket | Male | Female |
| 5 to 17 Years | 15 (0.5%) | 43 (1.5%) |
| 18 to 34 Years | 74 (2.5%) | 72 (2.5%) |
| 35 to 64 Years | 299 (8.2%) | 778 (16.7%) |
| 65 to 74 Years | 229 (25.4%) | 269 (28.1%) |
| 75 Years and over | 97 (25.3%) | 313 (49.3%) |
Disability Class: Self-Care Difficulty
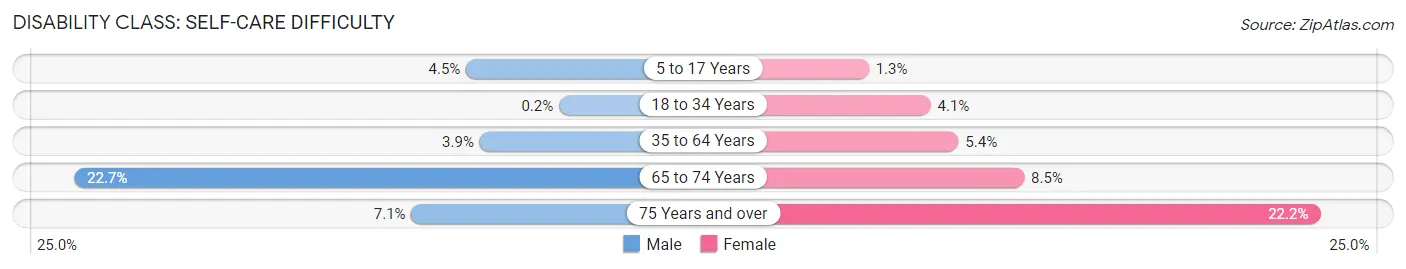
| Age Bracket | Male | Female |
| 5 to 17 Years | 133 (4.5%) | 35 (1.3%) |
| 18 to 34 Years | 6 (0.2%) | 120 (4.1%) |
| 35 to 64 Years | 141 (3.9%) | 253 (5.4%) |
| 65 to 74 Years | 205 (22.7%) | 81 (8.5%) |
| 75 Years and over | 27 (7.0%) | 141 (22.2%) |
Technology Access in Barstow
Computing Device Access in Barstow
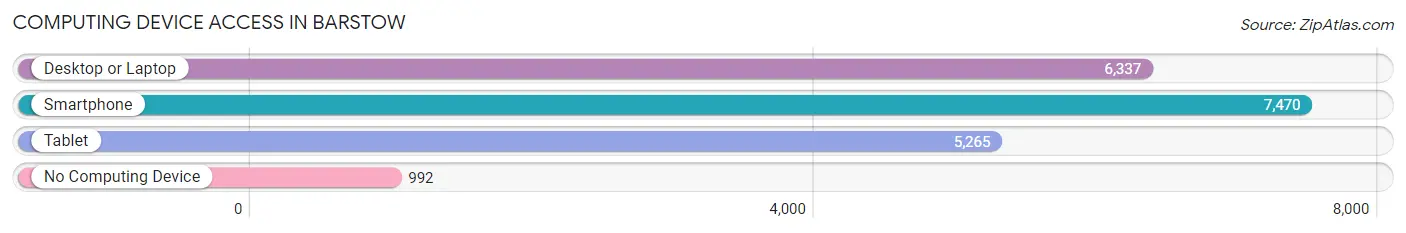
| Device Type | # Households | % Households |
| Desktop or Laptop | 6,337 | 70.8% |
| Smartphone | 7,470 | 83.5% |
| Tablet | 5,265 | 58.8% |
| No Computing Device | 992 | 11.1% |
| Total | 8,952 | 100.0% |
Internet Access in Barstow
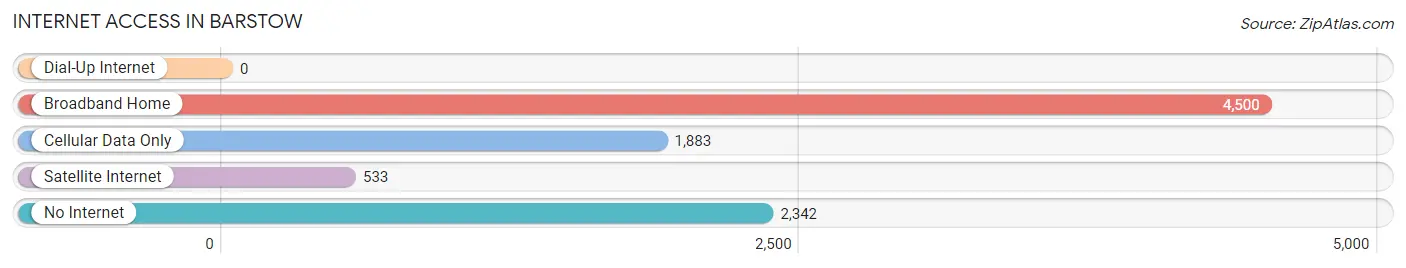
| Internet Type | # Households | % Households |
| Dial-Up Internet | 0 | 0.0% |
| Broadband Home | 4,500 | 50.3% |
| Cellular Data Only | 1,883 | 21.0% |
| Satellite Internet | 533 | 5.9% |
| No Internet | 2,342 | 26.2% |
| Total | 8,952 | 100.0% |
Barstow Summary
Barstow, California is a city located in San Bernardino County, in the Mojave Desert region of the state. It is situated along the historic Route 66, and is the largest city in the county. The city has a population of 23,219, according to the 2010 census, and is the principal city of the Barstow Metropolitan Statistical Area.
History
Barstow was founded in 1858 by William Phipps Blake, a former railroad worker. The city was named after William Barstow Strong, a former president of the Atchison, Topeka and Santa Fe Railway. The city was incorporated in 1911.
In the early 20th century, Barstow was a major stop on the historic Route 66, and was a popular destination for travelers. The city was also a major hub for the mining industry, with several mines in the area.
Geography
Barstow is located in the Mojave Desert region of California, in San Bernardino County. It is situated along the historic Route 66, and is the largest city in the county. The city has a total area of 28.2 square miles, of which 28.1 square miles is land and 0.1 square miles is water.
The city is located at an elevation of 2,000 feet, and is surrounded by several mountain ranges, including the San Bernardino Mountains to the south, the San Gabriel Mountains to the west, and the San Jacinto Mountains to the east.
Economy
Barstow's economy is largely based on the military, tourism, and transportation. The city is home to the Marine Corps Logistics Base Barstow, which is the largest employer in the city. The base is responsible for the maintenance and repair of military vehicles and equipment.
The city is also a major tourist destination, due to its proximity to the Mojave National Preserve and the historic Route 66. The city is home to several attractions, including the Calico Ghost Town, the Mojave River Valley Museum, and the Barstow Station Shopping Center.
The city is also a major transportation hub, with several major highways and railroads passing through the city. The city is served by the Union Pacific Railroad, the Burlington Northern Santa Fe Railway, and the Barstow-Daggett Airport.
Demographics
As of the 2010 census, Barstow had a population of 23,219. The racial makeup of the city was 57.2% White, 8.3% African American, 1.2% Native American, 2.3% Asian, 0.2% Pacific Islander, 25.2% from other races, and 5.7% from two or more races. Hispanic or Latino of any race were 44.2% of the population.
The median income for a household in the city was $35,945, and the median income for a family was $41,945. The per capita income for the city was $17,845. About 17.2% of families and 21.3% of the population were below the poverty line, including 28.2% of those under age 18 and 11.2% of those age 65 or over.
Common Questions
What is Per Capita Income in Barstow?
Per Capita income in Barstow is $24,761.
What is the Median Family Income in Barstow?
Median Family Income in Barstow is $64,563.
What is the Median Household income in Barstow?
Median Household Income in Barstow is $52,200.
What is Income or Wage Gap in Barstow?
Income or Wage Gap in Barstow is 11.4%.
Women in Barstow earn 88.6 cents for every dollar earned by a man.
What is Family Income Deficit in Barstow?
Family Income Deficit in Barstow is $14,532.
Families that are below poverty line in Barstow earn $14,532 less on average than the poverty threshold level.
What is Inequality or Gini Index in Barstow?
Inequality or Gini Index in Barstow is 0.46.
What is the Total Population of Barstow?
Total Population of Barstow is 25,235.
What is the Total Male Population of Barstow?
Total Male Population of Barstow is 12,002.
What is the Total Female Population of Barstow?
Total Female Population of Barstow is 13,233.
What is the Ratio of Males per 100 Females in Barstow?
There are 90.70 Males per 100 Females in Barstow.
What is the Ratio of Females per 100 Males in Barstow?
There are 110.26 Females per 100 Males in Barstow.
What is the Median Population Age in Barstow?
Median Population Age in Barstow is 31.7 Years.
What is the Average Family Size in Barstow
Average Family Size in Barstow is 3.4 People.
What is the Average Household Size in Barstow
Average Household Size in Barstow is 2.8 People.
How Large is the Labor Force in Barstow?
There are 10,119 People in the Labor Forcein in Barstow.
What is the Percentage of People in the Labor Force in Barstow?
55.3% of People are in the Labor Force in Barstow.
What is the Unemployment Rate in Barstow?
Unemployment Rate in Barstow is 9.1%.