Cities with the Highest Percentage of Black / African American Population in Pennsylvania
RELATED REPORTS & OPTIONS
Black / African American
Pennsylvania
Compare Cities
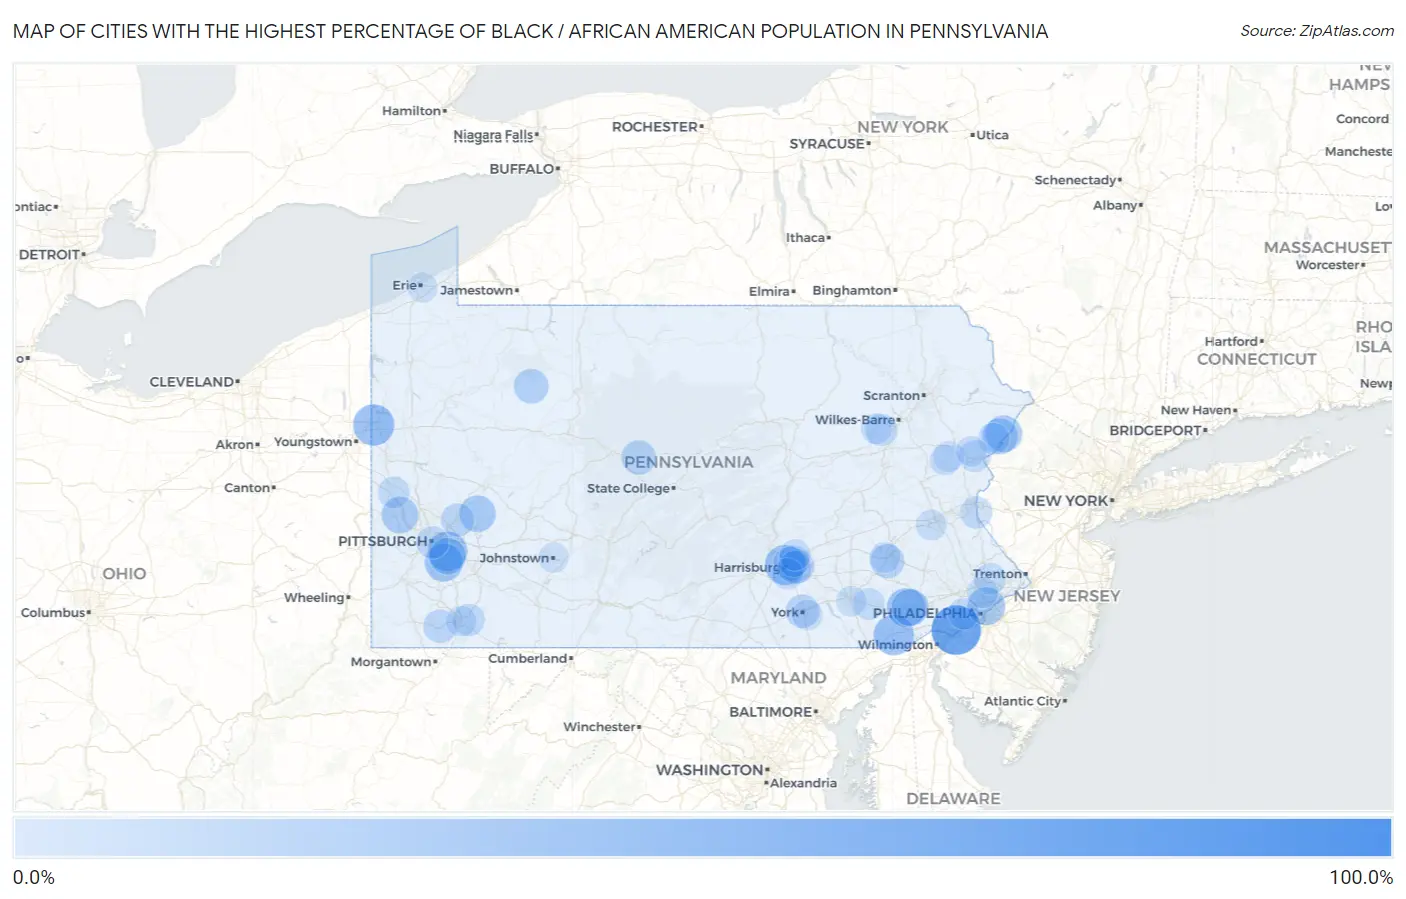
Map of Cities with the Highest Percentage of Black / African American Population in Pennsylvania
0.0%
100.0%
Cities with the Highest Percentage of Black / African American Population in Pennsylvania
| City | Black / African American | vs State | vs National | |
| 1. | Colwyn Borough | 93.0% | 10.8%(+82.1)#1 | 12.5%(+80.5)#139 |
| 2. | Darby Borough | 86.6% | 10.8%(+75.8)#2 | 12.5%(+74.2)#248 |
| 3. | Yeadon Borough | 86.5% | 10.8%(+75.6)#3 | 12.5%(+74.0)#253 |
| 4. | Braddock Borough | 79.5% | 10.8%(+68.7)#4 | 12.5%(+67.1)#400 |
| 5. | Chester | 75.9% | 10.8%(+65.1)#5 | 12.5%(+63.5)#474 |
| 6. | Sharon Hill Borough | 72.7% | 10.8%(+61.9)#6 | 12.5%(+60.2)#556 |
| 7. | East Pittsburgh Borough | 68.0% | 10.8%(+57.1)#7 | 12.5%(+55.5)#672 |
| 8. | Rankin Borough | 65.0% | 10.8%(+54.2)#8 | 12.5%(+52.5)#744 |
| 9. | East Lansdowne Borough | 64.0% | 10.8%(+53.2)#9 | 12.5%(+51.5)#770 |
| 10. | Homestead Borough | 61.5% | 10.8%(+50.6)#10 | 12.5%(+49.0)#850 |
| 11. | Collingdale Borough | 59.1% | 10.8%(+48.3)#11 | 12.5%(+46.6)#922 |
| 12. | Farrell | 49.7% | 10.8%(+38.9)#12 | 12.5%(+37.2)#1,266 |
| 13. | Lansdowne Borough | 49.6% | 10.8%(+38.8)#13 | 12.5%(+37.2)#1,269 |
| 14. | Wilkinsburg Borough | 49.5% | 10.8%(+38.6)#14 | 12.5%(+37.0)#1,273 |
| 15. | Lincoln University | 47.3% | 10.8%(+36.5)#15 | 12.5%(+34.9)#1,362 |
| 16. | Harrisburg | 46.4% | 10.8%(+35.6)#16 | 12.5%(+34.0)#1,406 |
| 17. | North Braddock Borough | 45.8% | 10.8%(+35.0)#17 | 12.5%(+33.3)#1,436 |
| 18. | Duquesne | 44.7% | 10.8%(+33.8)#18 | 12.5%(+32.2)#1,484 |
| 19. | Folcroft Borough | 43.8% | 10.8%(+33.0)#19 | 12.5%(+31.3)#1,536 |
| 20. | Coatesville | 42.8% | 10.8%(+31.9)#20 | 12.5%(+30.3)#1,588 |
| 21. | South Coatesville Borough | 41.2% | 10.8%(+30.3)#21 | 12.5%(+28.7)#1,670 |
| 22. | Clairton | 40.2% | 10.8%(+29.3)#22 | 12.5%(+27.7)#1,729 |
| 23. | Philadelphia | 40.1% | 10.8%(+29.3)#23 | 12.5%(+27.6)#1,733 |
| 24. | Penbrook Borough | 39.8% | 10.8%(+28.9)#24 | 12.5%(+27.3)#1,757 |
| 25. | Clifton Heights Borough | 39.0% | 10.8%(+28.1)#25 | 12.5%(+26.5)#1,797 |
| 26. | Aldan Borough | 38.8% | 10.8%(+27.9)#26 | 12.5%(+26.3)#1,813 |
| 27. | Steelton Borough | 38.0% | 10.8%(+27.2)#27 | 12.5%(+25.6)#1,854 |
| 28. | Upland Borough | 37.1% | 10.8%(+26.3)#28 | 12.5%(+24.6)#1,901 |
| 29. | Mount Oliver Borough | 37.0% | 10.8%(+26.2)#29 | 12.5%(+24.6)#1,903 |
| 30. | Braddock Hills Borough | 36.8% | 10.8%(+26.0)#30 | 12.5%(+24.3)#1,921 |
| 31. | Caln | 36.3% | 10.8%(+25.5)#31 | 12.5%(+23.8)#1,957 |
| 32. | Aliquippa | 36.1% | 10.8%(+25.2)#32 | 12.5%(+23.6)#1,970 |
| 33. | Pocono Mountain Lake Estates | 36.0% | 10.8%(+25.1)#33 | 12.5%(+23.5)#1,974 |
| 34. | Mckeesport | 35.9% | 10.8%(+25.1)#34 | 12.5%(+23.5)#1,976 |
| 35. | Kiskimere | 35.5% | 10.8%(+24.7)#35 | 12.5%(+23.0)#2,002 |
| 36. | Pine Ridge | 33.5% | 10.8%(+22.7)#36 | 12.5%(+21.0)#2,114 |
| 37. | Norristown Borough | 32.8% | 10.8%(+21.9)#37 | 12.5%(+20.3)#2,166 |
| 38. | Swissvale Borough | 31.5% | 10.8%(+20.7)#38 | 12.5%(+19.1)#2,241 |
| 39. | Trainer Borough | 30.3% | 10.8%(+19.5)#39 | 12.5%(+17.8)#2,338 |
| 40. | Marienville | 30.2% | 10.8%(+19.3)#40 | 12.5%(+17.7)#2,349 |
| 41. | Wilmerding Borough | 29.9% | 10.8%(+19.0)#41 | 12.5%(+17.4)#2,367 |
| 42. | Kylertown | 29.1% | 10.8%(+18.3)#42 | 12.5%(+16.7)#2,420 |
| 43. | Millbourne Borough | 28.7% | 10.8%(+17.9)#43 | 12.5%(+16.2)#2,456 |
| 44. | Hayti | 28.4% | 10.8%(+17.6)#44 | 12.5%(+16.0)#2,470 |
| 45. | Montrose Manor | 28.3% | 10.8%(+17.4)#45 | 12.5%(+15.8)#2,489 |
| 46. | Mckees Rocks Borough | 28.0% | 10.8%(+17.2)#46 | 12.5%(+15.6)#2,506 |
| 47. | Elkins Park | 27.5% | 10.8%(+16.7)#47 | 12.5%(+15.1)#2,532 |
| 48. | Rutherford | 27.1% | 10.8%(+16.3)#48 | 12.5%(+14.6)#2,567 |
| 49. | Progress | 26.8% | 10.8%(+16.0)#49 | 12.5%(+14.3)#2,587 |
| 50. | Wall Borough | 26.6% | 10.8%(+15.8)#50 | 12.5%(+14.1)#2,599 |
| 51. | York | 26.5% | 10.8%(+15.7)#51 | 12.5%(+14.0)#2,609 |
| 52. | Turtle Creek Borough | 26.0% | 10.8%(+15.1)#52 | 12.5%(+13.5)#2,663 |
| 53. | Cheltenham | 25.9% | 10.8%(+15.1)#53 | 12.5%(+13.4)#2,669 |
| 54. | Ronco | 25.6% | 10.8%(+14.8)#54 | 12.5%(+13.2)#2,697 |
| 55. | Arnold | 25.6% | 10.8%(+14.8)#55 | 12.5%(+13.2)#2,698 |
| 56. | Lawnton | 25.3% | 10.8%(+14.5)#56 | 12.5%(+12.8)#2,737 |
| 57. | Pitcairn Borough | 24.8% | 10.8%(+14.0)#57 | 12.5%(+12.3)#2,786 |
| 58. | Donora Borough | 23.6% | 10.8%(+12.8)#58 | 12.5%(+11.2)#2,889 |
| 59. | Pittsburgh | 23.2% | 10.8%(+12.4)#59 | 12.5%(+10.8)#2,936 |
| 60. | Morton Borough | 23.2% | 10.8%(+12.3)#60 | 12.5%(+10.7)#2,947 |
| 61. | Lemont Furnace | 22.9% | 10.8%(+12.1)#61 | 12.5%(+10.5)#2,973 |
| 62. | Whitaker Borough | 22.6% | 10.8%(+11.8)#62 | 12.5%(+10.2)#3,007 |
| 63. | Raubsville | 22.5% | 10.8%(+11.7)#63 | 12.5%(+10.1)#3,016 |
| 64. | Roslyn | 22.4% | 10.8%(+11.6)#64 | 12.5%(+9.95)#3,031 |
| 65. | Paxtang Borough | 22.4% | 10.8%(+11.5)#65 | 12.5%(+9.90)#3,039 |
| 66. | East Stroudsburg Borough | 22.3% | 10.8%(+11.5)#66 | 12.5%(+9.84)#3,045 |
| 67. | Wanamie | 22.2% | 10.8%(+11.4)#67 | 12.5%(+9.73)#3,055 |
| 68. | Arlington Heights | 21.7% | 10.8%(+10.9)#68 | 12.5%(+9.22)#3,101 |
| 69. | Beaver Falls | 21.7% | 10.8%(+10.8)#69 | 12.5%(+9.20)#3,104 |
| 70. | Pottstown Borough | 21.4% | 10.8%(+10.6)#70 | 12.5%(+8.97)#3,135 |
| 71. | New Morgan Borough | 21.4% | 10.8%(+10.6)#71 | 12.5%(+8.96)#3,136 |
| 72. | Soudersburg | 21.2% | 10.8%(+10.4)#72 | 12.5%(+8.72)#3,165 |
| 73. | Penndel Borough | 20.9% | 10.8%(+10.1)#73 | 12.5%(+8.47)#3,192 |
| 74. | Saw Creek | 20.9% | 10.8%(+10.0)#74 | 12.5%(+8.38)#3,203 |
| 75. | Warminster Heights | 20.4% | 10.8%(+9.58)#75 | 12.5%(+7.95)#3,254 |
| 76. | Hallam Borough | 20.3% | 10.8%(+9.42)#76 | 12.5%(+7.79)#3,273 |
| 77. | Colonial Park | 20.3% | 10.8%(+9.42)#77 | 12.5%(+7.78)#3,274 |
| 78. | Drexel Hill | 20.1% | 10.8%(+9.23)#78 | 12.5%(+7.60)#3,303 |
| 79. | New Market | 19.6% | 10.8%(+8.77)#79 | 12.5%(+7.14)#3,349 |
| 80. | Linglestown | 19.5% | 10.8%(+8.67)#80 | 12.5%(+7.04)#3,361 |
| 81. | Coal Center Borough | 19.4% | 10.8%(+8.54)#81 | 12.5%(+6.90)#3,379 |
| 82. | Wyncote | 19.2% | 10.8%(+8.34)#82 | 12.5%(+6.71)#3,405 |
| 83. | Coraopolis Borough | 19.0% | 10.8%(+8.15)#83 | 12.5%(+6.51)#3,427 |
| 84. | Eagleville Cdp Montgomery County | 18.7% | 10.8%(+7.88)#84 | 12.5%(+6.24)#3,466 |
| 85. | Springmont | 18.7% | 10.8%(+7.84)#85 | 12.5%(+6.21)#3,471 |
| 86. | Fairview Borough | 18.6% | 10.8%(+7.72)#86 | 12.5%(+6.09)#3,493 |
| 87. | Trexlertown | 18.4% | 10.8%(+7.52)#87 | 12.5%(+5.89)#3,523 |
| 88. | Chalfant Borough | 18.3% | 10.8%(+7.50)#88 | 12.5%(+5.87)#3,525 |
| 89. | West York Borough | 18.2% | 10.8%(+7.41)#89 | 12.5%(+5.78)#3,545 |
| 90. | Sierra View | 18.1% | 10.8%(+7.30)#90 | 12.5%(+5.67)#3,563 |
| 91. | Glen Lyon | 18.1% | 10.8%(+7.29)#91 | 12.5%(+5.66)#3,564 |
| 92. | Sun Valley | 18.1% | 10.8%(+7.25)#92 | 12.5%(+5.62)#3,569 |
| 93. | Queens Gate | 18.0% | 10.8%(+7.15)#93 | 12.5%(+5.52)#3,583 |
| 94. | Penn Estates | 17.6% | 10.8%(+6.76)#94 | 12.5%(+5.13)#3,632 |
| 95. | Parkside Borough | 17.6% | 10.8%(+6.75)#95 | 12.5%(+5.12)#3,634 |
| 96. | Uniontown | 17.5% | 10.8%(+6.62)#96 | 12.5%(+4.99)#3,651 |
| 97. | Lancaster | 17.4% | 10.8%(+6.57)#97 | 12.5%(+4.93)#3,658 |
| 98. | Johnstown | 16.8% | 10.8%(+5.98)#98 | 12.5%(+4.35)#3,766 |
| 99. | Marcus Hook Borough | 16.8% | 10.8%(+5.97)#99 | 12.5%(+4.34)#3,767 |
| 100. | Erie | 16.3% | 10.8%(+5.48)#100 | 12.5%(+3.85)#3,846 |
Common Questions
What are the Top 10 Cities with the Highest Percentage of Black / African American Population in Pennsylvania?
Top 10 Cities with the Highest Percentage of Black / African American Population in Pennsylvania are:
#1
75.9%
#2
49.7%
#3
47.3%
#4
46.4%
#5
44.7%
#6
42.8%
#7
40.2%
#8
40.1%
#9
36.3%
#10
36.1%
What city has the Highest Percentage of Black / African American Population in Pennsylvania?
Chester has the Highest Percentage of Black / African American Population in Pennsylvania with 75.9%.
What is the Percentage of Black / African American Population in the State of Pennsylvania?
Percentage of Black / African American Population in Pennsylvania is 10.8%.
What is the Percentage of Black / African American Population in the United States?
Percentage of Black / African American Population in the United States is 12.5%.