Carson, CA Map & Demographics
Carson Map
Carson Overview
$36,093
PER CAPITA INCOME
$109,157
AVG FAMILY INCOME
$103,045
AVG HOUSEHOLD INCOME
10.6%
WAGE / INCOME GAP [ % ]
89.4¢/ $1
WAGE / INCOME GAP [ $ ]
$9,945
FAMILY INCOME DEFICIT
0.41
INEQUALITY / GINI INDEX
94,475
TOTAL POPULATION
46,942
MALE POPULATION
47,533
FEMALE POPULATION
98.76
MALES / 100 FEMALES
101.26
FEMALES / 100 MALES
41.3
MEDIAN AGE
3.9
AVG FAMILY SIZE
3.6
AVG HOUSEHOLD SIZE
48,784
LABOR FORCE [ PEOPLE ]
61.9%
PERCENT IN LABOR FORCE
6.9%
UNEMPLOYMENT RATE
Income in Carson
Income Overview in Carson
Per Capita Income in Carson is $36,093, while median incomes of families and households are $109,157 and $103,045 respectively.
| Characteristic | Number | Measure |
| Per Capita Income | 94,475 | $36,093 |
| Median Family Income | 21,233 | $109,157 |
| Mean Family Income | 21,233 | $129,450 |
| Median Household Income | 26,084 | $103,045 |
| Mean Household Income | 26,084 | $123,201 |
| Income Deficit | 21,233 | $9,945 |
| Wage / Income Gap (%) | 94,475 | 10.61% |
| Wage / Income Gap ($) | 94,475 | 89.39¢ per $1 |
| Gini / Inequality Index | 94,475 | 0.41 |
Earnings by Sex in Carson
Average Earnings in Carson are $43,411, $45,768 for men and $40,911 for women, a difference of 10.6%.
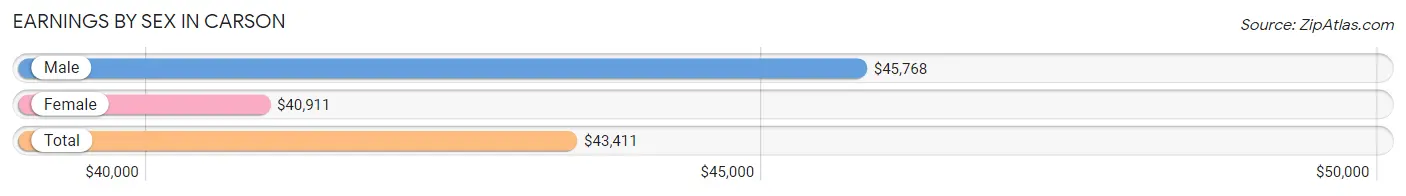
| Sex | Number | Average Earnings |
| Male | 25,319 (51.6%) | $45,768 |
| Female | 23,765 (48.4%) | $40,911 |
| Total | 49,084 (100.0%) | $43,411 |
Earnings by Sex by Income Bracket in Carson
The most common earnings brackets in Carson are $100,000+ for men (3,830 | 15.1%) and $100,000+ for women (3,076 | 12.9%).
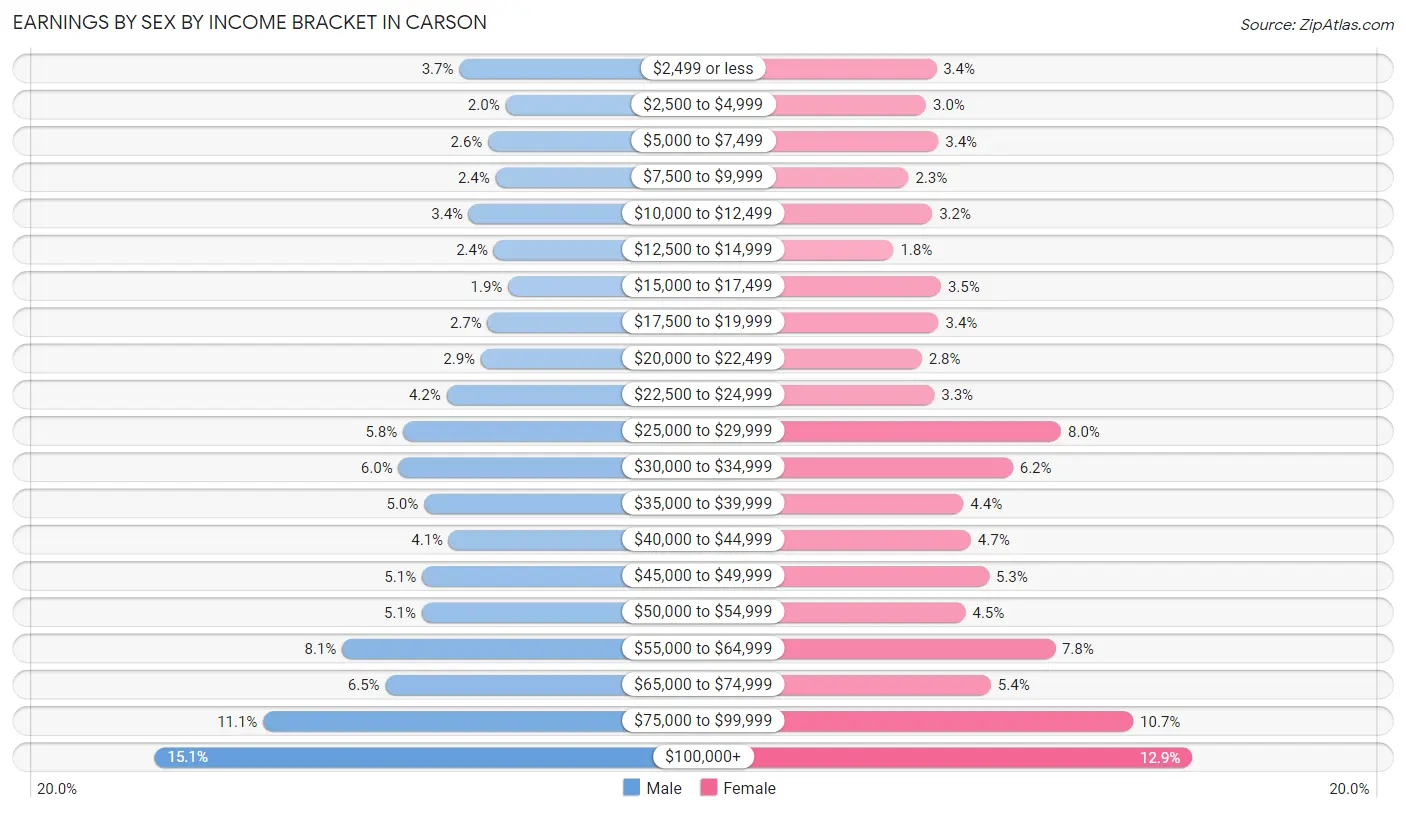
| Income | Male | Female |
| $2,499 or less | 939 (3.7%) | 797 (3.4%) |
| $2,500 to $4,999 | 501 (2.0%) | 706 (3.0%) |
| $5,000 to $7,499 | 666 (2.6%) | 814 (3.4%) |
| $7,500 to $9,999 | 594 (2.4%) | 549 (2.3%) |
| $10,000 to $12,499 | 849 (3.4%) | 761 (3.2%) |
| $12,500 to $14,999 | 612 (2.4%) | 417 (1.8%) |
| $15,000 to $17,499 | 477 (1.9%) | 840 (3.5%) |
| $17,500 to $19,999 | 672 (2.6%) | 818 (3.4%) |
| $20,000 to $22,499 | 733 (2.9%) | 667 (2.8%) |
| $22,500 to $24,999 | 1,062 (4.2%) | 780 (3.3%) |
| $25,000 to $29,999 | 1,474 (5.8%) | 1,908 (8.0%) |
| $30,000 to $34,999 | 1,516 (6.0%) | 1,479 (6.2%) |
| $35,000 to $39,999 | 1,274 (5.0%) | 1,038 (4.4%) |
| $40,000 to $44,999 | 1,037 (4.1%) | 1,104 (4.6%) |
| $45,000 to $49,999 | 1,294 (5.1%) | 1,267 (5.3%) |
| $50,000 to $54,999 | 1,296 (5.1%) | 1,058 (4.4%) |
| $55,000 to $64,999 | 2,052 (8.1%) | 1,854 (7.8%) |
| $65,000 to $74,999 | 1,641 (6.5%) | 1,283 (5.4%) |
| $75,000 to $99,999 | 2,800 (11.1%) | 2,549 (10.7%) |
| $100,000+ | 3,830 (15.1%) | 3,076 (12.9%) |
| Total | 25,319 (100.0%) | 23,765 (100.0%) |
Earnings by Sex by Educational Attainment in Carson
Average earnings in Carson are $50,352 for men and $45,880 for women, a difference of 8.9%. Men with an educational attainment of graduate degree enjoy the highest average annual earnings of $106,500, while those with less than high school education earn the least with $35,068. Women with an educational attainment of graduate degree earn the most with the average annual earnings of $83,512, while those with less than high school education have the smallest earnings of $27,681.
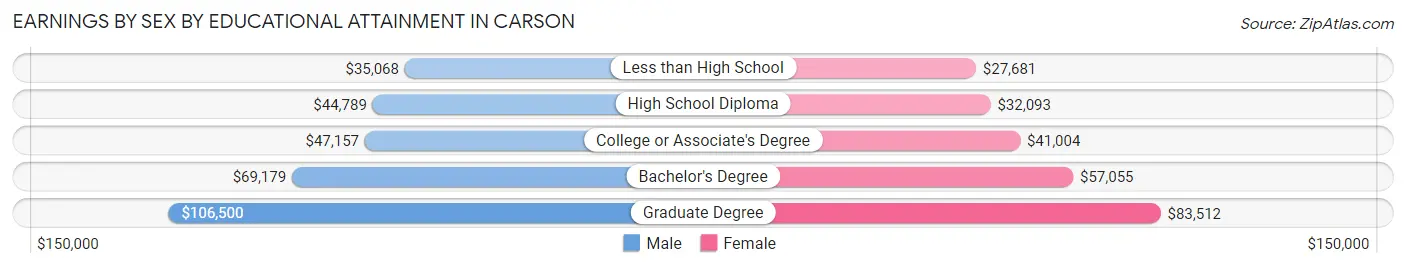
| Educational Attainment | Male Income | Female Income |
| Less than High School | $35,068 | $27,681 |
| High School Diploma | $44,789 | $32,093 |
| College or Associate's Degree | $47,157 | $41,004 |
| Bachelor's Degree | $69,179 | $57,055 |
| Graduate Degree | $106,500 | $83,512 |
| Total | $50,352 | $45,880 |
Family Income in Carson
Family Income Brackets in Carson
According to the Carson family income data, there are 5,138 families falling into the $100,000 to $149,999 income range, which is the most common income bracket and makes up 24.2% of all families. Conversely, the $10,000 to $14,999 income bracket is the least frequent group with only 340 families (1.6%) belonging to this category.
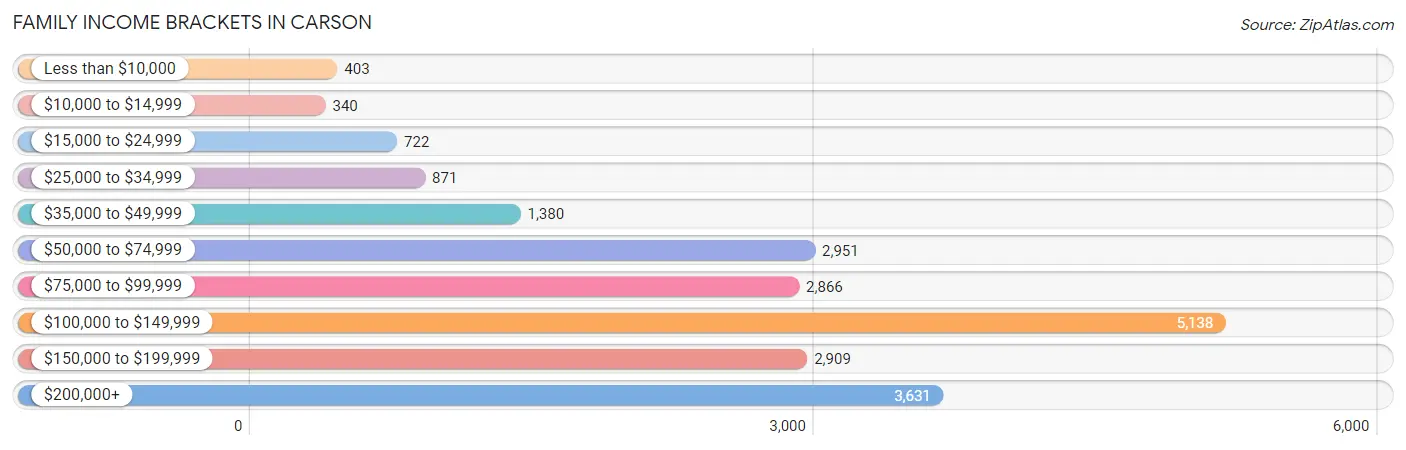
| Income Bracket | # Families | % Families |
| Less than $10,000 | 403 | 1.9% |
| $10,000 to $14,999 | 340 | 1.6% |
| $15,000 to $24,999 | 722 | 3.4% |
| $25,000 to $34,999 | 871 | 4.1% |
| $35,000 to $49,999 | 1,380 | 6.5% |
| $50,000 to $74,999 | 2,951 | 13.9% |
| $75,000 to $99,999 | 2,866 | 13.5% |
| $100,000 to $149,999 | 5,138 | 24.2% |
| $150,000 to $199,999 | 2,909 | 13.7% |
| $200,000+ | 3,631 | 17.1% |
Family Income by Famaliy Size in Carson
7+ person families (1,261 | 5.9%) account for the highest median family income in Carson with $146,516 per family, while 2-person families (6,565 | 30.9%) have the highest median income of $40,494 per family member.
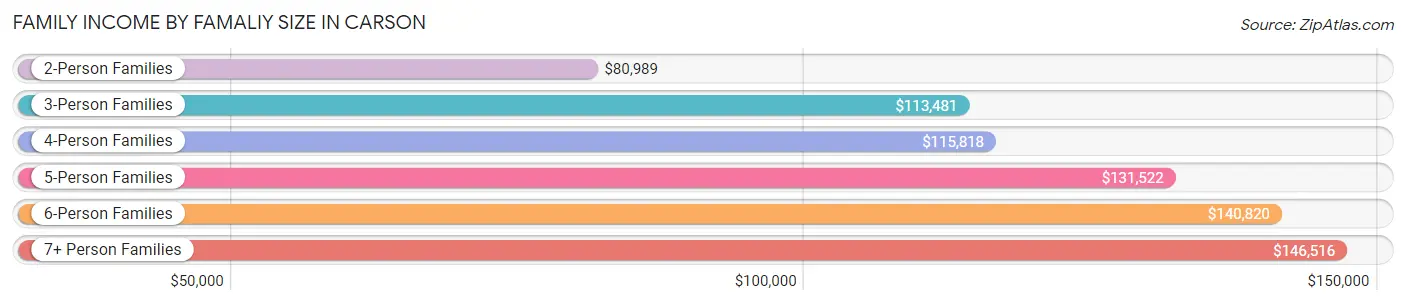
| Income Bracket | # Families | Median Income |
| 2-Person Families | 6,565 (30.9%) | $80,989 |
| 3-Person Families | 4,833 (22.8%) | $113,481 |
| 4-Person Families | 4,325 (20.4%) | $115,818 |
| 5-Person Families | 2,912 (13.7%) | $131,522 |
| 6-Person Families | 1,337 (6.3%) | $140,820 |
| 7+ Person Families | 1,261 (5.9%) | $146,516 |
| Total | 21,233 (100.0%) | $109,157 |
Family Income by Number of Earners in Carson
The median family income in Carson is $109,157, with families comprising 3+ earners (5,329) having the highest median family income of $157,555, while families with no earners (2,180) have the lowest median family income of $53,396, accounting for 25.1% and 10.3% of families, respectively.
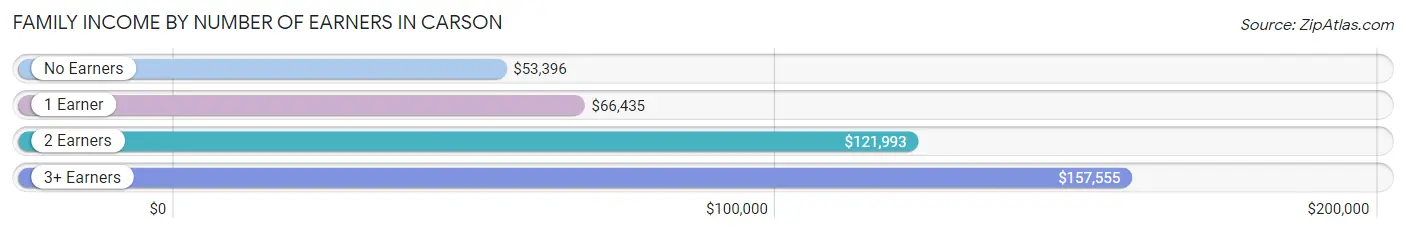
| Number of Earners | # Families | Median Income |
| No Earners | 2,180 (10.3%) | $53,396 |
| 1 Earner | 5,609 (26.4%) | $66,435 |
| 2 Earners | 8,115 (38.2%) | $121,993 |
| 3+ Earners | 5,329 (25.1%) | $157,555 |
| Total | 21,233 (100.0%) | $109,157 |
Household Income in Carson
Household Income Brackets in Carson
With 6,025 households falling in the category, the $100,000 to $149,999 income range is the most frequent in Carson, accounting for 23.1% of all households. In contrast, only 730 households (2.8%) fall into the $10,000 to $14,999 income bracket, making it the least populous group.
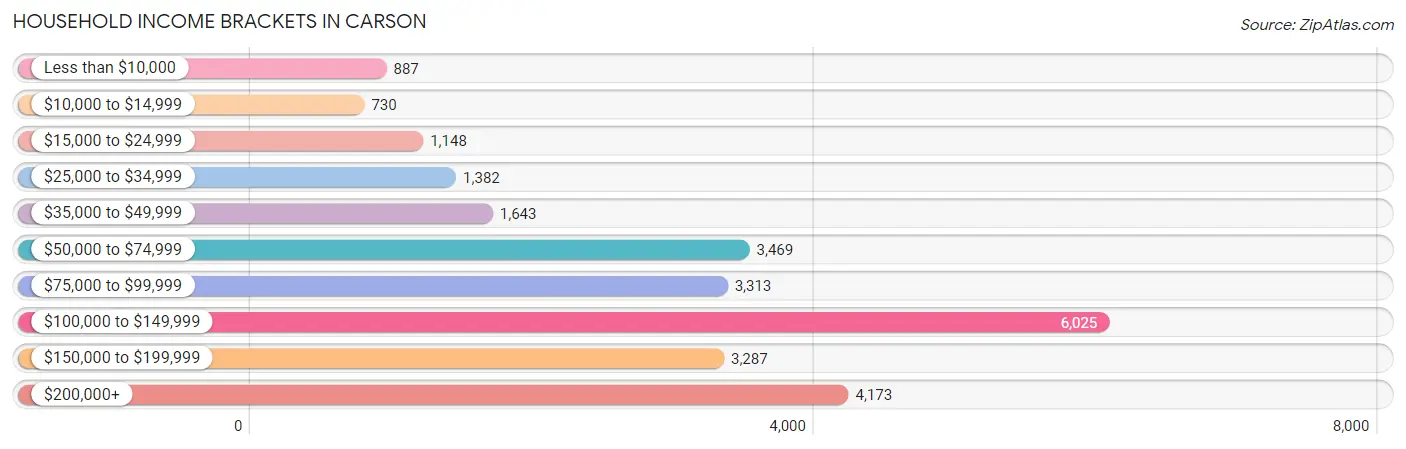
| Income Bracket | # Households | % Households |
| Less than $10,000 | 887 | 3.4% |
| $10,000 to $14,999 | 730 | 2.8% |
| $15,000 to $24,999 | 1,148 | 4.4% |
| $25,000 to $34,999 | 1,382 | 5.3% |
| $35,000 to $49,999 | 1,643 | 6.3% |
| $50,000 to $74,999 | 3,469 | 13.3% |
| $75,000 to $99,999 | 3,313 | 12.7% |
| $100,000 to $149,999 | 6,025 | 23.1% |
| $150,000 to $199,999 | 3,287 | 12.6% |
| $200,000+ | 4,173 | 16.0% |
Household Income by Householder Age in Carson
The median household income in Carson is $103,045, with the highest median household income of $115,593 found in the 45 to 64 years age bracket for the primary householder. A total of 11,553 households (44.3%) fall into this category. Meanwhile, the 65+ years age bracket for the primary householder has the lowest median household income of $74,932, with 8,135 households (31.2%) in this group.
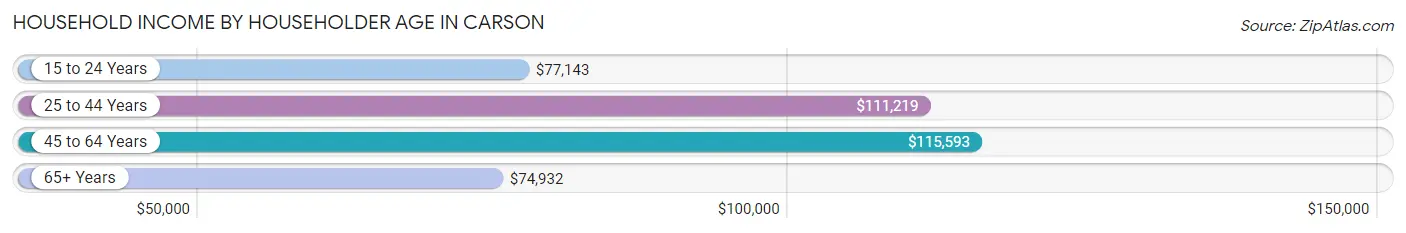
| Income Bracket | # Households | Median Income |
| 15 to 24 Years | 226 (0.9%) | $77,143 |
| 25 to 44 Years | 6,170 (23.6%) | $111,219 |
| 45 to 64 Years | 11,553 (44.3%) | $115,593 |
| 65+ Years | 8,135 (31.2%) | $74,932 |
| Total | 26,084 (100.0%) | $103,045 |
Poverty in Carson
Income Below Poverty by Sex and Age in Carson
With 9.1% poverty level for males and 9.2% for females among the residents of Carson, 6 to 11 year old males and 75 year old and over females are the most vulnerable to poverty, with 429 males (16.6%) and 562 females (14.5%) in their respective age groups living below the poverty level.
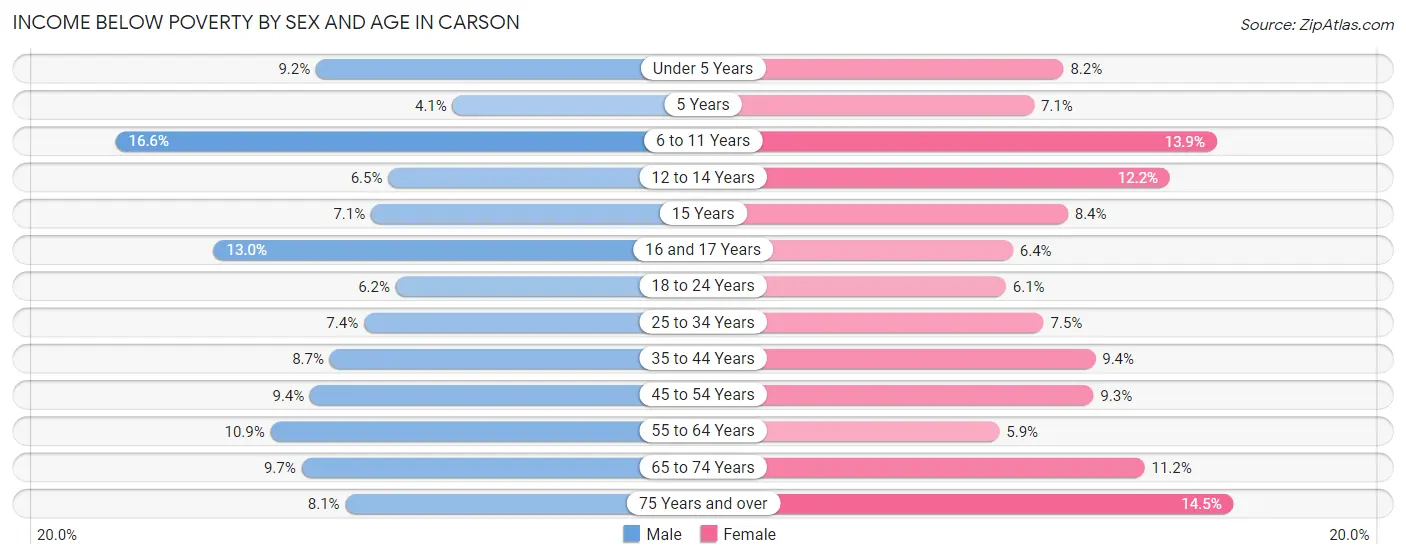
| Age Bracket | Male | Female |
| Under 5 Years | 223 (9.2%) | 141 (8.2%) |
| 5 Years | 18 (4.1%) | 27 (7.1%) |
| 6 to 11 Years | 429 (16.6%) | 397 (13.9%) |
| 12 to 14 Years | 131 (6.5%) | 218 (12.2%) |
| 15 Years | 37 (7.1%) | 51 (8.4%) |
| 16 and 17 Years | 182 (13.0%) | 86 (6.4%) |
| 18 to 24 Years | 297 (6.2%) | 231 (6.1%) |
| 25 to 34 Years | 517 (7.4%) | 482 (7.5%) |
| 35 to 44 Years | 531 (8.7%) | 532 (9.4%) |
| 45 to 54 Years | 545 (9.4%) | 608 (9.3%) |
| 55 to 64 Years | 717 (10.9%) | 411 (5.9%) |
| 65 to 74 Years | 400 (9.7%) | 603 (11.2%) |
| 75 Years and over | 228 (8.1%) | 562 (14.5%) |
| Total | 4,255 (9.1%) | 4,349 (9.2%) |
Income Above Poverty by Sex and Age in Carson
According to the poverty statistics in Carson, males aged 5 years and females aged 55 to 64 years are the age groups that are most secure financially, with 95.9% of males and 94.2% of females in these age groups living above the poverty line.
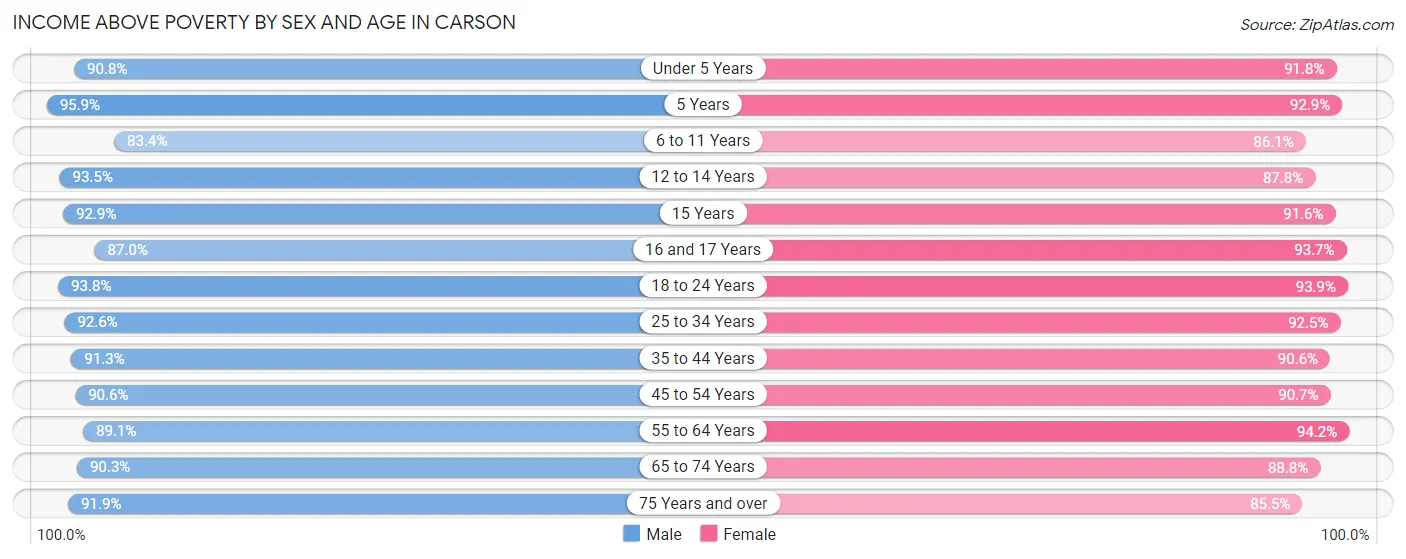
| Age Bracket | Male | Female |
| Under 5 Years | 2,205 (90.8%) | 1,572 (91.8%) |
| 5 Years | 420 (95.9%) | 351 (92.9%) |
| 6 to 11 Years | 2,153 (83.4%) | 2,455 (86.1%) |
| 12 to 14 Years | 1,885 (93.5%) | 1,572 (87.8%) |
| 15 Years | 481 (92.9%) | 557 (91.6%) |
| 16 and 17 Years | 1,220 (87.0%) | 1,269 (93.6%) |
| 18 to 24 Years | 4,479 (93.8%) | 3,565 (93.9%) |
| 25 to 34 Years | 6,467 (92.6%) | 5,957 (92.5%) |
| 35 to 44 Years | 5,597 (91.3%) | 5,122 (90.6%) |
| 45 to 54 Years | 5,253 (90.6%) | 5,904 (90.7%) |
| 55 to 64 Years | 5,882 (89.1%) | 6,619 (94.2%) |
| 65 to 74 Years | 3,716 (90.3%) | 4,761 (88.8%) |
| 75 Years and over | 2,589 (91.9%) | 3,304 (85.5%) |
| Total | 42,347 (90.9%) | 43,008 (90.8%) |
Income Below Poverty Among Married-Couple Families in Carson
The poverty statistics for married-couple families in Carson show that 4.0% or 552 of the total 13,912 families live below the poverty line. Families with 3 or 4 children have the highest poverty rate of 10.8%, comprising of 123 families. On the other hand, families with 5 or more children have the lowest poverty rate of 0.0%, which includes 0 families.
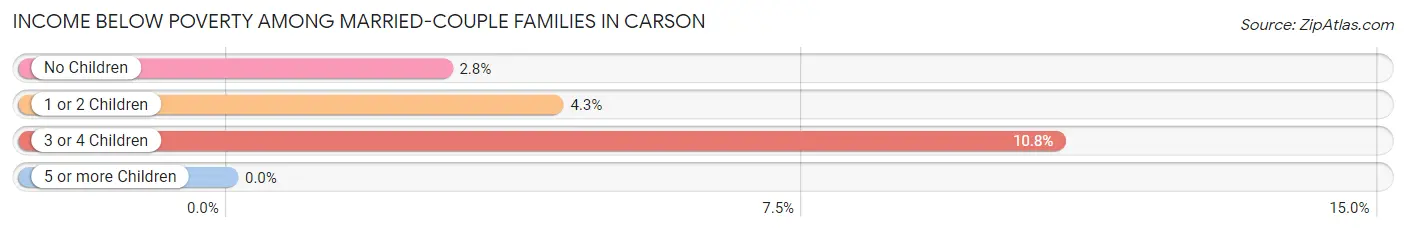
| Children | Above Poverty | Below Poverty |
| No Children | 7,531 (97.2%) | 217 (2.8%) |
| 1 or 2 Children | 4,773 (95.8%) | 212 (4.3%) |
| 3 or 4 Children | 1,016 (89.2%) | 123 (10.8%) |
| 5 or more Children | 40 (100.0%) | 0 (0.0%) |
| Total | 13,360 (96.0%) | 552 (4.0%) |
Income Below Poverty Among Single-Parent Households in Carson
According to the poverty data in Carson, 6.0% or 158 single-father households and 14.6% or 686 single-mother households are living below the poverty line. Among single-father households, those with 1 or 2 children have the highest poverty rate, with 105 households (11.7%) experiencing poverty. Likewise, among single-mother households, those with 5 or more children have the highest poverty rate, with 17 households (85.0%) falling below the poverty line.
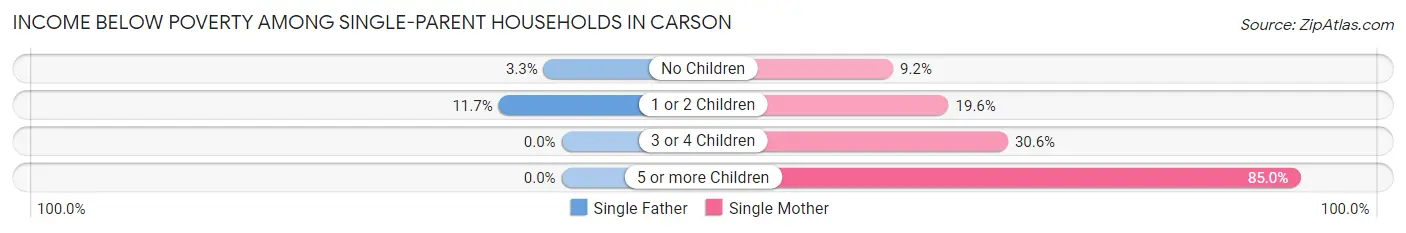
| Children | Single Father | Single Mother |
| No Children | 53 (3.3%) | 257 (9.2%) |
| 1 or 2 Children | 105 (11.7%) | 289 (19.6%) |
| 3 or 4 Children | 0 (0.0%) | 123 (30.6%) |
| 5 or more Children | 0 (0.0%) | 17 (85.0%) |
| Total | 158 (6.0%) | 686 (14.6%) |
Income Below Poverty Among Married-Couple vs Single-Parent Households in Carson
The poverty data for Carson shows that 552 of the married-couple family households (4.0%) and 844 of the single-parent households (11.5%) are living below the poverty level. Within the married-couple family households, those with 3 or 4 children have the highest poverty rate, with 123 households (10.8%) falling below the poverty line. Among the single-parent households, those with 5 or more children have the highest poverty rate, with 17 household (53.1%) living below poverty.
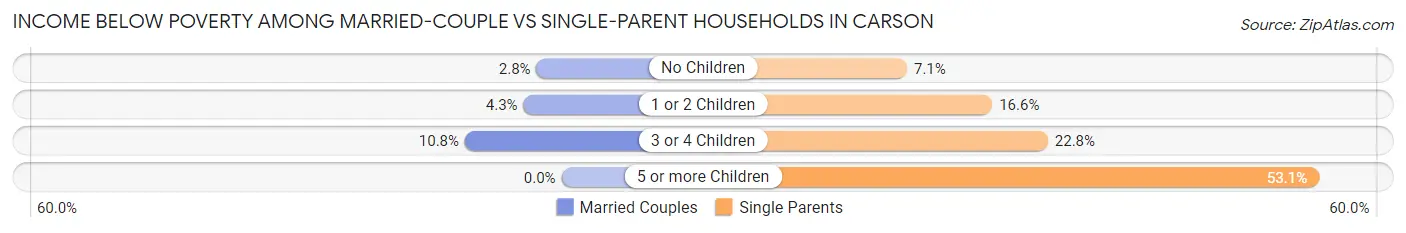
| Children | Married-Couple Families | Single-Parent Households |
| No Children | 217 (2.8%) | 310 (7.1%) |
| 1 or 2 Children | 212 (4.3%) | 394 (16.6%) |
| 3 or 4 Children | 123 (10.8%) | 123 (22.8%) |
| 5 or more Children | 0 (0.0%) | 17 (53.1%) |
| Total | 552 (4.0%) | 844 (11.5%) |
Race in Carson
The most populous races in Carson are Hispanic or Latino (38,042 | 40.3%), Asian (24,137 | 25.6%), and Black / African American (21,222 | 22.5%).
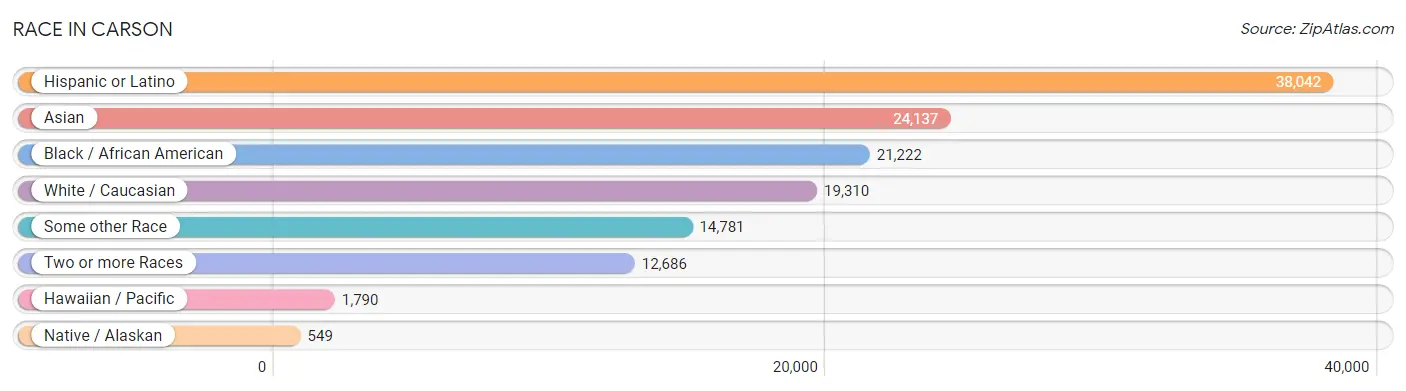
| Race | # Population | % Population |
| Asian | 24,137 | 25.6% |
| Black / African American | 21,222 | 22.5% |
| Hawaiian / Pacific | 1,790 | 1.9% |
| Hispanic or Latino | 38,042 | 40.3% |
| Native / Alaskan | 549 | 0.6% |
| White / Caucasian | 19,310 | 20.4% |
| Two or more Races | 12,686 | 13.4% |
| Some other Race | 14,781 | 15.7% |
| Total | 94,475 | 100.0% |
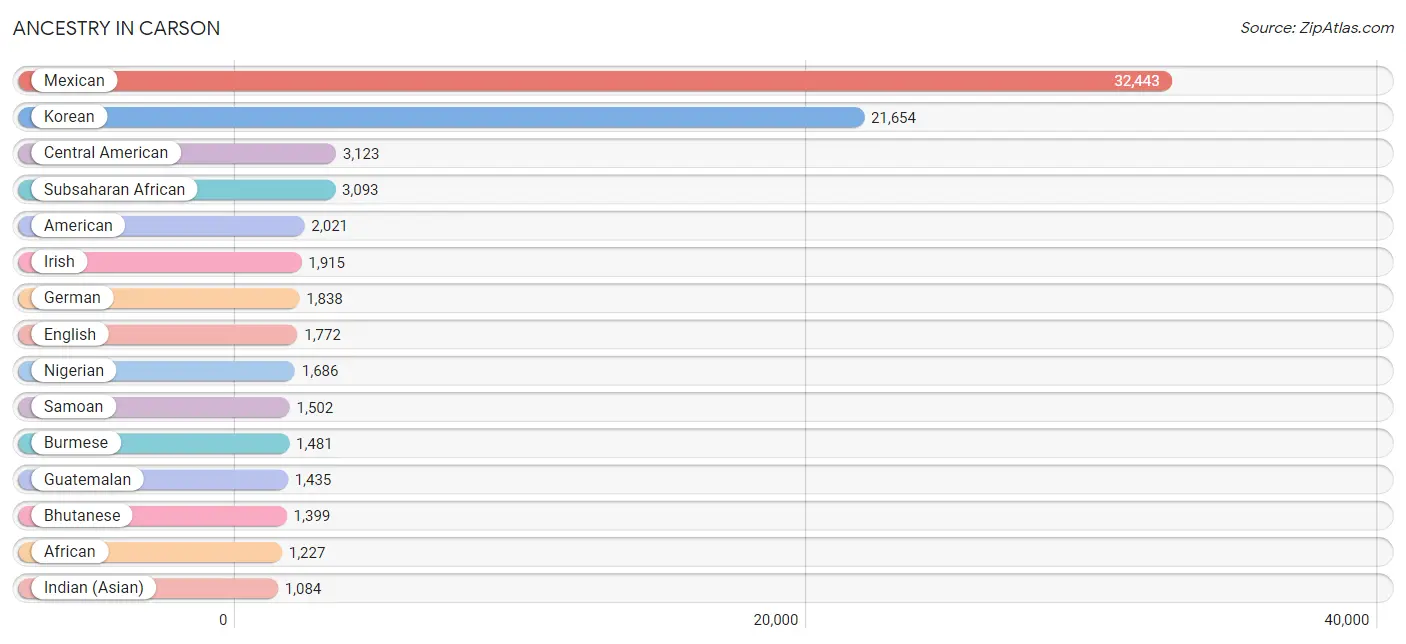
Ancestry in Carson
The most populous ancestries reported in Carson are Mexican (32,443 | 34.3%), Korean (21,654 | 22.9%), Central American (3,123 | 3.3%), Subsaharan African (3,093 | 3.3%), and American (2,021 | 2.1%), together accounting for 66.0% of all Carson residents.
| Ancestry | # Population | % Population |
| African | 1,227 | 1.3% |
| American | 2,021 | 2.1% |
| Apache | 16 | 0.0% |
| Arab | 212 | 0.2% |
| Argentinean | 143 | 0.2% |
| Armenian | 23 | 0.0% |
| Assyrian / Chaldean / Syriac | 15 | 0.0% |
| Austrian | 48 | 0.1% |
| Bangladeshi | 5 | 0.0% |
| Basque | 2 | 0.0% |
| Belizean | 78 | 0.1% |
| Bhutanese | 1,399 | 1.5% |
| Blackfeet | 14 | 0.0% |
| Bolivian | 32 | 0.0% |
| British | 72 | 0.1% |
| Bulgarian | 7 | 0.0% |
| Burmese | 1,481 | 1.6% |
| Canadian | 39 | 0.0% |
| Central American | 3,123 | 3.3% |
| Central American Indian | 90 | 0.1% |
| Cherokee | 171 | 0.2% |
| Chilean | 6 | 0.0% |
| Chinese | 6 | 0.0% |
| Chippewa | 59 | 0.1% |
| Choctaw | 65 | 0.1% |
| Colombian | 131 | 0.1% |
| Costa Rican | 27 | 0.0% |
| Creek | 36 | 0.0% |
| Croatian | 26 | 0.0% |
| Cuban | 176 | 0.2% |
| Czech | 1 | 0.0% |
| Czechoslovakian | 7 | 0.0% |
| Danish | 40 | 0.0% |
| Delaware | 7 | 0.0% |
| Dominican | 44 | 0.1% |
| Dutch | 199 | 0.2% |
| Eastern European | 26 | 0.0% |
| Ecuadorian | 214 | 0.2% |
| English | 1,772 | 1.9% |
| Ethiopian | 114 | 0.1% |
| European | 513 | 0.5% |
| Filipino | 124 | 0.1% |
| French | 410 | 0.4% |
| French Canadian | 76 | 0.1% |
| German | 1,838 | 1.9% |
| Ghanaian | 9 | 0.0% |
| Greek | 37 | 0.0% |
| Guamanian / Chamorro | 528 | 0.6% |
| Guatemalan | 1,435 | 1.5% |
| Guyanese | 33 | 0.0% |
| Haitian | 23 | 0.0% |
| Honduran | 356 | 0.4% |
| Hungarian | 26 | 0.0% |
| Indian (Asian) | 1,084 | 1.1% |
| Indonesian | 76 | 0.1% |
| Iranian | 44 | 0.1% |
| Irish | 1,915 | 2.0% |
| Iroquois | 9 | 0.0% |
| Italian | 713 | 0.7% |
| Jamaican | 94 | 0.1% |
| Japanese | 380 | 0.4% |
| Korean | 21,654 | 22.9% |
| Laotian | 57 | 0.1% |
| Latvian | 5 | 0.0% |
| Lebanese | 53 | 0.1% |
| Lithuanian | 16 | 0.0% |
| Mexican | 32,443 | 34.3% |
| Mexican American Indian | 455 | 0.5% |
| Mongolian | 7 | 0.0% |
| Moroccan | 42 | 0.0% |
| Native Hawaiian | 264 | 0.3% |
| Navajo | 70 | 0.1% |
| Nicaraguan | 241 | 0.3% |
| Nigerian | 1,686 | 1.8% |
| Northern European | 16 | 0.0% |
| Norwegian | 154 | 0.2% |
| Paiute | 4 | 0.0% |
| Pakistani | 110 | 0.1% |
| Panamanian | 24 | 0.0% |
| Peruvian | 464 | 0.5% |
| Polish | 371 | 0.4% |
| Portuguese | 157 | 0.2% |
| Puerto Rican | 203 | 0.2% |
| Romanian | 9 | 0.0% |
| Russian | 93 | 0.1% |
| Salvadoran | 1,040 | 1.1% |
| Samoan | 1,502 | 1.6% |
| Scandinavian | 47 | 0.1% |
| Scotch-Irish | 138 | 0.2% |
| Scottish | 387 | 0.4% |
| Serbian | 17 | 0.0% |
| Sioux | 43 | 0.1% |
| Somali | 9 | 0.0% |
| South American | 997 | 1.1% |
| South American Indian | 6 | 0.0% |
| Spaniard | 165 | 0.2% |
| Spanish | 115 | 0.1% |
| Sri Lankan | 337 | 0.4% |
| Subsaharan African | 3,093 | 3.3% |
| Swedish | 157 | 0.2% |
| Thai | 805 | 0.9% |
| Trinidadian and Tobagonian | 8 | 0.0% |
| Turkish | 12 | 0.0% |
| Ukrainian | 7 | 0.0% |
| Venezuelan | 7 | 0.0% |
| Welsh | 52 | 0.1% |
| Yaqui | 27 | 0.0% | View All 107 Rows |
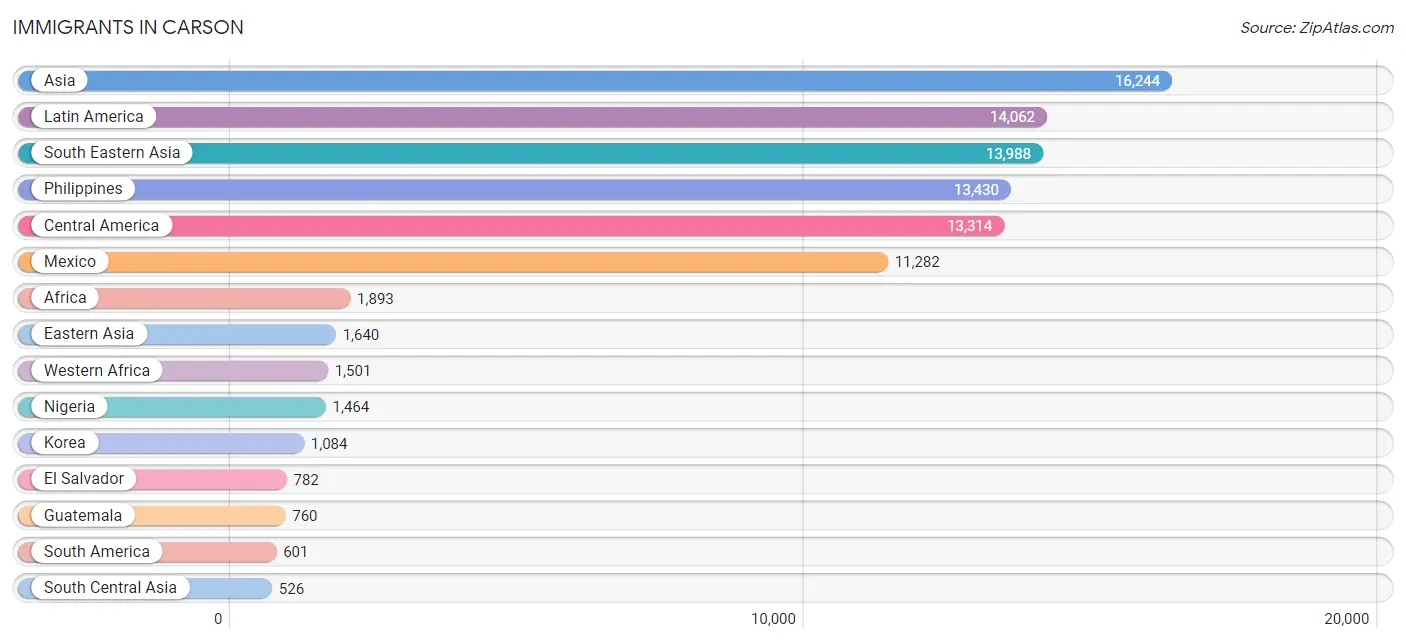
Immigrants in Carson
The most numerous immigrant groups reported in Carson came from Asia (16,244 | 17.2%), Latin America (14,062 | 14.9%), South Eastern Asia (13,988 | 14.8%), Philippines (13,430 | 14.2%), and Central America (13,314 | 14.1%), together accounting for 75.2% of all Carson residents.
| Immigration Origin | # Population | % Population |
| Africa | 1,893 | 2.0% |
| Argentina | 90 | 0.1% |
| Armenia | 13 | 0.0% |
| Asia | 16,244 | 17.2% |
| Austria | 24 | 0.0% |
| Bangladesh | 52 | 0.1% |
| Belize | 8 | 0.0% |
| Bolivia | 32 | 0.0% |
| Brazil | 6 | 0.0% |
| Bulgaria | 7 | 0.0% |
| Cambodia | 227 | 0.2% |
| Cameroon | 125 | 0.1% |
| Canada | 37 | 0.0% |
| Caribbean | 147 | 0.2% |
| Central America | 13,314 | 14.1% |
| Chile | 6 | 0.0% |
| China | 486 | 0.5% |
| Colombia | 17 | 0.0% |
| Costa Rica | 22 | 0.0% |
| Cuba | 54 | 0.1% |
| Dominican Republic | 15 | 0.0% |
| Eastern Africa | 157 | 0.2% |
| Eastern Asia | 1,640 | 1.7% |
| Eastern Europe | 24 | 0.0% |
| Ecuador | 75 | 0.1% |
| Egypt | 110 | 0.1% |
| El Salvador | 782 | 0.8% |
| England | 82 | 0.1% |
| Eritrea | 34 | 0.0% |
| Ethiopia | 114 | 0.1% |
| Europe | 245 | 0.3% |
| Fiji | 107 | 0.1% |
| France | 16 | 0.0% |
| Germany | 86 | 0.1% |
| Ghana | 36 | 0.0% |
| Guatemala | 760 | 0.8% |
| Guyana | 33 | 0.0% |
| Honduras | 303 | 0.3% |
| Hong Kong | 5 | 0.0% |
| India | 216 | 0.2% |
| Indonesia | 57 | 0.1% |
| Iran | 44 | 0.1% |
| Jamaica | 16 | 0.0% |
| Japan | 70 | 0.1% |
| Korea | 1,084 | 1.1% |
| Latin America | 14,062 | 14.9% |
| Lebanon | 10 | 0.0% |
| Liberia | 1 | 0.0% |
| Mexico | 11,282 | 11.9% |
| Middle Africa | 125 | 0.1% |
| Nepal | 153 | 0.2% |
| Nicaragua | 120 | 0.1% |
| Nigeria | 1,464 | 1.5% |
| Northern Africa | 110 | 0.1% |
| Northern Europe | 87 | 0.1% |
| Oceania | 250 | 0.3% |
| Pakistan | 19 | 0.0% |
| Panama | 37 | 0.0% |
| Peru | 335 | 0.4% |
| Philippines | 13,430 | 14.2% |
| Romania | 9 | 0.0% |
| Russia | 8 | 0.0% |
| Somalia | 9 | 0.0% |
| South America | 601 | 0.6% |
| South Central Asia | 526 | 0.6% |
| South Eastern Asia | 13,988 | 14.8% |
| Southern Europe | 8 | 0.0% |
| Spain | 8 | 0.0% |
| Sri Lanka | 42 | 0.0% |
| Taiwan | 49 | 0.1% |
| Thailand | 58 | 0.1% |
| Trinidad and Tobago | 53 | 0.1% |
| Venezuela | 7 | 0.0% |
| Vietnam | 147 | 0.2% |
| West Indies | 9 | 0.0% |
| Western Africa | 1,501 | 1.6% |
| Western Asia | 64 | 0.1% |
| Western Europe | 126 | 0.1% | View All 78 Rows |
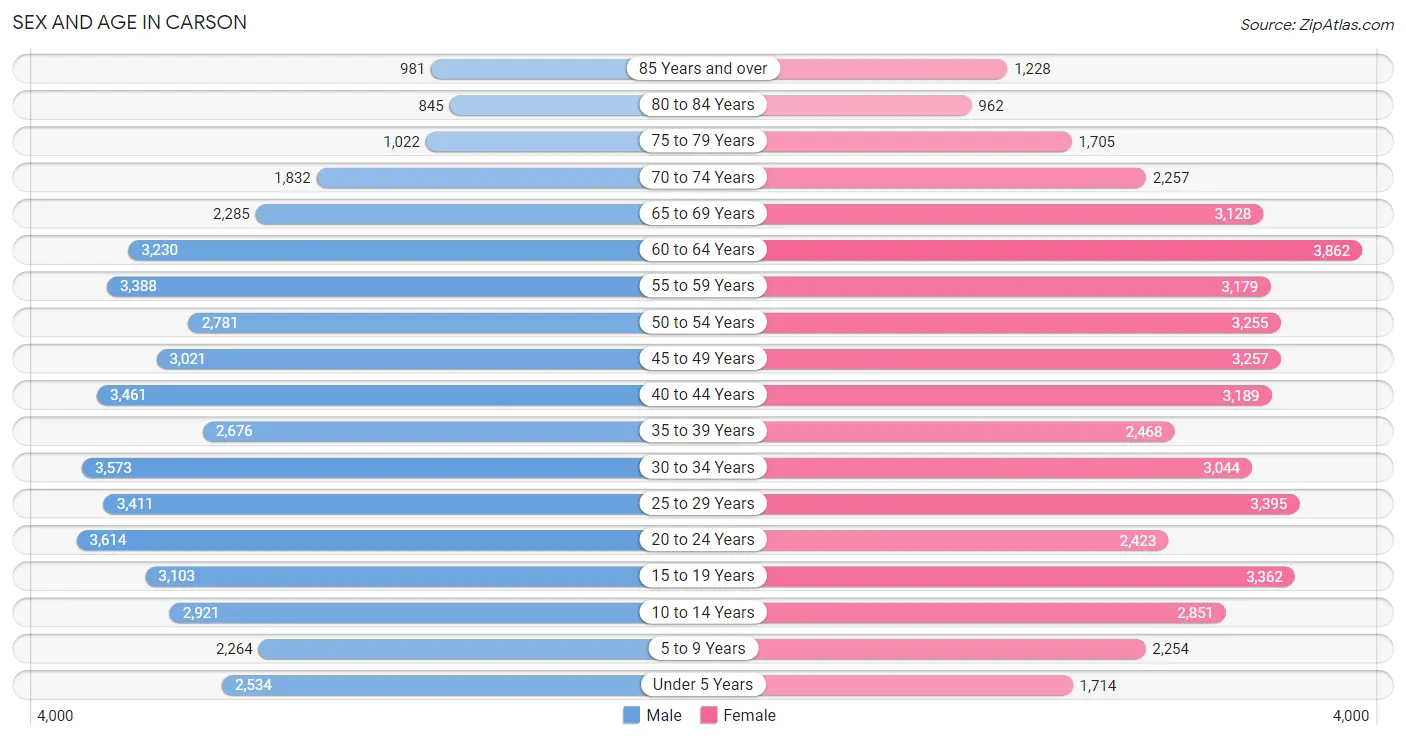
Sex and Age in Carson
Sex and Age in Carson
The most populous age groups in Carson are 20 to 24 Years (3,614 | 7.7%) for men and 60 to 64 Years (3,862 | 8.1%) for women.
| Age Bracket | Male | Female |
| Under 5 Years | 2,534 (5.4%) | 1,714 (3.6%) |
| 5 to 9 Years | 2,264 (4.8%) | 2,254 (4.7%) |
| 10 to 14 Years | 2,921 (6.2%) | 2,851 (6.0%) |
| 15 to 19 Years | 3,103 (6.6%) | 3,362 (7.1%) |
| 20 to 24 Years | 3,614 (7.7%) | 2,423 (5.1%) |
| 25 to 29 Years | 3,411 (7.3%) | 3,395 (7.1%) |
| 30 to 34 Years | 3,573 (7.6%) | 3,044 (6.4%) |
| 35 to 39 Years | 2,676 (5.7%) | 2,468 (5.2%) |
| 40 to 44 Years | 3,461 (7.4%) | 3,189 (6.7%) |
| 45 to 49 Years | 3,021 (6.4%) | 3,257 (6.9%) |
| 50 to 54 Years | 2,781 (5.9%) | 3,255 (6.9%) |
| 55 to 59 Years | 3,388 (7.2%) | 3,179 (6.7%) |
| 60 to 64 Years | 3,230 (6.9%) | 3,862 (8.1%) |
| 65 to 69 Years | 2,285 (4.9%) | 3,128 (6.6%) |
| 70 to 74 Years | 1,832 (3.9%) | 2,257 (4.8%) |
| 75 to 79 Years | 1,022 (2.2%) | 1,705 (3.6%) |
| 80 to 84 Years | 845 (1.8%) | 962 (2.0%) |
| 85 Years and over | 981 (2.1%) | 1,228 (2.6%) |
| Total | 46,942 (100.0%) | 47,533 (100.0%) |
Families and Households in Carson
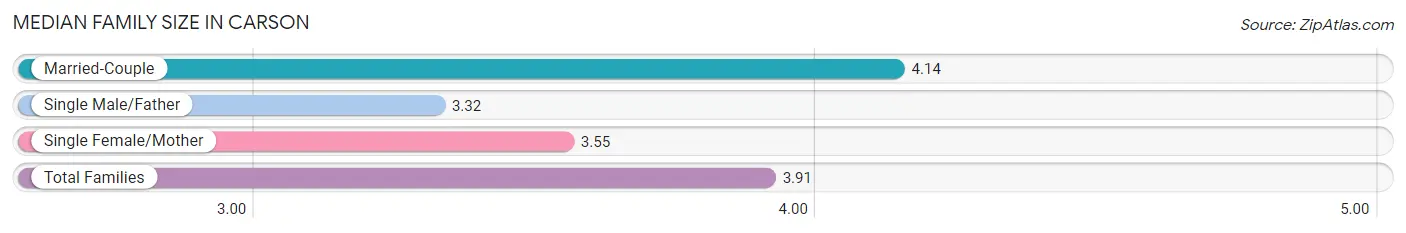
Median Family Size in Carson
The median family size in Carson is 3.91 persons per family, with married-couple families (13,912 | 65.5%) accounting for the largest median family size of 4.14 persons per family. On the other hand, single male/father families (2,634 | 12.4%) represent the smallest median family size with 3.32 persons per family.
| Family Type | # Families | Family Size |
| Married-Couple | 13,912 (65.5%) | 4.14 |
| Single Male/Father | 2,634 (12.4%) | 3.32 |
| Single Female/Mother | 4,687 (22.1%) | 3.55 |
| Total Families | 21,233 (100.0%) | 3.91 |
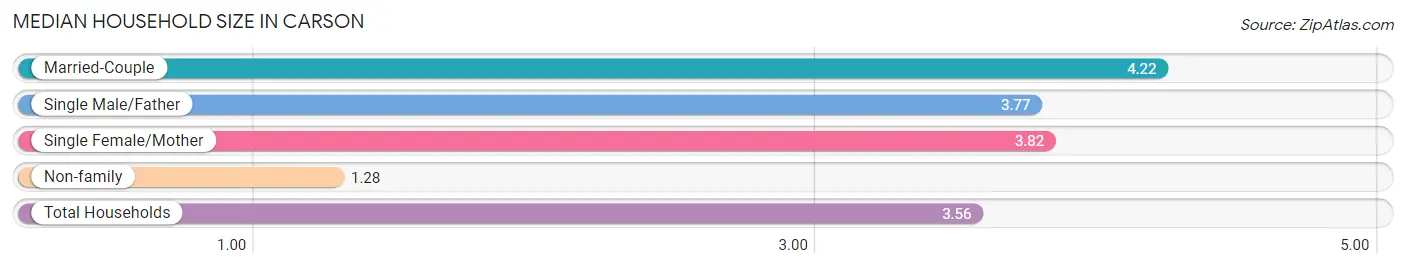
Median Household Size in Carson
The median household size in Carson is 3.56 persons per household, with married-couple households (13,912 | 53.3%) accounting for the largest median household size of 4.22 persons per household. non-family households (4,851 | 18.6%) represent the smallest median household size with 1.28 persons per household.
| Household Type | # Households | Household Size |
| Married-Couple | 13,912 (53.3%) | 4.22 |
| Single Male/Father | 2,634 (10.1%) | 3.77 |
| Single Female/Mother | 4,687 (18.0%) | 3.82 |
| Non-family | 4,851 (18.6%) | 1.28 |
| Total Households | 26,084 (100.0%) | 3.56 |
Household Size by Marriage Status in Carson
Out of a total of 26,084 households in Carson, 21,233 (81.4%) are family households, while 4,851 (18.6%) are nonfamily households. The most numerous type of family households are 2-person households, comprising 5,773, and the most common type of nonfamily households are 1-person households, comprising 4,095.
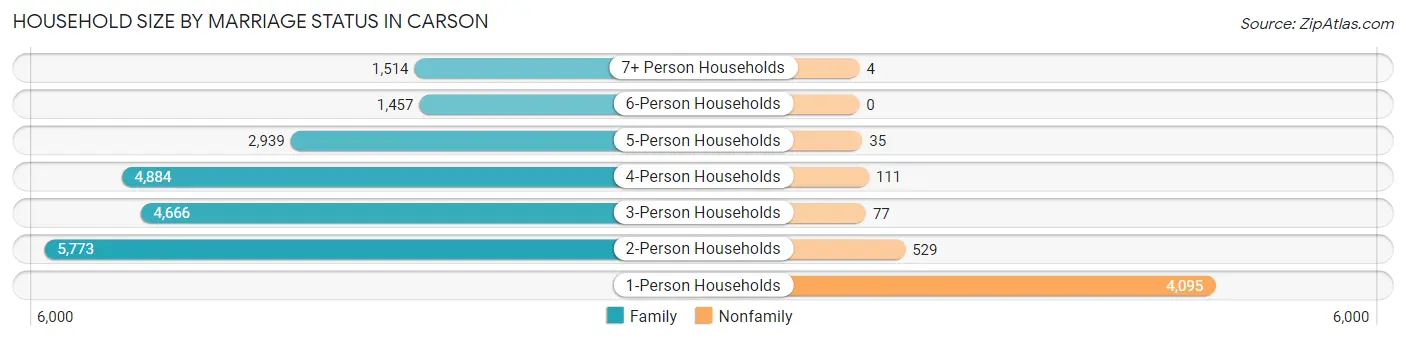
| Household Size | Family Households | Nonfamily Households |
| 1-Person Households | - | 4,095 (15.7%) |
| 2-Person Households | 5,773 (22.1%) | 529 (2.0%) |
| 3-Person Households | 4,666 (17.9%) | 77 (0.3%) |
| 4-Person Households | 4,884 (18.7%) | 111 (0.4%) |
| 5-Person Households | 2,939 (11.3%) | 35 (0.1%) |
| 6-Person Households | 1,457 (5.6%) | 0 (0.0%) |
| 7+ Person Households | 1,514 (5.8%) | 4 (0.0%) |
| Total | 21,233 (81.4%) | 4,851 (18.6%) |
Female Fertility in Carson
Fertility by Age in Carson
Average fertility rate in Carson is 36.0 births per 1,000 women. Women in the age bracket of 20 to 34 years have the highest fertility rate with 48.0 births per 1,000 women. Women in the age bracket of 20 to 34 years acount for 53.9% of all women with births.
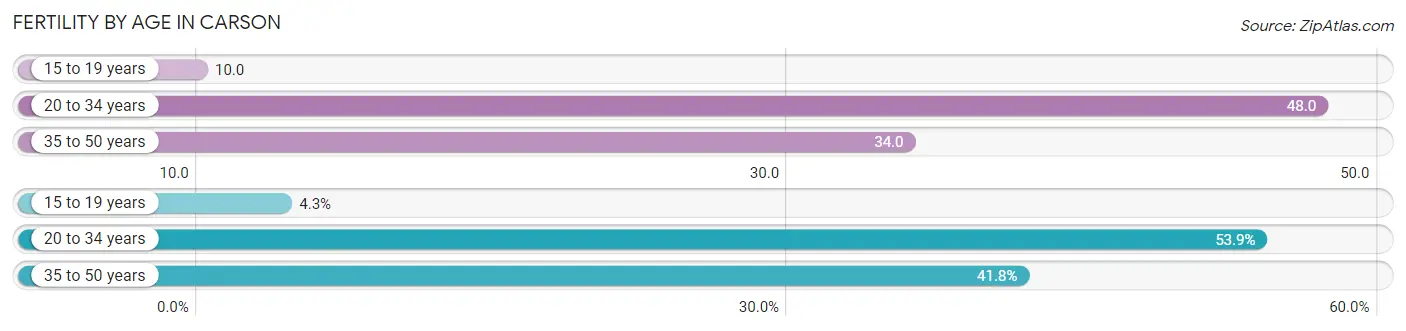
| Age Bracket | Women with Births | Births / 1,000 Women |
| 15 to 19 years | 34 (4.3%) | 10.0 |
| 20 to 34 years | 427 (53.9%) | 48.0 |
| 35 to 50 years | 331 (41.8%) | 34.0 |
| Total | 792 (100.0%) | 36.0 |
Fertility by Age by Marriage Status in Carson
78.9% of women with births (792) in Carson are married. The highest percentage of unmarried women with births falls into 15 to 19 years age bracket with 100.0% of them unmarried at the time of birth, while the lowest percentage of unmarried women with births belong to 35 to 50 years age bracket with 17.2% of them unmarried.
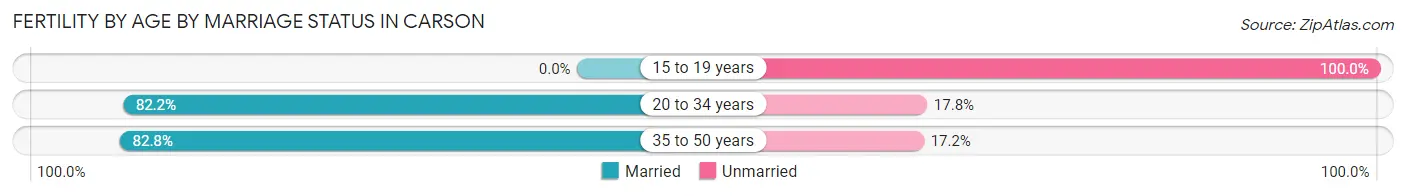
| Age Bracket | Married | Unmarried |
| 15 to 19 years | 0 (0.0%) | 34 (100.0%) |
| 20 to 34 years | 351 (82.2%) | 76 (17.8%) |
| 35 to 50 years | 274 (82.8%) | 57 (17.2%) |
| Total | 625 (78.9%) | 167 (21.1%) |
Fertility by Education in Carson
Average fertility rate in Carson is 36.0 births per 1,000 women. Women with the education attainment of graduate degree have the highest fertility rate of 101.0 births per 1,000 women, while women with the education attainment of less than high school have the lowest fertility at 18.0 births per 1,000 women. Women with the education attainment of graduate degree represent 27.2% of all women with births.
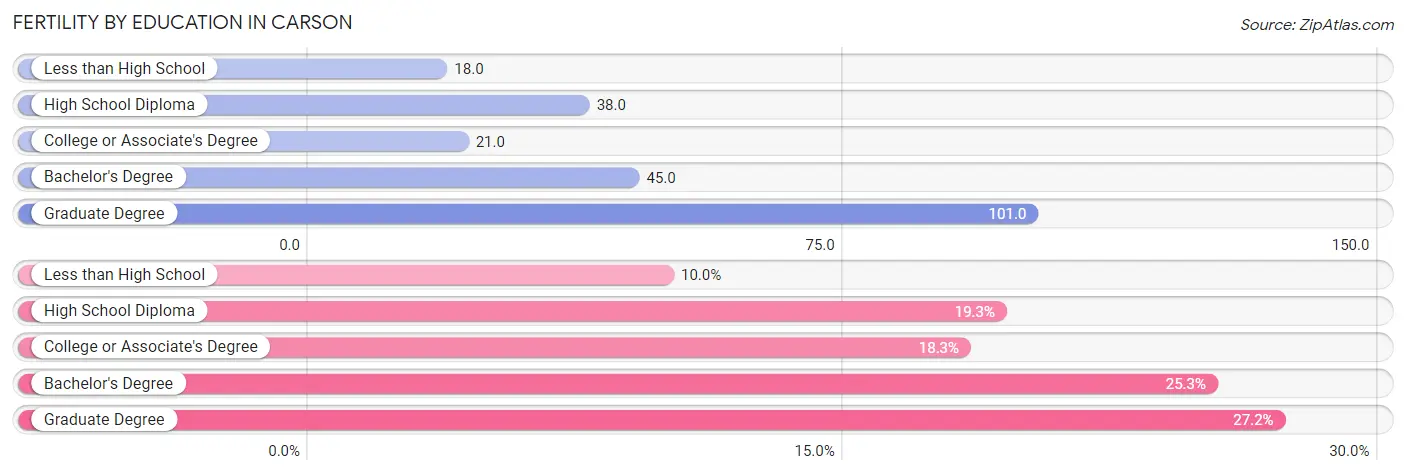
| Educational Attainment | Women with Births | Births / 1,000 Women |
| Less than High School | 79 (10.0%) | 18.0 |
| High School Diploma | 153 (19.3%) | 38.0 |
| College or Associate's Degree | 145 (18.3%) | 21.0 |
| Bachelor's Degree | 200 (25.3%) | 45.0 |
| Graduate Degree | 215 (27.2%) | 101.0 |
| Total | 792 (100.0%) | 36.0 |
Fertility by Education by Marriage Status in Carson
21.1% of women with births in Carson are unmarried. Women with the educational attainment of bachelor's degree are most likely to be married with 99.0% of them married at childbirth, while women with the educational attainment of high school diploma are least likely to be married with 47.7% of them unmarried at childbirth.
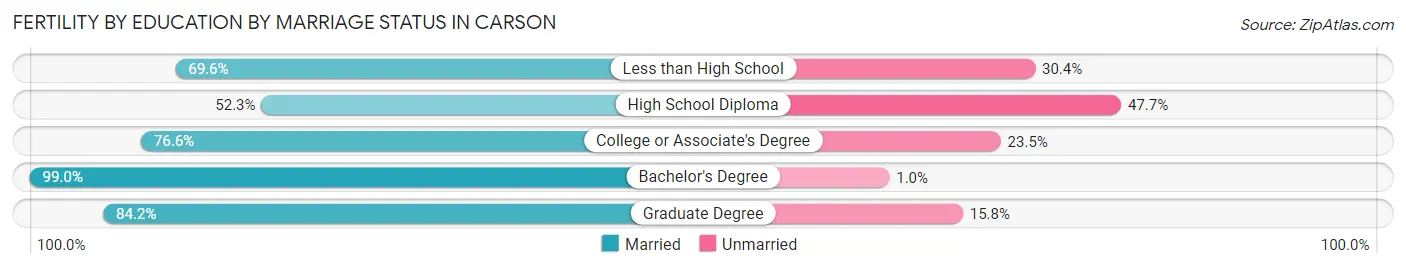
| Educational Attainment | Married | Unmarried |
| Less than High School | 55 (69.6%) | 24 (30.4%) |
| High School Diploma | 80 (52.3%) | 73 (47.7%) |
| College or Associate's Degree | 111 (76.5%) | 34 (23.4%) |
| Bachelor's Degree | 198 (99.0%) | 2 (1.0%) |
| Graduate Degree | 181 (84.2%) | 34 (15.8%) |
| Total | 625 (78.9%) | 167 (21.1%) |
Employment Characteristics in Carson
Employment by Class of Employer in Carson
Among the 43,927 employed individuals in Carson, private company employees (29,364 | 66.8%), local government employees (5,012 | 11.4%), and not-for-profit organizations (3,363 | 7.7%) make up the most common classes of employment.
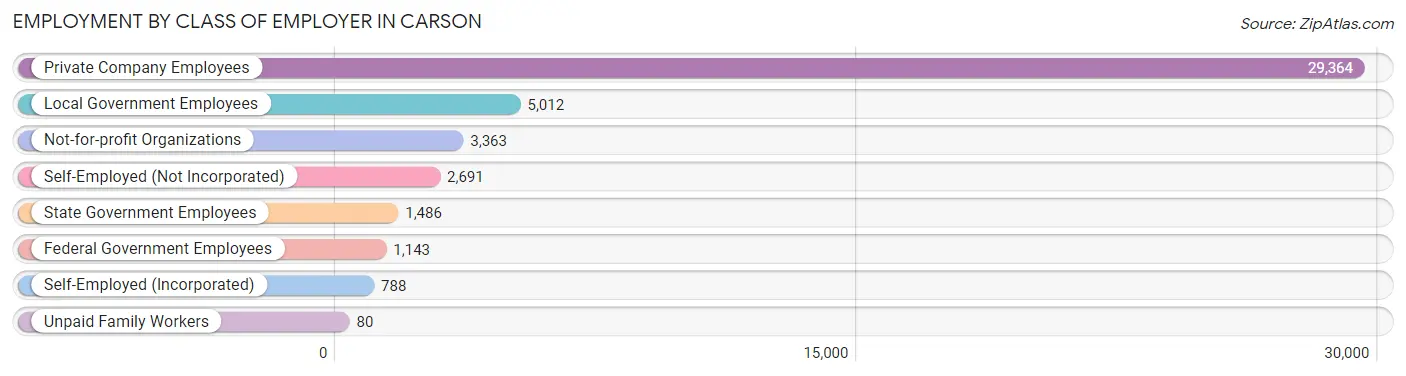
| Employer Class | # Employees | % Employees |
| Private Company Employees | 29,364 | 66.8% |
| Self-Employed (Incorporated) | 788 | 1.8% |
| Self-Employed (Not Incorporated) | 2,691 | 6.1% |
| Not-for-profit Organizations | 3,363 | 7.7% |
| Local Government Employees | 5,012 | 11.4% |
| State Government Employees | 1,486 | 3.4% |
| Federal Government Employees | 1,143 | 2.6% |
| Unpaid Family Workers | 80 | 0.2% |
| Total | 43,927 | 100.0% |
Employment Status by Age in Carson
According to the labor force statistics for Carson, out of the total population over 16 years of age (78,811), 61.9% or 48,784 individuals are in the labor force, with 6.9% or 3,366 of them unemployed. The age group with the highest labor force participation rate is 30 to 34 years, with 84.8% or 5,611 individuals in the labor force. Within the labor force, the 16 to 19 years age range has the highest percentage of unemployed individuals, with 18.0% or 248 of them being unemployed.
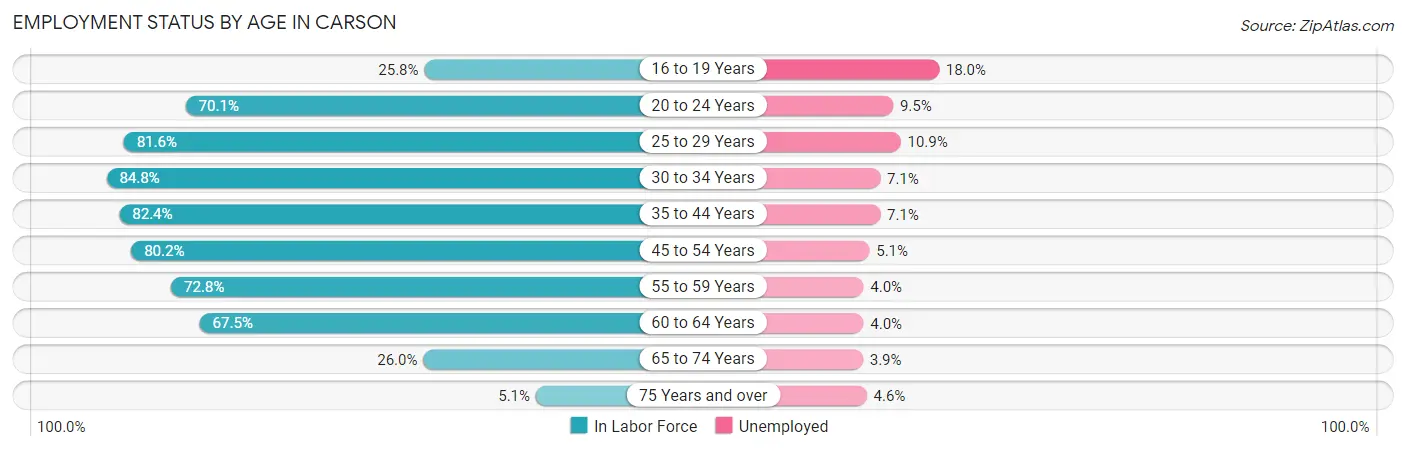
| Age Bracket | In Labor Force | Unemployed |
| 16 to 19 Years | 1,377 (25.8%) | 248 (18.0%) |
| 20 to 24 Years | 4,232 (70.1%) | 402 (9.5%) |
| 25 to 29 Years | 5,554 (81.6%) | 605 (10.9%) |
| 30 to 34 Years | 5,611 (84.8%) | 398 (7.1%) |
| 35 to 44 Years | 9,718 (82.4%) | 690 (7.1%) |
| 45 to 54 Years | 9,876 (80.2%) | 504 (5.1%) |
| 55 to 59 Years | 4,781 (72.8%) | 191 (4.0%) |
| 60 to 64 Years | 4,787 (67.5%) | 191 (4.0%) |
| 65 to 74 Years | 2,471 (26.0%) | 96 (3.9%) |
| 75 Years and over | 344 (5.1%) | 16 (4.6%) |
| Total | 48,784 (61.9%) | 3,366 (6.9%) |
Employment Status by Educational Attainment in Carson
According to labor force statistics for Carson, 78.8% of individuals (40,338) out of the total population between 25 and 64 years of age (51,190) are in the labor force, with 6.4% or 2,582 of them being unemployed. The group with the highest labor force participation rate are those with the educational attainment of bachelor's degree or higher, with 89.5% or 13,947 individuals in the labor force. Within the labor force, individuals with less than high school education have the highest percentage of unemployment, with 7.9% or 440 of them being unemployed.
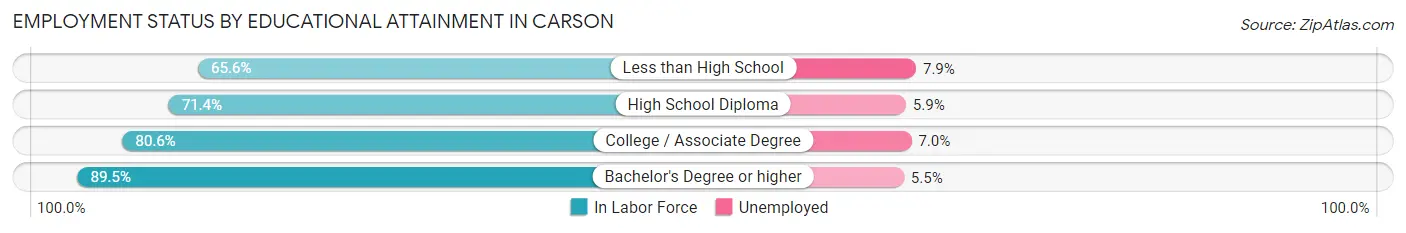
| Educational Attainment | In Labor Force | Unemployed |
| Less than High School | 5,573 (65.6%) | 671 (7.9%) |
| High School Diploma | 8,016 (71.4%) | 662 (5.9%) |
| College / Associate Degree | 12,803 (80.6%) | 1,112 (7.0%) |
| Bachelor's Degree or higher | 13,947 (89.5%) | 857 (5.5%) |
| Total | 40,338 (78.8%) | 3,276 (6.4%) |
Employment Occupations by Sex in Carson
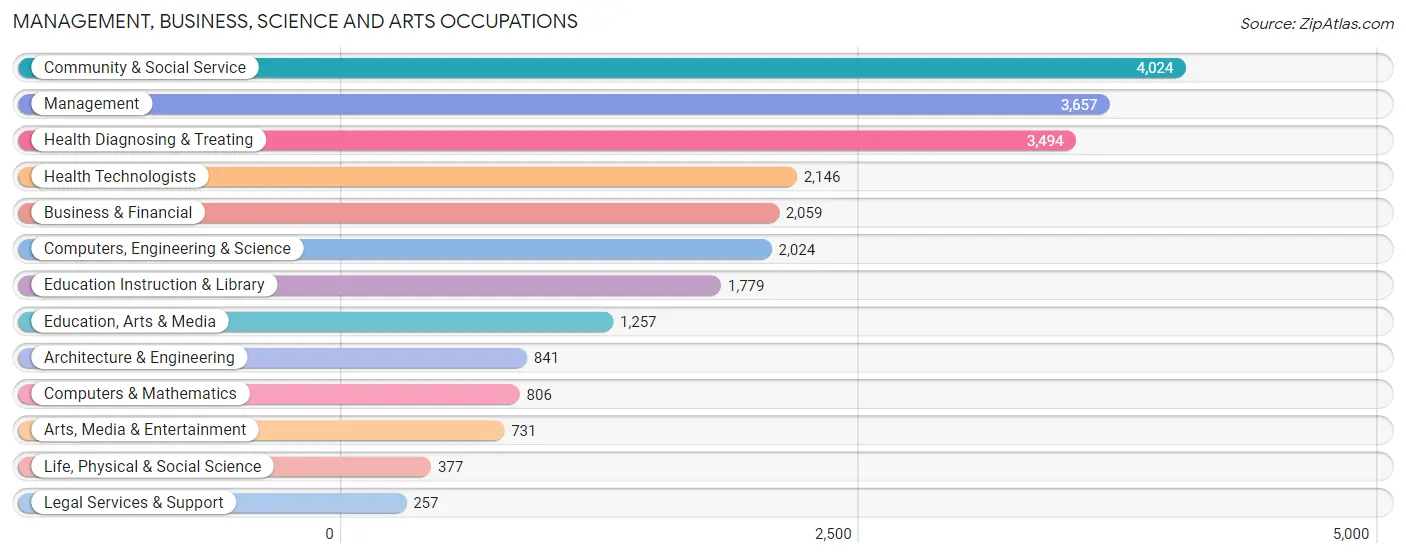
Management, Business, Science and Arts Occupations
The most common Management, Business, Science and Arts occupations in Carson are Community & Social Service (4,024 | 8.9%), Management (3,657 | 8.1%), Health Diagnosing & Treating (3,494 | 7.7%), Health Technologists (2,146 | 4.7%), and Business & Financial (2,059 | 4.5%).
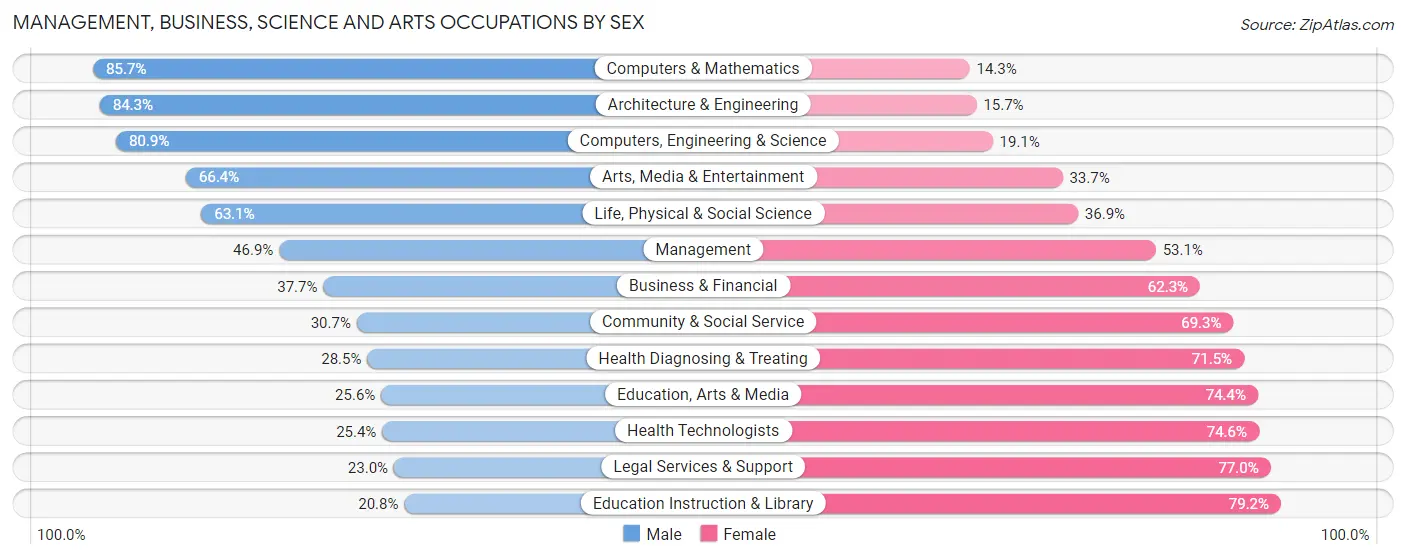
Management, Business, Science and Arts Occupations by Sex
Within the Management, Business, Science and Arts occupations in Carson, the most male-oriented occupations are Computers & Mathematics (85.7%), Architecture & Engineering (84.3%), and Computers, Engineering & Science (80.9%), while the most female-oriented occupations are Education Instruction & Library (79.2%), Legal Services & Support (77.0%), and Health Technologists (74.6%).
| Occupation | Male | Female |
| Management | 1,715 (46.9%) | 1,942 (53.1%) |
| Business & Financial | 776 (37.7%) | 1,283 (62.3%) |
| Computers, Engineering & Science | 1,638 (80.9%) | 386 (19.1%) |
| Computers & Mathematics | 691 (85.7%) | 115 (14.3%) |
| Architecture & Engineering | 709 (84.3%) | 132 (15.7%) |
| Life, Physical & Social Science | 238 (63.1%) | 139 (36.9%) |
| Community & Social Service | 1,236 (30.7%) | 2,788 (69.3%) |
| Education, Arts & Media | 322 (25.6%) | 935 (74.4%) |
| Legal Services & Support | 59 (23.0%) | 198 (77.0%) |
| Education Instruction & Library | 370 (20.8%) | 1,409 (79.2%) |
| Arts, Media & Entertainment | 485 (66.3%) | 246 (33.7%) |
| Health Diagnosing & Treating | 996 (28.5%) | 2,498 (71.5%) |
| Health Technologists | 545 (25.4%) | 1,601 (74.6%) |
| Total (Category) | 6,361 (41.7%) | 8,897 (58.3%) |
| Total (Overall) | 23,104 (50.9%) | 22,259 (49.1%) |
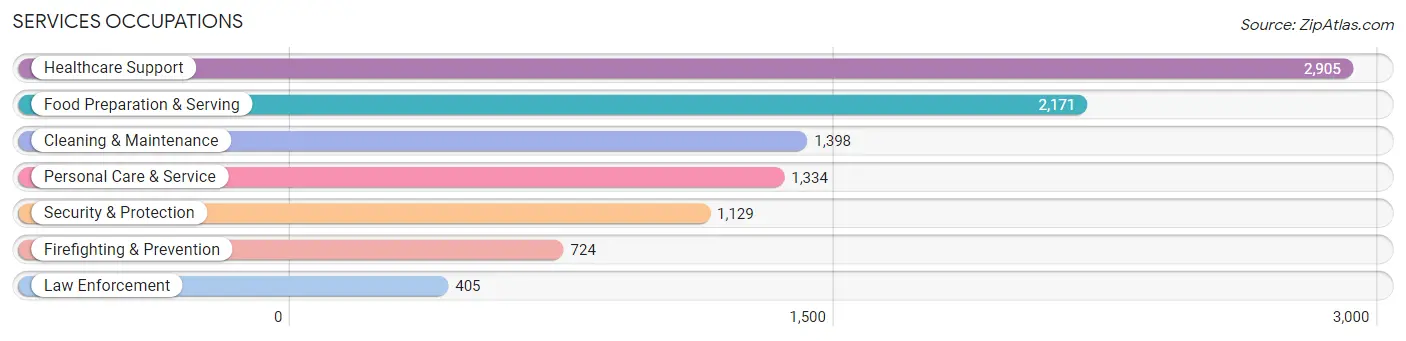
Services Occupations
The most common Services occupations in Carson are Healthcare Support (2,905 | 6.4%), Food Preparation & Serving (2,171 | 4.8%), Cleaning & Maintenance (1,398 | 3.1%), Personal Care & Service (1,334 | 2.9%), and Security & Protection (1,129 | 2.5%).
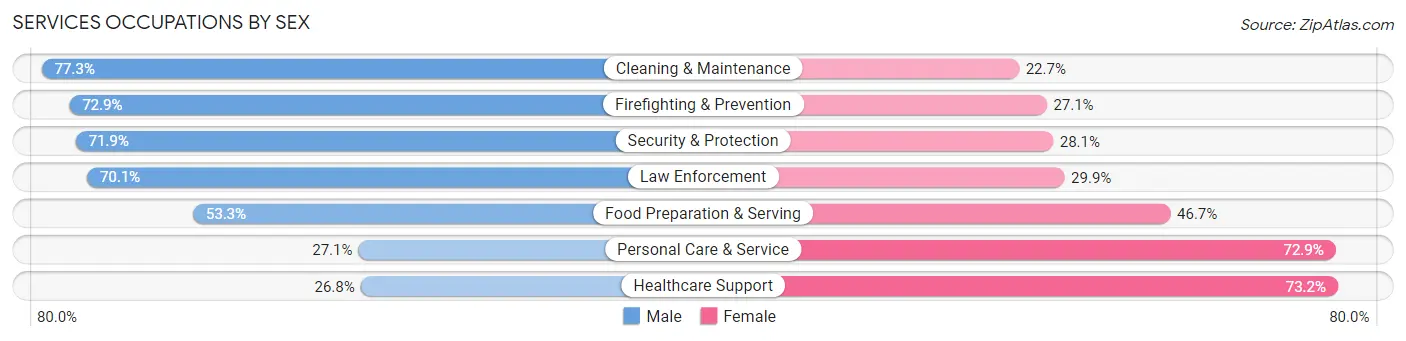
Services Occupations by Sex
Within the Services occupations in Carson, the most male-oriented occupations are Cleaning & Maintenance (77.3%), Firefighting & Prevention (72.9%), and Security & Protection (71.9%), while the most female-oriented occupations are Healthcare Support (73.2%), Personal Care & Service (72.9%), and Food Preparation & Serving (46.7%).
| Occupation | Male | Female |
| Healthcare Support | 778 (26.8%) | 2,127 (73.2%) |
| Security & Protection | 812 (71.9%) | 317 (28.1%) |
| Firefighting & Prevention | 528 (72.9%) | 196 (27.1%) |
| Law Enforcement | 284 (70.1%) | 121 (29.9%) |
| Food Preparation & Serving | 1,158 (53.3%) | 1,013 (46.7%) |
| Cleaning & Maintenance | 1,081 (77.3%) | 317 (22.7%) |
| Personal Care & Service | 362 (27.1%) | 972 (72.9%) |
| Total (Category) | 4,191 (46.9%) | 4,746 (53.1%) |
| Total (Overall) | 23,104 (50.9%) | 22,259 (49.1%) |
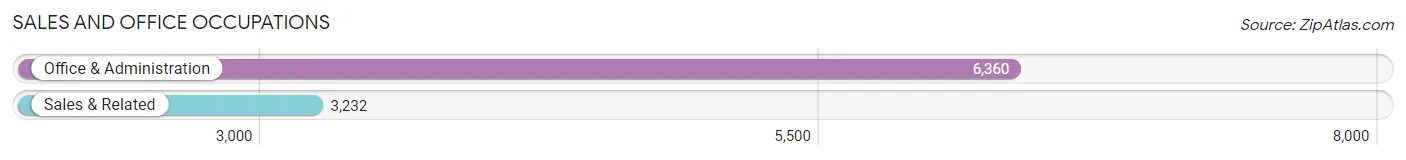
Sales and Office Occupations
The most common Sales and Office occupations in Carson are Office & Administration (6,360 | 14.0%), and Sales & Related (3,232 | 7.1%).
Sales and Office Occupations by Sex
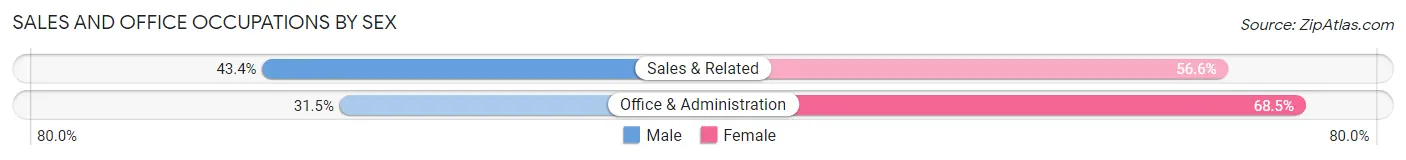
| Occupation | Male | Female |
| Sales & Related | 1,403 (43.4%) | 1,829 (56.6%) |
| Office & Administration | 2,004 (31.5%) | 4,356 (68.5%) |
| Total (Category) | 3,407 (35.5%) | 6,185 (64.5%) |
| Total (Overall) | 23,104 (50.9%) | 22,259 (49.1%) |
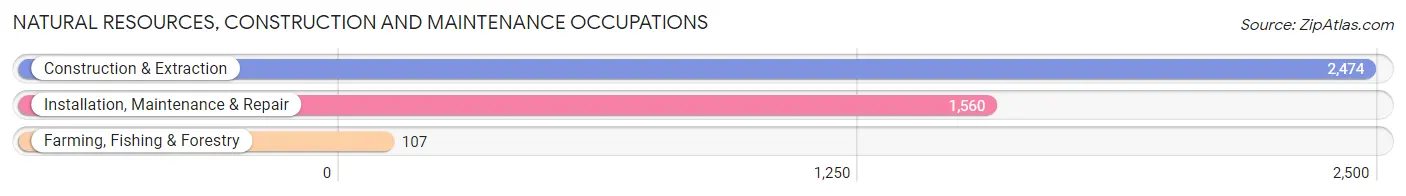
Natural Resources, Construction and Maintenance Occupations
The most common Natural Resources, Construction and Maintenance occupations in Carson are Construction & Extraction (2,474 | 5.4%), Installation, Maintenance & Repair (1,560 | 3.4%), and Farming, Fishing & Forestry (107 | 0.2%).
Natural Resources, Construction and Maintenance Occupations by Sex
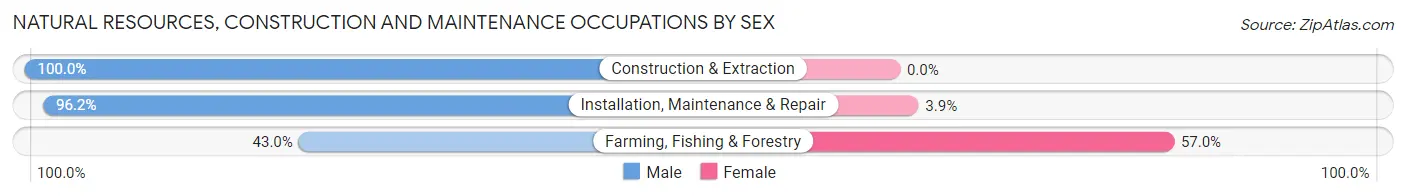
| Occupation | Male | Female |
| Farming, Fishing & Forestry | 46 (43.0%) | 61 (57.0%) |
| Construction & Extraction | 2,474 (100.0%) | 0 (0.0%) |
| Installation, Maintenance & Repair | 1,500 (96.2%) | 60 (3.8%) |
| Total (Category) | 4,020 (97.1%) | 121 (2.9%) |
| Total (Overall) | 23,104 (50.9%) | 22,259 (49.1%) |
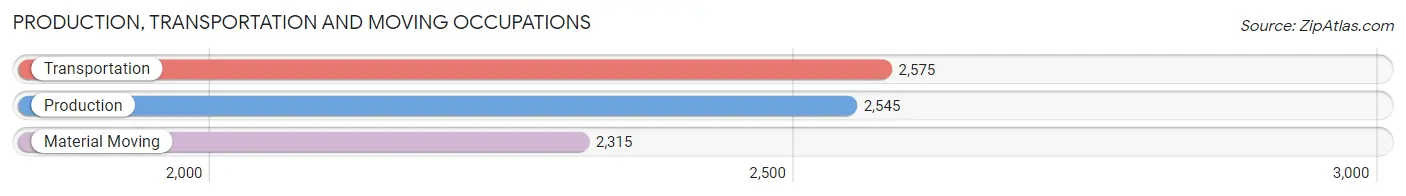
Production, Transportation and Moving Occupations
The most common Production, Transportation and Moving occupations in Carson are Transportation (2,575 | 5.7%), Production (2,545 | 5.6%), and Material Moving (2,315 | 5.1%).
Production, Transportation and Moving Occupations by Sex
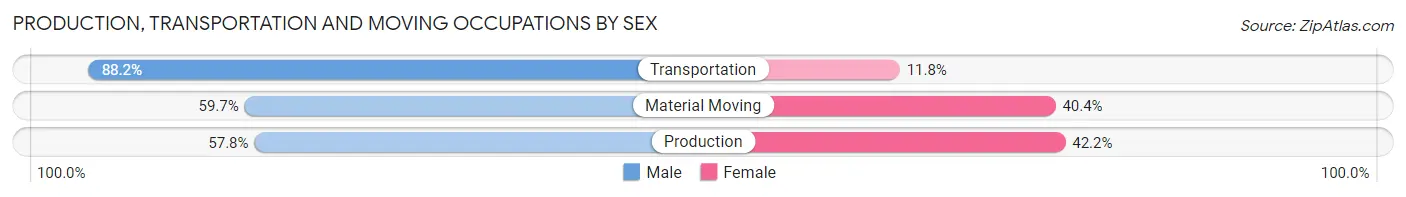
| Occupation | Male | Female |
| Production | 1,472 (57.8%) | 1,073 (42.2%) |
| Transportation | 2,272 (88.2%) | 303 (11.8%) |
| Material Moving | 1,381 (59.7%) | 934 (40.4%) |
| Total (Category) | 5,125 (68.9%) | 2,310 (31.1%) |
| Total (Overall) | 23,104 (50.9%) | 22,259 (49.1%) |
Employment Industries by Sex in Carson
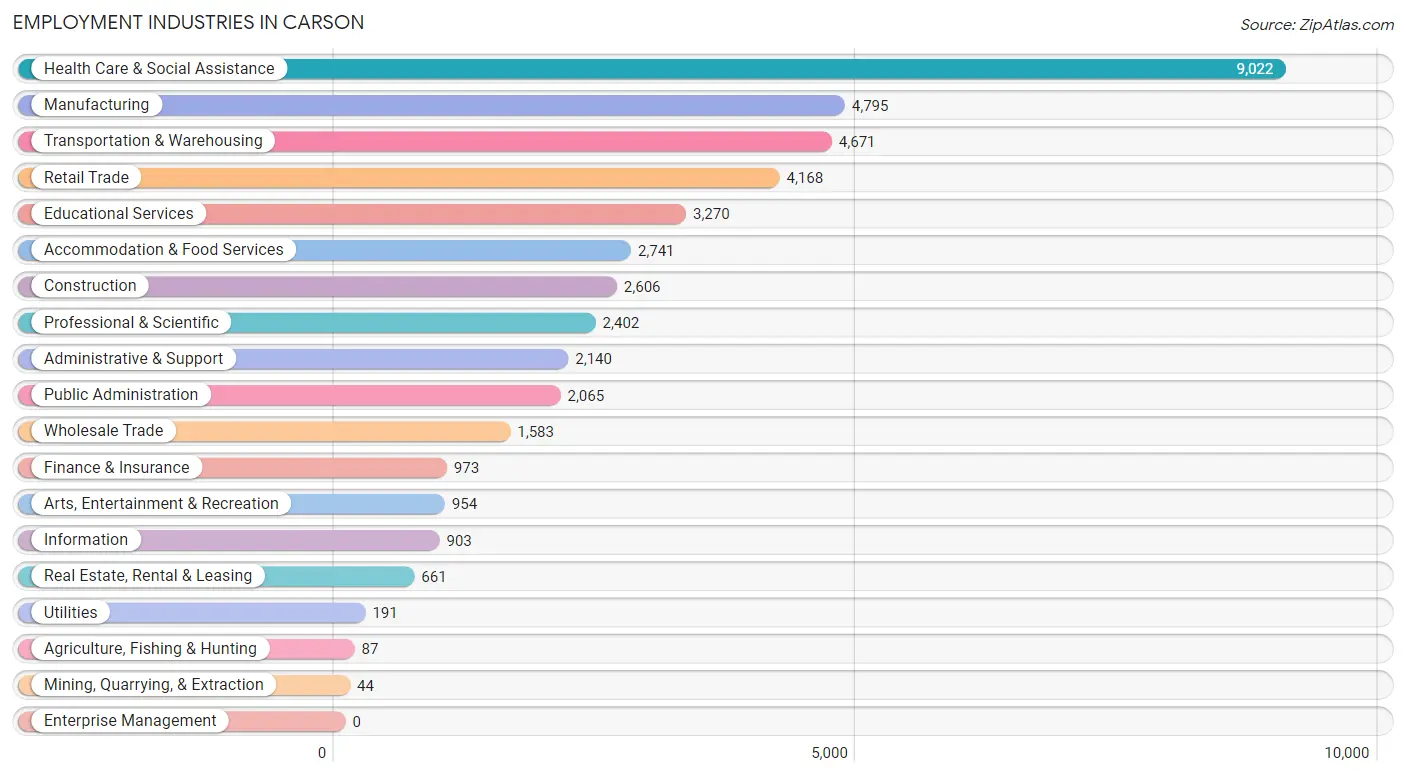
Employment Industries in Carson
The major employment industries in Carson include Health Care & Social Assistance (9,022 | 19.9%), Manufacturing (4,795 | 10.6%), Transportation & Warehousing (4,671 | 10.3%), Retail Trade (4,168 | 9.2%), and Educational Services (3,270 | 7.2%).
Employment Industries by Sex in Carson
The Carson industries that see more men than women are Mining, Quarrying, & Extraction (100.0%), Construction (94.2%), and Utilities (83.3%), whereas the industries that tend to have a higher number of women are Health Care & Social Assistance (71.4%), Finance & Insurance (70.7%), and Educational Services (70.0%).
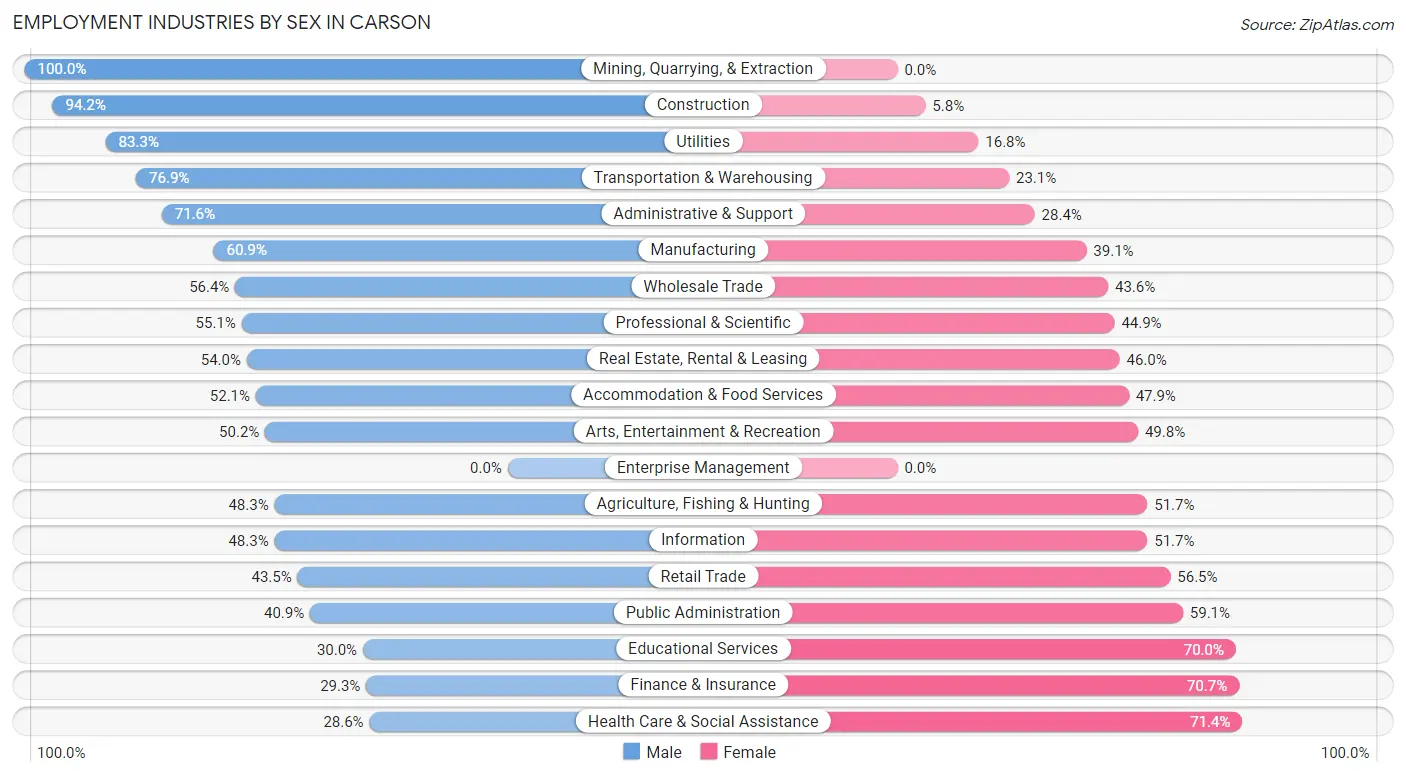
| Industry | Male | Female |
| Agriculture, Fishing & Hunting | 42 (48.3%) | 45 (51.7%) |
| Mining, Quarrying, & Extraction | 44 (100.0%) | 0 (0.0%) |
| Construction | 2,455 (94.2%) | 151 (5.8%) |
| Manufacturing | 2,919 (60.9%) | 1,876 (39.1%) |
| Wholesale Trade | 893 (56.4%) | 690 (43.6%) |
| Retail Trade | 1,813 (43.5%) | 2,355 (56.5%) |
| Transportation & Warehousing | 3,592 (76.9%) | 1,079 (23.1%) |
| Utilities | 159 (83.3%) | 32 (16.8%) |
| Information | 436 (48.3%) | 467 (51.7%) |
| Finance & Insurance | 285 (29.3%) | 688 (70.7%) |
| Real Estate, Rental & Leasing | 357 (54.0%) | 304 (46.0%) |
| Professional & Scientific | 1,323 (55.1%) | 1,079 (44.9%) |
| Enterprise Management | 0 (0.0%) | 0 (0.0%) |
| Administrative & Support | 1,532 (71.6%) | 608 (28.4%) |
| Educational Services | 980 (30.0%) | 2,290 (70.0%) |
| Health Care & Social Assistance | 2,582 (28.6%) | 6,440 (71.4%) |
| Arts, Entertainment & Recreation | 479 (50.2%) | 475 (49.8%) |
| Accommodation & Food Services | 1,429 (52.1%) | 1,312 (47.9%) |
| Public Administration | 845 (40.9%) | 1,220 (59.1%) |
| Total | 23,104 (50.9%) | 22,259 (49.1%) |
Education in Carson
School Enrollment in Carson
The most common levels of schooling among the 22,885 students in Carson are college / undergraduate (6,442 | 28.1%), high school (5,254 | 23.0%), and middle school (4,620 | 20.2%).
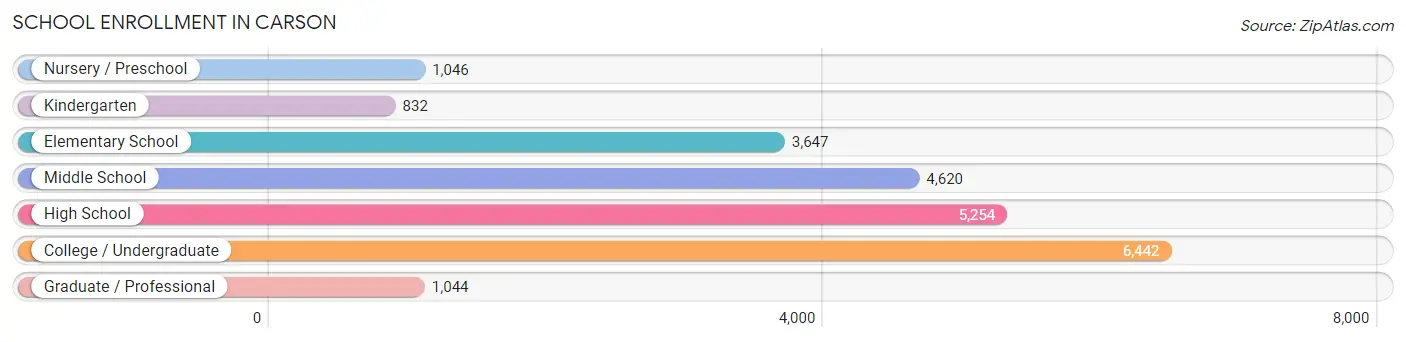
| School Level | # Students | % Students |
| Nursery / Preschool | 1,046 | 4.6% |
| Kindergarten | 832 | 3.6% |
| Elementary School | 3,647 | 15.9% |
| Middle School | 4,620 | 20.2% |
| High School | 5,254 | 23.0% |
| College / Undergraduate | 6,442 | 28.1% |
| Graduate / Professional | 1,044 | 4.6% |
| Total | 22,885 | 100.0% |
School Enrollment by Age by Funding Source in Carson
Out of a total of 22,885 students who are enrolled in schools in Carson, 2,769 (12.1%) attend a private institution, while the remaining 20,116 (87.9%) are enrolled in public schools. The age group of 3 to 4 year olds has the highest likelihood of being enrolled in private schools, with 362 (46.2% in the age bracket) enrolled. Conversely, the age group of 15 to 17 year olds has the lowest likelihood of being enrolled in a private school, with 3,554 (93.7% in the age bracket) attending a public institution.
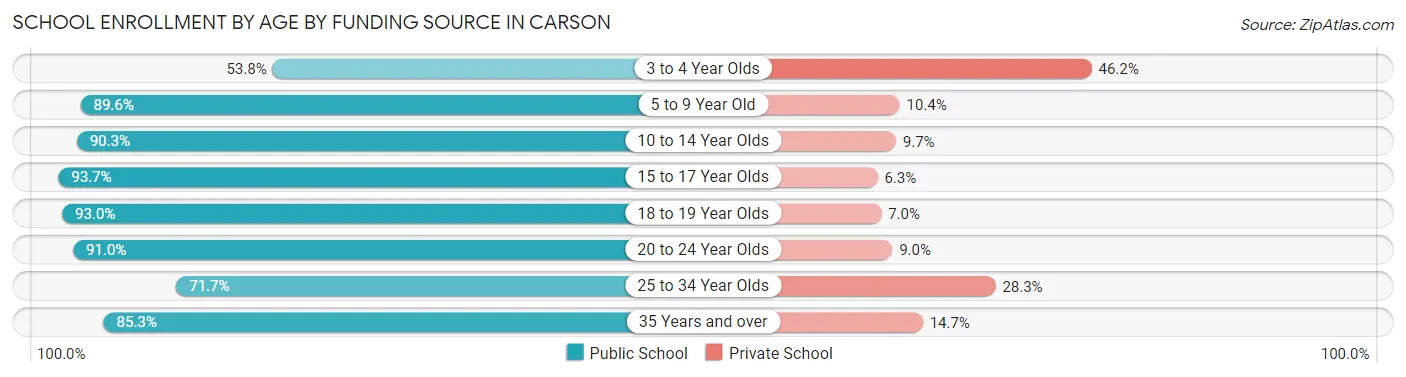
| Age Bracket | Public School | Private School |
| 3 to 4 Year Olds | 422 (53.8%) | 362 (46.2%) |
| 5 to 9 Year Old | 3,979 (89.6%) | 463 (10.4%) |
| 10 to 14 Year Olds | 5,163 (90.3%) | 556 (9.7%) |
| 15 to 17 Year Olds | 3,554 (93.7%) | 239 (6.3%) |
| 18 to 19 Year Olds | 1,877 (93.0%) | 141 (7.0%) |
| 20 to 24 Year Olds | 2,555 (91.0%) | 254 (9.0%) |
| 25 to 34 Year Olds | 1,446 (71.7%) | 570 (28.3%) |
| 35 Years and over | 1,112 (85.3%) | 192 (14.7%) |
| Total | 20,116 (87.9%) | 2,769 (12.1%) |
Educational Attainment by Field of Study in Carson
Business (4,893 | 23.8%), science & technology (2,965 | 14.4%), arts & humanities (1,939 | 9.4%), engineering (1,824 | 8.9%), and education (1,813 | 8.8%) are the most common fields of study among 20,570 individuals in Carson who have obtained a bachelor's degree or higher.
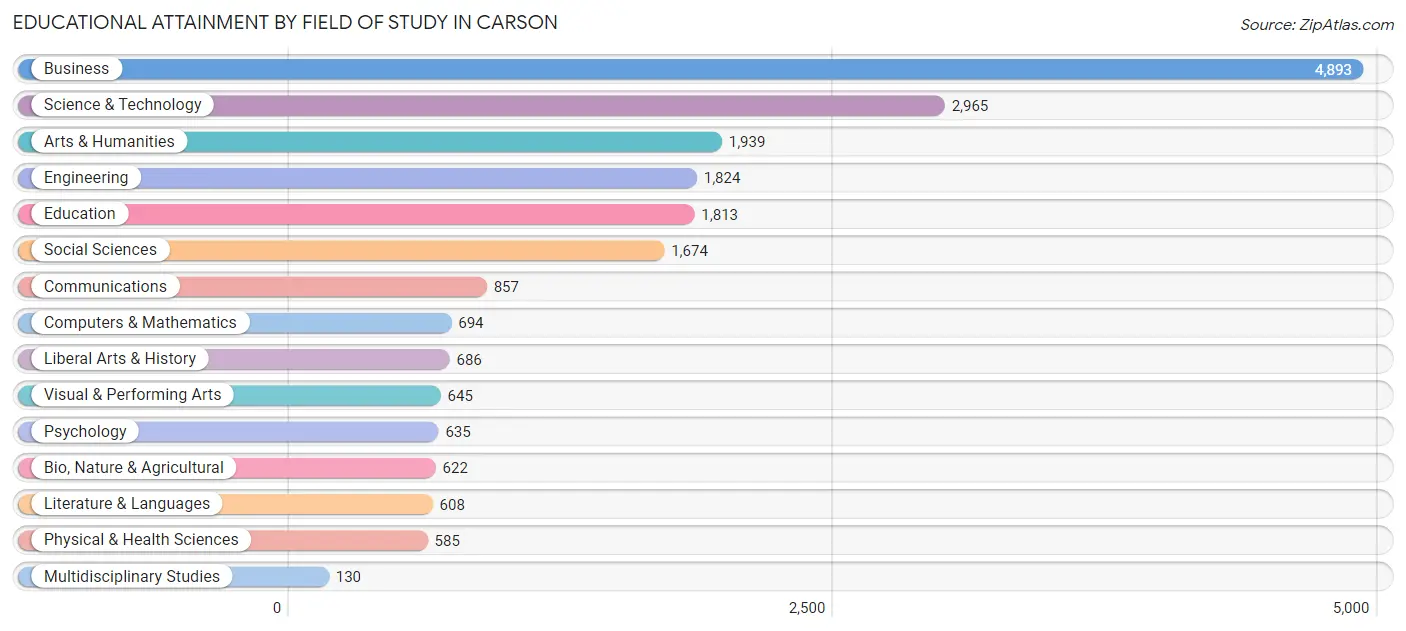
| Field of Study | # Graduates | % Graduates |
| Computers & Mathematics | 694 | 3.4% |
| Bio, Nature & Agricultural | 622 | 3.0% |
| Physical & Health Sciences | 585 | 2.8% |
| Psychology | 635 | 3.1% |
| Social Sciences | 1,674 | 8.1% |
| Engineering | 1,824 | 8.9% |
| Multidisciplinary Studies | 130 | 0.6% |
| Science & Technology | 2,965 | 14.4% |
| Business | 4,893 | 23.8% |
| Education | 1,813 | 8.8% |
| Literature & Languages | 608 | 3.0% |
| Liberal Arts & History | 686 | 3.3% |
| Visual & Performing Arts | 645 | 3.1% |
| Communications | 857 | 4.2% |
| Arts & Humanities | 1,939 | 9.4% |
| Total | 20,570 | 100.0% |
Transportation & Commute in Carson
Vehicle Availability by Sex in Carson
The most prevalent vehicle ownership categories in Carson are males with 3 vehicles (6,812, accounting for 30.5%) and females with 3 vehicles (6,399, making up 31.9%).
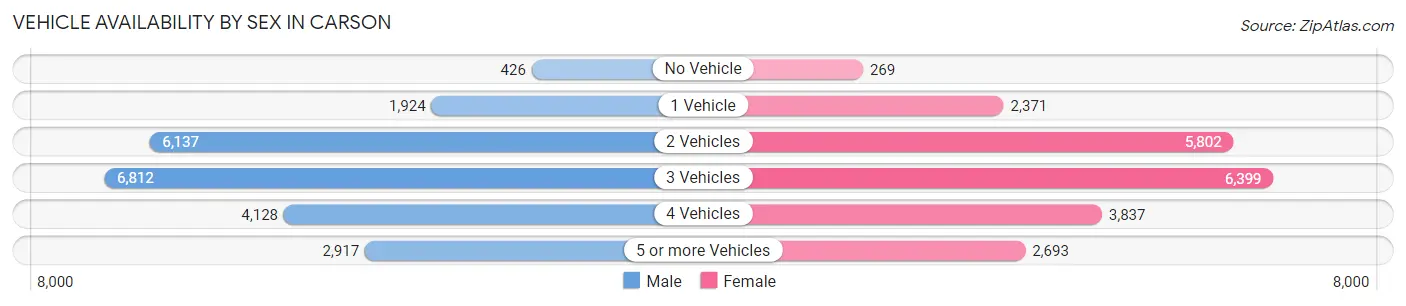
| Vehicles Available | Male | Female |
| No Vehicle | 426 (1.9%) | 269 (1.3%) |
| 1 Vehicle | 1,924 (8.6%) | 2,371 (11.1%) |
| 2 Vehicles | 6,137 (27.5%) | 5,802 (27.2%) |
| 3 Vehicles | 6,812 (30.5%) | 6,399 (29.9%) |
| 4 Vehicles | 4,128 (18.5%) | 3,837 (17.9%) |
| 5 or more Vehicles | 2,917 (13.1%) | 2,693 (12.6%) |
| Total | 22,344 (100.0%) | 21,371 (100.0%) |
Commute Time in Carson
The most frequently occuring commute durations in Carson are 15 to 19 minutes (6,753 commuters, 16.5%), 20 to 24 minutes (6,193 commuters, 15.1%), and 30 to 34 minutes (5,794 commuters, 14.1%).
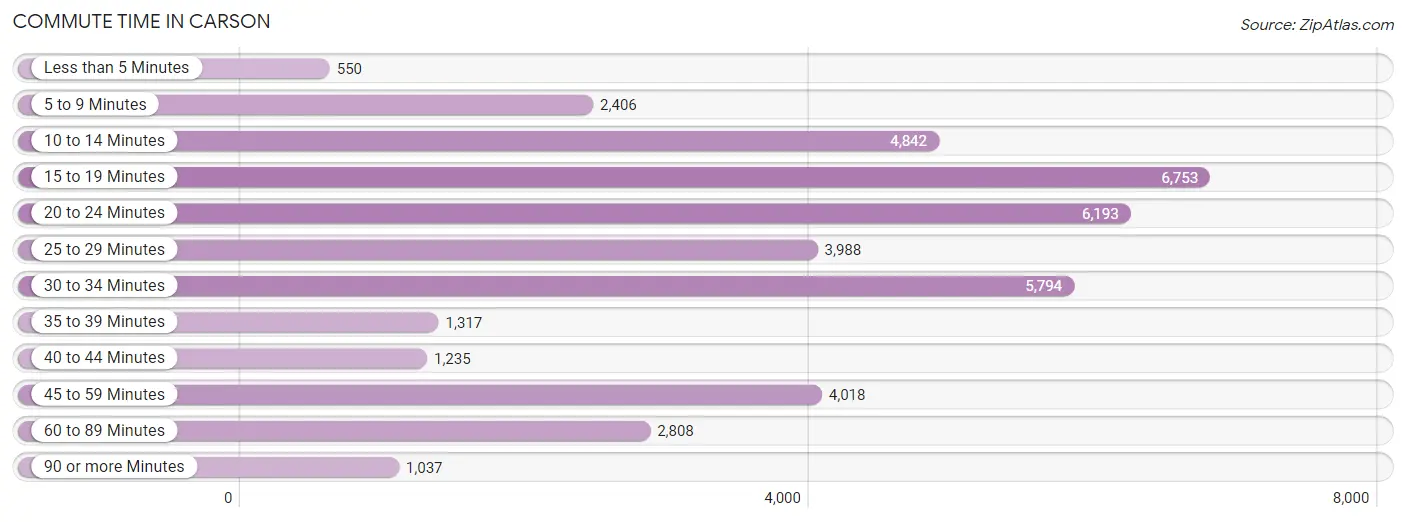
| Commute Time | # Commuters | % Commuters |
| Less than 5 Minutes | 550 | 1.3% |
| 5 to 9 Minutes | 2,406 | 5.9% |
| 10 to 14 Minutes | 4,842 | 11.8% |
| 15 to 19 Minutes | 6,753 | 16.5% |
| 20 to 24 Minutes | 6,193 | 15.1% |
| 25 to 29 Minutes | 3,988 | 9.7% |
| 30 to 34 Minutes | 5,794 | 14.1% |
| 35 to 39 Minutes | 1,317 | 3.2% |
| 40 to 44 Minutes | 1,235 | 3.0% |
| 45 to 59 Minutes | 4,018 | 9.8% |
| 60 to 89 Minutes | 2,808 | 6.9% |
| 90 or more Minutes | 1,037 | 2.5% |
Commute Time by Sex in Carson
The most common commute times in Carson are 15 to 19 minutes (3,442 commuters, 16.1%) for males and 20 to 24 minutes (3,463 commuters, 17.7%) for females.
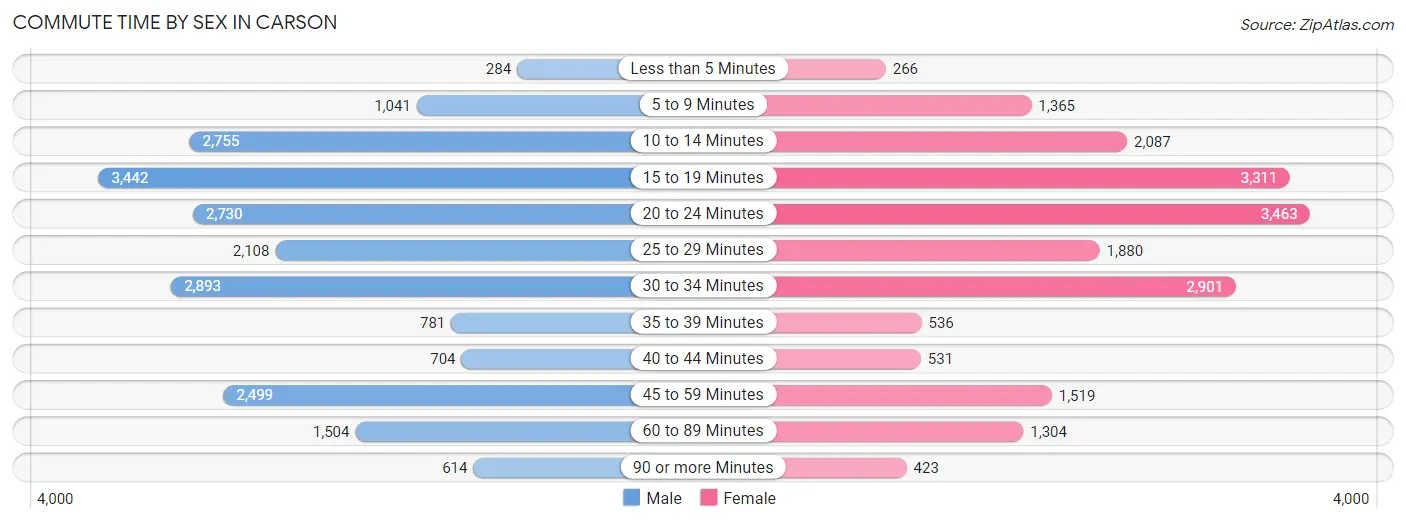
| Commute Time | Male | Female |
| Less than 5 Minutes | 284 (1.3%) | 266 (1.4%) |
| 5 to 9 Minutes | 1,041 (4.9%) | 1,365 (7.0%) |
| 10 to 14 Minutes | 2,755 (12.9%) | 2,087 (10.7%) |
| 15 to 19 Minutes | 3,442 (16.1%) | 3,311 (16.9%) |
| 20 to 24 Minutes | 2,730 (12.8%) | 3,463 (17.7%) |
| 25 to 29 Minutes | 2,108 (9.9%) | 1,880 (9.6%) |
| 30 to 34 Minutes | 2,893 (13.6%) | 2,901 (14.8%) |
| 35 to 39 Minutes | 781 (3.7%) | 536 (2.7%) |
| 40 to 44 Minutes | 704 (3.3%) | 531 (2.7%) |
| 45 to 59 Minutes | 2,499 (11.7%) | 1,519 (7.8%) |
| 60 to 89 Minutes | 1,504 (7.0%) | 1,304 (6.7%) |
| 90 or more Minutes | 614 (2.9%) | 423 (2.2%) |
Time of Departure to Work by Sex in Carson
The most frequent times of departure to work in Carson are 6:00 AM to 6:29 AM (2,914, 13.7%) for males and 7:00 AM to 7:29 AM (3,132, 16.0%) for females.
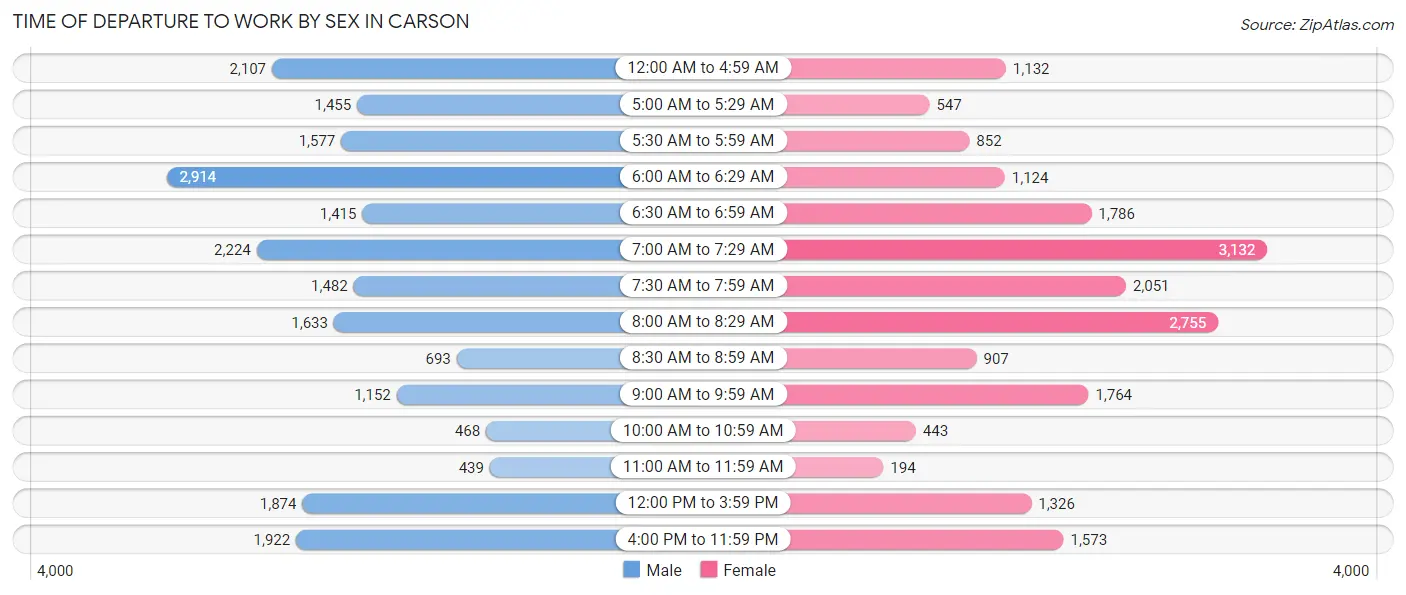
| Time of Departure | Male | Female |
| 12:00 AM to 4:59 AM | 2,107 (9.9%) | 1,132 (5.8%) |
| 5:00 AM to 5:29 AM | 1,455 (6.8%) | 547 (2.8%) |
| 5:30 AM to 5:59 AM | 1,577 (7.4%) | 852 (4.3%) |
| 6:00 AM to 6:29 AM | 2,914 (13.7%) | 1,124 (5.7%) |
| 6:30 AM to 6:59 AM | 1,415 (6.6%) | 1,786 (9.1%) |
| 7:00 AM to 7:29 AM | 2,224 (10.4%) | 3,132 (16.0%) |
| 7:30 AM to 7:59 AM | 1,482 (6.9%) | 2,051 (10.5%) |
| 8:00 AM to 8:29 AM | 1,633 (7.6%) | 2,755 (14.1%) |
| 8:30 AM to 8:59 AM | 693 (3.3%) | 907 (4.6%) |
| 9:00 AM to 9:59 AM | 1,152 (5.4%) | 1,764 (9.0%) |
| 10:00 AM to 10:59 AM | 468 (2.2%) | 443 (2.3%) |
| 11:00 AM to 11:59 AM | 439 (2.1%) | 194 (1.0%) |
| 12:00 PM to 3:59 PM | 1,874 (8.8%) | 1,326 (6.8%) |
| 4:00 PM to 11:59 PM | 1,922 (9.0%) | 1,573 (8.0%) |
| Total | 21,355 (100.0%) | 19,586 (100.0%) |
Housing Occupancy in Carson
Occupancy by Ownership in Carson
Of the total 26,084 dwellings in Carson, owner-occupied units account for 19,496 (74.7%), while renter-occupied units make up 6,588 (25.3%).
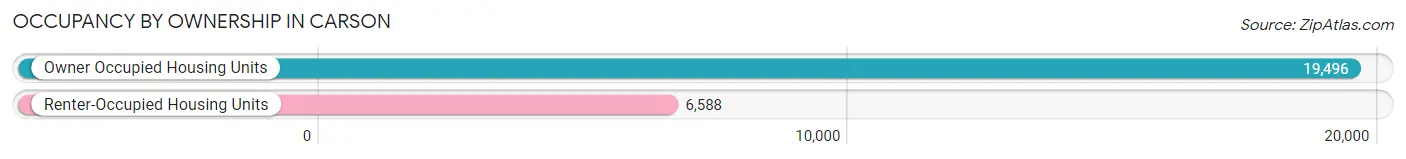
| Occupancy | # Housing Units | % Housing Units |
| Owner Occupied Housing Units | 19,496 | 74.7% |
| Renter-Occupied Housing Units | 6,588 | 25.3% |
| Total Occupied Housing Units | 26,084 | 100.0% |
Occupancy by Household Size in Carson
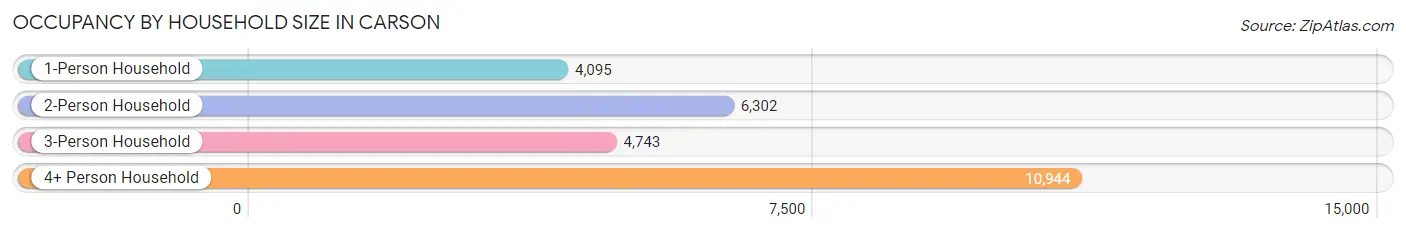
| Household Size | # Housing Units | % Housing Units |
| 1-Person Household | 4,095 | 15.7% |
| 2-Person Household | 6,302 | 24.2% |
| 3-Person Household | 4,743 | 18.2% |
| 4+ Person Household | 10,944 | 42.0% |
| Total Housing Units | 26,084 | 100.0% |
Occupancy by Ownership by Household Size in Carson
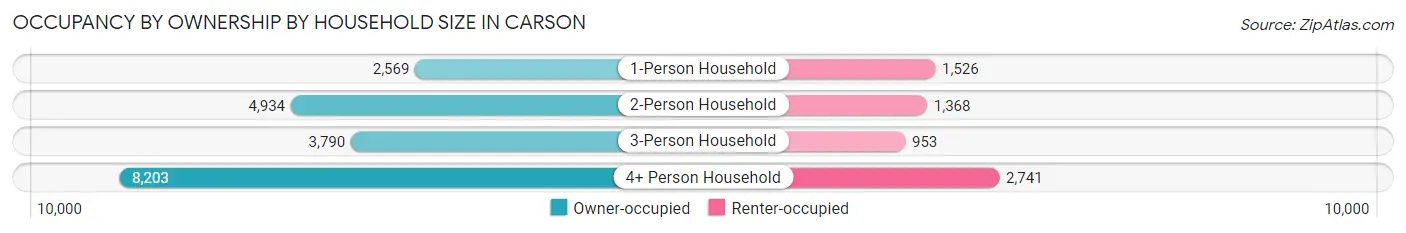
| Household Size | Owner-occupied | Renter-occupied |
| 1-Person Household | 2,569 (62.7%) | 1,526 (37.3%) |
| 2-Person Household | 4,934 (78.3%) | 1,368 (21.7%) |
| 3-Person Household | 3,790 (79.9%) | 953 (20.1%) |
| 4+ Person Household | 8,203 (75.0%) | 2,741 (25.1%) |
| Total Housing Units | 19,496 (74.7%) | 6,588 (25.3%) |
Occupancy by Educational Attainment in Carson
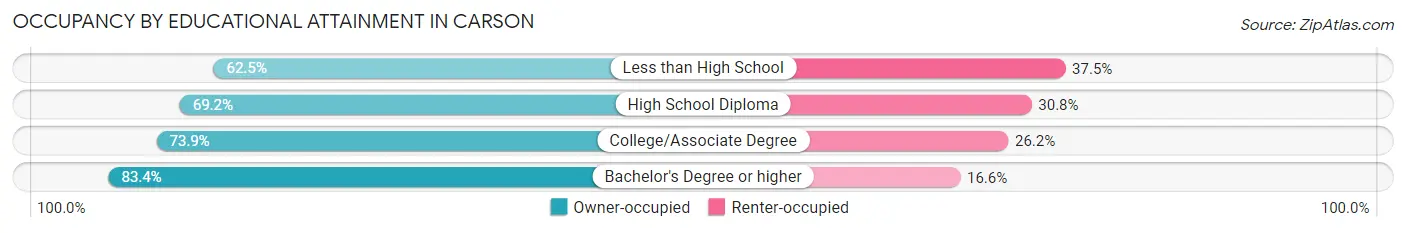
| Household Size | Owner-occupied | Renter-occupied |
| Less than High School | 2,366 (62.5%) | 1,418 (37.5%) |
| High School Diploma | 3,386 (69.2%) | 1,505 (30.8%) |
| College/Associate Degree | 5,972 (73.9%) | 2,115 (26.2%) |
| Bachelor's Degree or higher | 7,772 (83.4%) | 1,550 (16.6%) |
Occupancy by Age of Householder in Carson
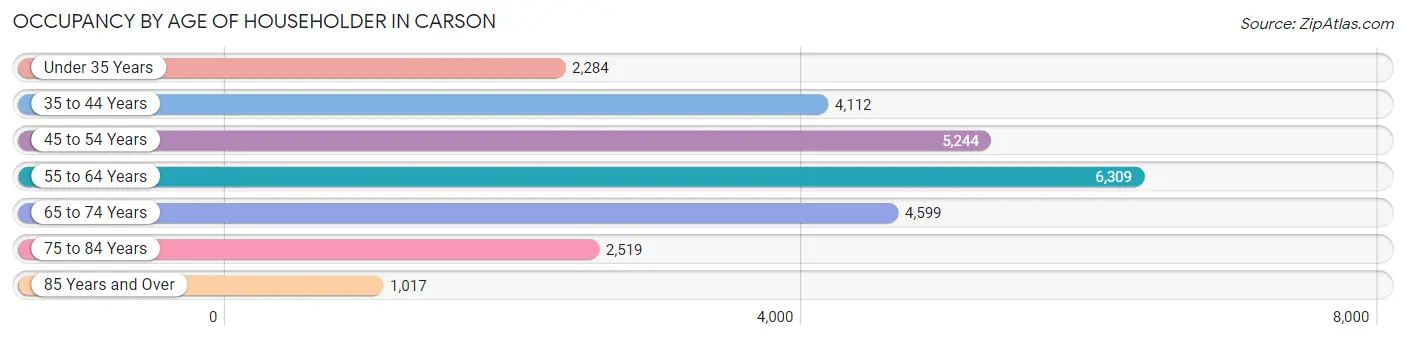
| Age Bracket | # Households | % Households |
| Under 35 Years | 2,284 | 8.8% |
| 35 to 44 Years | 4,112 | 15.8% |
| 45 to 54 Years | 5,244 | 20.1% |
| 55 to 64 Years | 6,309 | 24.2% |
| 65 to 74 Years | 4,599 | 17.6% |
| 75 to 84 Years | 2,519 | 9.7% |
| 85 Years and Over | 1,017 | 3.9% |
| Total | 26,084 | 100.0% |
Housing Finances in Carson
Median Income by Occupancy in Carson
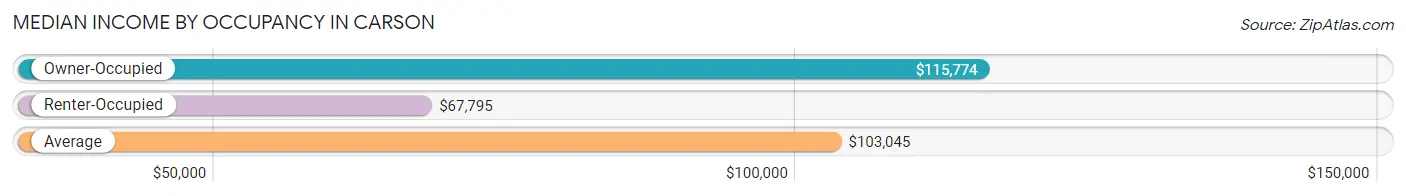
| Occupancy Type | # Households | Median Income |
| Owner-Occupied | 19,496 (74.7%) | $115,774 |
| Renter-Occupied | 6,588 (25.3%) | $67,795 |
| Average | 26,084 (100.0%) | $103,045 |
Occupancy by Householder Income Bracket in Carson
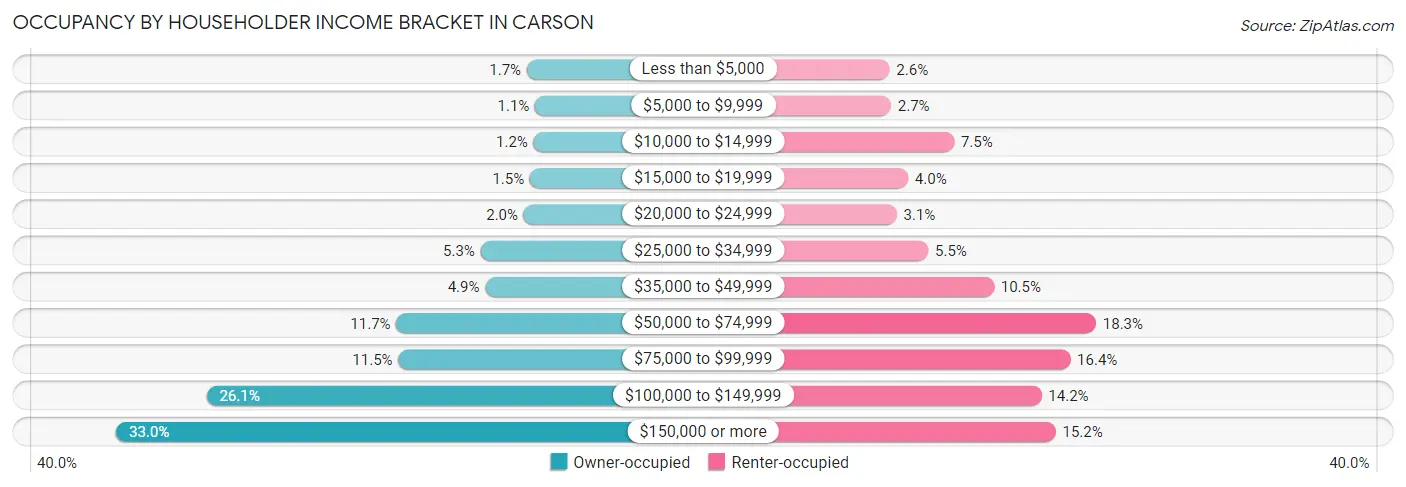
| Income Bracket | Owner-occupied | Renter-occupied |
| Less than $5,000 | 337 (1.7%) | 170 (2.6%) |
| $5,000 to $9,999 | 215 (1.1%) | 177 (2.7%) |
| $10,000 to $14,999 | 236 (1.2%) | 494 (7.5%) |
| $15,000 to $19,999 | 291 (1.5%) | 263 (4.0%) |
| $20,000 to $24,999 | 383 (2.0%) | 206 (3.1%) |
| $25,000 to $34,999 | 1,024 (5.2%) | 364 (5.5%) |
| $35,000 to $49,999 | 955 (4.9%) | 694 (10.5%) |
| $50,000 to $74,999 | 2,275 (11.7%) | 1,206 (18.3%) |
| $75,000 to $99,999 | 2,245 (11.5%) | 1,077 (16.4%) |
| $100,000 to $149,999 | 5,096 (26.1%) | 933 (14.2%) |
| $150,000 or more | 6,439 (33.0%) | 1,004 (15.2%) |
| Total | 19,496 (100.0%) | 6,588 (100.0%) |
Monthly Housing Cost Tiers in Carson
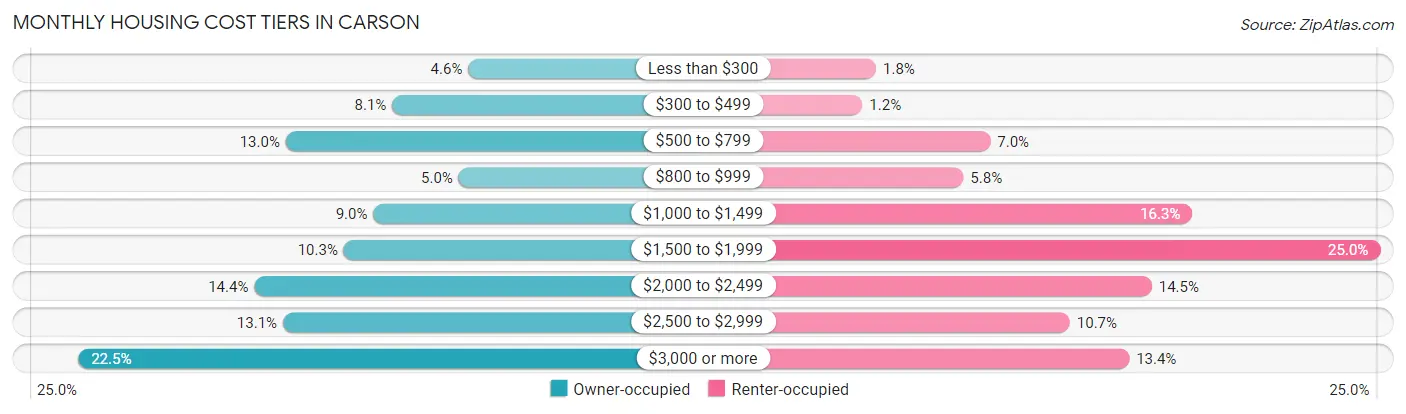
| Monthly Cost | Owner-occupied | Renter-occupied |
| Less than $300 | 893 (4.6%) | 117 (1.8%) |
| $300 to $499 | 1,576 (8.1%) | 76 (1.1%) |
| $500 to $799 | 2,531 (13.0%) | 464 (7.0%) |
| $800 to $999 | 978 (5.0%) | 382 (5.8%) |
| $1,000 to $1,499 | 1,744 (8.9%) | 1,076 (16.3%) |
| $1,500 to $1,999 | 2,011 (10.3%) | 1,646 (25.0%) |
| $2,000 to $2,499 | 2,814 (14.4%) | 953 (14.5%) |
| $2,500 to $2,999 | 2,556 (13.1%) | 705 (10.7%) |
| $3,000 or more | 4,393 (22.5%) | 885 (13.4%) |
| Total | 19,496 (100.0%) | 6,588 (100.0%) |
Physical Housing Characteristics in Carson
Housing Structures in Carson
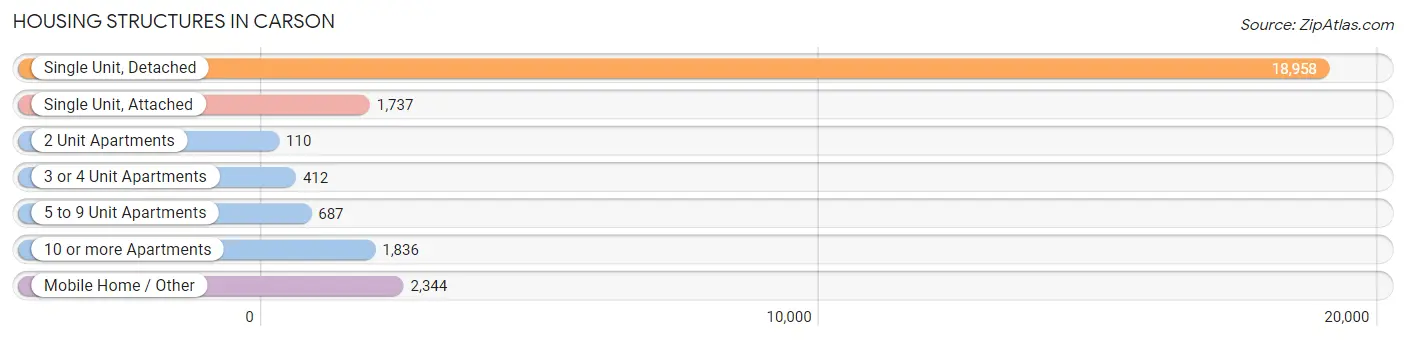
| Structure Type | # Housing Units | % Housing Units |
| Single Unit, Detached | 18,958 | 72.7% |
| Single Unit, Attached | 1,737 | 6.7% |
| 2 Unit Apartments | 110 | 0.4% |
| 3 or 4 Unit Apartments | 412 | 1.6% |
| 5 to 9 Unit Apartments | 687 | 2.6% |
| 10 or more Apartments | 1,836 | 7.0% |
| Mobile Home / Other | 2,344 | 9.0% |
| Total | 26,084 | 100.0% |
Housing Structures by Occupancy in Carson
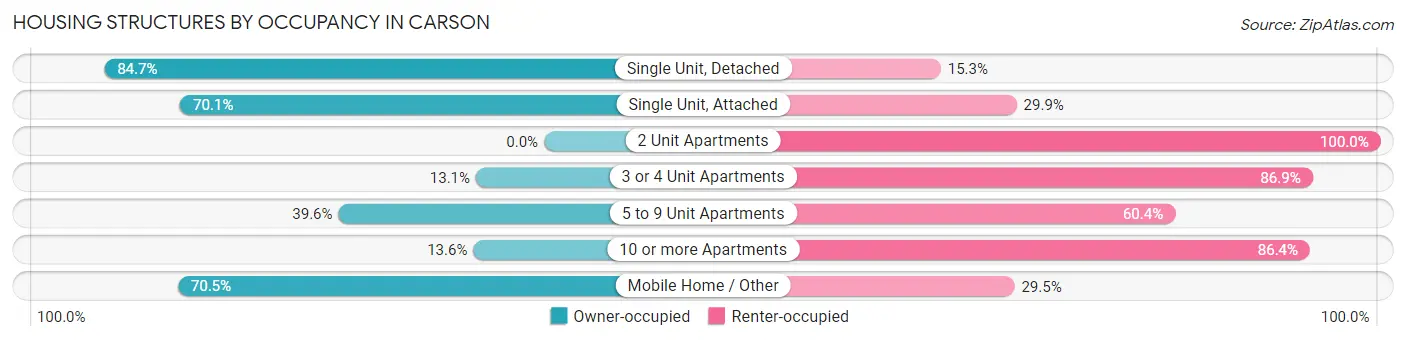
| Structure Type | Owner-occupied | Renter-occupied |
| Single Unit, Detached | 16,051 (84.7%) | 2,907 (15.3%) |
| Single Unit, Attached | 1,217 (70.1%) | 520 (29.9%) |
| 2 Unit Apartments | 0 (0.0%) | 110 (100.0%) |
| 3 or 4 Unit Apartments | 54 (13.1%) | 358 (86.9%) |
| 5 to 9 Unit Apartments | 272 (39.6%) | 415 (60.4%) |
| 10 or more Apartments | 250 (13.6%) | 1,586 (86.4%) |
| Mobile Home / Other | 1,652 (70.5%) | 692 (29.5%) |
| Total | 19,496 (74.7%) | 6,588 (25.3%) |
Housing Structures by Number of Rooms in Carson
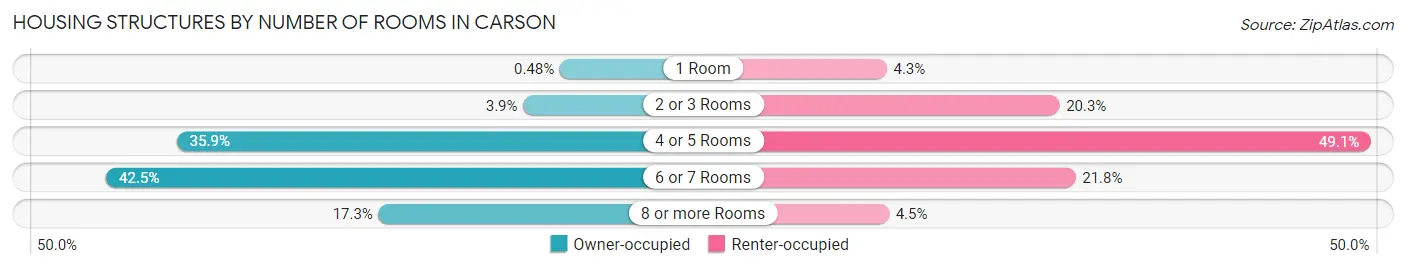
| Number of Rooms | Owner-occupied | Renter-occupied |
| 1 Room | 94 (0.5%) | 284 (4.3%) |
| 2 or 3 Rooms | 754 (3.9%) | 1,336 (20.3%) |
| 4 or 5 Rooms | 7,006 (35.9%) | 3,237 (49.1%) |
| 6 or 7 Rooms | 8,279 (42.5%) | 1,434 (21.8%) |
| 8 or more Rooms | 3,363 (17.2%) | 297 (4.5%) |
| Total | 19,496 (100.0%) | 6,588 (100.0%) |
Housing Structure by Heating Type in Carson
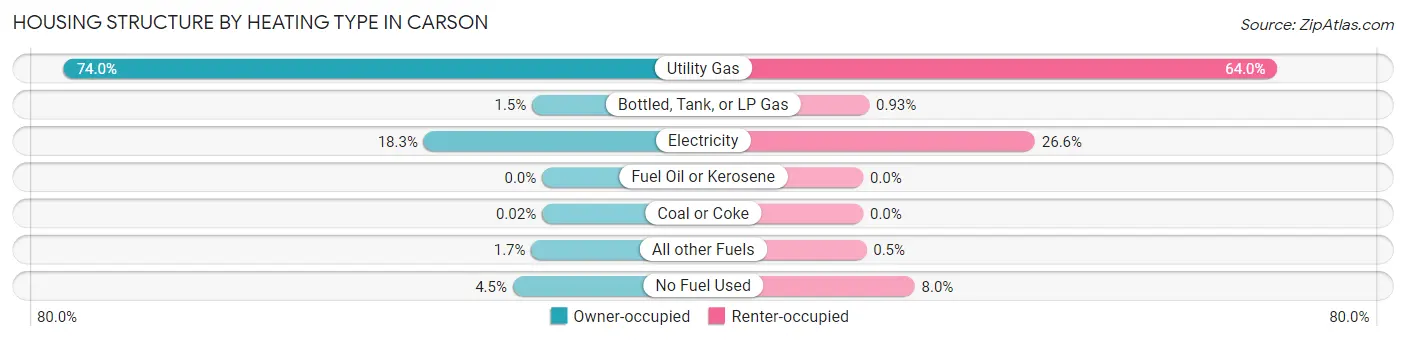
| Heating Type | Owner-occupied | Renter-occupied |
| Utility Gas | 14,418 (74.0%) | 4,219 (64.0%) |
| Bottled, Tank, or LP Gas | 301 (1.5%) | 61 (0.9%) |
| Electricity | 3,567 (18.3%) | 1,750 (26.6%) |
| Fuel Oil or Kerosene | 0 (0.0%) | 0 (0.0%) |
| Coal or Coke | 4 (0.0%) | 0 (0.0%) |
| All other Fuels | 323 (1.7%) | 33 (0.5%) |
| No Fuel Used | 883 (4.5%) | 525 (8.0%) |
| Total | 19,496 (100.0%) | 6,588 (100.0%) |
Household Vehicle Usage in Carson
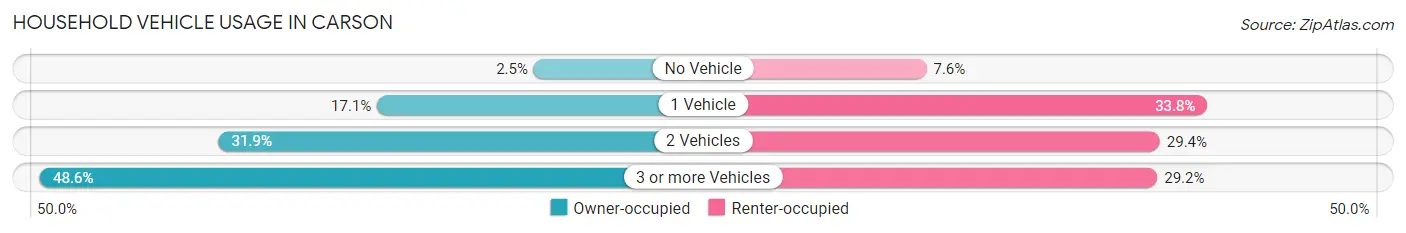
| Vehicles per Household | Owner-occupied | Renter-occupied |
| No Vehicle | 482 (2.5%) | 502 (7.6%) |
| 1 Vehicle | 3,332 (17.1%) | 2,228 (33.8%) |
| 2 Vehicles | 6,217 (31.9%) | 1,937 (29.4%) |
| 3 or more Vehicles | 9,465 (48.5%) | 1,921 (29.2%) |
| Total | 19,496 (100.0%) | 6,588 (100.0%) |
Real Estate & Mortgages in Carson
Real Estate and Mortgage Overview in Carson
| Characteristic | Without Mortgage | With Mortgage |
| Housing Units | 6,294 | 13,202 |
| Median Property Value | $568,800 | $632,200 |
| Median Household Income | $81,813 | $5,016 |
| Monthly Housing Costs | $571 | $4,393 |
| Real Estate Taxes | $3,093 | $238 |
Property Value by Mortgage Status in Carson
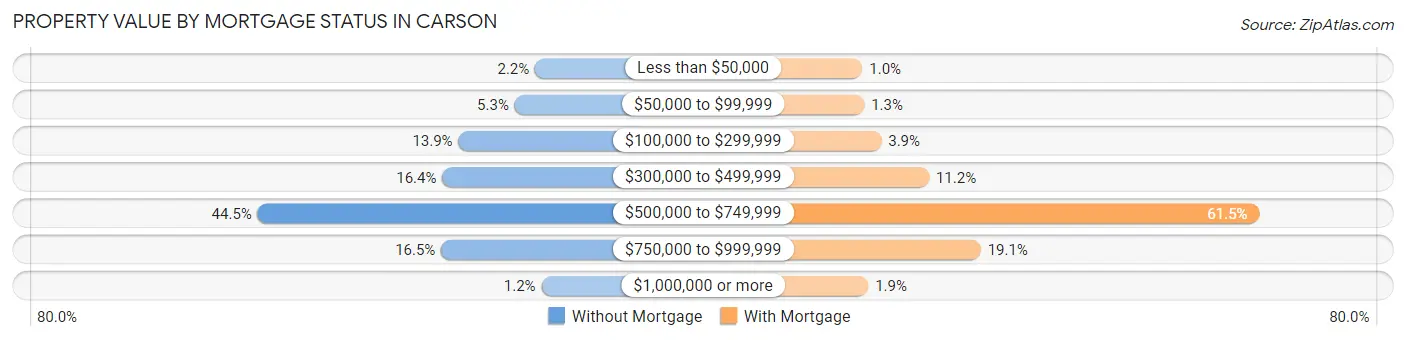
| Property Value | Without Mortgage | With Mortgage |
| Less than $50,000 | 139 (2.2%) | 136 (1.0%) |
| $50,000 to $99,999 | 334 (5.3%) | 174 (1.3%) |
| $100,000 to $299,999 | 874 (13.9%) | 518 (3.9%) |
| $300,000 to $499,999 | 1,029 (16.4%) | 1,477 (11.2%) |
| $500,000 to $749,999 | 2,800 (44.5%) | 8,125 (61.5%) |
| $750,000 to $999,999 | 1,040 (16.5%) | 2,517 (19.1%) |
| $1,000,000 or more | 78 (1.2%) | 255 (1.9%) |
| Total | 6,294 (100.0%) | 13,202 (100.0%) |
Household Income by Mortgage Status in Carson
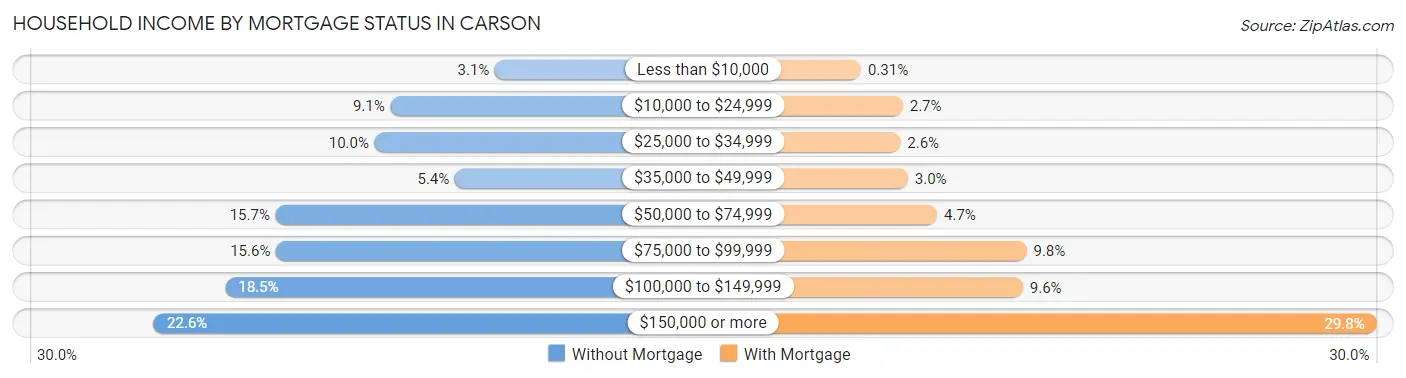
| Household Income | Without Mortgage | With Mortgage |
| Less than $10,000 | 196 (3.1%) | 41 (0.3%) |
| $10,000 to $24,999 | 572 (9.1%) | 356 (2.7%) |
| $25,000 to $34,999 | 629 (10.0%) | 338 (2.6%) |
| $35,000 to $49,999 | 340 (5.4%) | 395 (3.0%) |
| $50,000 to $74,999 | 985 (15.7%) | 615 (4.7%) |
| $75,000 to $99,999 | 983 (15.6%) | 1,290 (9.8%) |
| $100,000 to $149,999 | 1,166 (18.5%) | 1,262 (9.6%) |
| $150,000 or more | 1,423 (22.6%) | 3,930 (29.8%) |
| Total | 6,294 (100.0%) | 13,202 (100.0%) |
Property Value to Household Income Ratio in Carson
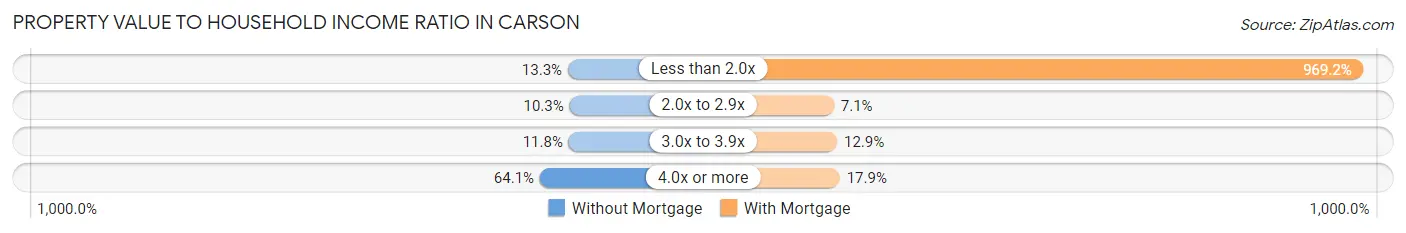
| Value-to-Income Ratio | Without Mortgage | With Mortgage |
| Less than 2.0x | 838 (13.3%) | 127,959 (969.2%) |
| 2.0x to 2.9x | 650 (10.3%) | 935 (7.1%) |
| 3.0x to 3.9x | 741 (11.8%) | 1,707 (12.9%) |
| 4.0x or more | 4,035 (64.1%) | 2,356 (17.8%) |
| Total | 6,294 (100.0%) | 13,202 (100.0%) |
Real Estate Taxes by Mortgage Status in Carson
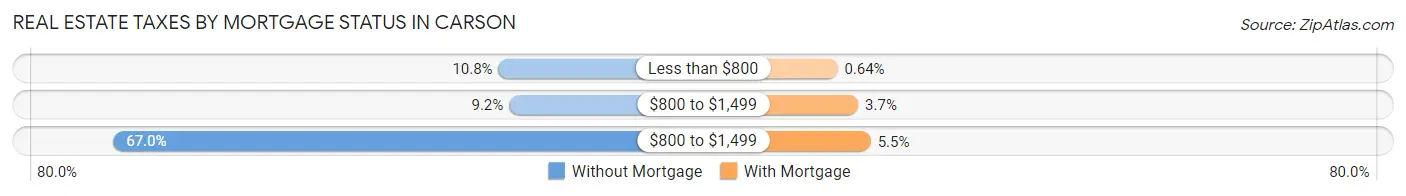
| Property Taxes | Without Mortgage | With Mortgage |
| Less than $800 | 677 (10.8%) | 85 (0.6%) |
| $800 to $1,499 | 579 (9.2%) | 485 (3.7%) |
| $800 to $1,499 | 4,219 (67.0%) | 727 (5.5%) |
| Total | 6,294 (100.0%) | 13,202 (100.0%) |
Health & Disability in Carson
Health Insurance Coverage by Age in Carson
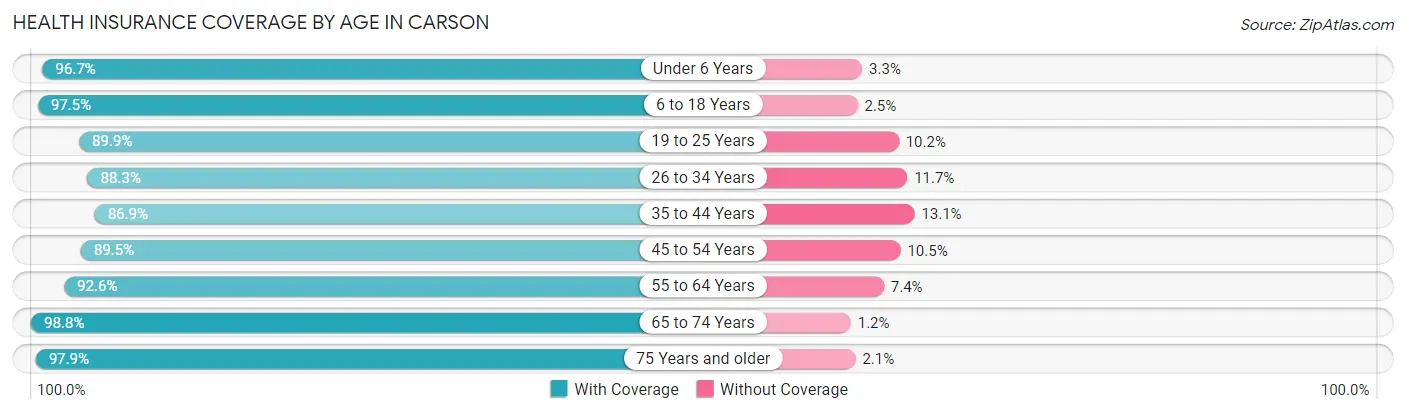
| Age Bracket | With Coverage | Without Coverage |
| Under 6 Years | 4,902 (96.7%) | 169 (3.3%) |
| 6 to 18 Years | 14,284 (97.5%) | 362 (2.5%) |
| 19 to 25 Years | 7,649 (89.8%) | 864 (10.2%) |
| 26 to 34 Years | 10,756 (88.3%) | 1,429 (11.7%) |
| 35 to 44 Years | 10,223 (86.9%) | 1,539 (13.1%) |
| 45 to 54 Years | 10,999 (89.5%) | 1,288 (10.5%) |
| 55 to 64 Years | 12,623 (92.6%) | 1,006 (7.4%) |
| 65 to 74 Years | 9,365 (98.8%) | 115 (1.2%) |
| 75 Years and older | 6,544 (97.9%) | 139 (2.1%) |
| Total | 87,345 (92.7%) | 6,911 (7.3%) |
Health Insurance Coverage by Citizenship Status in Carson
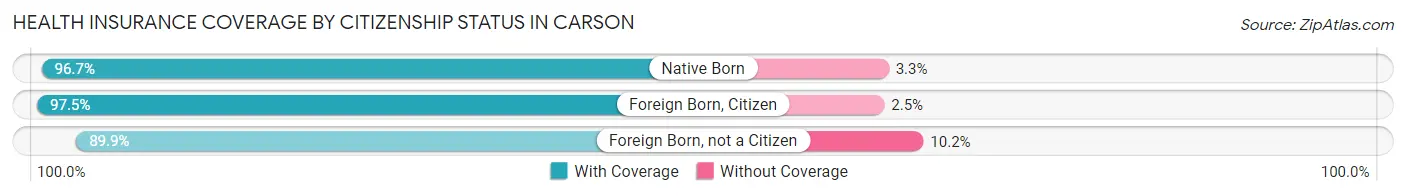
| Citizenship Status | With Coverage | Without Coverage |
| Native Born | 4,902 (96.7%) | 169 (3.3%) |
| Foreign Born, Citizen | 14,284 (97.5%) | 362 (2.5%) |
| Foreign Born, not a Citizen | 7,649 (89.8%) | 864 (10.2%) |
Health Insurance Coverage by Household Income in Carson
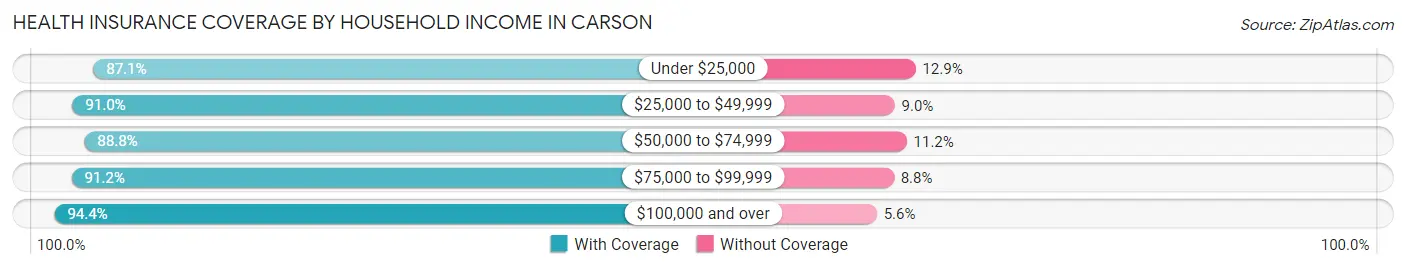
| Household Income | With Coverage | Without Coverage |
| Under $25,000 | 4,970 (87.1%) | 734 (12.9%) |
| $25,000 to $49,999 | 7,221 (91.0%) | 711 (9.0%) |
| $50,000 to $74,999 | 9,593 (88.8%) | 1,211 (11.2%) |
| $75,000 to $99,999 | 10,482 (91.2%) | 1,010 (8.8%) |
| $100,000 and over | 53,575 (94.4%) | 3,178 (5.6%) |
Public vs Private Health Insurance Coverage by Age in Carson
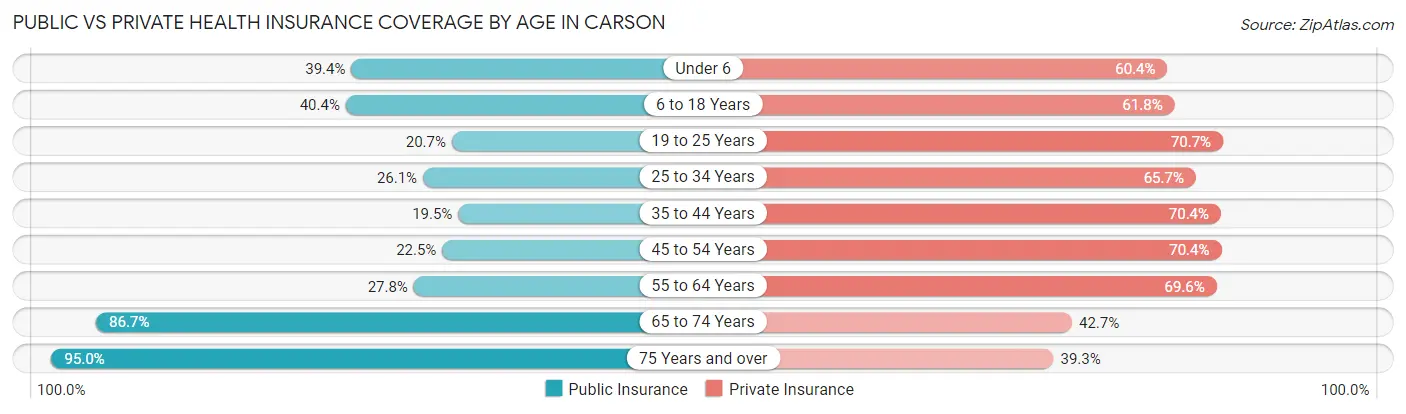
| Age Bracket | Public Insurance | Private Insurance |
| Under 6 | 1,996 (39.4%) | 3,064 (60.4%) |
| 6 to 18 Years | 5,915 (40.4%) | 9,044 (61.8%) |
| 19 to 25 Years | 1,763 (20.7%) | 6,022 (70.7%) |
| 25 to 34 Years | 3,176 (26.1%) | 8,004 (65.7%) |
| 35 to 44 Years | 2,296 (19.5%) | 8,275 (70.4%) |
| 45 to 54 Years | 2,763 (22.5%) | 8,654 (70.4%) |
| 55 to 64 Years | 3,786 (27.8%) | 9,481 (69.6%) |
| 65 to 74 Years | 8,221 (86.7%) | 4,052 (42.7%) |
| 75 Years and over | 6,350 (95.0%) | 2,627 (39.3%) |
| Total | 36,266 (38.5%) | 59,223 (62.8%) |
Disability Status by Sex by Age in Carson
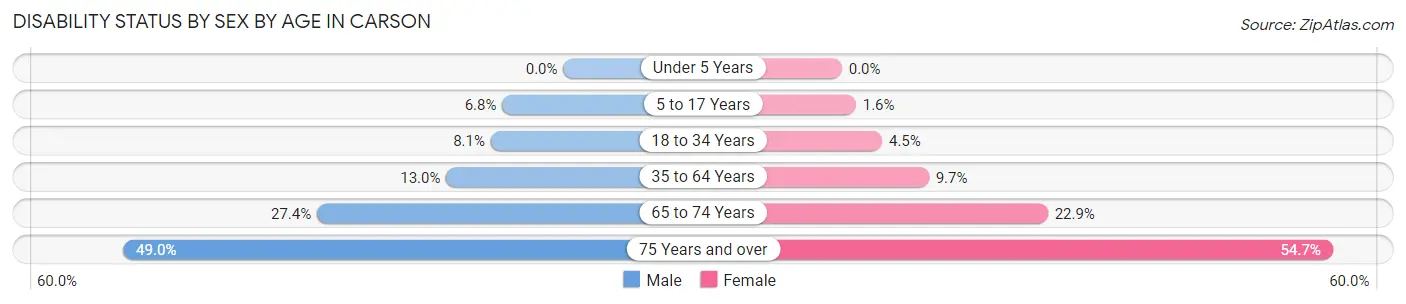
| Age Bracket | Male | Female |
| Under 5 Years | 0 (0.0%) | 0 (0.0%) |
| 5 to 17 Years | 483 (6.8%) | 110 (1.6%) |
| 18 to 34 Years | 949 (8.1%) | 459 (4.5%) |
| 35 to 64 Years | 2,410 (13.0%) | 1,859 (9.7%) |
| 65 to 74 Years | 1,129 (27.4%) | 1,230 (22.9%) |
| 75 Years and over | 1,381 (49.0%) | 2,113 (54.7%) |
Disability Class by Sex by Age in Carson
Disability Class: Hearing Difficulty
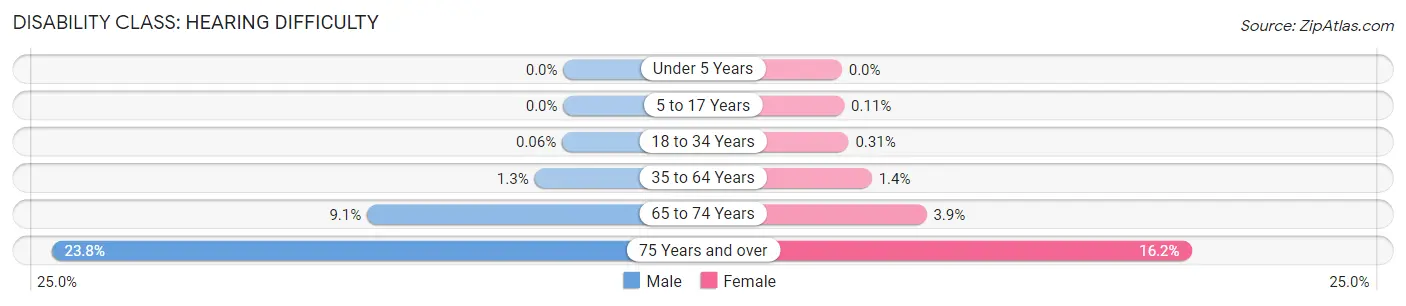
| Age Bracket | Male | Female |
| Under 5 Years | 0 (0.0%) | 0 (0.0%) |
| 5 to 17 Years | 0 (0.0%) | 8 (0.1%) |
| 18 to 34 Years | 7 (0.1%) | 32 (0.3%) |
| 35 to 64 Years | 247 (1.3%) | 266 (1.4%) |
| 65 to 74 Years | 375 (9.1%) | 211 (3.9%) |
| 75 Years and over | 669 (23.7%) | 627 (16.2%) |
Disability Class: Vision Difficulty
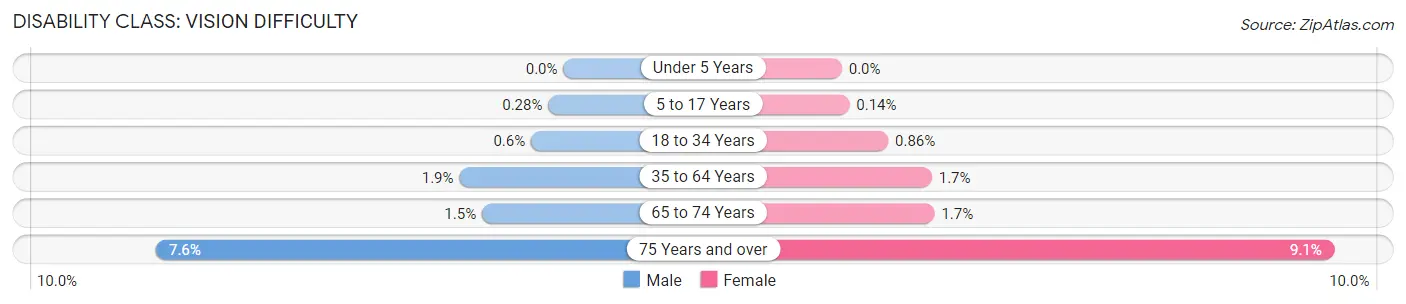
| Age Bracket | Male | Female |
| Under 5 Years | 0 (0.0%) | 0 (0.0%) |
| 5 to 17 Years | 20 (0.3%) | 10 (0.1%) |
| 18 to 34 Years | 70 (0.6%) | 88 (0.9%) |
| 35 to 64 Years | 357 (1.9%) | 321 (1.7%) |
| 65 to 74 Years | 62 (1.5%) | 92 (1.7%) |
| 75 Years and over | 213 (7.6%) | 353 (9.1%) |
Disability Class: Cognitive Difficulty
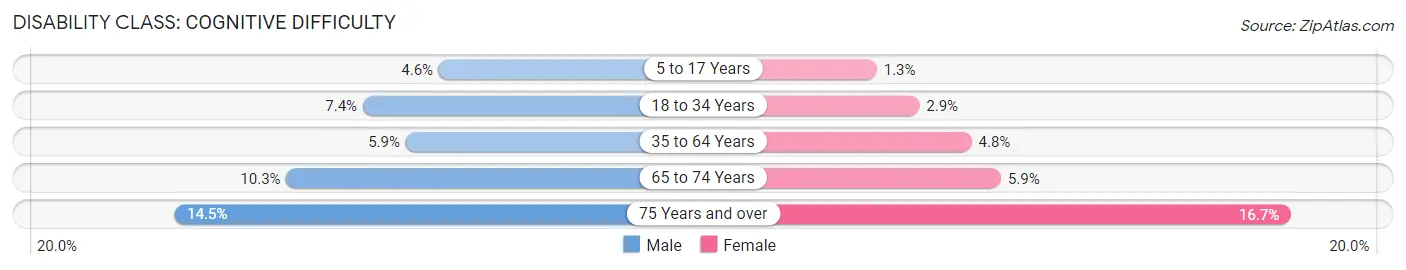
| Age Bracket | Male | Female |
| 5 to 17 Years | 328 (4.6%) | 92 (1.3%) |
| 18 to 34 Years | 874 (7.4%) | 295 (2.9%) |
| 35 to 64 Years | 1,082 (5.9%) | 925 (4.8%) |
| 65 to 74 Years | 423 (10.3%) | 317 (5.9%) |
| 75 Years and over | 407 (14.4%) | 645 (16.7%) |
Disability Class: Ambulatory Difficulty
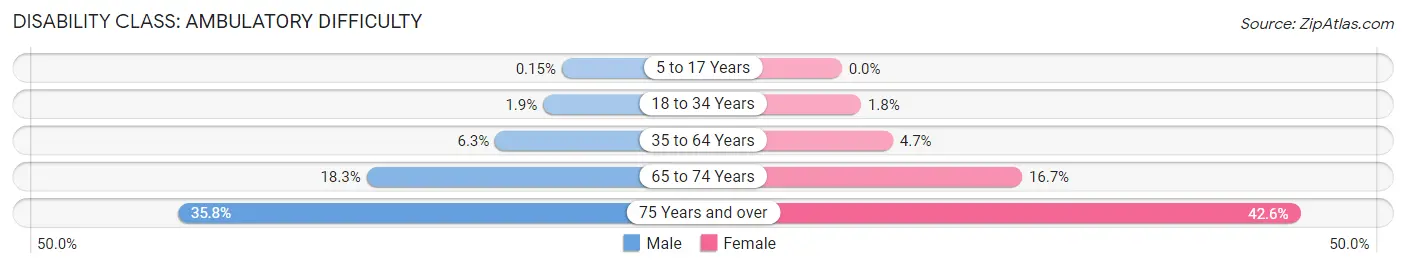
| Age Bracket | Male | Female |
| 5 to 17 Years | 11 (0.2%) | 0 (0.0%) |
| 18 to 34 Years | 221 (1.9%) | 183 (1.8%) |
| 35 to 64 Years | 1,169 (6.3%) | 910 (4.7%) |
| 65 to 74 Years | 752 (18.3%) | 897 (16.7%) |
| 75 Years and over | 1,008 (35.8%) | 1,645 (42.5%) |
Disability Class: Self-Care Difficulty
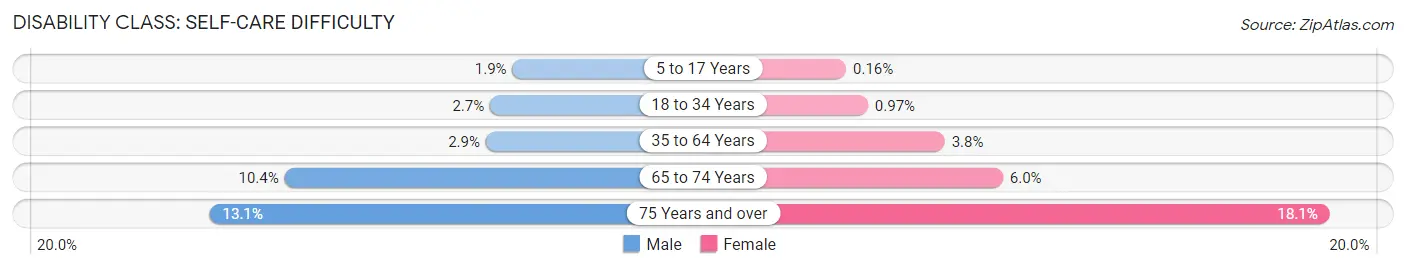
| Age Bracket | Male | Female |
| 5 to 17 Years | 134 (1.9%) | 11 (0.2%) |
| 18 to 34 Years | 320 (2.7%) | 99 (1.0%) |
| 35 to 64 Years | 532 (2.9%) | 733 (3.8%) |
| 65 to 74 Years | 426 (10.3%) | 321 (6.0%) |
| 75 Years and over | 370 (13.1%) | 700 (18.1%) |
Technology Access in Carson
Computing Device Access in Carson
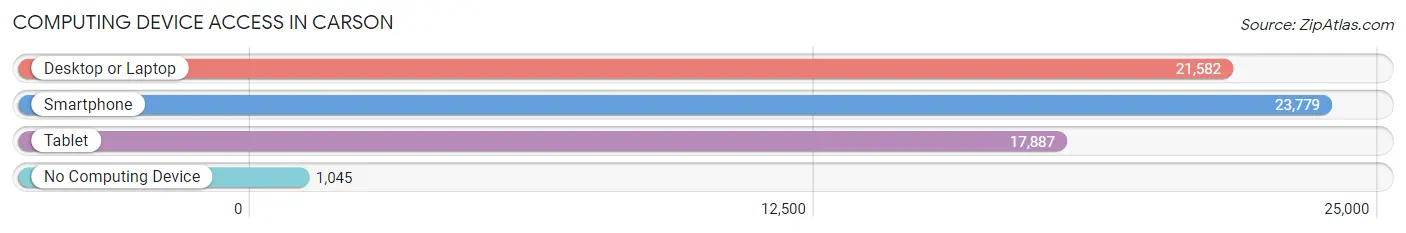
| Device Type | # Households | % Households |
| Desktop or Laptop | 21,582 | 82.7% |
| Smartphone | 23,779 | 91.2% |
| Tablet | 17,887 | 68.6% |
| No Computing Device | 1,045 | 4.0% |
| Total | 26,084 | 100.0% |
Internet Access in Carson
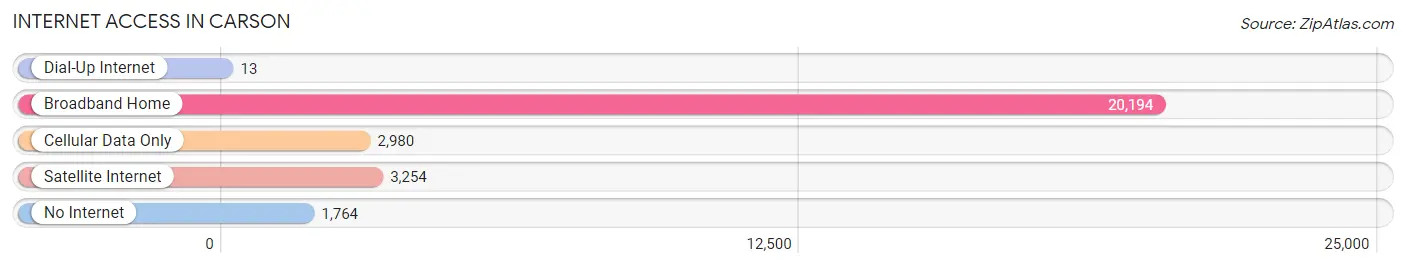
| Internet Type | # Households | % Households |
| Dial-Up Internet | 13 | 0.1% |
| Broadband Home | 20,194 | 77.4% |
| Cellular Data Only | 2,980 | 11.4% |
| Satellite Internet | 3,254 | 12.5% |
| No Internet | 1,764 | 6.8% |
| Total | 26,084 | 100.0% |
Carson Summary
Carson, California is a city located in Los Angeles County, California. It is located 13 miles south of downtown Los Angeles and is part of the South Bay region of the Greater Los Angeles Area. The city was founded in 1968 and is named after the famous American frontiersman, Kit Carson. The city has a population of 91,714 as of the 2010 census, making it the eighth largest city in Los Angeles County.
Geography
Carson is located at 33°51'17" North, 118°13'48" West (33.854722, -118.230000). It is bordered by the cities of Long Beach, Compton, and Torrance. The city covers an area of 19.0 square miles (49 km2).
The city is located in the South Bay region of Los Angeles County, which is a coastal plain with a Mediterranean climate. The city has a warm-summer Mediterranean climate, with cool, wet winters and hot, dry summers. The average annual temperature is 64°F (18°C). The average annual precipitation is 15.2 inches (386 mm).
Economy
Carson is home to a variety of businesses and industries. The city is home to the headquarters of the California State Automobile Association, the Los Angeles County Department of Public Works, and the Los Angeles County Sheriff's Department. The city is also home to a number of manufacturing and distribution companies, including the Honda of America Manufacturing plant, the Nestle USA plant, and the Toyota Motor Sales USA plant.
The city is also home to a number of retail stores, including the South Bay Pavilion Mall, the Carson Town Center, and the South Bay Galleria. The city is also home to a number of restaurants, including the popular In-N-Out Burger.
Demographics
As of the 2010 census, the population of Carson was 91,714. The racial makeup of the city was 44.3% White, 11.3% African American, 0.7% Native American, 11.3% Asian, 0.3% Pacific Islander, 28.2% from other races, and 4.1% from two or more races. Hispanic or Latino of any race were 51.2% of the population.
The median income for a household in the city was $50,945, and the median income for a family was $56,945. The per capita income for the city was $20,945. About 15.2% of families and 18.2% of the population were below the poverty line, including 25.2% of those under age 18 and 10.2% of those age 65 or over.
Conclusion
Carson, California is a city located in Los Angeles County, California. It is located 13 miles south of downtown Los Angeles and is part of the South Bay region of the Greater Los Angeles Area. The city was founded in 1968 and is named after the famous American frontiersman, Kit Carson. The city has a population of 91,714 as of the 2010 census, making it the eighth largest city in Los Angeles County. The city is located in the South Bay region of Los Angeles County, which is a coastal plain with a Mediterranean climate. The city has a variety of businesses and industries, including manufacturing and distribution companies, retail stores, and restaurants. The population of Carson is diverse, with 44.3% White, 11.3% African American, 0.7% Native American, 11.3% Asian, 0.3% Pacific Islander, 28.2% from other races, and 4.1% from two or more races. The median income for a household in the city was $50,945, and the median income for a family was $56,945. The per capita income for the city was $20,945. About 15.2% of families and 18.2% of the population were below the poverty line.
Common Questions
What is Per Capita Income in Carson?
Per Capita income in Carson is $36,093.
What is the Median Family Income in Carson?
Median Family Income in Carson is $109,157.
What is the Median Household income in Carson?
Median Household Income in Carson is $103,045.
What is Income or Wage Gap in Carson?
Income or Wage Gap in Carson is 10.6%.
Women in Carson earn 89.4 cents for every dollar earned by a man.
What is Family Income Deficit in Carson?
Family Income Deficit in Carson is $9,945.
Families that are below poverty line in Carson earn $9,945 less on average than the poverty threshold level.
What is Inequality or Gini Index in Carson?
Inequality or Gini Index in Carson is 0.41.
What is the Total Population of Carson?
Total Population of Carson is 94,475.
What is the Total Male Population of Carson?
Total Male Population of Carson is 46,942.
What is the Total Female Population of Carson?
Total Female Population of Carson is 47,533.
What is the Ratio of Males per 100 Females in Carson?
There are 98.76 Males per 100 Females in Carson.
What is the Ratio of Females per 100 Males in Carson?
There are 101.26 Females per 100 Males in Carson.
What is the Median Population Age in Carson?
Median Population Age in Carson is 41.3 Years.
What is the Average Family Size in Carson
Average Family Size in Carson is 3.9 People.
What is the Average Household Size in Carson
Average Household Size in Carson is 3.6 People.
How Large is the Labor Force in Carson?
There are 48,784 People in the Labor Forcein in Carson.
What is the Percentage of People in the Labor Force in Carson?
61.9% of People are in the Labor Force in Carson.
What is the Unemployment Rate in Carson?
Unemployment Rate in Carson is 6.9%.