Cities with the Highest Percentage of Black / African American Population in Iowa
RELATED REPORTS & OPTIONS
Black / African American
Iowa
Compare Cities
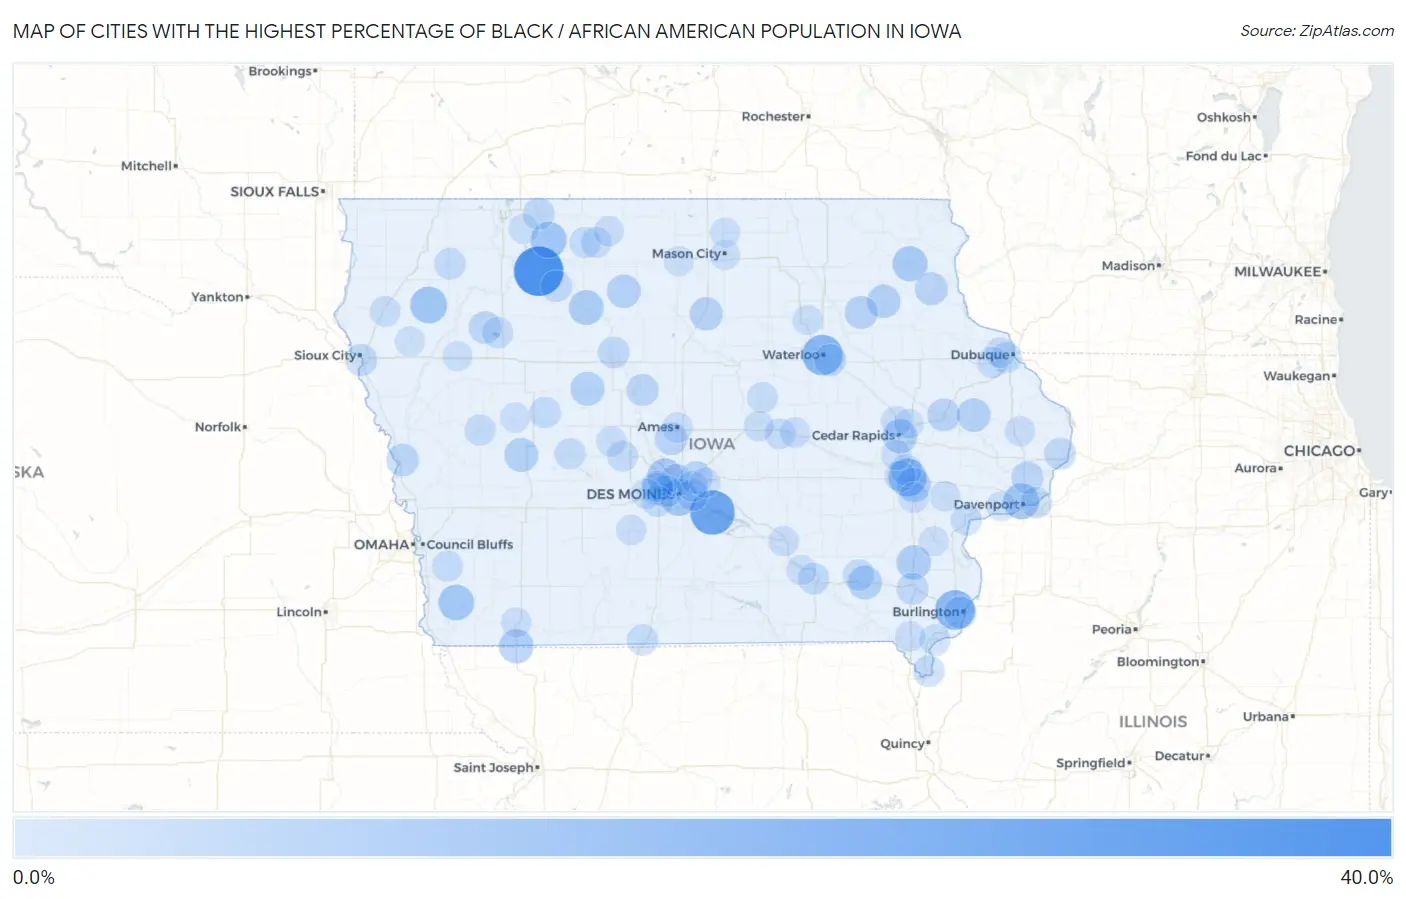
Map of Cities with the Highest Percentage of Black / African American Population in Iowa
0.0%
40.0%
Cities with the Highest Percentage of Black / African American Population in Iowa
| City | Black / African American | vs State | vs National | |
| 1. | Ayrshire | 31.3% | 3.8%(+27.6)#1 | 12.5%(+18.9)#2,256 |
| 2. | Swan | 23.7% | 3.8%(+19.9)#2 | 12.5%(+11.3)#2,875 |
| 3. | Waterloo | 17.7% | 3.8%(+13.9)#3 | 12.5%(+5.20)#3,620 |
| 4. | West Burlington | 16.4% | 3.8%(+12.6)#4 | 12.5%(+3.96)#3,829 |
| 5. | Coralville | 13.9% | 3.8%(+10.1)#5 | 12.5%(+1.45)#4,313 |
| 6. | Marcus | 11.9% | 3.8%(+8.13)#6 | 12.5%(-0.554)#4,778 |
| 7. | Des Moines | 11.8% | 3.8%(+7.97)#7 | 12.5%(-0.715)#4,810 |
| 8. | Graettinger | 11.1% | 3.8%(+7.31)#8 | 12.5%(-1.38)#4,994 |
| 9. | Davenport | 11.0% | 3.8%(+7.25)#9 | 12.5%(-1.44)#5,008 |
| 10. | Randolph | 10.5% | 3.8%(+6.74)#10 | 12.5%(-1.94)#5,143 |
| 11. | Johnston | 10.5% | 3.8%(+6.71)#11 | 12.5%(-1.97)#5,156 |
| 12. | Postville | 9.9% | 3.8%(+6.09)#12 | 12.5%(-2.59)#5,359 |
| 13. | Bradgate | 9.2% | 3.8%(+5.44)#13 | 12.5%(-3.25)#5,569 |
| 14. | Braddyville | 8.7% | 3.8%(+4.91)#14 | 12.5%(-3.77)#5,764 |
| 15. | Olds | 8.7% | 3.8%(+4.88)#15 | 12.5%(-3.80)#5,774 |
| 16. | Cedar Rapids | 8.7% | 3.8%(+4.87)#16 | 12.5%(-3.82)#5,779 |
| 17. | Iowa City | 8.5% | 3.8%(+4.71)#17 | 12.5%(-3.98)#5,842 |
| 18. | Farnhamville | 8.0% | 3.8%(+4.25)#18 | 12.5%(-4.43)#6,031 |
| 19. | Gray | 8.0% | 3.8%(+4.22)#19 | 12.5%(-4.47)#6,048 |
| 20. | Fairfield | 7.9% | 3.8%(+4.11)#20 | 12.5%(-4.57)#6,097 |
| 21. | Onslow | 7.5% | 3.8%(+3.74)#21 | 12.5%(-4.95)#6,264 |
| 22. | Fayette | 7.5% | 3.8%(+3.68)#22 | 12.5%(-5.01)#6,296 |
| 23. | Lu Verne | 7.4% | 3.8%(+3.62)#23 | 12.5%(-5.06)#6,322 |
| 24. | Latimer | 7.1% | 3.8%(+3.28)#24 | 12.5%(-5.41)#6,477 |
| 25. | Westgate | 6.8% | 3.8%(+2.98)#25 | 12.5%(-5.71)#6,639 |
| 26. | St Olaf | 6.5% | 3.8%(+2.76)#26 | 12.5%(-5.93)#6,747 |
| 27. | Anamosa | 6.4% | 3.8%(+2.64)#27 | 12.5%(-6.04)#6,811 |
| 28. | Kelley | 6.2% | 3.8%(+2.45)#28 | 12.5%(-6.24)#6,917 |
| 29. | Little Sioux | 6.1% | 3.8%(+2.36)#29 | 12.5%(-6.32)#6,970 |
| 30. | Alta | 5.9% | 3.8%(+2.15)#30 | 12.5%(-6.53)#7,092 |
| 31. | Bondurant | 5.9% | 3.8%(+2.14)#31 | 12.5%(-6.55)#7,103 |
| 32. | Burlington | 5.8% | 3.8%(+2.03)#32 | 12.5%(-6.66)#7,167 |
| 33. | Park View | 5.6% | 3.8%(+1.79)#33 | 12.5%(-6.90)#7,334 |
| 34. | Saylorville | 5.5% | 3.8%(+1.72)#34 | 12.5%(-6.97)#7,366 |
| 35. | Windsor Heights | 5.4% | 3.8%(+1.60)#35 | 12.5%(-7.09)#7,446 |
| 36. | Stratford | 5.4% | 3.8%(+1.57)#36 | 12.5%(-7.12)#7,471 |
| 37. | Evansdale | 5.2% | 3.8%(+1.46)#37 | 12.5%(-7.23)#7,541 |
| 38. | Mount Pleasant | 5.2% | 3.8%(+1.45)#38 | 12.5%(-7.24)#7,549 |
| 39. | Sioux City | 5.2% | 3.8%(+1.43)#39 | 12.5%(-7.26)#7,569 |
| 40. | Clinton | 5.2% | 3.8%(+1.42)#40 | 12.5%(-7.26)#7,573 |
| 41. | Clive | 5.1% | 3.8%(+1.30)#41 | 12.5%(-7.39)#7,658 |
| 42. | Fort Dodge | 4.9% | 3.8%(+1.10)#42 | 12.5%(-7.58)#7,785 |
| 43. | Estherville | 4.9% | 3.8%(+1.10)#43 | 12.5%(-7.59)#7,789 |
| 44. | Pleasant Hill | 4.8% | 3.8%(+1.06)#44 | 12.5%(-7.63)#7,822 |
| 45. | Mallard | 4.8% | 3.8%(+0.998)#45 | 12.5%(-7.69)#7,868 |
| 46. | Lidderdale | 4.7% | 3.8%(+0.896)#46 | 12.5%(-7.79)#7,944 |
| 47. | Primghar | 4.5% | 3.8%(+0.700)#47 | 12.5%(-7.99)#8,117 |
| 48. | Riverdale | 4.5% | 3.8%(+0.698)#48 | 12.5%(-7.99)#8,119 |
| 49. | Keokuk | 4.4% | 3.8%(+0.636)#49 | 12.5%(-8.05)#8,186 |
| 50. | North Liberty | 4.4% | 3.8%(+0.616)#50 | 12.5%(-8.07)#8,198 |
| 51. | Ottumwa | 4.4% | 3.8%(+0.606)#51 | 12.5%(-8.08)#8,208 |
| 52. | West Des Moines | 4.4% | 3.8%(+0.605)#52 | 12.5%(-8.08)#8,209 |
| 53. | Maharishi Vedic City | 4.4% | 3.8%(+0.581)#53 | 12.5%(-8.11)#8,223 |
| 54. | Urbandale | 4.3% | 3.8%(+0.549)#54 | 12.5%(-8.14)#8,256 |
| 55. | Lamoni | 4.2% | 3.8%(+0.421)#55 | 12.5%(-8.27)#8,372 |
| 56. | Storm Lake | 4.2% | 3.8%(+0.398)#56 | 12.5%(-8.29)#8,395 |
| 57. | Denison | 4.1% | 3.8%(+0.354)#57 | 12.5%(-8.33)#8,442 |
| 58. | Muscatine | 4.1% | 3.8%(+0.277)#58 | 12.5%(-8.41)#8,506 |
| 59. | Dubuque | 4.1% | 3.8%(+0.274)#59 | 12.5%(-8.41)#8,508 |
| 60. | Peosta | 4.0% | 3.8%(+0.267)#60 | 12.5%(-8.42)#8,515 |
| 61. | Bayard | 4.0% | 3.8%(+0.250)#61 | 12.5%(-8.44)#8,530 |
| 62. | Fenton | 4.0% | 3.8%(+0.250)#62 | 12.5%(-8.44)#8,531 |
| 63. | Silver City | 4.0% | 3.8%(+0.217)#63 | 12.5%(-8.47)#8,557 |
| 64. | Fort Madison | 4.0% | 3.8%(+0.201)#64 | 12.5%(-8.49)#8,571 |
| 65. | Tiffin | 3.9% | 3.8%(+0.118)#65 | 12.5%(-8.57)#8,664 |
| 66. | Perry | 3.8% | 3.8%(+0.052)#66 | 12.5%(-8.64)#8,731 |
| 67. | Conrad | 3.7% | 3.8%(-0.055)#67 | 12.5%(-8.74)#8,835 |
| 68. | Le Mars | 3.7% | 3.8%(-0.104)#68 | 12.5%(-8.79)#8,882 |
| 69. | Montour | 3.6% | 3.8%(-0.156)#69 | 12.5%(-8.84)#8,941 |
| 70. | Hiawatha | 3.5% | 3.8%(-0.258)#70 | 12.5%(-8.95)#9,058 |
| 71. | Lone Rock | 3.5% | 3.8%(-0.274)#71 | 12.5%(-8.96)#9,081 |
| 72. | Waukee | 3.4% | 3.8%(-0.381)#72 | 12.5%(-9.07)#9,179 |
| 73. | Altoona | 3.4% | 3.8%(-0.415)#73 | 12.5%(-9.10)#9,223 |
| 74. | Asbury | 3.3% | 3.8%(-0.438)#74 | 12.5%(-9.13)#9,257 |
| 75. | Mitchellville | 3.3% | 3.8%(-0.510)#75 | 12.5%(-9.20)#9,349 |
| 76. | West Liberty | 3.2% | 3.8%(-0.590)#76 | 12.5%(-9.28)#9,435 |
| 77. | Rippey | 3.2% | 3.8%(-0.591)#77 | 12.5%(-9.28)#9,443 |
| 78. | Ames | 3.2% | 3.8%(-0.592)#78 | 12.5%(-9.28)#9,447 |
| 79. | Clarinda | 3.1% | 3.8%(-0.673)#79 | 12.5%(-9.36)#9,550 |
| 80. | Bancroft | 3.1% | 3.8%(-0.718)#80 | 12.5%(-9.41)#9,594 |
| 81. | Winterset | 3.0% | 3.8%(-0.745)#81 | 12.5%(-9.43)#9,635 |
| 82. | Hills | 3.0% | 3.8%(-0.745)#82 | 12.5%(-9.43)#9,636 |
| 83. | Beacon | 3.0% | 3.8%(-0.752)#83 | 12.5%(-9.44)#9,652 |
| 84. | Toledo | 3.0% | 3.8%(-0.754)#84 | 12.5%(-9.44)#9,655 |
| 85. | Chillicothe | 3.0% | 3.8%(-0.797)#85 | 12.5%(-9.49)#9,710 |
| 86. | Terril | 3.0% | 3.8%(-0.802)#86 | 12.5%(-9.49)#9,713 |
| 87. | Donnellson | 2.9% | 3.8%(-0.848)#87 | 12.5%(-9.54)#9,766 |
| 88. | Waverly | 2.9% | 3.8%(-0.869)#88 | 12.5%(-9.56)#9,799 |
| 89. | Marshalltown | 2.9% | 3.8%(-0.882)#89 | 12.5%(-9.57)#9,818 |
| 90. | Delmar | 2.9% | 3.8%(-0.894)#90 | 12.5%(-9.58)#9,840 |
| 91. | Swisher | 2.8% | 3.8%(-1.03)#91 | 12.5%(-9.72)#10,008 |
| 92. | Mason City | 2.7% | 3.8%(-1.05)#92 | 12.5%(-9.73)#10,037 |
| 93. | Columbus Junction | 2.7% | 3.8%(-1.07)#93 | 12.5%(-9.76)#10,073 |
| 94. | Holstein | 2.7% | 3.8%(-1.09)#94 | 12.5%(-9.78)#10,105 |
| 95. | Arcadia | 2.7% | 3.8%(-1.10)#95 | 12.5%(-9.79)#10,114 |
| 96. | Blue Grass | 2.6% | 3.8%(-1.17)#96 | 12.5%(-9.85)#10,215 |
| 97. | Manly | 2.6% | 3.8%(-1.17)#97 | 12.5%(-9.86)#10,218 |
| 98. | Garner | 2.6% | 3.8%(-1.17)#98 | 12.5%(-9.86)#10,226 |
| 99. | Kingsley | 2.6% | 3.8%(-1.18)#99 | 12.5%(-9.87)#10,238 |
| 100. | Marion | 2.6% | 3.8%(-1.18)#100 | 12.5%(-9.87)#10,241 |
Common Questions
What are the Top 10 Cities with the Highest Percentage of Black / African American Population in Iowa?
Top 10 Cities with the Highest Percentage of Black / African American Population in Iowa are:
#1
31.3%
#2
23.7%
#3
17.7%
#4
16.4%
#5
13.9%
#6
11.9%
#7
11.8%
#8
11.1%
#9
11.0%
#10
10.5%
What city has the Highest Percentage of Black / African American Population in Iowa?
Ayrshire has the Highest Percentage of Black / African American Population in Iowa with 31.3%.
What is the Percentage of Black / African American Population in the State of Iowa?
Percentage of Black / African American Population in Iowa is 3.8%.
What is the Percentage of Black / African American Population in the United States?
Percentage of Black / African American Population in the United States is 12.5%.