View Park Windsor Hills, CA Map & Demographics
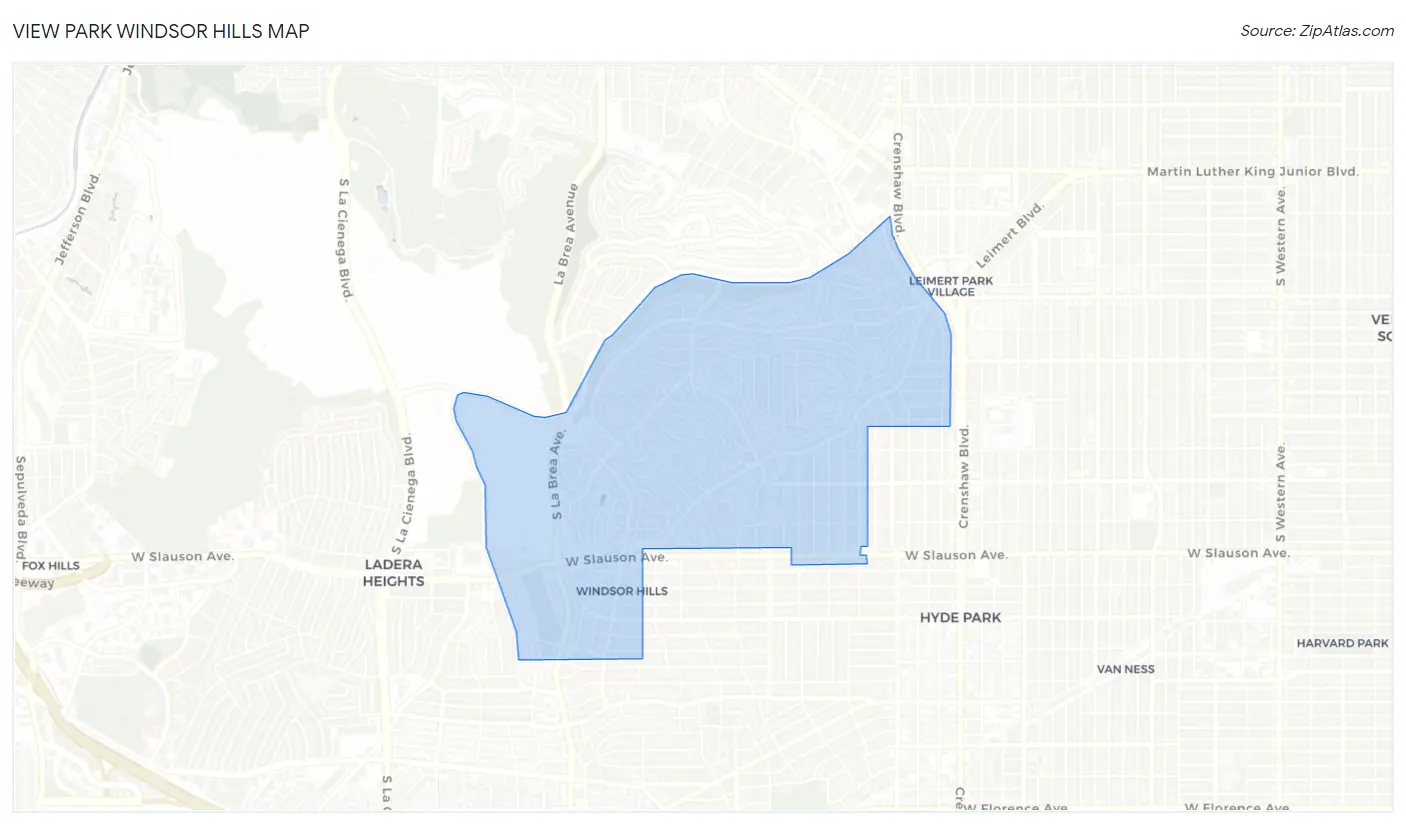
View Park Windsor Hills Map
View Park Windsor Hills Overview
$53,787
PER CAPITA INCOME
$121,235
AVG FAMILY INCOME
$112,674
AVG HOUSEHOLD INCOME
7.8%
WAGE / INCOME GAP [ % ]
92.2¢/ $1
WAGE / INCOME GAP [ $ ]
0.41
INEQUALITY / GINI INDEX
11,999
TOTAL POPULATION
5,739
MALE POPULATION
6,260
FEMALE POPULATION
91.68
MALES / 100 FEMALES
109.08
FEMALES / 100 MALES
47.9
MEDIAN AGE
3.0
AVG FAMILY SIZE
2.4
AVG HOUSEHOLD SIZE
6,205
LABOR FORCE [ PEOPLE ]
60.4%
PERCENT IN LABOR FORCE
11.3%
UNEMPLOYMENT RATE
Income in View Park Windsor Hills
Income Overview in View Park Windsor Hills
Per Capita Income in View Park Windsor Hills is $53,787, while median incomes of families and households are $121,235 and $112,674 respectively.
| Characteristic | Number | Measure |
| Per Capita Income | 11,999 | $53,787 |
| Median Family Income | 3,083 | $121,235 |
| Mean Family Income | 3,083 | $143,651 |
| Median Household Income | 4,911 | $112,674 |
| Mean Household Income | 4,911 | $128,118 |
| Income Deficit | 3,083 | $0 |
| Wage / Income Gap (%) | 11,999 | 7.83% |
| Wage / Income Gap ($) | 11,999 | 92.17¢ per $1 |
| Gini / Inequality Index | 11,999 | 0.41 |
Earnings by Sex in View Park Windsor Hills
Average Earnings in View Park Windsor Hills are $63,158, $64,637 for men and $59,574 for women, a difference of 7.8%.
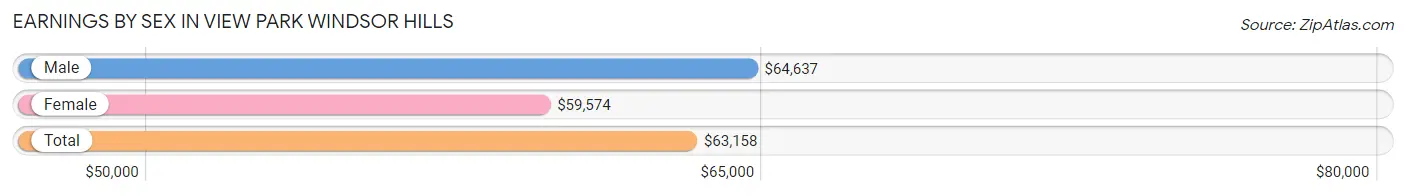
| Sex | Number | Average Earnings |
| Male | 3,471 (52.8%) | $64,637 |
| Female | 3,105 (47.2%) | $59,574 |
| Total | 6,576 (100.0%) | $63,158 |
Earnings by Sex by Income Bracket in View Park Windsor Hills
The most common earnings brackets in View Park Windsor Hills are $100,000+ for men (890 | 25.6%) and $100,000+ for women (685 | 22.1%).
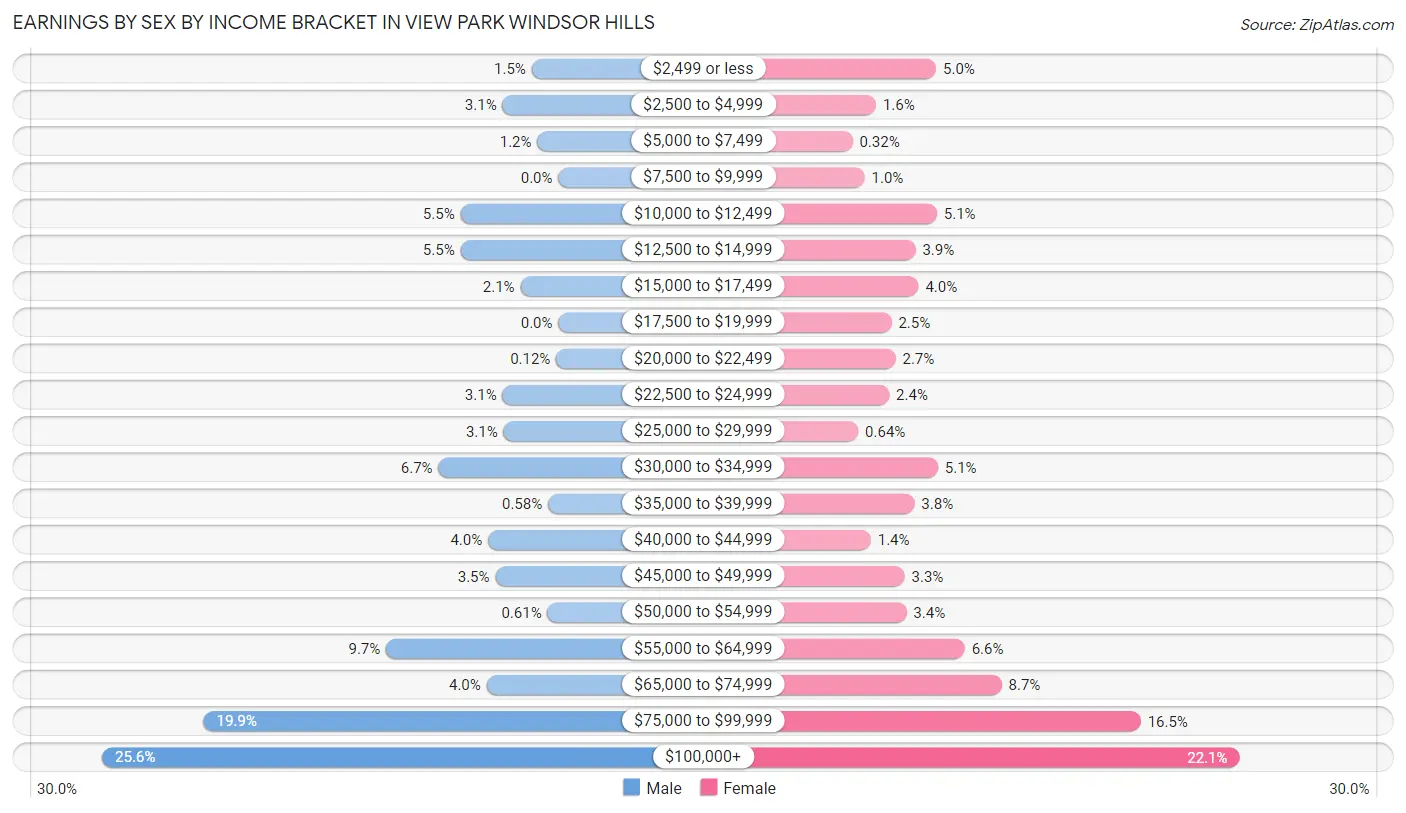
| Income | Male | Female |
| $2,499 or less | 52 (1.5%) | 156 (5.0%) |
| $2,500 to $4,999 | 109 (3.1%) | 51 (1.6%) |
| $5,000 to $7,499 | 41 (1.2%) | 10 (0.3%) |
| $7,500 to $9,999 | 0 (0.0%) | 31 (1.0%) |
| $10,000 to $12,499 | 191 (5.5%) | 157 (5.1%) |
| $12,500 to $14,999 | 191 (5.5%) | 120 (3.9%) |
| $15,000 to $17,499 | 74 (2.1%) | 125 (4.0%) |
| $17,500 to $19,999 | 0 (0.0%) | 78 (2.5%) |
| $20,000 to $22,499 | 4 (0.1%) | 85 (2.7%) |
| $22,500 to $24,999 | 109 (3.1%) | 74 (2.4%) |
| $25,000 to $29,999 | 107 (3.1%) | 20 (0.6%) |
| $30,000 to $34,999 | 234 (6.7%) | 159 (5.1%) |
| $35,000 to $39,999 | 20 (0.6%) | 118 (3.8%) |
| $40,000 to $44,999 | 137 (4.0%) | 42 (1.3%) |
| $45,000 to $49,999 | 123 (3.5%) | 101 (3.3%) |
| $50,000 to $54,999 | 21 (0.6%) | 104 (3.4%) |
| $55,000 to $64,999 | 336 (9.7%) | 206 (6.6%) |
| $65,000 to $74,999 | 140 (4.0%) | 270 (8.7%) |
| $75,000 to $99,999 | 692 (19.9%) | 513 (16.5%) |
| $100,000+ | 890 (25.6%) | 685 (22.1%) |
| Total | 3,471 (100.0%) | 3,105 (100.0%) |
Earnings by Sex by Educational Attainment in View Park Windsor Hills
Average earnings in View Park Windsor Hills are $65,820 for men and $65,019 for women, a difference of 1.2%. Men with an educational attainment of graduate degree enjoy the highest average annual earnings of $96,541, while those with college or associate's degree education earn the least with $45,295. Women with an educational attainment of graduate degree earn the most with the average annual earnings of $89,905, while those with less than high school education have the smallest earnings of $33,305.
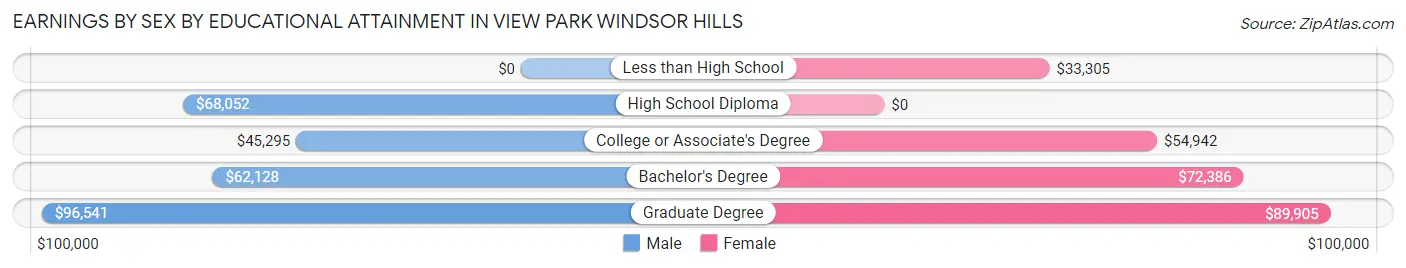
| Educational Attainment | Male Income | Female Income |
| Less than High School | - | - |
| High School Diploma | $68,052 | $0 |
| College or Associate's Degree | $45,295 | $54,942 |
| Bachelor's Degree | $62,128 | $72,386 |
| Graduate Degree | $96,541 | $89,905 |
| Total | $65,820 | $65,019 |
Family Income in View Park Windsor Hills
Family Income Brackets in View Park Windsor Hills
According to the View Park Windsor Hills family income data, there are 900 families falling into the $200,000+ income range, which is the most common income bracket and makes up 29.2% of all families. Conversely, the $10,000 to $14,999 income bracket is the least frequent group with only 18 families (0.6%) belonging to this category.
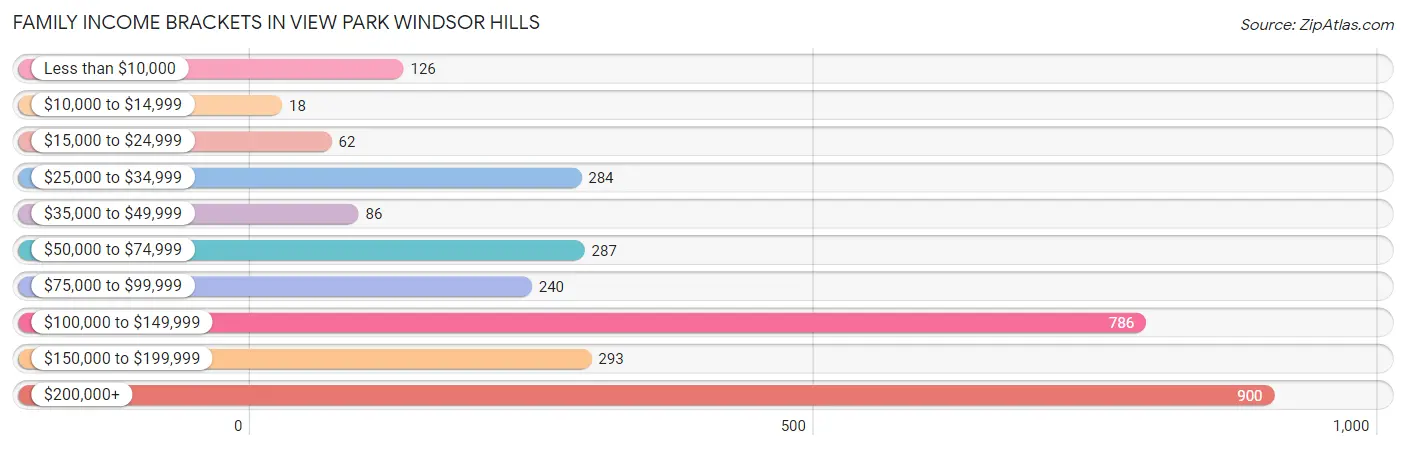
| Income Bracket | # Families | % Families |
| Less than $10,000 | 126 | 4.1% |
| $10,000 to $14,999 | 18 | 0.6% |
| $15,000 to $24,999 | 62 | 2.0% |
| $25,000 to $34,999 | 284 | 9.2% |
| $35,000 to $49,999 | 86 | 2.8% |
| $50,000 to $74,999 | 287 | 9.3% |
| $75,000 to $99,999 | 240 | 7.8% |
| $100,000 to $149,999 | 786 | 25.5% |
| $150,000 to $199,999 | 293 | 9.5% |
| $200,000+ | 900 | 29.2% |
Family Income by Famaliy Size in View Park Windsor Hills
4-person families (521 | 16.9%) account for the highest median family income in View Park Windsor Hills with $147,604 per family, while 2-person families (1,532 | 49.7%) have the highest median income of $61,830 per family member.
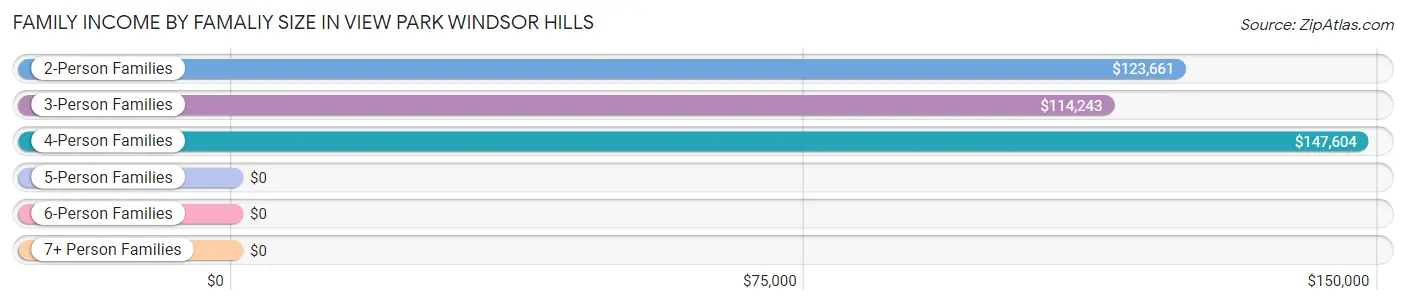
| Income Bracket | # Families | Median Income |
| 2-Person Families | 1,532 (49.7%) | $123,661 |
| 3-Person Families | 792 (25.7%) | $114,243 |
| 4-Person Families | 521 (16.9%) | $147,604 |
| 5-Person Families | 222 (7.2%) | $0 |
| 6-Person Families | 0 (0.0%) | $0 |
| 7+ Person Families | 16 (0.5%) | $0 |
| Total | 3,083 (100.0%) | $121,235 |
Family Income by Number of Earners in View Park Windsor Hills
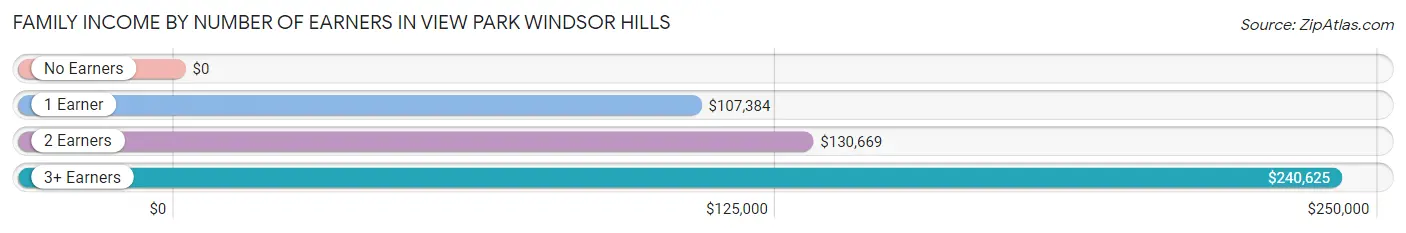
| Number of Earners | # Families | Median Income |
| No Earners | 586 (19.0%) | $0 |
| 1 Earner | 905 (29.3%) | $107,384 |
| 2 Earners | 1,375 (44.6%) | $130,669 |
| 3+ Earners | 217 (7.0%) | $240,625 |
| Total | 3,083 (100.0%) | $121,235 |
Household Income in View Park Windsor Hills
Household Income Brackets in View Park Windsor Hills
With 1,134 households falling in the category, the $200,000+ income range is the most frequent in View Park Windsor Hills, accounting for 23.1% of all households. In contrast, only 108 households (2.2%) fall into the $10,000 to $14,999 income bracket, making it the least populous group.
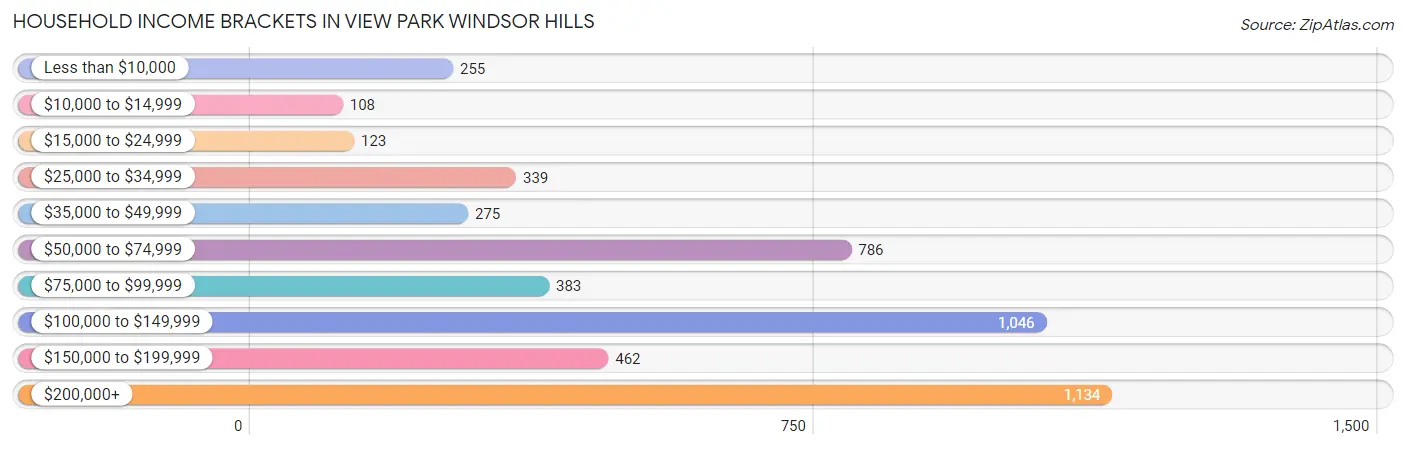
| Income Bracket | # Households | % Households |
| Less than $10,000 | 255 | 5.2% |
| $10,000 to $14,999 | 108 | 2.2% |
| $15,000 to $24,999 | 123 | 2.5% |
| $25,000 to $34,999 | 339 | 6.9% |
| $35,000 to $49,999 | 275 | 5.6% |
| $50,000 to $74,999 | 786 | 16.0% |
| $75,000 to $99,999 | 383 | 7.8% |
| $100,000 to $149,999 | 1,046 | 21.3% |
| $150,000 to $199,999 | 462 | 9.4% |
| $200,000+ | 1,134 | 23.1% |
Household Income by Householder Age in View Park Windsor Hills
The median household income in View Park Windsor Hills is $112,674, with the highest median household income of $123,040 found in the 25 to 44 years age bracket for the primary householder. A total of 999 households (20.3%) fall into this category. Meanwhile, the 15 to 24 years age bracket for the primary householder has the lowest median household income of $0, with 79 households (1.6%) in this group.
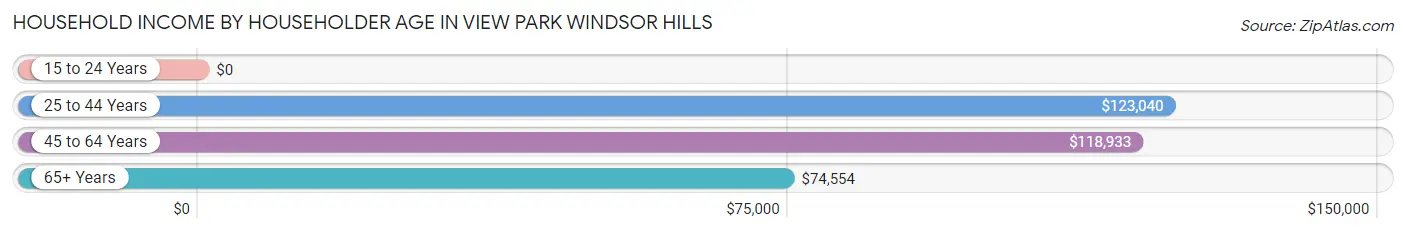
| Income Bracket | # Households | Median Income |
| 15 to 24 Years | 79 (1.6%) | $0 |
| 25 to 44 Years | 999 (20.3%) | $123,040 |
| 45 to 64 Years | 2,017 (41.1%) | $118,933 |
| 65+ Years | 1,816 (37.0%) | $74,554 |
| Total | 4,911 (100.0%) | $112,674 |
Poverty in View Park Windsor Hills
Income Below Poverty by Sex and Age in View Park Windsor Hills
With 9.5% poverty level for males and 9.2% for females among the residents of View Park Windsor Hills, under 5 year old males and 75 year old and over females are the most vulnerable to poverty, with 80 males (30.3%) and 212 females (24.6%) in their respective age groups living below the poverty level.
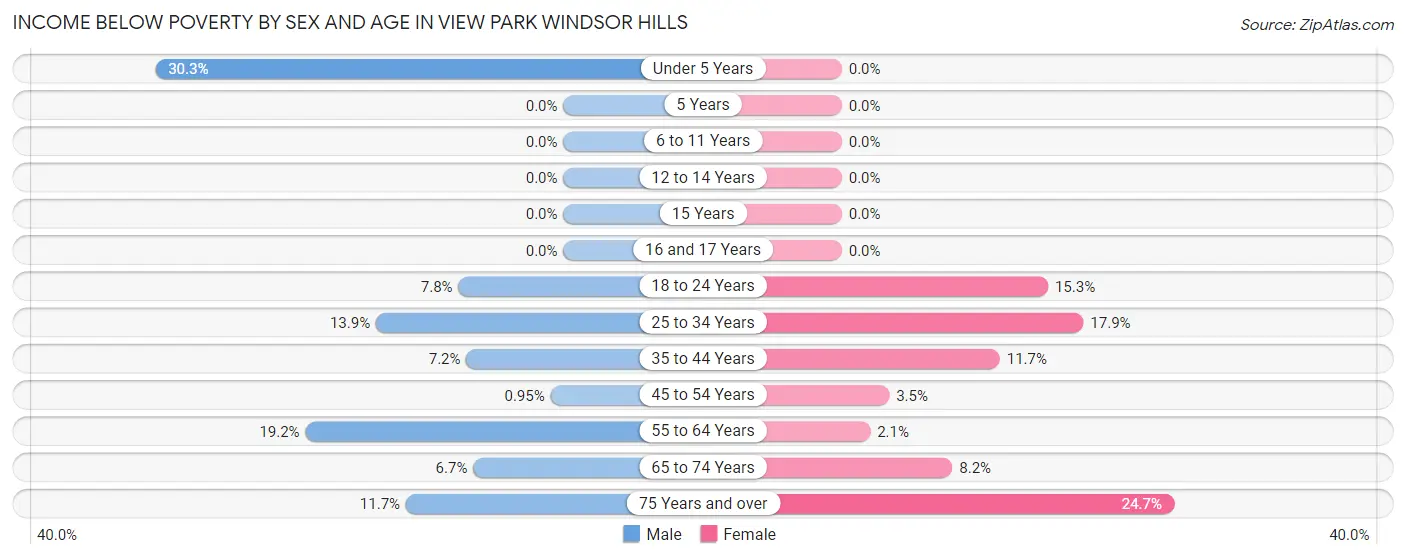
| Age Bracket | Male | Female |
| Under 5 Years | 80 (30.3%) | 0 (0.0%) |
| 5 Years | 0 (0.0%) | 0 (0.0%) |
| 6 to 11 Years | 0 (0.0%) | 0 (0.0%) |
| 12 to 14 Years | 0 (0.0%) | 0 (0.0%) |
| 15 Years | 0 (0.0%) | 0 (0.0%) |
| 16 and 17 Years | 0 (0.0%) | 0 (0.0%) |
| 18 to 24 Years | 24 (7.8%) | 49 (15.3%) |
| 25 to 34 Years | 107 (13.9%) | 106 (17.9%) |
| 35 to 44 Years | 63 (7.2%) | 87 (11.7%) |
| 45 to 54 Years | 7 (0.9%) | 31 (3.5%) |
| 55 to 64 Years | 144 (19.2%) | 26 (2.1%) |
| 65 to 74 Years | 41 (6.7%) | 61 (8.2%) |
| 75 Years and over | 74 (11.7%) | 212 (24.6%) |
| Total | 540 (9.5%) | 572 (9.2%) |
Income Above Poverty by Sex and Age in View Park Windsor Hills
According to the poverty statistics in View Park Windsor Hills, males aged 5 years and females aged under 5 years are the age groups that are most secure financially, with 100.0% of males and 100.0% of females in these age groups living above the poverty line.
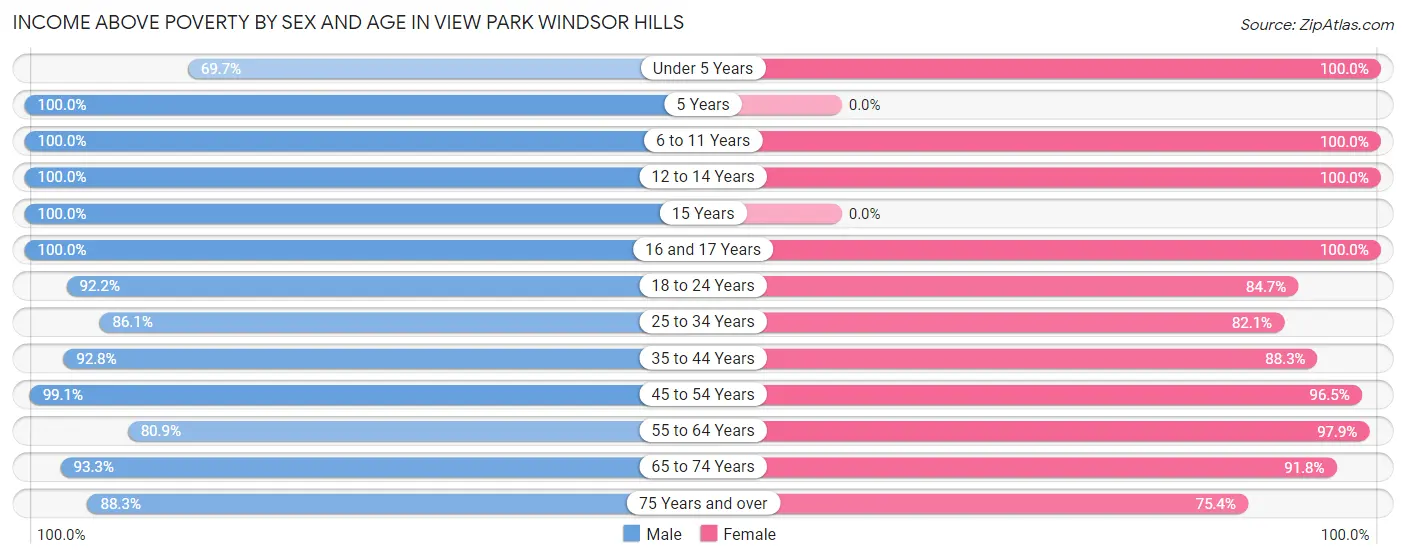
| Age Bracket | Male | Female |
| Under 5 Years | 184 (69.7%) | 258 (100.0%) |
| 5 Years | 13 (100.0%) | 0 (0.0%) |
| 6 to 11 Years | 493 (100.0%) | 302 (100.0%) |
| 12 to 14 Years | 131 (100.0%) | 192 (100.0%) |
| 15 Years | 47 (100.0%) | 0 (0.0%) |
| 16 and 17 Years | 79 (100.0%) | 106 (100.0%) |
| 18 to 24 Years | 284 (92.2%) | 271 (84.7%) |
| 25 to 34 Years | 662 (86.1%) | 485 (82.1%) |
| 35 to 44 Years | 812 (92.8%) | 655 (88.3%) |
| 45 to 54 Years | 728 (99.1%) | 849 (96.5%) |
| 55 to 64 Years | 608 (80.8%) | 1,207 (97.9%) |
| 65 to 74 Years | 572 (93.3%) | 682 (91.8%) |
| 75 Years and over | 559 (88.3%) | 648 (75.3%) |
| Total | 5,172 (90.5%) | 5,655 (90.8%) |
Income Below Poverty Among Married-Couple Families in View Park Windsor Hills
The poverty statistics for married-couple families in View Park Windsor Hills show that 1.6% or 35 of the total 2,151 families live below the poverty line. Families with no children have the highest poverty rate of 2.6%, comprising of 35 families. On the other hand, families with 1 or 2 children have the lowest poverty rate of 0.0%, which includes 0 families.
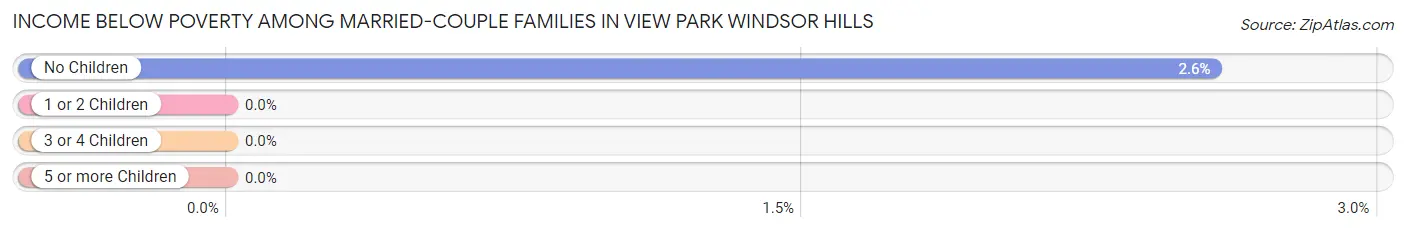
| Children | Above Poverty | Below Poverty |
| No Children | 1,329 (97.4%) | 35 (2.6%) |
| 1 or 2 Children | 787 (100.0%) | 0 (0.0%) |
| 3 or 4 Children | 0 (0.0%) | 0 (0.0%) |
| 5 or more Children | 0 (0.0%) | 0 (0.0%) |
| Total | 2,116 (98.4%) | 35 (1.6%) |
Income Below Poverty Among Single-Parent Households in View Park Windsor Hills
According to the poverty data in View Park Windsor Hills, 32.7% or 92 single-father households and 6.5% or 42 single-mother households are living below the poverty line. Among single-father households, those with 1 or 2 children have the highest poverty rate, with 70 households (59.8%) experiencing poverty. Likewise, among single-mother households, those with no children have the highest poverty rate, with 42 households (10.5%) falling below the poverty line.
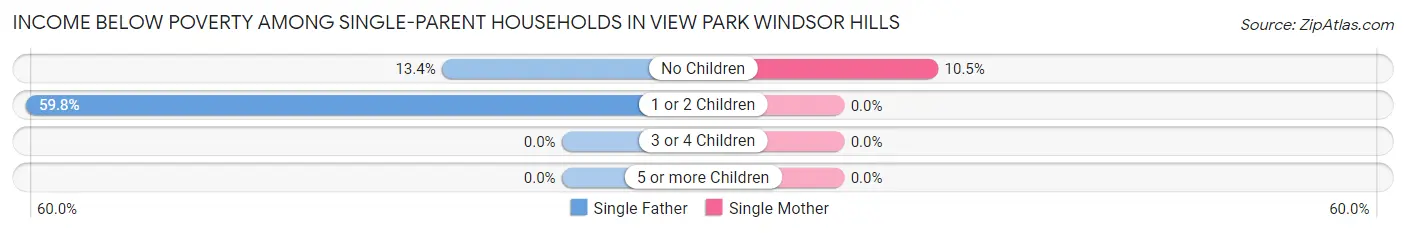
| Children | Single Father | Single Mother |
| No Children | 22 (13.4%) | 42 (10.5%) |
| 1 or 2 Children | 70 (59.8%) | 0 (0.0%) |
| 3 or 4 Children | 0 (0.0%) | 0 (0.0%) |
| 5 or more Children | 0 (0.0%) | 0 (0.0%) |
| Total | 92 (32.7%) | 42 (6.5%) |
Income Below Poverty Among Married-Couple vs Single-Parent Households in View Park Windsor Hills
The poverty data for View Park Windsor Hills shows that 35 of the married-couple family households (1.6%) and 134 of the single-parent households (14.4%) are living below the poverty level. Within the married-couple family households, those with no children have the highest poverty rate, with 35 households (2.6%) falling below the poverty line. Among the single-parent households, those with 1 or 2 children have the highest poverty rate, with 70 household (22.4%) living below poverty.
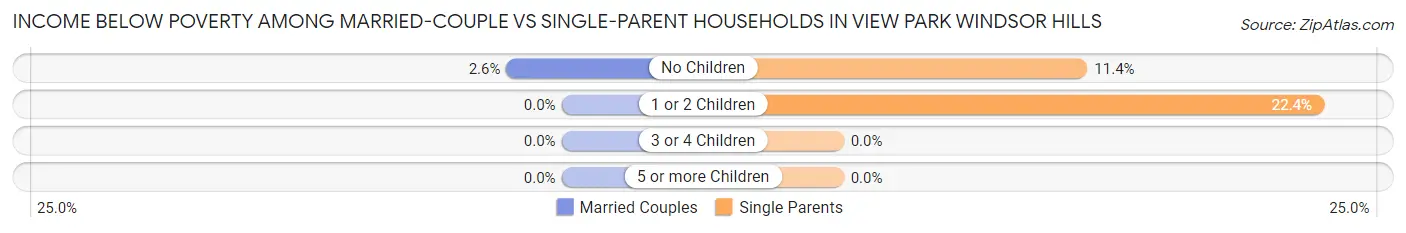
| Children | Married-Couple Families | Single-Parent Households |
| No Children | 35 (2.6%) | 64 (11.4%) |
| 1 or 2 Children | 0 (0.0%) | 70 (22.4%) |
| 3 or 4 Children | 0 (0.0%) | 0 (0.0%) |
| 5 or more Children | 0 (0.0%) | 0 (0.0%) |
| Total | 35 (1.6%) | 134 (14.4%) |
Race in View Park Windsor Hills
The most populous races in View Park Windsor Hills are Black / African American (8,846 | 73.7%), White / Caucasian (1,430 | 11.9%), and Hispanic or Latino (913 | 7.6%).
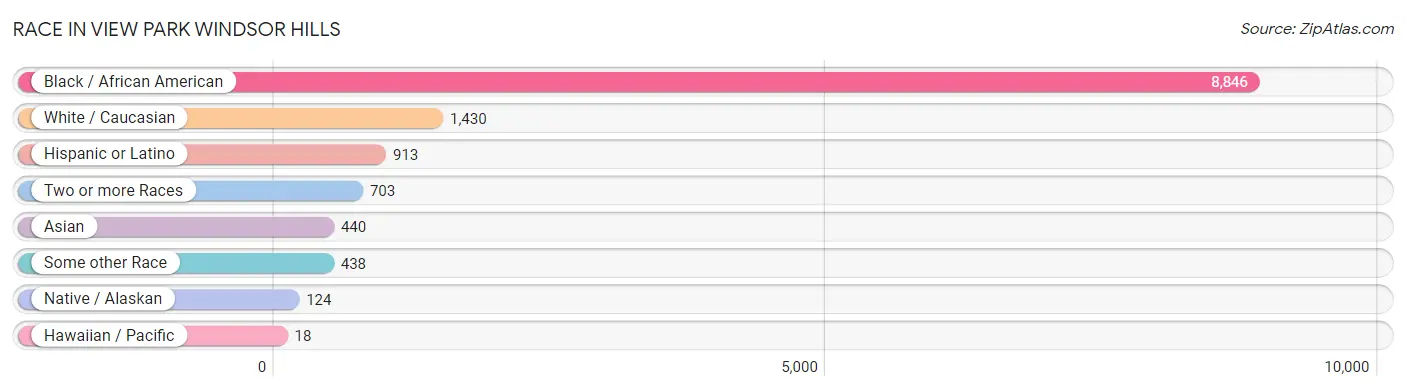
| Race | # Population | % Population |
| Asian | 440 | 3.7% |
| Black / African American | 8,846 | 73.7% |
| Hawaiian / Pacific | 18 | 0.2% |
| Hispanic or Latino | 913 | 7.6% |
| Native / Alaskan | 124 | 1.0% |
| White / Caucasian | 1,430 | 11.9% |
| Two or more Races | 703 | 5.9% |
| Some other Race | 438 | 3.6% |
| Total | 11,999 | 100.0% |
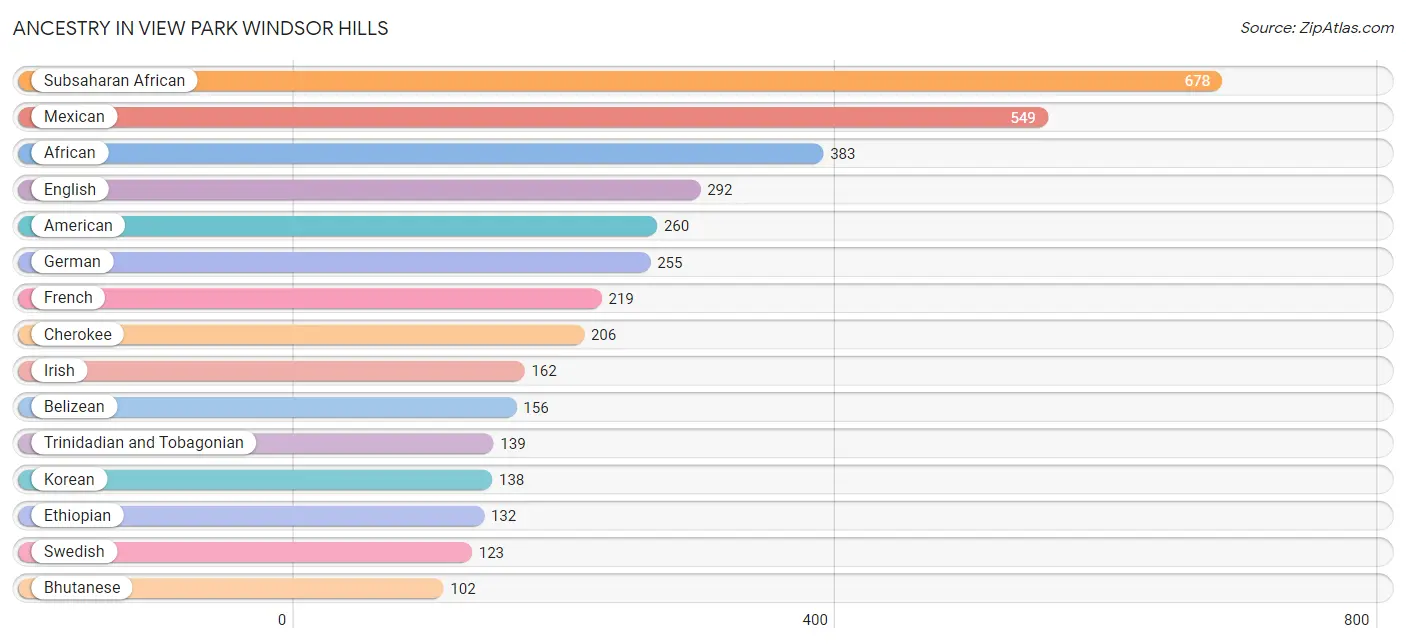
Ancestry in View Park Windsor Hills
The most populous ancestries reported in View Park Windsor Hills are Subsaharan African (678 | 5.7%), Mexican (549 | 4.6%), African (383 | 3.2%), English (292 | 2.4%), and American (260 | 2.2%), together accounting for 18.0% of all View Park Windsor Hills residents.
| Ancestry | # Population | % Population |
| African | 383 | 3.2% |
| American | 260 | 2.2% |
| Armenian | 2 | 0.0% |
| Austrian | 21 | 0.2% |
| Barbadian | 68 | 0.6% |
| Basque | 31 | 0.3% |
| Belizean | 156 | 1.3% |
| Bhutanese | 102 | 0.9% |
| Blackfeet | 7 | 0.1% |
| Burmese | 91 | 0.8% |
| Canadian | 22 | 0.2% |
| Central American | 93 | 0.8% |
| Cherokee | 206 | 1.7% |
| Colombian | 72 | 0.6% |
| Cuban | 80 | 0.7% |
| Czech | 1 | 0.0% |
| Dutch | 19 | 0.2% |
| English | 292 | 2.4% |
| Ethiopian | 132 | 1.1% |
| French | 219 | 1.8% |
| German | 255 | 2.1% |
| Guatemalan | 66 | 0.5% |
| Guyanese | 16 | 0.1% |
| Honduran | 27 | 0.2% |
| Indian (Asian) | 93 | 0.8% |
| Irish | 162 | 1.3% |
| Italian | 88 | 0.7% |
| Jamaican | 99 | 0.8% |
| Korean | 138 | 1.1% |
| Lithuanian | 18 | 0.2% |
| Mexican | 549 | 4.6% |
| Mexican American Indian | 34 | 0.3% |
| Native Hawaiian | 18 | 0.2% |
| Nigerian | 21 | 0.2% |
| Northern European | 17 | 0.1% |
| Norwegian | 17 | 0.1% |
| Pakistani | 92 | 0.8% |
| Portuguese | 36 | 0.3% |
| Romanian | 18 | 0.2% |
| Russian | 17 | 0.1% |
| Scandinavian | 15 | 0.1% |
| Scotch-Irish | 42 | 0.4% |
| Scottish | 44 | 0.4% |
| Sioux | 36 | 0.3% |
| South American | 72 | 0.6% |
| Spaniard | 98 | 0.8% |
| Sri Lankan | 83 | 0.7% |
| Subsaharan African | 678 | 5.7% |
| Swedish | 123 | 1.0% |
| Thai | 13 | 0.1% |
| Trinidadian and Tobagonian | 139 | 1.2% |
| Ukrainian | 17 | 0.1% |
| West Indian | 46 | 0.4% | View All 53 Rows |
Immigrants in View Park Windsor Hills
The most numerous immigrant groups reported in View Park Windsor Hills came from Latin America (534 | 4.4%), Caribbean (276 | 2.3%), Asia (159 | 1.3%), Central America (155 | 1.3%), and Trinidad and Tobago (147 | 1.2%), together accounting for 10.6% of all View Park Windsor Hills residents.
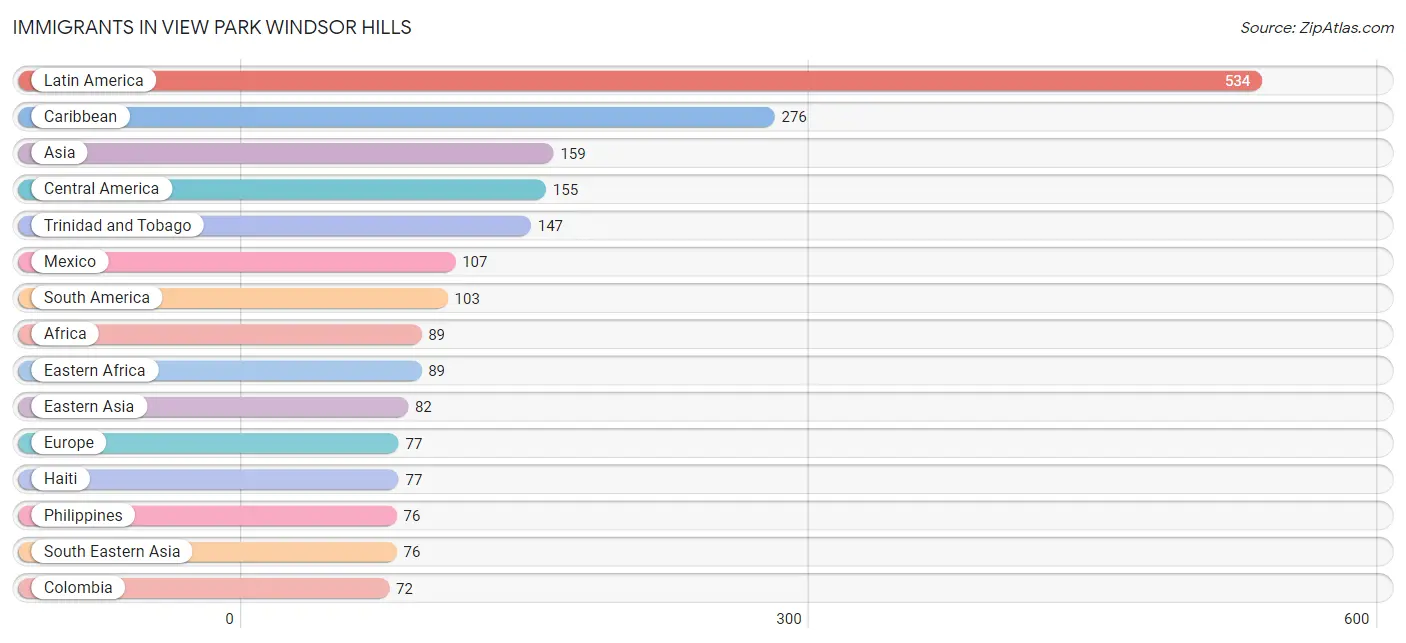
| Immigration Origin | # Population | % Population |
| Africa | 89 | 0.7% |
| Armenia | 1 | 0.0% |
| Asia | 159 | 1.3% |
| Austria | 21 | 0.2% |
| Barbados | 52 | 0.4% |
| Belize | 48 | 0.4% |
| Caribbean | 276 | 2.3% |
| Central America | 155 | 1.3% |
| China | 43 | 0.4% |
| Colombia | 72 | 0.6% |
| Eastern Africa | 89 | 0.7% |
| Eastern Asia | 82 | 0.7% |
| Eastern Europe | 17 | 0.1% |
| England | 19 | 0.2% |
| Eritrea | 63 | 0.5% |
| Ethiopia | 26 | 0.2% |
| Europe | 77 | 0.6% |
| Haiti | 77 | 0.6% |
| Italy | 20 | 0.2% |
| Japan | 25 | 0.2% |
| Korea | 14 | 0.1% |
| Latin America | 534 | 4.4% |
| Mexico | 107 | 0.9% |
| Northern Europe | 19 | 0.2% |
| Peru | 31 | 0.3% |
| Philippines | 76 | 0.6% |
| Russia | 17 | 0.1% |
| South America | 103 | 0.9% |
| South Eastern Asia | 76 | 0.6% |
| Southern Europe | 20 | 0.2% |
| Trinidad and Tobago | 147 | 1.2% |
| Western Asia | 1 | 0.0% |
| Western Europe | 21 | 0.2% | View All 33 Rows |
Sex and Age in View Park Windsor Hills
Sex and Age in View Park Windsor Hills
The most populous age groups in View Park Windsor Hills are 60 to 64 Years (524 | 9.1%) for men and 60 to 64 Years (723 | 11.6%) for women.
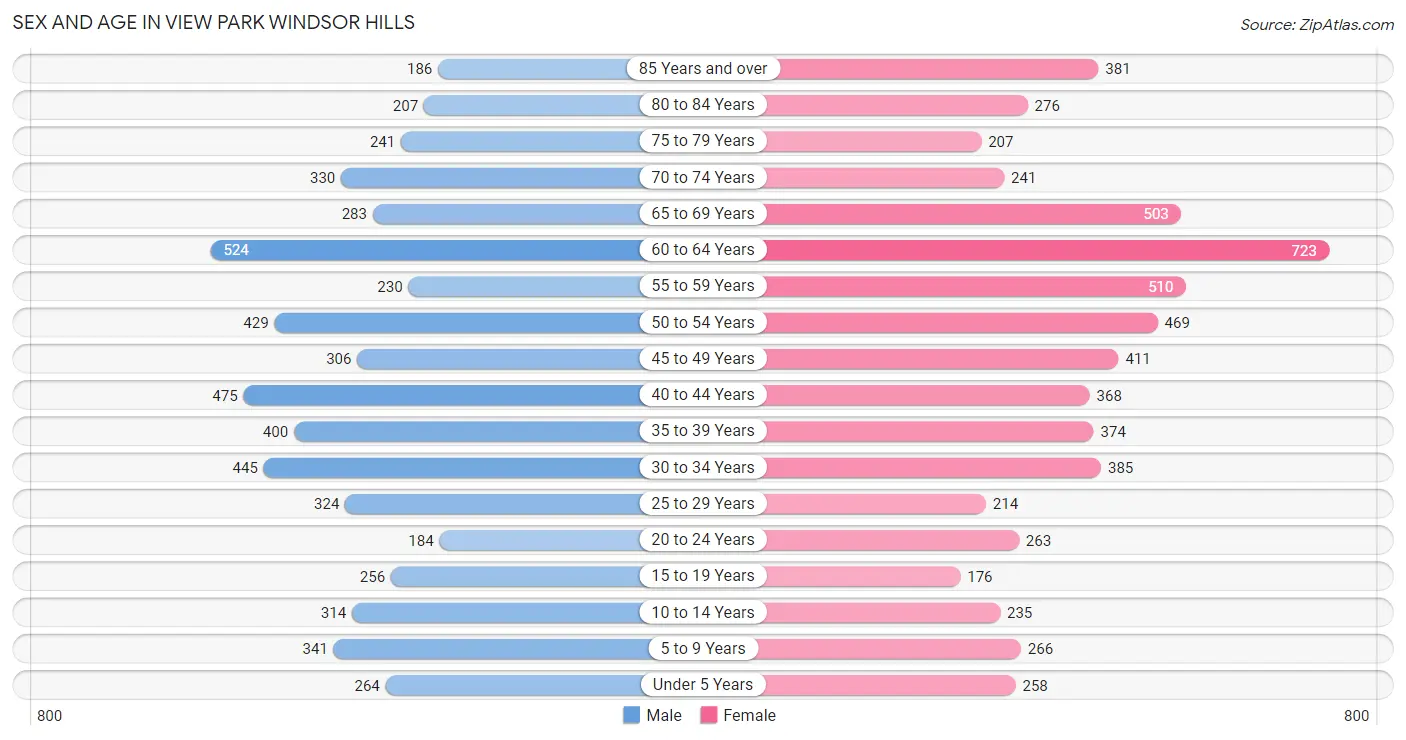
| Age Bracket | Male | Female |
| Under 5 Years | 264 (4.6%) | 258 (4.1%) |
| 5 to 9 Years | 341 (5.9%) | 266 (4.3%) |
| 10 to 14 Years | 314 (5.5%) | 235 (3.7%) |
| 15 to 19 Years | 256 (4.5%) | 176 (2.8%) |
| 20 to 24 Years | 184 (3.2%) | 263 (4.2%) |
| 25 to 29 Years | 324 (5.7%) | 214 (3.4%) |
| 30 to 34 Years | 445 (7.7%) | 385 (6.1%) |
| 35 to 39 Years | 400 (7.0%) | 374 (6.0%) |
| 40 to 44 Years | 475 (8.3%) | 368 (5.9%) |
| 45 to 49 Years | 306 (5.3%) | 411 (6.6%) |
| 50 to 54 Years | 429 (7.5%) | 469 (7.5%) |
| 55 to 59 Years | 230 (4.0%) | 510 (8.2%) |
| 60 to 64 Years | 524 (9.1%) | 723 (11.6%) |
| 65 to 69 Years | 283 (4.9%) | 503 (8.0%) |
| 70 to 74 Years | 330 (5.8%) | 241 (3.8%) |
| 75 to 79 Years | 241 (4.2%) | 207 (3.3%) |
| 80 to 84 Years | 207 (3.6%) | 276 (4.4%) |
| 85 Years and over | 186 (3.2%) | 381 (6.1%) |
| Total | 5,739 (100.0%) | 6,260 (100.0%) |
Families and Households in View Park Windsor Hills
Median Family Size in View Park Windsor Hills
The median family size in View Park Windsor Hills is 3.00 persons per family, with single female/mother families (651 | 21.1%) accounting for the largest median family size of 3.53 persons per family. On the other hand, married-couple families (2,151 | 69.8%) represent the smallest median family size with 2.83 persons per family.
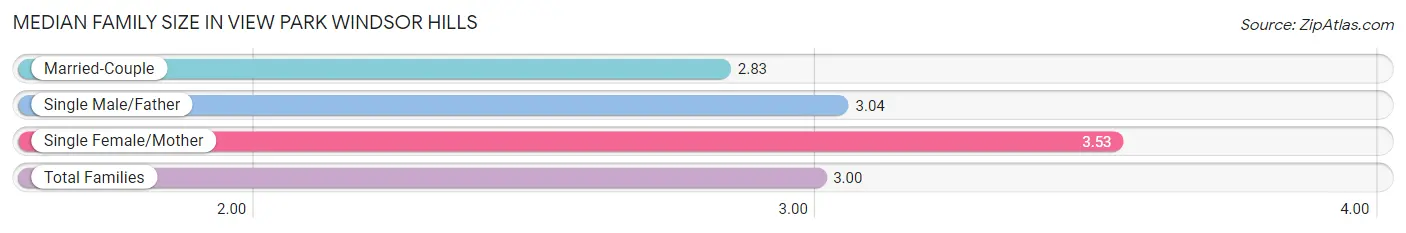
| Family Type | # Families | Family Size |
| Married-Couple | 2,151 (69.8%) | 2.83 |
| Single Male/Father | 281 (9.1%) | 3.04 |
| Single Female/Mother | 651 (21.1%) | 3.53 |
| Total Families | 3,083 (100.0%) | 3.00 |
Median Household Size in View Park Windsor Hills
The median household size in View Park Windsor Hills is 2.42 persons per household, with single female/mother households (651 | 13.3%) accounting for the largest median household size of 3.57 persons per household. non-family households (1,828 | 37.2%) represent the smallest median household size with 1.31 persons per household.
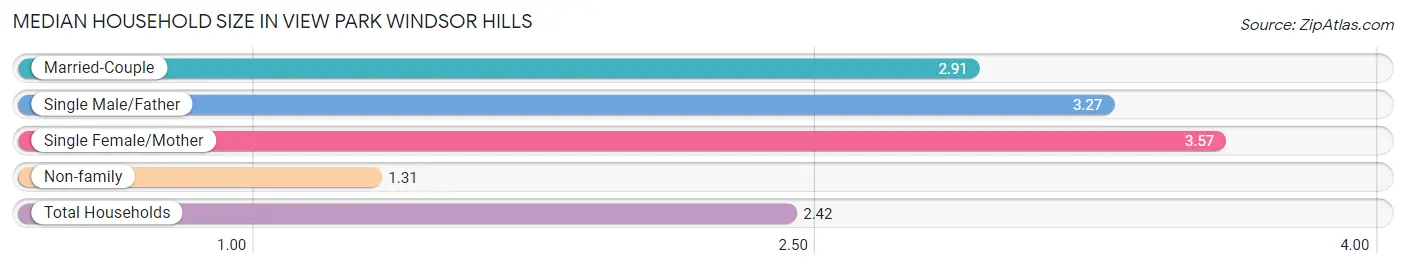
| Household Type | # Households | Household Size |
| Married-Couple | 2,151 (43.8%) | 2.91 |
| Single Male/Father | 281 (5.7%) | 3.27 |
| Single Female/Mother | 651 (13.3%) | 3.57 |
| Non-family | 1,828 (37.2%) | 1.31 |
| Total Households | 4,911 (100.0%) | 2.42 |
Household Size by Marriage Status in View Park Windsor Hills
Out of a total of 4,911 households in View Park Windsor Hills, 3,083 (62.8%) are family households, while 1,828 (37.2%) are nonfamily households. The most numerous type of family households are 2-person households, comprising 1,492, and the most common type of nonfamily households are 1-person households, comprising 1,436.
| Household Size | Family Households | Nonfamily Households |
| 1-Person Households | - | 1,436 (29.2%) |
| 2-Person Households | 1,492 (30.4%) | 310 (6.3%) |
| 3-Person Households | 718 (14.6%) | 65 (1.3%) |
| 4-Person Households | 606 (12.3%) | 17 (0.4%) |
| 5-Person Households | 227 (4.6%) | 0 (0.0%) |
| 6-Person Households | 24 (0.5%) | 0 (0.0%) |
| 7+ Person Households | 16 (0.3%) | 0 (0.0%) |
| Total | 3,083 (62.8%) | 1,828 (37.2%) |
Female Fertility in View Park Windsor Hills
Fertility by Age in View Park Windsor Hills
Average fertility rate in View Park Windsor Hills is 35.0 births per 1,000 women. Women in the age bracket of 20 to 34 years have the highest fertility rate with 77.0 births per 1,000 women. Women in the age bracket of 20 to 34 years acount for 82.5% of all women with births.
| Age Bracket | Women with Births | Births / 1,000 Women |
| 15 to 19 years | 0 (0.0%) | 0.0 |
| 20 to 34 years | 66 (82.5%) | 77.0 |
| 35 to 50 years | 14 (17.5%) | 11.0 |
| Total | 80 (100.0%) | 35.0 |
Fertility by Age by Marriage Status in View Park Windsor Hills
| Age Bracket | Married | Unmarried |
| 15 to 19 years | 0 (0.0%) | 0 (0.0%) |
| 20 to 34 years | 66 (100.0%) | 0 (0.0%) |
| 35 to 50 years | 14 (100.0%) | 0 (0.0%) |
| Total | 80 (100.0%) | 0 (0.0%) |
Fertility by Education in View Park Windsor Hills
| Educational Attainment | Women with Births | Births / 1,000 Women |
| Less than High School | 0 (0.0%) | 0.0 |
| High School Diploma | 0 (0.0%) | 0.0 |
| College or Associate's Degree | 0 (0.0%) | 0.0 |
| Bachelor's Degree | 14 (17.5%) | 17.0 |
| Graduate Degree | 66 (82.5%) | 153.0 |
| Total | 80 (100.0%) | 35.0 |
Fertility by Education by Marriage Status in View Park Windsor Hills
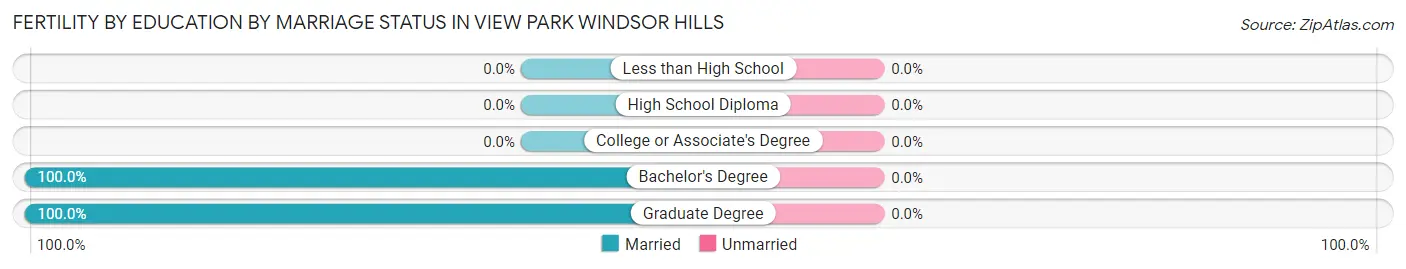
| Educational Attainment | Married | Unmarried |
| Less than High School | 0 (0.0%) | 0 (0.0%) |
| High School Diploma | 0 (0.0%) | 0 (0.0%) |
| College or Associate's Degree | 0 (0.0%) | 0 (0.0%) |
| Bachelor's Degree | 14 (100.0%) | 0 (0.0%) |
| Graduate Degree | 66 (100.0%) | 0 (0.0%) |
| Total | 80 (100.0%) | 0 (0.0%) |
Employment Characteristics in View Park Windsor Hills
Employment by Class of Employer in View Park Windsor Hills
Among the 5,161 employed individuals in View Park Windsor Hills, private company employees (2,444 | 47.4%), local government employees (1,030 | 20.0%), and not-for-profit organizations (421 | 8.2%) make up the most common classes of employment.
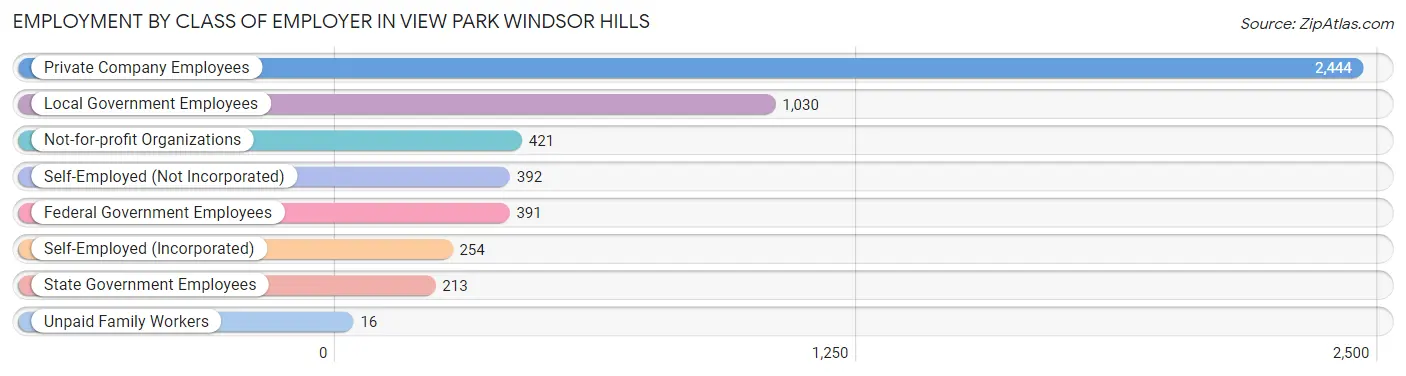
| Employer Class | # Employees | % Employees |
| Private Company Employees | 2,444 | 47.4% |
| Self-Employed (Incorporated) | 254 | 4.9% |
| Self-Employed (Not Incorporated) | 392 | 7.6% |
| Not-for-profit Organizations | 421 | 8.2% |
| Local Government Employees | 1,030 | 20.0% |
| State Government Employees | 213 | 4.1% |
| Federal Government Employees | 391 | 7.6% |
| Unpaid Family Workers | 16 | 0.3% |
| Total | 5,161 | 100.0% |
Employment Status by Age in View Park Windsor Hills
According to the labor force statistics for View Park Windsor Hills, out of the total population over 16 years of age (10,274), 60.4% or 6,205 individuals are in the labor force, with 11.3% or 701 of them unemployed. The age group with the highest labor force participation rate is 55 to 59 years, with 89.5% or 662 individuals in the labor force. Within the labor force, the 16 to 19 years age range has the highest percentage of unemployed individuals, with 96.1% or 49 of them being unemployed.
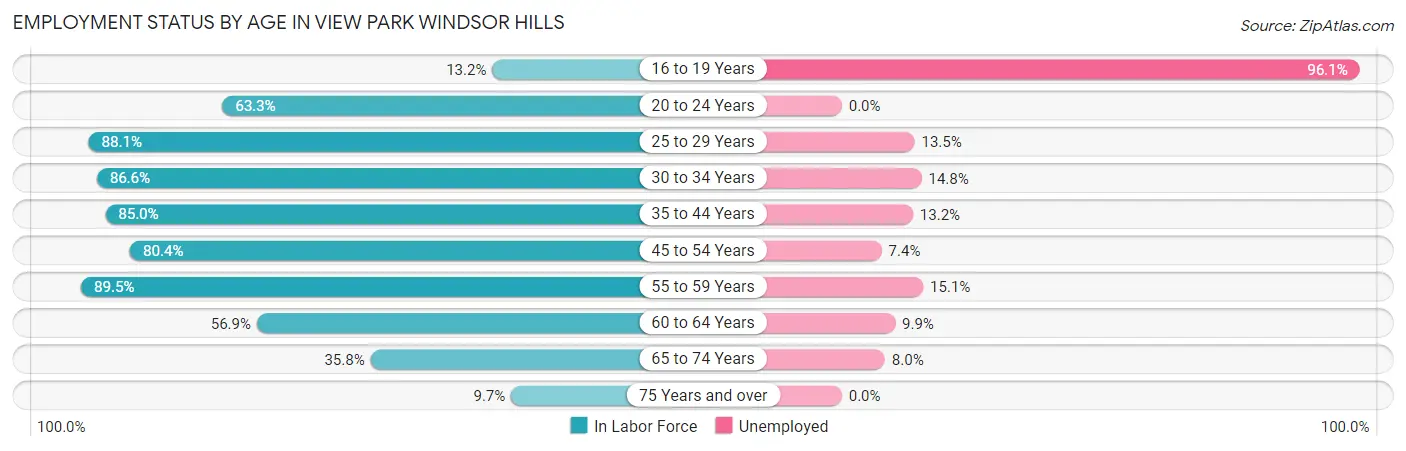
| Age Bracket | In Labor Force | Unemployed |
| 16 to 19 Years | 51 (13.2%) | 49 (96.1%) |
| 20 to 24 Years | 283 (63.3%) | 0 (0.0%) |
| 25 to 29 Years | 474 (88.1%) | 64 (13.5%) |
| 30 to 34 Years | 719 (86.6%) | 106 (14.8%) |
| 35 to 44 Years | 1,374 (85.0%) | 181 (13.2%) |
| 45 to 54 Years | 1,298 (80.4%) | 96 (7.4%) |
| 55 to 59 Years | 662 (89.5%) | 100 (15.1%) |
| 60 to 64 Years | 710 (56.9%) | 70 (9.9%) |
| 65 to 74 Years | 486 (35.8%) | 39 (8.0%) |
| 75 Years and over | 145 (9.7%) | 0 (0.0%) |
| Total | 6,205 (60.4%) | 701 (11.3%) |
Employment Status by Educational Attainment in View Park Windsor Hills
According to labor force statistics for View Park Windsor Hills, 79.5% of individuals (5,237) out of the total population between 25 and 64 years of age (6,587) are in the labor force, with 11.8% or 618 of them being unemployed. The group with the highest labor force participation rate are those with the educational attainment of less than high school, with 92.2% or 118 individuals in the labor force. Within the labor force, individuals with less than high school education have the highest percentage of unemployment, with 85.6% or 101 of them being unemployed.
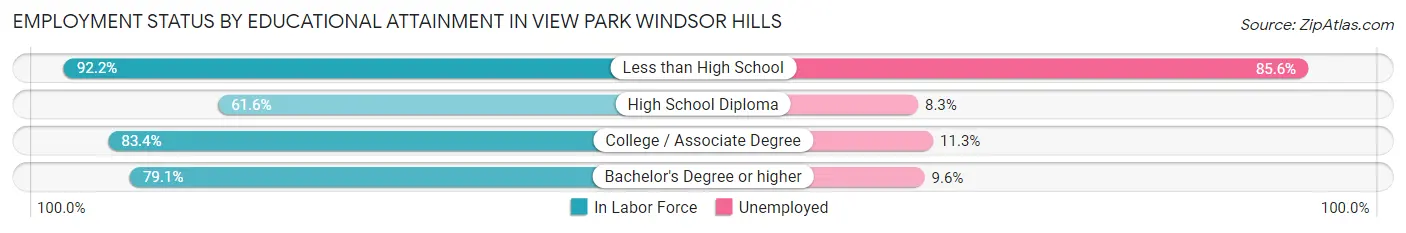
| Educational Attainment | In Labor Force | Unemployed |
| Less than High School | 118 (92.2%) | 110 (85.6%) |
| High School Diploma | 241 (61.6%) | 32 (8.3%) |
| College / Associate Degree | 1,495 (83.4%) | 203 (11.3%) |
| Bachelor's Degree or higher | 3,382 (79.1%) | 410 (9.6%) |
| Total | 5,237 (79.5%) | 777 (11.8%) |
Employment Occupations by Sex in View Park Windsor Hills
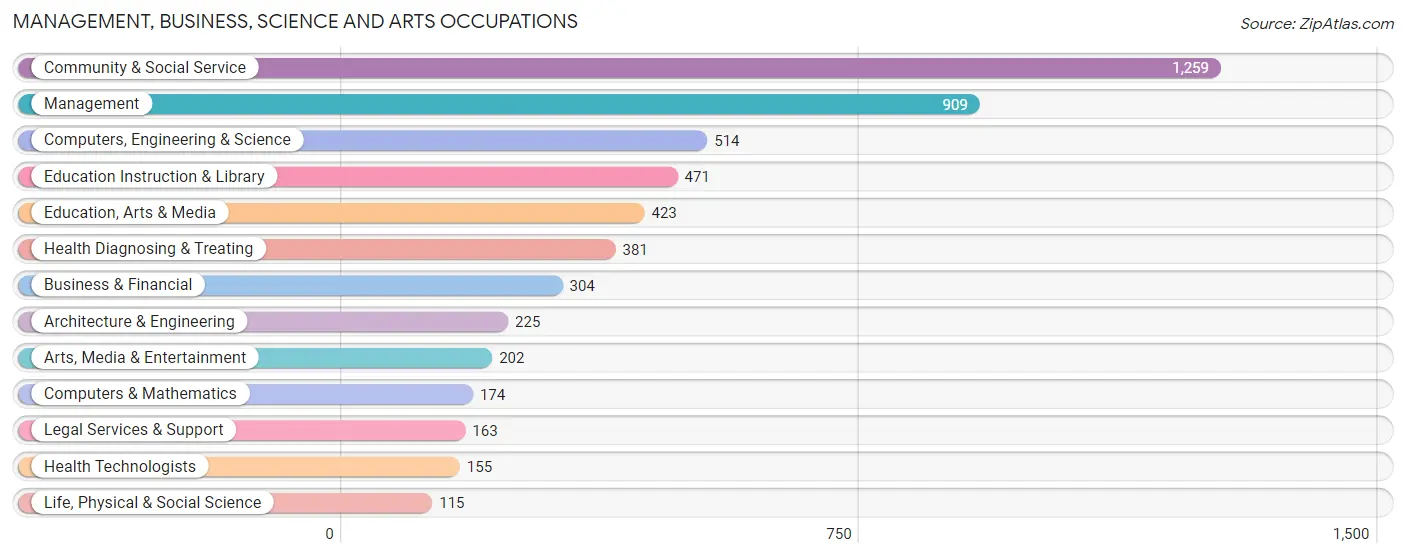
Management, Business, Science and Arts Occupations
The most common Management, Business, Science and Arts occupations in View Park Windsor Hills are Community & Social Service (1,259 | 23.1%), Management (909 | 16.7%), Computers, Engineering & Science (514 | 9.4%), Education Instruction & Library (471 | 8.6%), and Education, Arts & Media (423 | 7.8%).
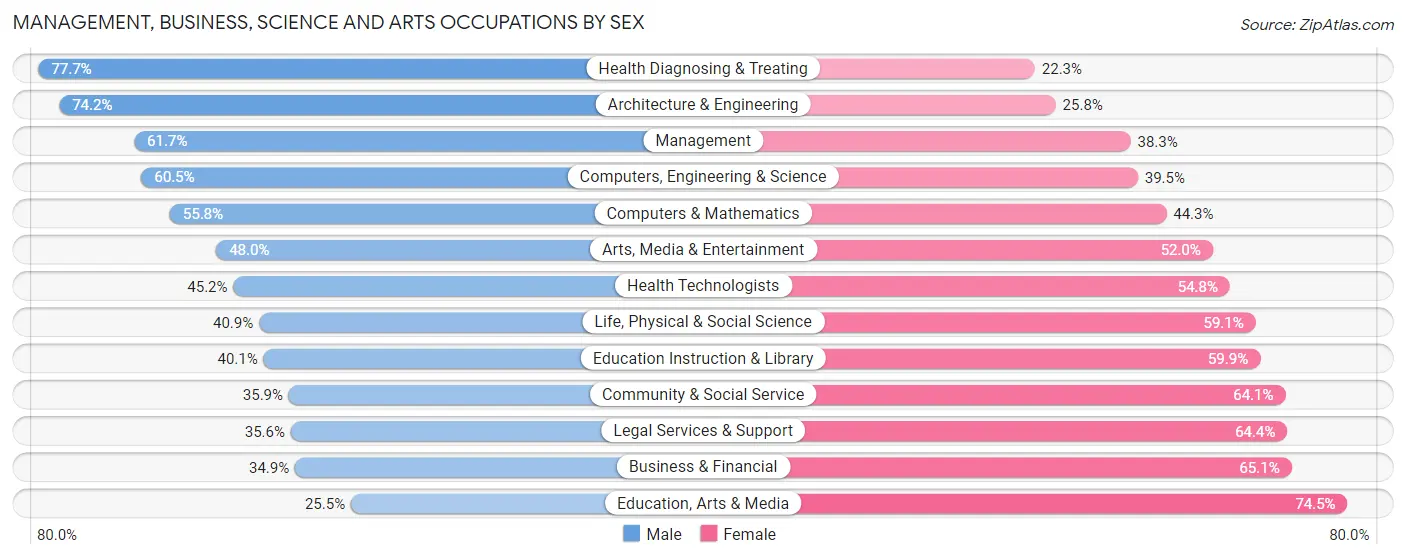
Management, Business, Science and Arts Occupations by Sex
Within the Management, Business, Science and Arts occupations in View Park Windsor Hills, the most male-oriented occupations are Health Diagnosing & Treating (77.7%), Architecture & Engineering (74.2%), and Management (61.7%), while the most female-oriented occupations are Education, Arts & Media (74.5%), Business & Financial (65.1%), and Legal Services & Support (64.4%).
| Occupation | Male | Female |
| Management | 561 (61.7%) | 348 (38.3%) |
| Business & Financial | 106 (34.9%) | 198 (65.1%) |
| Computers, Engineering & Science | 311 (60.5%) | 203 (39.5%) |
| Computers & Mathematics | 97 (55.7%) | 77 (44.3%) |
| Architecture & Engineering | 167 (74.2%) | 58 (25.8%) |
| Life, Physical & Social Science | 47 (40.9%) | 68 (59.1%) |
| Community & Social Service | 452 (35.9%) | 807 (64.1%) |
| Education, Arts & Media | 108 (25.5%) | 315 (74.5%) |
| Legal Services & Support | 58 (35.6%) | 105 (64.4%) |
| Education Instruction & Library | 189 (40.1%) | 282 (59.9%) |
| Arts, Media & Entertainment | 97 (48.0%) | 105 (52.0%) |
| Health Diagnosing & Treating | 296 (77.7%) | 85 (22.3%) |
| Health Technologists | 70 (45.2%) | 85 (54.8%) |
| Total (Category) | 1,726 (51.3%) | 1,641 (48.7%) |
| Total (Overall) | 2,862 (52.6%) | 2,581 (47.4%) |
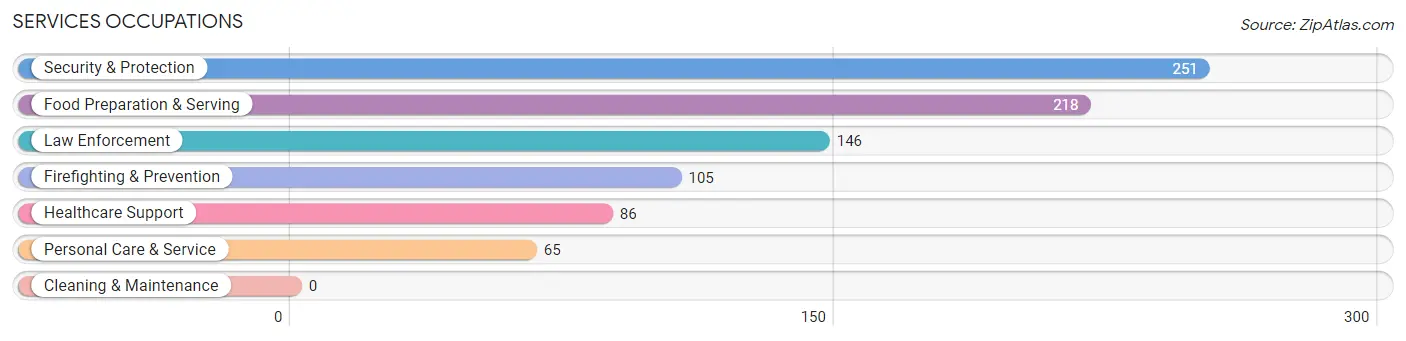
Services Occupations
The most common Services occupations in View Park Windsor Hills are Security & Protection (251 | 4.6%), Food Preparation & Serving (218 | 4.0%), Law Enforcement (146 | 2.7%), Firefighting & Prevention (105 | 1.9%), and Healthcare Support (86 | 1.6%).
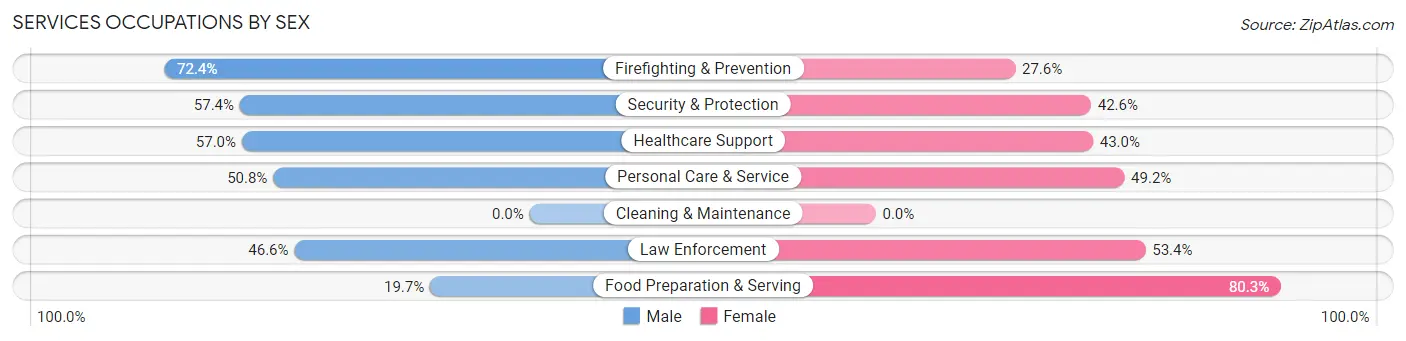
Services Occupations by Sex
Within the Services occupations in View Park Windsor Hills, the most male-oriented occupations are Firefighting & Prevention (72.4%), Security & Protection (57.4%), and Healthcare Support (57.0%), while the most female-oriented occupations are Food Preparation & Serving (80.3%), Law Enforcement (53.4%), and Personal Care & Service (49.2%).
| Occupation | Male | Female |
| Healthcare Support | 49 (57.0%) | 37 (43.0%) |
| Security & Protection | 144 (57.4%) | 107 (42.6%) |
| Firefighting & Prevention | 76 (72.4%) | 29 (27.6%) |
| Law Enforcement | 68 (46.6%) | 78 (53.4%) |
| Food Preparation & Serving | 43 (19.7%) | 175 (80.3%) |
| Cleaning & Maintenance | 0 (0.0%) | 0 (0.0%) |
| Personal Care & Service | 33 (50.8%) | 32 (49.2%) |
| Total (Category) | 269 (43.4%) | 351 (56.6%) |
| Total (Overall) | 2,862 (52.6%) | 2,581 (47.4%) |
Sales and Office Occupations
The most common Sales and Office occupations in View Park Windsor Hills are Office & Administration (712 | 13.1%), and Sales & Related (474 | 8.7%).
Sales and Office Occupations by Sex
| Occupation | Male | Female |
| Sales & Related | 268 (56.5%) | 206 (43.5%) |
| Office & Administration | 329 (46.2%) | 383 (53.8%) |
| Total (Category) | 597 (50.3%) | 589 (49.7%) |
| Total (Overall) | 2,862 (52.6%) | 2,581 (47.4%) |
Natural Resources, Construction and Maintenance Occupations
The most common Natural Resources, Construction and Maintenance occupations in View Park Windsor Hills are Installation, Maintenance & Repair (75 | 1.4%), and Construction & Extraction (30 | 0.5%).
Natural Resources, Construction and Maintenance Occupations by Sex
| Occupation | Male | Female |
| Farming, Fishing & Forestry | 0 (0.0%) | 0 (0.0%) |
| Construction & Extraction | 30 (100.0%) | 0 (0.0%) |
| Installation, Maintenance & Repair | 75 (100.0%) | 0 (0.0%) |
| Total (Category) | 105 (100.0%) | 0 (0.0%) |
| Total (Overall) | 2,862 (52.6%) | 2,581 (47.4%) |
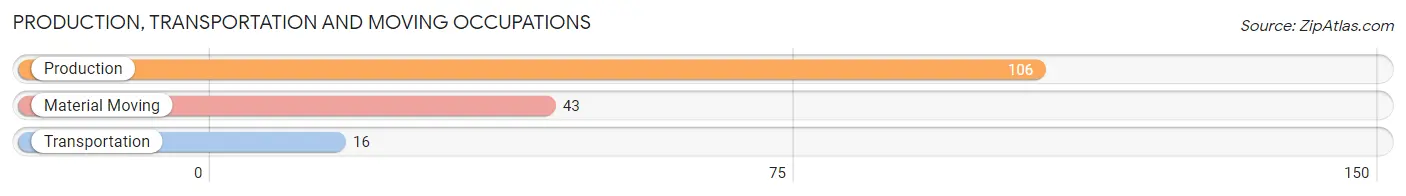
Production, Transportation and Moving Occupations
The most common Production, Transportation and Moving occupations in View Park Windsor Hills are Production (106 | 1.9%), Material Moving (43 | 0.8%), and Transportation (16 | 0.3%).
Production, Transportation and Moving Occupations by Sex
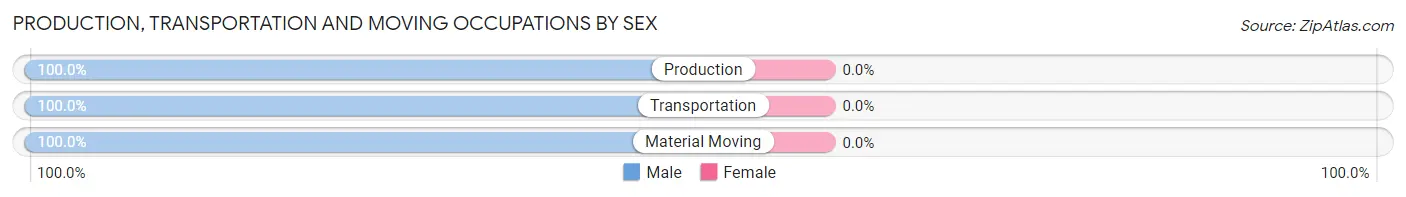
| Occupation | Male | Female |
| Production | 106 (100.0%) | 0 (0.0%) |
| Transportation | 16 (100.0%) | 0 (0.0%) |
| Material Moving | 43 (100.0%) | 0 (0.0%) |
| Total (Category) | 165 (100.0%) | 0 (0.0%) |
| Total (Overall) | 2,862 (52.6%) | 2,581 (47.4%) |
Employment Industries by Sex in View Park Windsor Hills
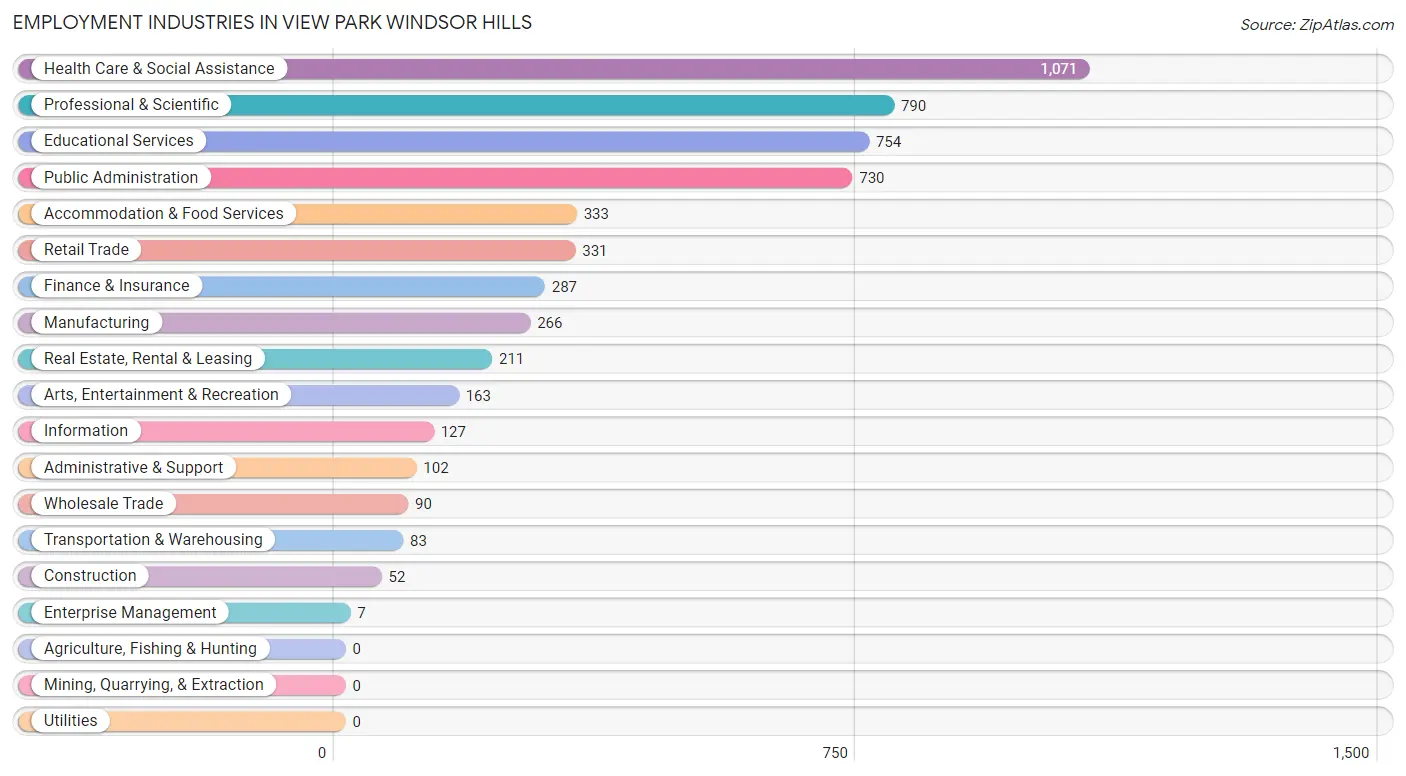
Employment Industries in View Park Windsor Hills
The major employment industries in View Park Windsor Hills include Health Care & Social Assistance (1,071 | 19.7%), Professional & Scientific (790 | 14.5%), Educational Services (754 | 13.9%), Public Administration (730 | 13.4%), and Accommodation & Food Services (333 | 6.1%).
Employment Industries by Sex in View Park Windsor Hills
The View Park Windsor Hills industries that see more men than women are Wholesale Trade (100.0%), Arts, Entertainment & Recreation (86.5%), and Manufacturing (69.2%), whereas the industries that tend to have a higher number of women are Enterprise Management (100.0%), Administrative & Support (100.0%), and Information (81.1%).
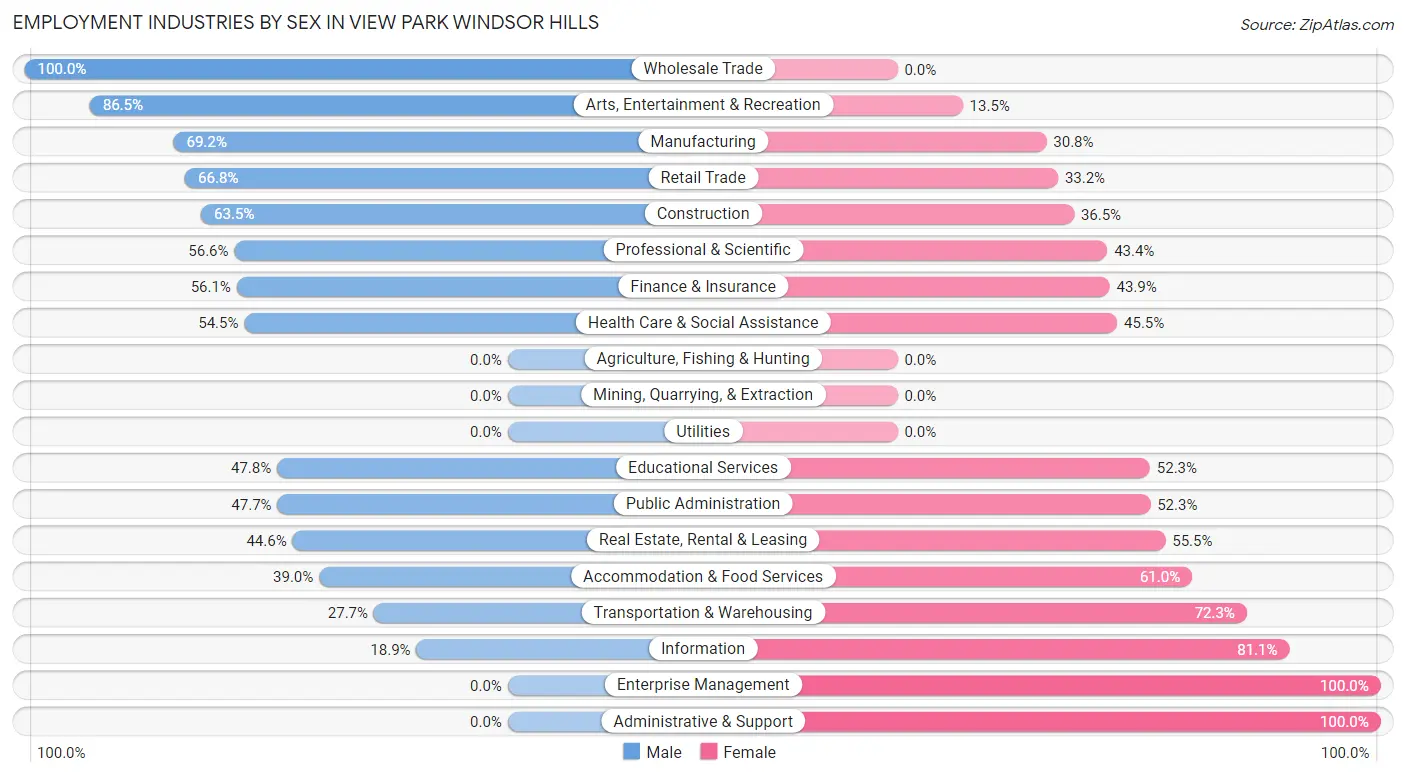
| Industry | Male | Female |
| Agriculture, Fishing & Hunting | 0 (0.0%) | 0 (0.0%) |
| Mining, Quarrying, & Extraction | 0 (0.0%) | 0 (0.0%) |
| Construction | 33 (63.5%) | 19 (36.5%) |
| Manufacturing | 184 (69.2%) | 82 (30.8%) |
| Wholesale Trade | 90 (100.0%) | 0 (0.0%) |
| Retail Trade | 221 (66.8%) | 110 (33.2%) |
| Transportation & Warehousing | 23 (27.7%) | 60 (72.3%) |
| Utilities | 0 (0.0%) | 0 (0.0%) |
| Information | 24 (18.9%) | 103 (81.1%) |
| Finance & Insurance | 161 (56.1%) | 126 (43.9%) |
| Real Estate, Rental & Leasing | 94 (44.6%) | 117 (55.4%) |
| Professional & Scientific | 447 (56.6%) | 343 (43.4%) |
| Enterprise Management | 0 (0.0%) | 7 (100.0%) |
| Administrative & Support | 0 (0.0%) | 102 (100.0%) |
| Educational Services | 360 (47.7%) | 394 (52.2%) |
| Health Care & Social Assistance | 584 (54.5%) | 487 (45.5%) |
| Arts, Entertainment & Recreation | 141 (86.5%) | 22 (13.5%) |
| Accommodation & Food Services | 130 (39.0%) | 203 (61.0%) |
| Public Administration | 348 (47.7%) | 382 (52.3%) |
| Total | 2,862 (52.6%) | 2,581 (47.4%) |
Education in View Park Windsor Hills
School Enrollment in View Park Windsor Hills
The most common levels of schooling among the 2,227 students in View Park Windsor Hills are college / undergraduate (602 | 27.0%), elementary school (525 | 23.6%), and middle school (499 | 22.4%).
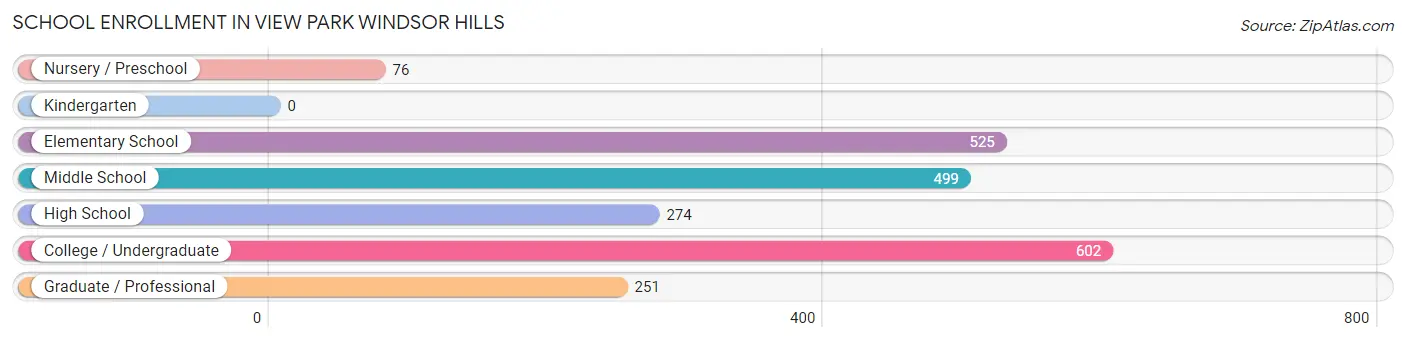
| School Level | # Students | % Students |
| Nursery / Preschool | 76 | 3.4% |
| Kindergarten | 0 | 0.0% |
| Elementary School | 525 | 23.6% |
| Middle School | 499 | 22.4% |
| High School | 274 | 12.3% |
| College / Undergraduate | 602 | 27.0% |
| Graduate / Professional | 251 | 11.3% |
| Total | 2,227 | 100.0% |
School Enrollment by Age by Funding Source in View Park Windsor Hills
Out of a total of 2,227 students who are enrolled in schools in View Park Windsor Hills, 474 (21.3%) attend a private institution, while the remaining 1,753 (78.7%) are enrolled in public schools. The age group of 3 to 4 year olds has the highest likelihood of being enrolled in private schools, with 63 (100.0% in the age bracket) enrolled. Conversely, the age group of 18 to 19 year olds has the lowest likelihood of being enrolled in a private school, with 150 (99.3% in the age bracket) attending a public institution.
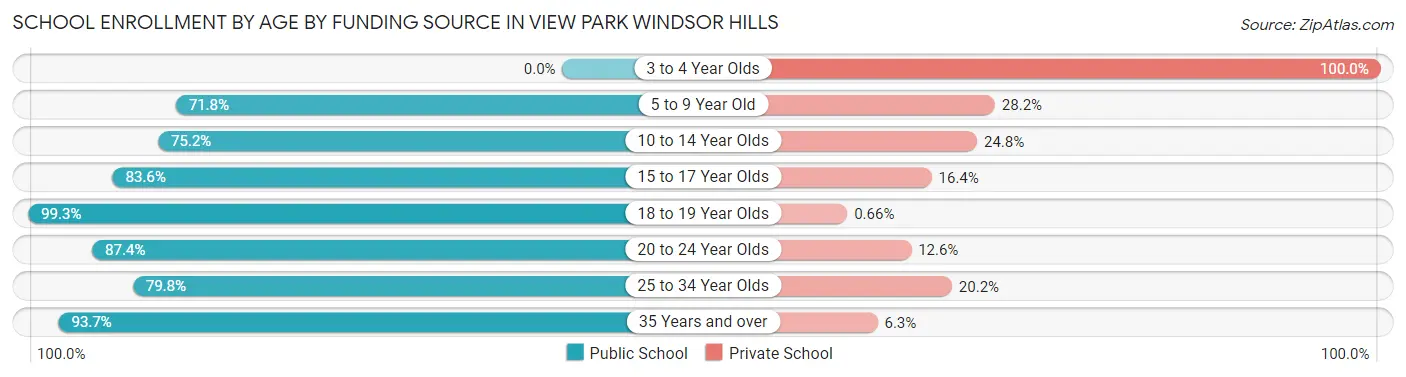
| Age Bracket | Public School | Private School |
| 3 to 4 Year Olds | 0 (0.0%) | 63 (100.0%) |
| 5 to 9 Year Old | 436 (71.8%) | 171 (28.2%) |
| 10 to 14 Year Olds | 342 (75.2%) | 113 (24.8%) |
| 15 to 17 Year Olds | 194 (83.6%) | 38 (16.4%) |
| 18 to 19 Year Olds | 150 (99.3%) | 1 (0.7%) |
| 20 to 24 Year Olds | 139 (87.4%) | 20 (12.6%) |
| 25 to 34 Year Olds | 194 (79.8%) | 49 (20.2%) |
| 35 Years and over | 297 (93.7%) | 20 (6.3%) |
| Total | 1,753 (78.7%) | 474 (21.3%) |
Educational Attainment by Field of Study in View Park Windsor Hills
Business (1,009 | 16.2%), social sciences (715 | 11.5%), education (545 | 8.7%), engineering (464 | 7.4%), and arts & humanities (462 | 7.4%) are the most common fields of study among 6,233 individuals in View Park Windsor Hills who have obtained a bachelor's degree or higher.
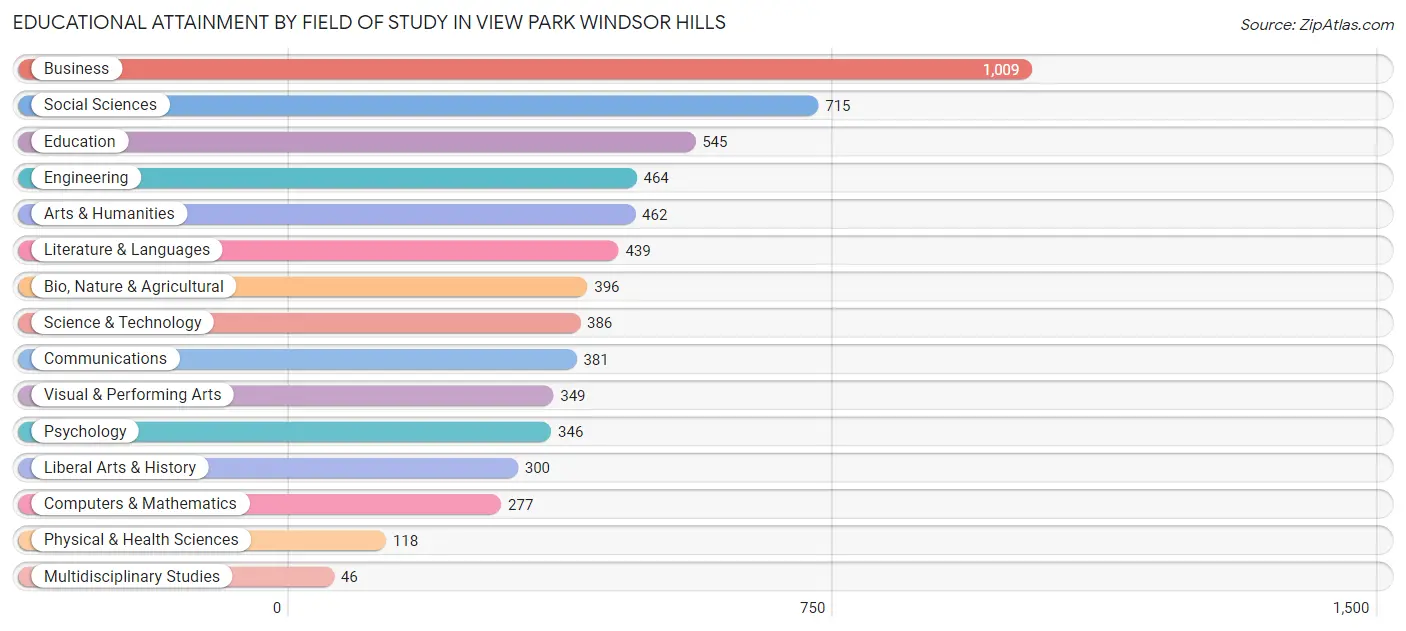
| Field of Study | # Graduates | % Graduates |
| Computers & Mathematics | 277 | 4.4% |
| Bio, Nature & Agricultural | 396 | 6.4% |
| Physical & Health Sciences | 118 | 1.9% |
| Psychology | 346 | 5.6% |
| Social Sciences | 715 | 11.5% |
| Engineering | 464 | 7.4% |
| Multidisciplinary Studies | 46 | 0.7% |
| Science & Technology | 386 | 6.2% |
| Business | 1,009 | 16.2% |
| Education | 545 | 8.7% |
| Literature & Languages | 439 | 7.0% |
| Liberal Arts & History | 300 | 4.8% |
| Visual & Performing Arts | 349 | 5.6% |
| Communications | 381 | 6.1% |
| Arts & Humanities | 462 | 7.4% |
| Total | 6,233 | 100.0% |
Transportation & Commute in View Park Windsor Hills
Vehicle Availability by Sex in View Park Windsor Hills
The most prevalent vehicle ownership categories in View Park Windsor Hills are males with 2 vehicles (1,016, accounting for 36.4%) and females with 2 vehicles (765, making up 42.9%).
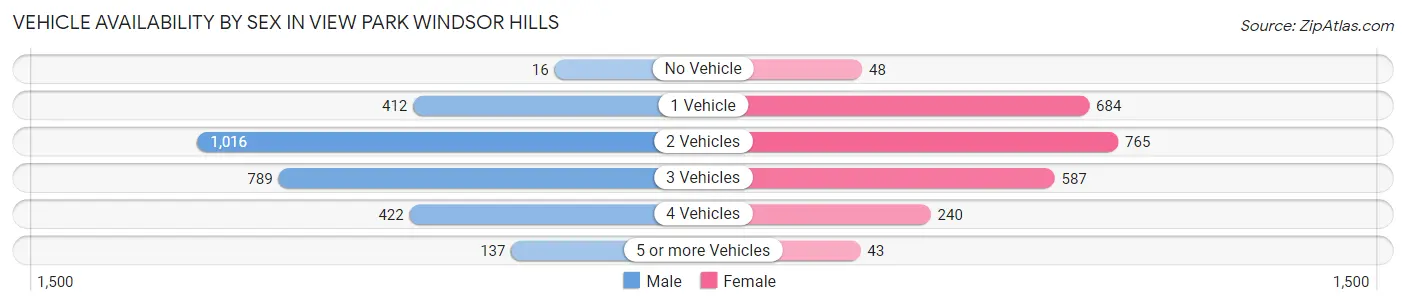
| Vehicles Available | Male | Female |
| No Vehicle | 16 (0.6%) | 48 (2.0%) |
| 1 Vehicle | 412 (14.8%) | 684 (28.9%) |
| 2 Vehicles | 1,016 (36.4%) | 765 (32.3%) |
| 3 Vehicles | 789 (28.3%) | 587 (24.8%) |
| 4 Vehicles | 422 (15.1%) | 240 (10.1%) |
| 5 or more Vehicles | 137 (4.9%) | 43 (1.8%) |
| Total | 2,792 (100.0%) | 2,367 (100.0%) |
Commute Time in View Park Windsor Hills
The most frequently occuring commute durations in View Park Windsor Hills are 30 to 34 minutes (874 commuters, 22.0%), 45 to 59 minutes (774 commuters, 19.5%), and 20 to 24 minutes (639 commuters, 16.1%).
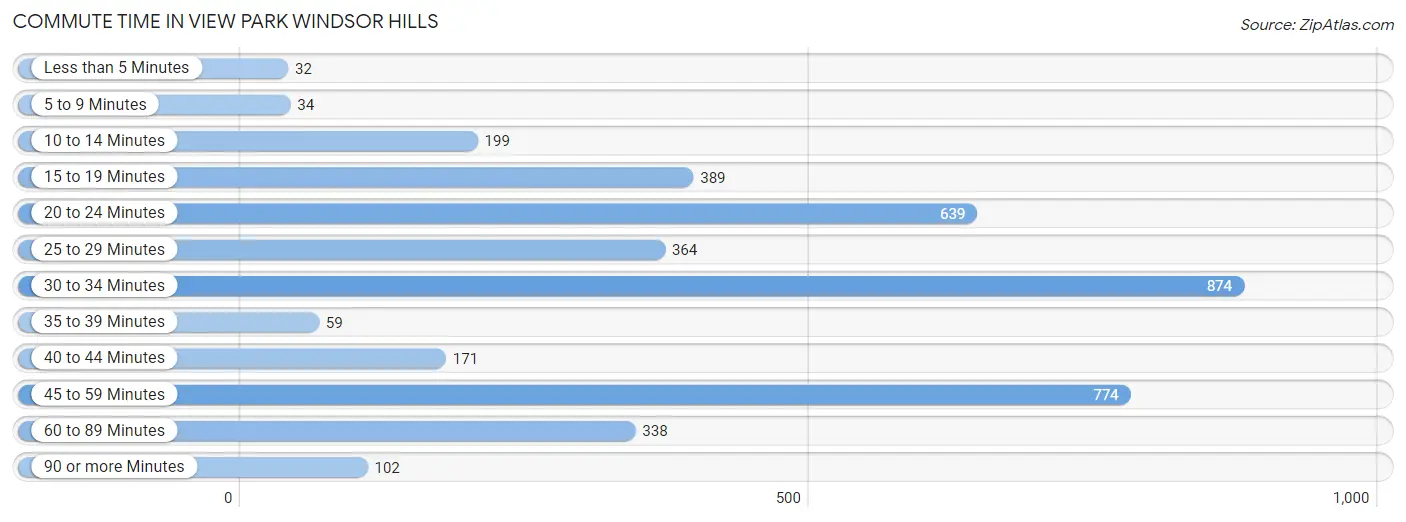
| Commute Time | # Commuters | % Commuters |
| Less than 5 Minutes | 32 | 0.8% |
| 5 to 9 Minutes | 34 | 0.9% |
| 10 to 14 Minutes | 199 | 5.0% |
| 15 to 19 Minutes | 389 | 9.8% |
| 20 to 24 Minutes | 639 | 16.1% |
| 25 to 29 Minutes | 364 | 9.2% |
| 30 to 34 Minutes | 874 | 22.0% |
| 35 to 39 Minutes | 59 | 1.5% |
| 40 to 44 Minutes | 171 | 4.3% |
| 45 to 59 Minutes | 774 | 19.5% |
| 60 to 89 Minutes | 338 | 8.5% |
| 90 or more Minutes | 102 | 2.6% |
Commute Time by Sex in View Park Windsor Hills
The most common commute times in View Park Windsor Hills are 30 to 34 minutes (445 commuters, 21.4%) for males and 30 to 34 minutes (429 commuters, 22.6%) for females.
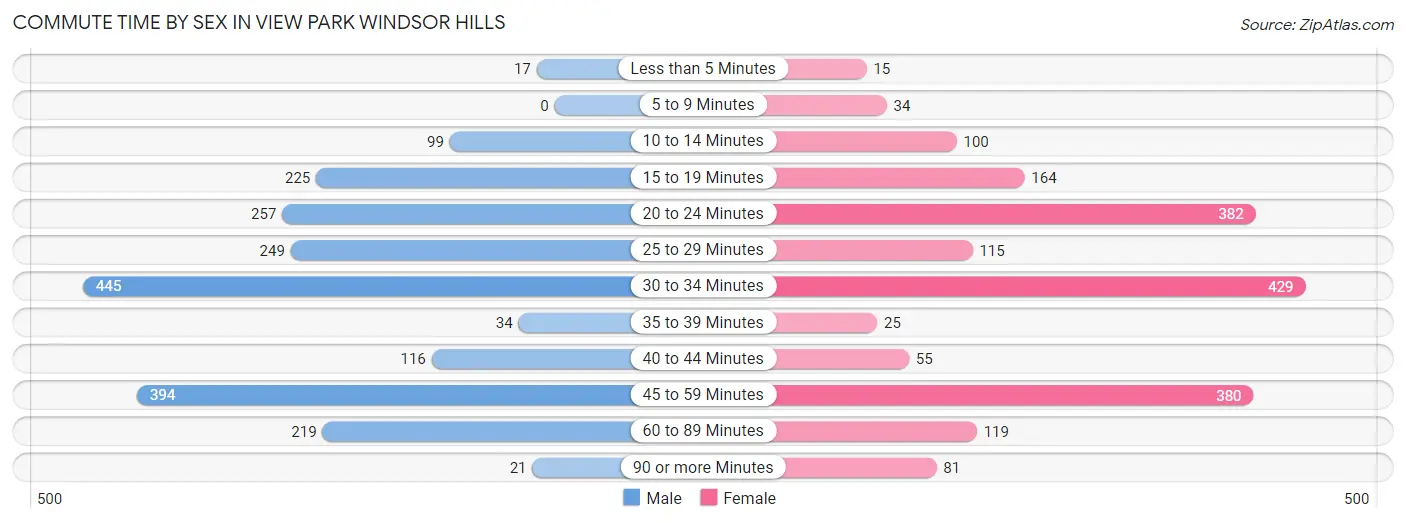
| Commute Time | Male | Female |
| Less than 5 Minutes | 17 (0.8%) | 15 (0.8%) |
| 5 to 9 Minutes | 0 (0.0%) | 34 (1.8%) |
| 10 to 14 Minutes | 99 (4.8%) | 100 (5.3%) |
| 15 to 19 Minutes | 225 (10.8%) | 164 (8.6%) |
| 20 to 24 Minutes | 257 (12.4%) | 382 (20.1%) |
| 25 to 29 Minutes | 249 (12.0%) | 115 (6.1%) |
| 30 to 34 Minutes | 445 (21.4%) | 429 (22.6%) |
| 35 to 39 Minutes | 34 (1.6%) | 25 (1.3%) |
| 40 to 44 Minutes | 116 (5.6%) | 55 (2.9%) |
| 45 to 59 Minutes | 394 (19.0%) | 380 (20.0%) |
| 60 to 89 Minutes | 219 (10.5%) | 119 (6.3%) |
| 90 or more Minutes | 21 (1.0%) | 81 (4.3%) |
Time of Departure to Work by Sex in View Park Windsor Hills
The most frequent times of departure to work in View Park Windsor Hills are 8:00 AM to 8:29 AM (439, 21.1%) for males and 9:00 AM to 9:59 AM (383, 20.2%) for females.
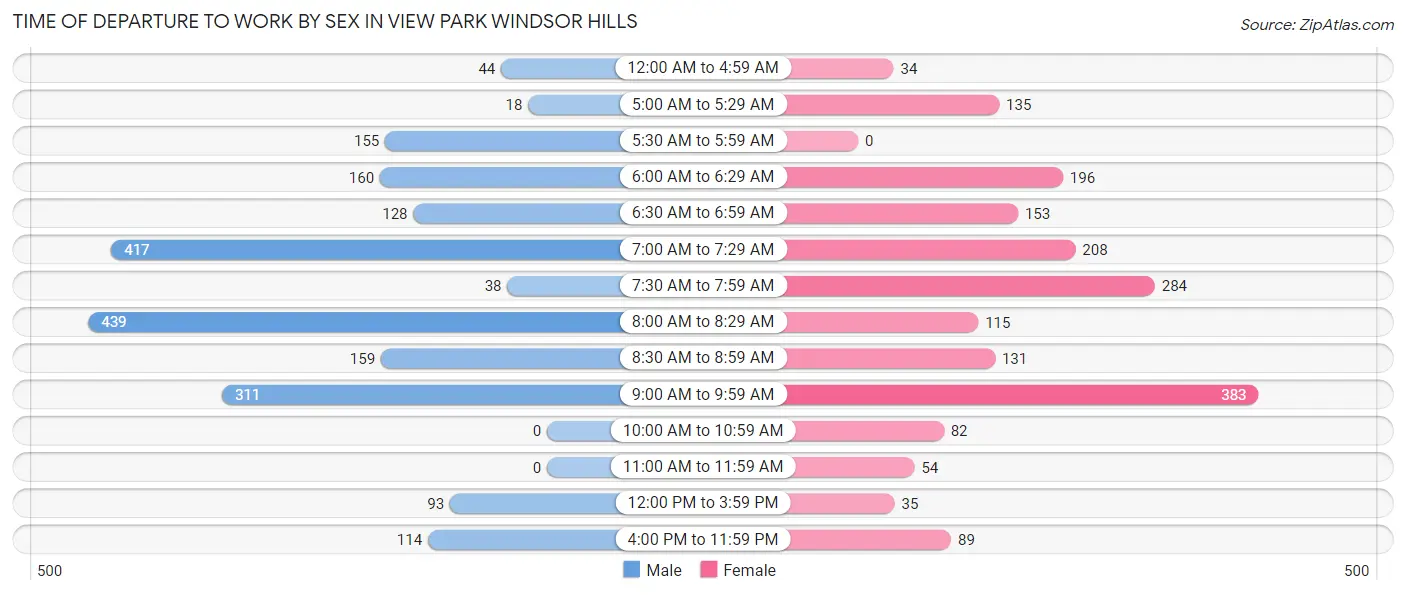
| Time of Departure | Male | Female |
| 12:00 AM to 4:59 AM | 44 (2.1%) | 34 (1.8%) |
| 5:00 AM to 5:29 AM | 18 (0.9%) | 135 (7.1%) |
| 5:30 AM to 5:59 AM | 155 (7.5%) | 0 (0.0%) |
| 6:00 AM to 6:29 AM | 160 (7.7%) | 196 (10.3%) |
| 6:30 AM to 6:59 AM | 128 (6.2%) | 153 (8.1%) |
| 7:00 AM to 7:29 AM | 417 (20.1%) | 208 (11.0%) |
| 7:30 AM to 7:59 AM | 38 (1.8%) | 284 (15.0%) |
| 8:00 AM to 8:29 AM | 439 (21.1%) | 115 (6.1%) |
| 8:30 AM to 8:59 AM | 159 (7.7%) | 131 (6.9%) |
| 9:00 AM to 9:59 AM | 311 (15.0%) | 383 (20.2%) |
| 10:00 AM to 10:59 AM | 0 (0.0%) | 82 (4.3%) |
| 11:00 AM to 11:59 AM | 0 (0.0%) | 54 (2.8%) |
| 12:00 PM to 3:59 PM | 93 (4.5%) | 35 (1.8%) |
| 4:00 PM to 11:59 PM | 114 (5.5%) | 89 (4.7%) |
| Total | 2,076 (100.0%) | 1,899 (100.0%) |
Housing Occupancy in View Park Windsor Hills
Occupancy by Ownership in View Park Windsor Hills
Of the total 4,911 dwellings in View Park Windsor Hills, owner-occupied units account for 3,326 (67.7%), while renter-occupied units make up 1,585 (32.3%).
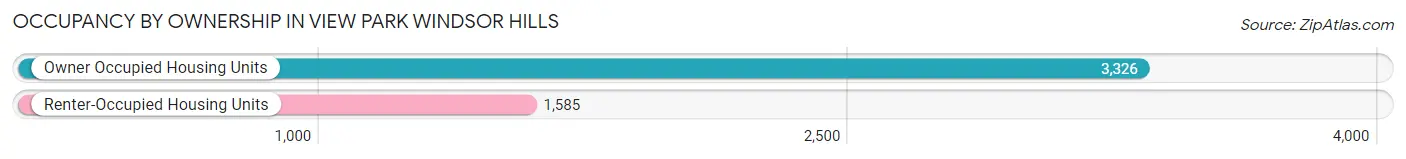
| Occupancy | # Housing Units | % Housing Units |
| Owner Occupied Housing Units | 3,326 | 67.7% |
| Renter-Occupied Housing Units | 1,585 | 32.3% |
| Total Occupied Housing Units | 4,911 | 100.0% |
Occupancy by Household Size in View Park Windsor Hills
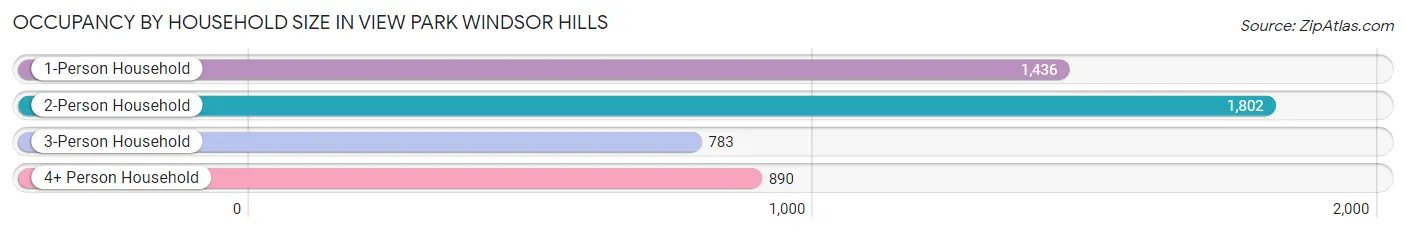
| Household Size | # Housing Units | % Housing Units |
| 1-Person Household | 1,436 | 29.2% |
| 2-Person Household | 1,802 | 36.7% |
| 3-Person Household | 783 | 15.9% |
| 4+ Person Household | 890 | 18.1% |
| Total Housing Units | 4,911 | 100.0% |
Occupancy by Ownership by Household Size in View Park Windsor Hills
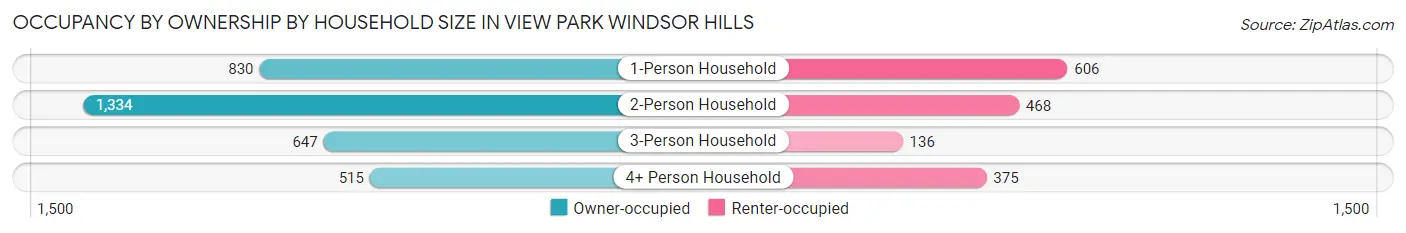
| Household Size | Owner-occupied | Renter-occupied |
| 1-Person Household | 830 (57.8%) | 606 (42.2%) |
| 2-Person Household | 1,334 (74.0%) | 468 (26.0%) |
| 3-Person Household | 647 (82.6%) | 136 (17.4%) |
| 4+ Person Household | 515 (57.9%) | 375 (42.1%) |
| Total Housing Units | 3,326 (67.7%) | 1,585 (32.3%) |
Occupancy by Educational Attainment in View Park Windsor Hills
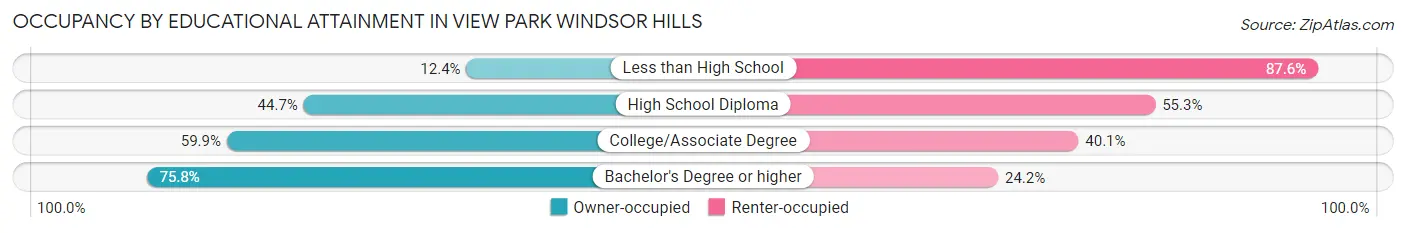
| Household Size | Owner-occupied | Renter-occupied |
| Less than High School | 18 (12.4%) | 127 (87.6%) |
| High School Diploma | 134 (44.7%) | 166 (55.3%) |
| College/Associate Degree | 801 (59.9%) | 536 (40.1%) |
| Bachelor's Degree or higher | 2,373 (75.8%) | 756 (24.2%) |
Occupancy by Age of Householder in View Park Windsor Hills
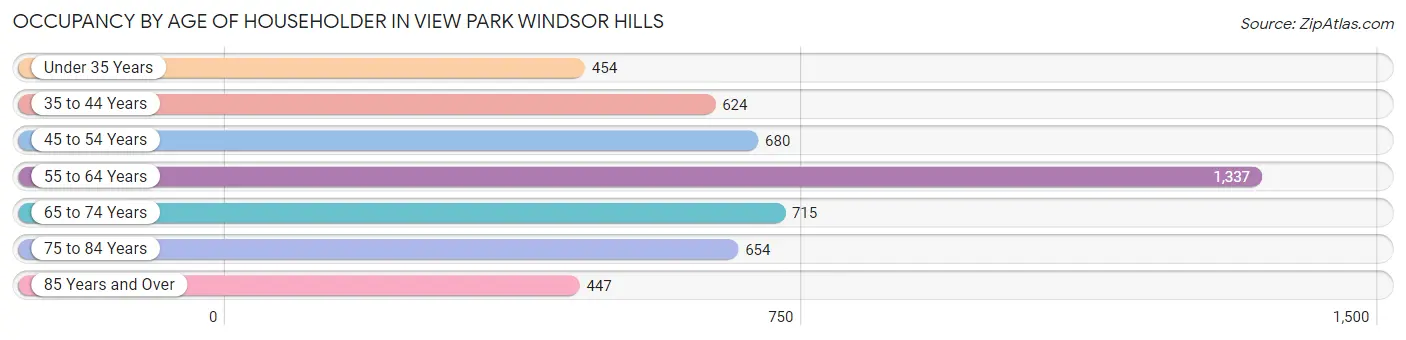
| Age Bracket | # Households | % Households |
| Under 35 Years | 454 | 9.2% |
| 35 to 44 Years | 624 | 12.7% |
| 45 to 54 Years | 680 | 13.9% |
| 55 to 64 Years | 1,337 | 27.2% |
| 65 to 74 Years | 715 | 14.6% |
| 75 to 84 Years | 654 | 13.3% |
| 85 Years and Over | 447 | 9.1% |
| Total | 4,911 | 100.0% |
Housing Finances in View Park Windsor Hills
Median Income by Occupancy in View Park Windsor Hills
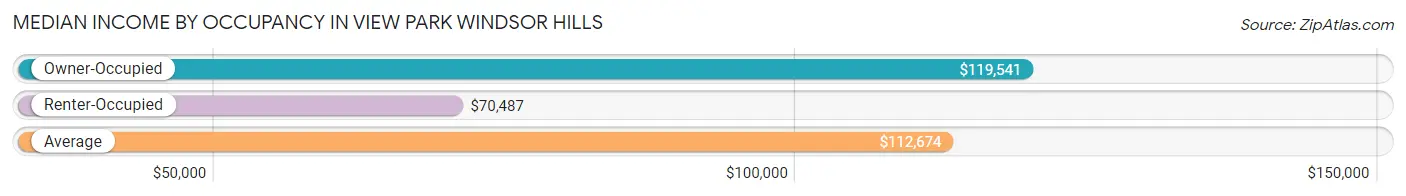
| Occupancy Type | # Households | Median Income |
| Owner-Occupied | 3,326 (67.7%) | $119,541 |
| Renter-Occupied | 1,585 (32.3%) | $70,487 |
| Average | 4,911 (100.0%) | $112,674 |
Occupancy by Householder Income Bracket in View Park Windsor Hills
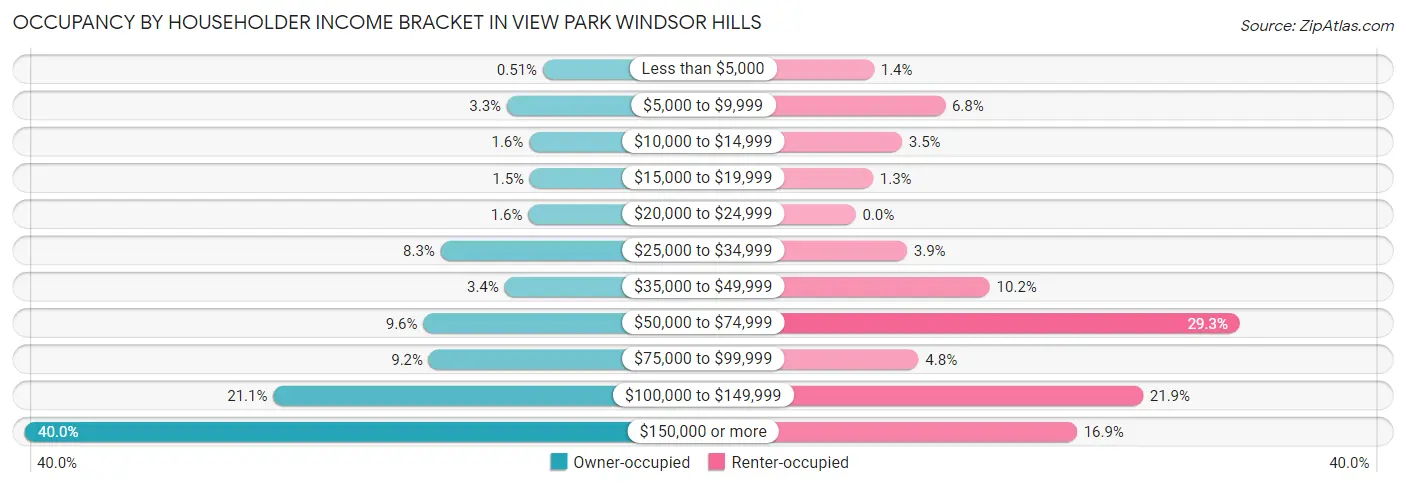
| Income Bracket | Owner-occupied | Renter-occupied |
| Less than $5,000 | 17 (0.5%) | 22 (1.4%) |
| $5,000 to $9,999 | 108 (3.3%) | 108 (6.8%) |
| $10,000 to $14,999 | 52 (1.6%) | 56 (3.5%) |
| $15,000 to $19,999 | 50 (1.5%) | 21 (1.3%) |
| $20,000 to $24,999 | 54 (1.6%) | 0 (0.0%) |
| $25,000 to $34,999 | 276 (8.3%) | 62 (3.9%) |
| $35,000 to $49,999 | 114 (3.4%) | 162 (10.2%) |
| $50,000 to $74,999 | 320 (9.6%) | 464 (29.3%) |
| $75,000 to $99,999 | 306 (9.2%) | 76 (4.8%) |
| $100,000 to $149,999 | 700 (21.0%) | 347 (21.9%) |
| $150,000 or more | 1,329 (40.0%) | 267 (16.9%) |
| Total | 3,326 (100.0%) | 1,585 (100.0%) |
Monthly Housing Cost Tiers in View Park Windsor Hills
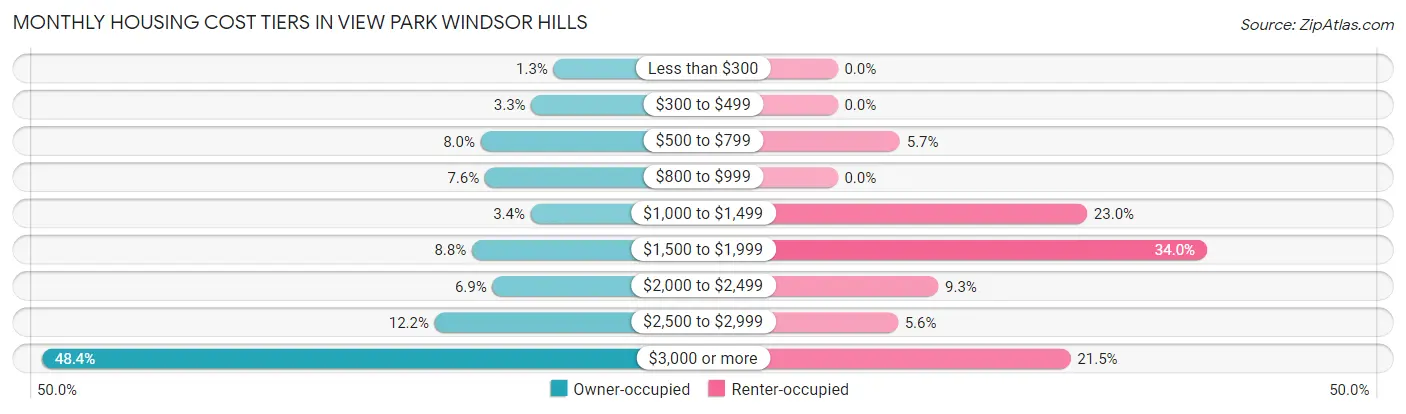
| Monthly Cost | Owner-occupied | Renter-occupied |
| Less than $300 | 43 (1.3%) | 0 (0.0%) |
| $300 to $499 | 111 (3.3%) | 0 (0.0%) |
| $500 to $799 | 266 (8.0%) | 91 (5.7%) |
| $800 to $999 | 253 (7.6%) | 0 (0.0%) |
| $1,000 to $1,499 | 113 (3.4%) | 364 (23.0%) |
| $1,500 to $1,999 | 293 (8.8%) | 539 (34.0%) |
| $2,000 to $2,499 | 230 (6.9%) | 147 (9.3%) |
| $2,500 to $2,999 | 407 (12.2%) | 88 (5.6%) |
| $3,000 or more | 1,610 (48.4%) | 340 (21.4%) |
| Total | 3,326 (100.0%) | 1,585 (100.0%) |
Physical Housing Characteristics in View Park Windsor Hills
Housing Structures in View Park Windsor Hills
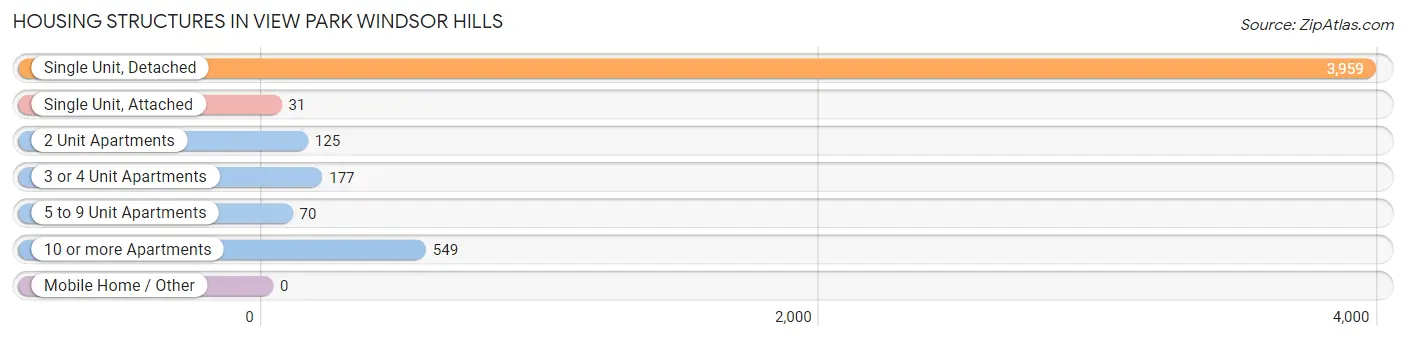
| Structure Type | # Housing Units | % Housing Units |
| Single Unit, Detached | 3,959 | 80.6% |
| Single Unit, Attached | 31 | 0.6% |
| 2 Unit Apartments | 125 | 2.5% |
| 3 or 4 Unit Apartments | 177 | 3.6% |
| 5 to 9 Unit Apartments | 70 | 1.4% |
| 10 or more Apartments | 549 | 11.2% |
| Mobile Home / Other | 0 | 0.0% |
| Total | 4,911 | 100.0% |
Housing Structures by Occupancy in View Park Windsor Hills
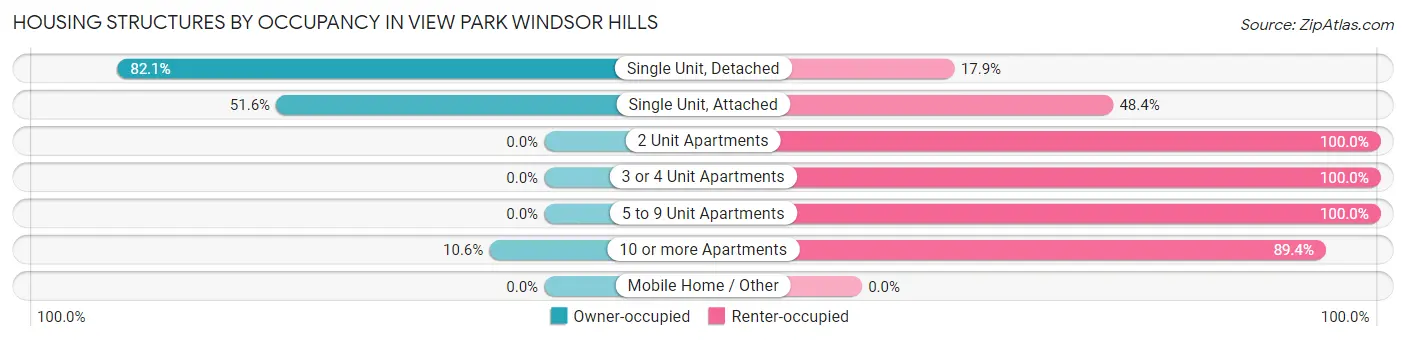
| Structure Type | Owner-occupied | Renter-occupied |
| Single Unit, Detached | 3,252 (82.1%) | 707 (17.9%) |
| Single Unit, Attached | 16 (51.6%) | 15 (48.4%) |
| 2 Unit Apartments | 0 (0.0%) | 125 (100.0%) |
| 3 or 4 Unit Apartments | 0 (0.0%) | 177 (100.0%) |
| 5 to 9 Unit Apartments | 0 (0.0%) | 70 (100.0%) |
| 10 or more Apartments | 58 (10.6%) | 491 (89.4%) |
| Mobile Home / Other | 0 (0.0%) | 0 (0.0%) |
| Total | 3,326 (67.7%) | 1,585 (32.3%) |
Housing Structures by Number of Rooms in View Park Windsor Hills
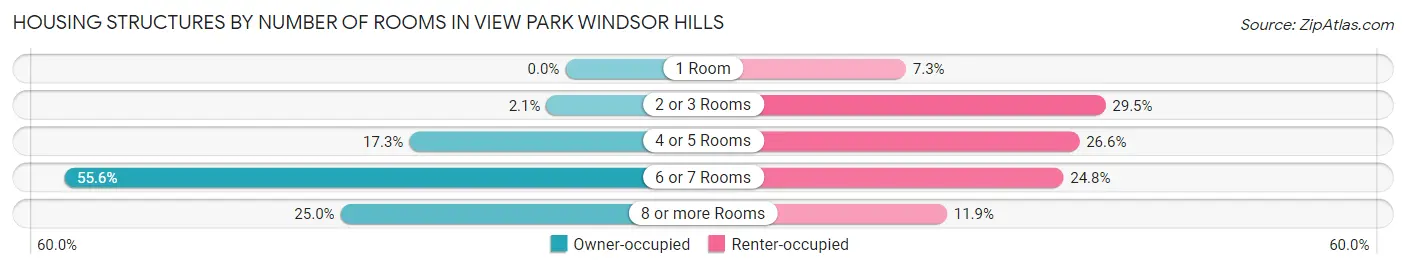
| Number of Rooms | Owner-occupied | Renter-occupied |
| 1 Room | 0 (0.0%) | 116 (7.3%) |
| 2 or 3 Rooms | 70 (2.1%) | 467 (29.5%) |
| 4 or 5 Rooms | 576 (17.3%) | 421 (26.6%) |
| 6 or 7 Rooms | 1,850 (55.6%) | 393 (24.8%) |
| 8 or more Rooms | 830 (24.9%) | 188 (11.9%) |
| Total | 3,326 (100.0%) | 1,585 (100.0%) |
Housing Structure by Heating Type in View Park Windsor Hills
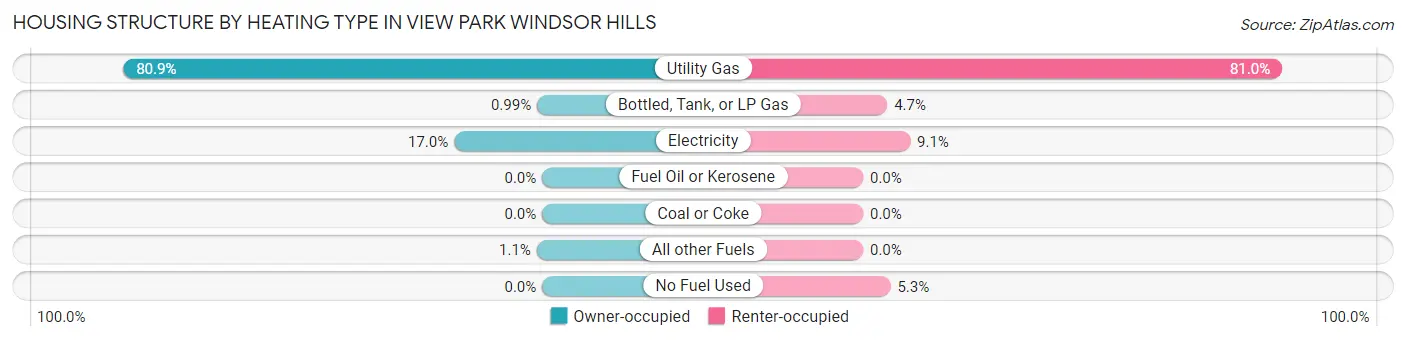
| Heating Type | Owner-occupied | Renter-occupied |
| Utility Gas | 2,692 (80.9%) | 1,283 (80.9%) |
| Bottled, Tank, or LP Gas | 33 (1.0%) | 74 (4.7%) |
| Electricity | 566 (17.0%) | 144 (9.1%) |
| Fuel Oil or Kerosene | 0 (0.0%) | 0 (0.0%) |
| Coal or Coke | 0 (0.0%) | 0 (0.0%) |
| All other Fuels | 35 (1.1%) | 0 (0.0%) |
| No Fuel Used | 0 (0.0%) | 84 (5.3%) |
| Total | 3,326 (100.0%) | 1,585 (100.0%) |
Household Vehicle Usage in View Park Windsor Hills
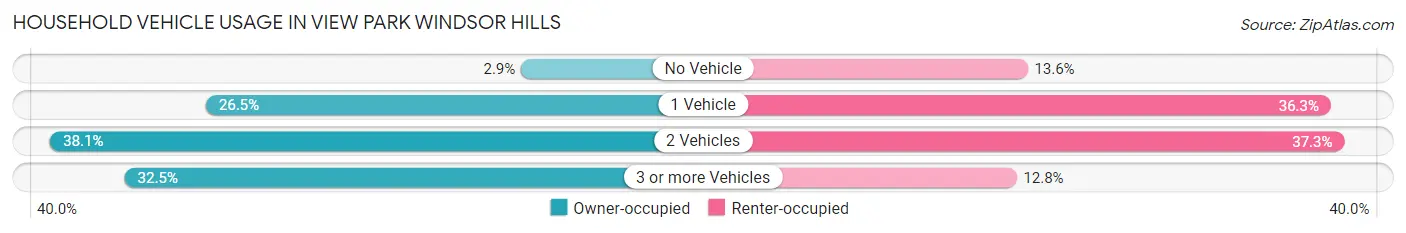
| Vehicles per Household | Owner-occupied | Renter-occupied |
| No Vehicle | 97 (2.9%) | 216 (13.6%) |
| 1 Vehicle | 880 (26.5%) | 575 (36.3%) |
| 2 Vehicles | 1,267 (38.1%) | 591 (37.3%) |
| 3 or more Vehicles | 1,082 (32.5%) | 203 (12.8%) |
| Total | 3,326 (100.0%) | 1,585 (100.0%) |
Real Estate & Mortgages in View Park Windsor Hills
Real Estate and Mortgage Overview in View Park Windsor Hills
| Characteristic | Without Mortgage | With Mortgage |
| Housing Units | 829 | 2,497 |
| Median Property Value | $873,600 | $998,100 |
| Median Household Income | $95,339 | $1,145 |
| Monthly Housing Costs | $784 | $1,557 |
| Real Estate Taxes | $3,817 | $0 |
Property Value by Mortgage Status in View Park Windsor Hills
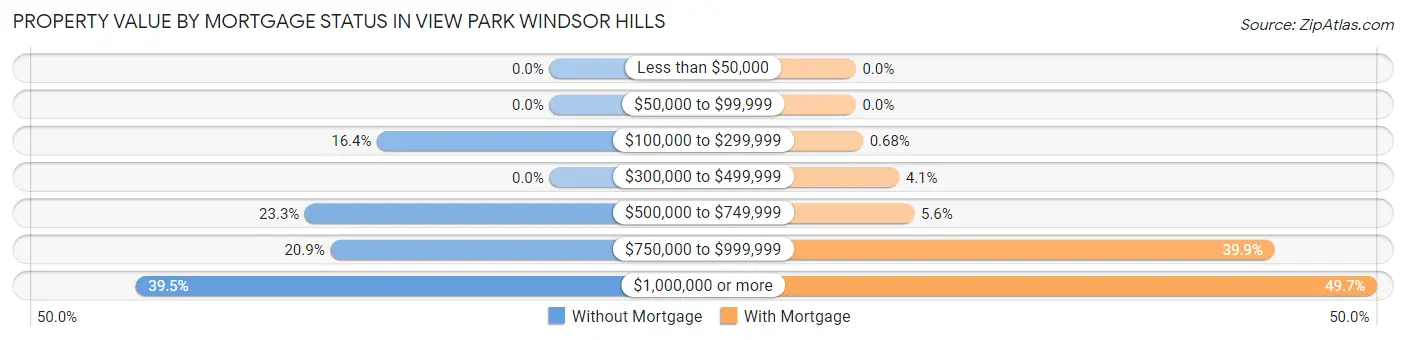
| Property Value | Without Mortgage | With Mortgage |
| Less than $50,000 | 0 (0.0%) | 0 (0.0%) |
| $50,000 to $99,999 | 0 (0.0%) | 0 (0.0%) |
| $100,000 to $299,999 | 136 (16.4%) | 17 (0.7%) |
| $300,000 to $499,999 | 0 (0.0%) | 103 (4.1%) |
| $500,000 to $749,999 | 193 (23.3%) | 139 (5.6%) |
| $750,000 to $999,999 | 173 (20.9%) | 997 (39.9%) |
| $1,000,000 or more | 327 (39.5%) | 1,241 (49.7%) |
| Total | 829 (100.0%) | 2,497 (100.0%) |
Household Income by Mortgage Status in View Park Windsor Hills
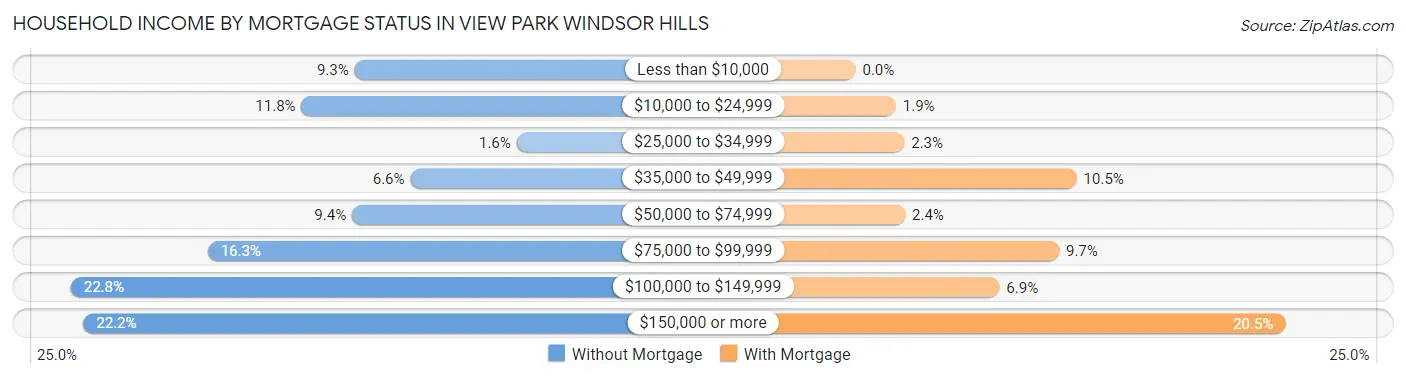
| Household Income | Without Mortgage | With Mortgage |
| Less than $10,000 | 77 (9.3%) | 0 (0.0%) |
| $10,000 to $24,999 | 98 (11.8%) | 48 (1.9%) |
| $25,000 to $34,999 | 13 (1.6%) | 58 (2.3%) |
| $35,000 to $49,999 | 55 (6.6%) | 263 (10.5%) |
| $50,000 to $74,999 | 78 (9.4%) | 59 (2.4%) |
| $75,000 to $99,999 | 135 (16.3%) | 242 (9.7%) |
| $100,000 to $149,999 | 189 (22.8%) | 171 (6.9%) |
| $150,000 or more | 184 (22.2%) | 511 (20.5%) |
| Total | 829 (100.0%) | 2,497 (100.0%) |
Property Value to Household Income Ratio in View Park Windsor Hills
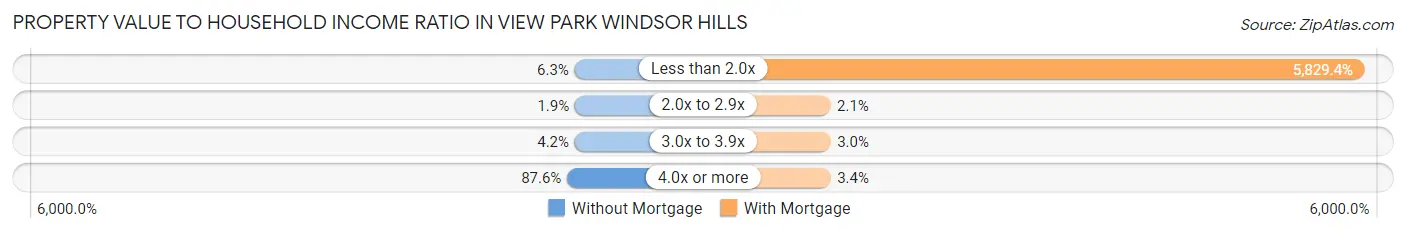
| Value-to-Income Ratio | Without Mortgage | With Mortgage |
| Less than 2.0x | 52 (6.3%) | 145,560 (5,829.4%) |
| 2.0x to 2.9x | 16 (1.9%) | 53 (2.1%) |
| 3.0x to 3.9x | 35 (4.2%) | 75 (3.0%) |
| 4.0x or more | 726 (87.6%) | 85 (3.4%) |
| Total | 829 (100.0%) | 2,497 (100.0%) |
Real Estate Taxes by Mortgage Status in View Park Windsor Hills
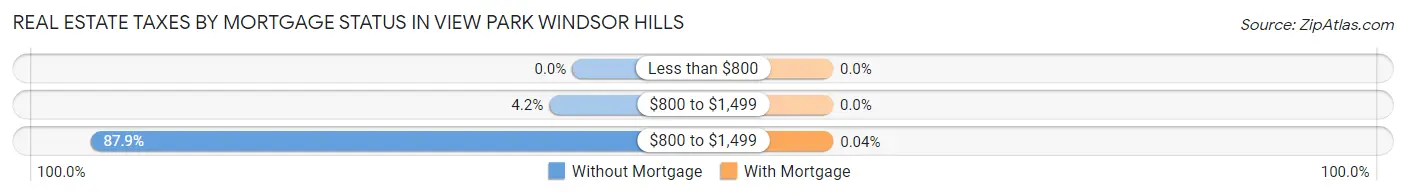
| Property Taxes | Without Mortgage | With Mortgage |
| Less than $800 | 0 (0.0%) | 0 (0.0%) |
| $800 to $1,499 | 35 (4.2%) | 0 (0.0%) |
| $800 to $1,499 | 729 (87.9%) | 1 (0.0%) |
| Total | 829 (100.0%) | 2,497 (100.0%) |
Health & Disability in View Park Windsor Hills
Health Insurance Coverage by Age in View Park Windsor Hills
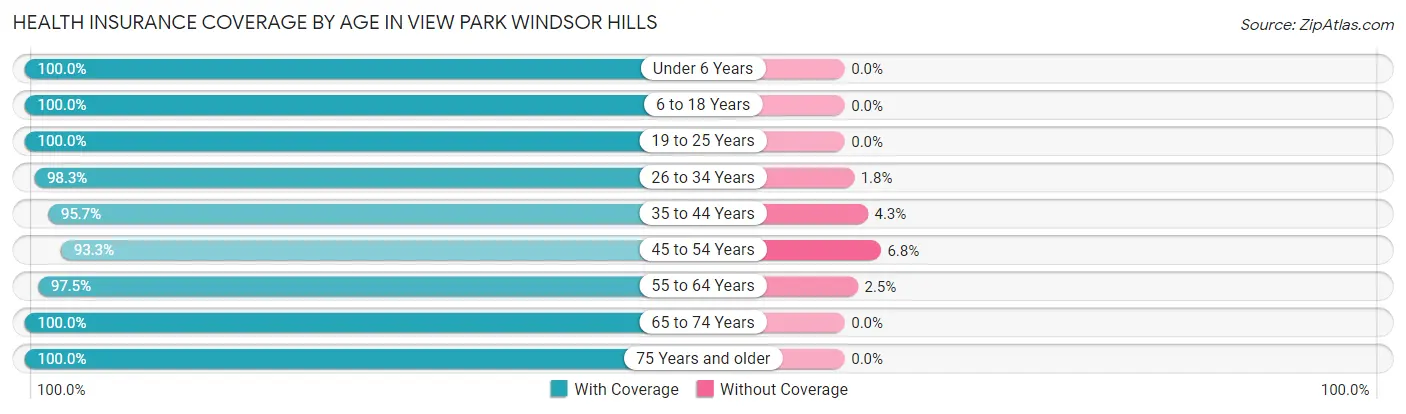
| Age Bracket | With Coverage | Without Coverage |
| Under 6 Years | 535 (100.0%) | 0 (0.0%) |
| 6 to 18 Years | 1,408 (100.0%) | 0 (0.0%) |
| 19 to 25 Years | 845 (100.0%) | 0 (0.0%) |
| 26 to 34 Years | 1,011 (98.3%) | 18 (1.8%) |
| 35 to 44 Years | 1,547 (95.7%) | 70 (4.3%) |
| 45 to 54 Years | 1,506 (93.2%) | 109 (6.8%) |
| 55 to 64 Years | 1,936 (97.5%) | 49 (2.5%) |
| 65 to 74 Years | 1,356 (100.0%) | 0 (0.0%) |
| 75 Years and older | 1,493 (100.0%) | 0 (0.0%) |
| Total | 11,637 (97.9%) | 246 (2.1%) |
Health Insurance Coverage by Citizenship Status in View Park Windsor Hills
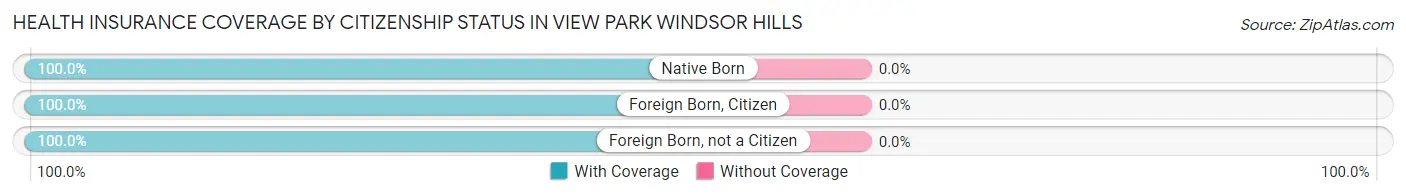
| Citizenship Status | With Coverage | Without Coverage |
| Native Born | 535 (100.0%) | 0 (0.0%) |
| Foreign Born, Citizen | 1,408 (100.0%) | 0 (0.0%) |
| Foreign Born, not a Citizen | 845 (100.0%) | 0 (0.0%) |
Health Insurance Coverage by Household Income in View Park Windsor Hills
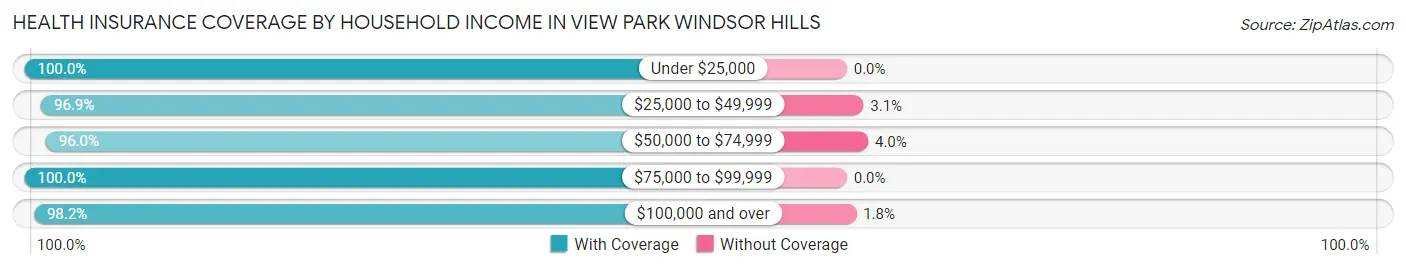
| Household Income | With Coverage | Without Coverage |
| Under $25,000 | 671 (100.0%) | 0 (0.0%) |
| $25,000 to $49,999 | 1,345 (96.9%) | 43 (3.1%) |
| $50,000 to $74,999 | 1,738 (96.0%) | 72 (4.0%) |
| $75,000 to $99,999 | 761 (100.0%) | 0 (0.0%) |
| $100,000 and over | 7,080 (98.2%) | 127 (1.8%) |
Public vs Private Health Insurance Coverage by Age in View Park Windsor Hills
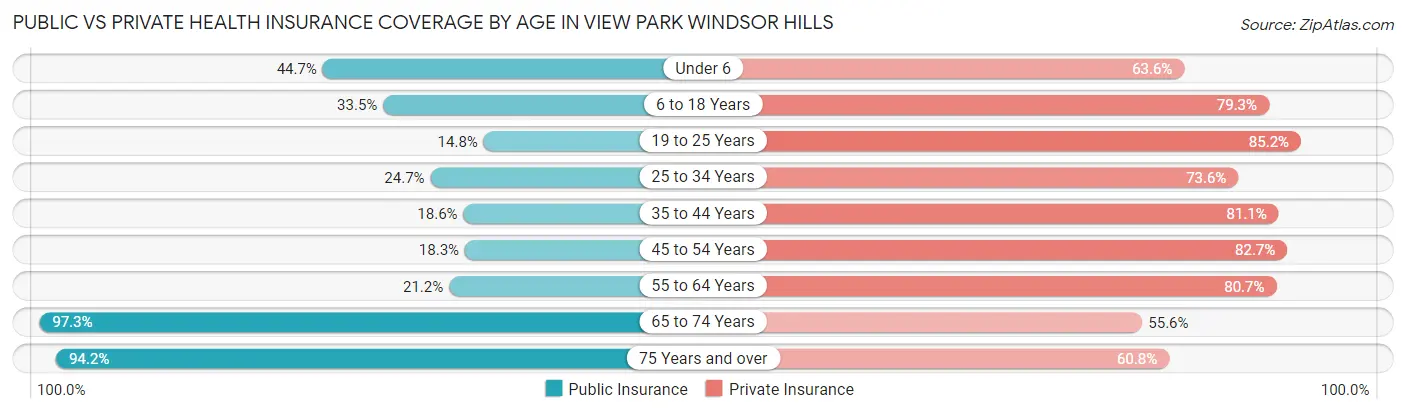
| Age Bracket | Public Insurance | Private Insurance |
| Under 6 | 239 (44.7%) | 340 (63.5%) |
| 6 to 18 Years | 471 (33.5%) | 1,116 (79.3%) |
| 19 to 25 Years | 125 (14.8%) | 720 (85.2%) |
| 25 to 34 Years | 254 (24.7%) | 757 (73.6%) |
| 35 to 44 Years | 300 (18.5%) | 1,311 (81.1%) |
| 45 to 54 Years | 295 (18.3%) | 1,335 (82.7%) |
| 55 to 64 Years | 421 (21.2%) | 1,601 (80.6%) |
| 65 to 74 Years | 1,319 (97.3%) | 754 (55.6%) |
| 75 Years and over | 1,406 (94.2%) | 907 (60.8%) |
| Total | 4,830 (40.6%) | 8,841 (74.4%) |
Disability Status by Sex by Age in View Park Windsor Hills
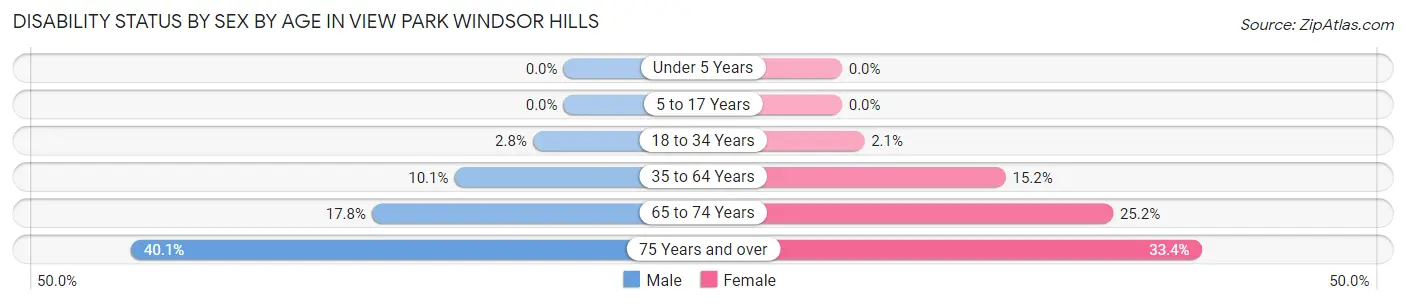
| Age Bracket | Male | Female |
| Under 5 Years | 0 (0.0%) | 0 (0.0%) |
| 5 to 17 Years | 0 (0.0%) | 0 (0.0%) |
| 18 to 34 Years | 29 (2.8%) | 19 (2.1%) |
| 35 to 64 Years | 239 (10.1%) | 434 (15.2%) |
| 65 to 74 Years | 109 (17.8%) | 187 (25.2%) |
| 75 Years and over | 254 (40.1%) | 287 (33.4%) |
Disability Class by Sex by Age in View Park Windsor Hills
Disability Class: Hearing Difficulty
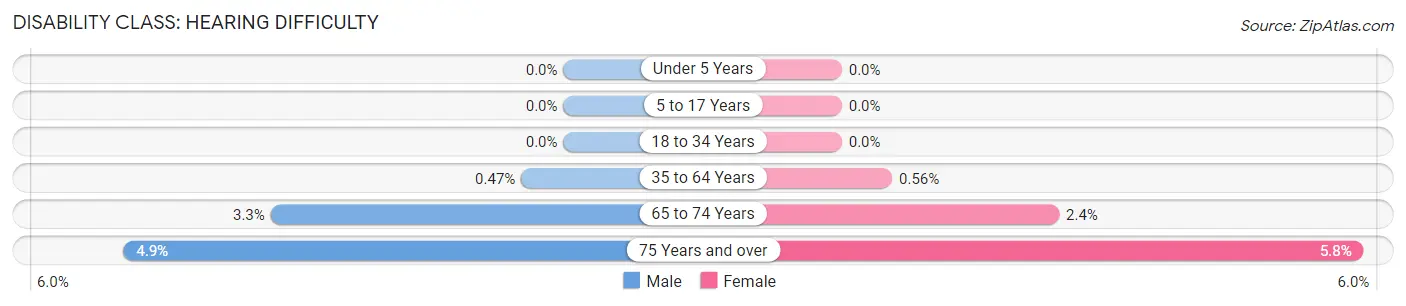
| Age Bracket | Male | Female |
| Under 5 Years | 0 (0.0%) | 0 (0.0%) |
| 5 to 17 Years | 0 (0.0%) | 0 (0.0%) |
| 18 to 34 Years | 0 (0.0%) | 0 (0.0%) |
| 35 to 64 Years | 11 (0.5%) | 16 (0.6%) |
| 65 to 74 Years | 20 (3.3%) | 18 (2.4%) |
| 75 Years and over | 31 (4.9%) | 50 (5.8%) |
Disability Class: Vision Difficulty
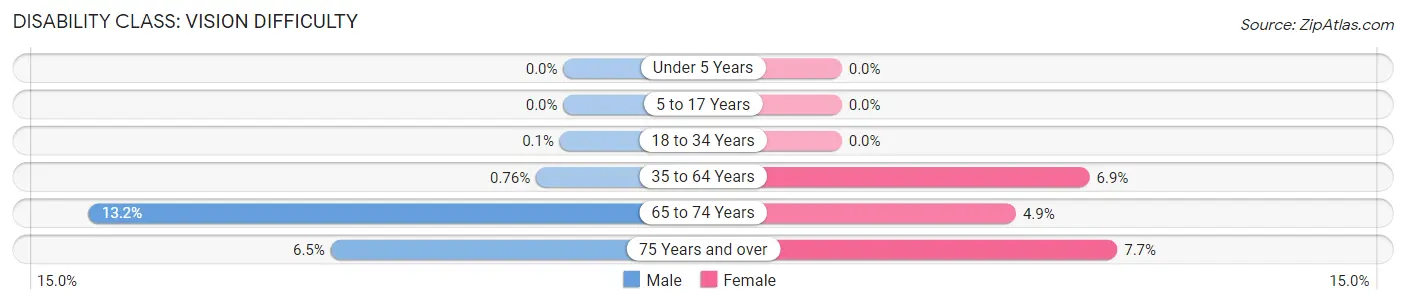
| Age Bracket | Male | Female |
| Under 5 Years | 0 (0.0%) | 0 (0.0%) |
| 5 to 17 Years | 0 (0.0%) | 0 (0.0%) |
| 18 to 34 Years | 1 (0.1%) | 0 (0.0%) |
| 35 to 64 Years | 18 (0.8%) | 197 (6.9%) |
| 65 to 74 Years | 81 (13.2%) | 36 (4.9%) |
| 75 Years and over | 41 (6.5%) | 66 (7.7%) |
Disability Class: Cognitive Difficulty
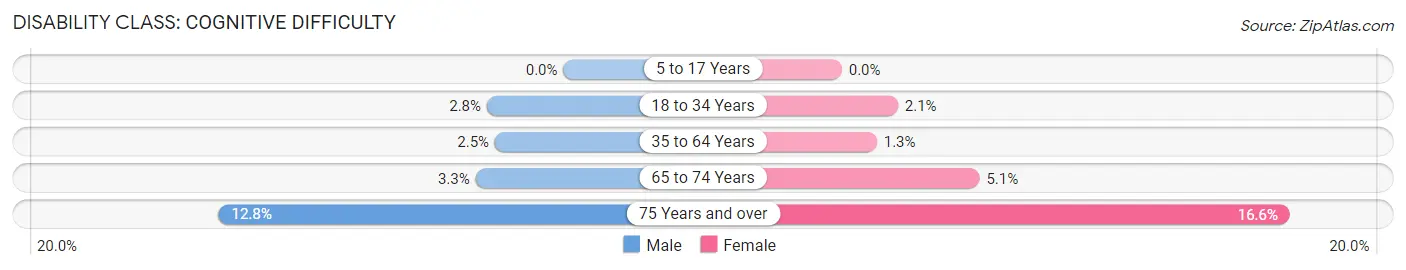
| Age Bracket | Male | Female |
| 5 to 17 Years | 0 (0.0%) | 0 (0.0%) |
| 18 to 34 Years | 29 (2.8%) | 19 (2.1%) |
| 35 to 64 Years | 60 (2.5%) | 37 (1.3%) |
| 65 to 74 Years | 20 (3.3%) | 38 (5.1%) |
| 75 Years and over | 81 (12.8%) | 143 (16.6%) |
Disability Class: Ambulatory Difficulty
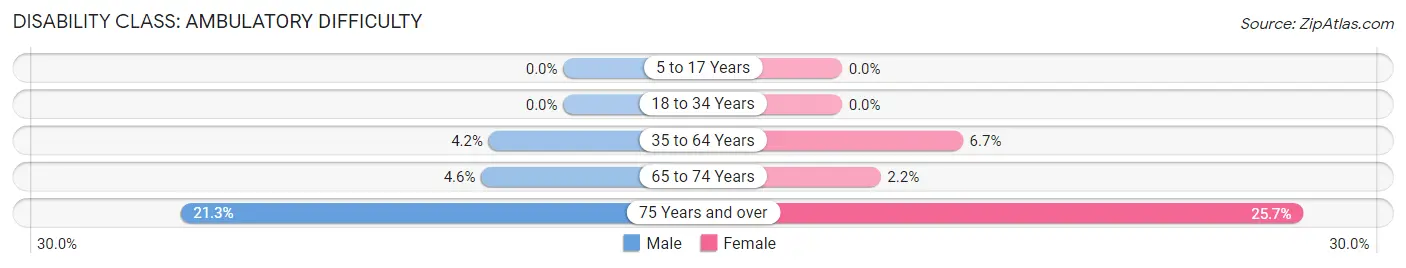
| Age Bracket | Male | Female |
| 5 to 17 Years | 0 (0.0%) | 0 (0.0%) |
| 18 to 34 Years | 0 (0.0%) | 0 (0.0%) |
| 35 to 64 Years | 98 (4.2%) | 192 (6.7%) |
| 65 to 74 Years | 28 (4.6%) | 16 (2.1%) |
| 75 Years and over | 135 (21.3%) | 221 (25.7%) |
Disability Class: Self-Care Difficulty
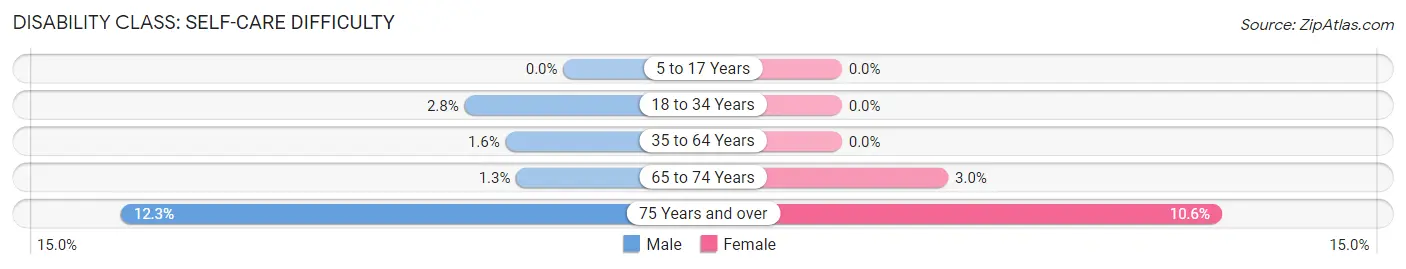
| Age Bracket | Male | Female |
| 5 to 17 Years | 0 (0.0%) | 0 (0.0%) |
| 18 to 34 Years | 28 (2.8%) | 0 (0.0%) |
| 35 to 64 Years | 38 (1.6%) | 0 (0.0%) |
| 65 to 74 Years | 8 (1.3%) | 22 (3.0%) |
| 75 Years and over | 78 (12.3%) | 91 (10.6%) |
Technology Access in View Park Windsor Hills
Computing Device Access in View Park Windsor Hills
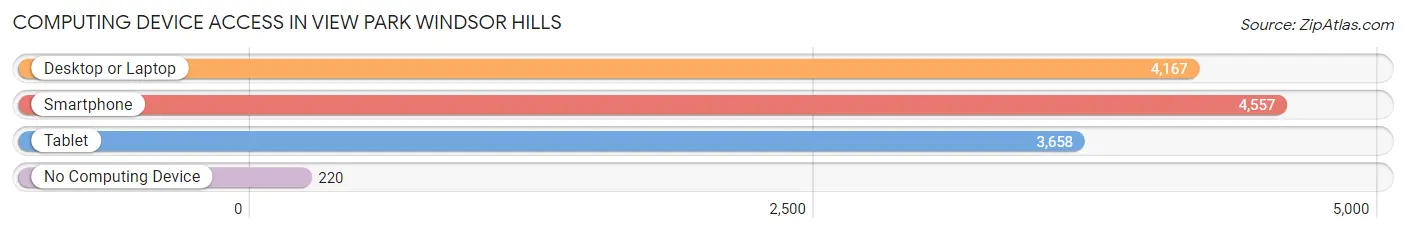
| Device Type | # Households | % Households |
| Desktop or Laptop | 4,167 | 84.9% |
| Smartphone | 4,557 | 92.8% |
| Tablet | 3,658 | 74.5% |
| No Computing Device | 220 | 4.5% |
| Total | 4,911 | 100.0% |
Internet Access in View Park Windsor Hills
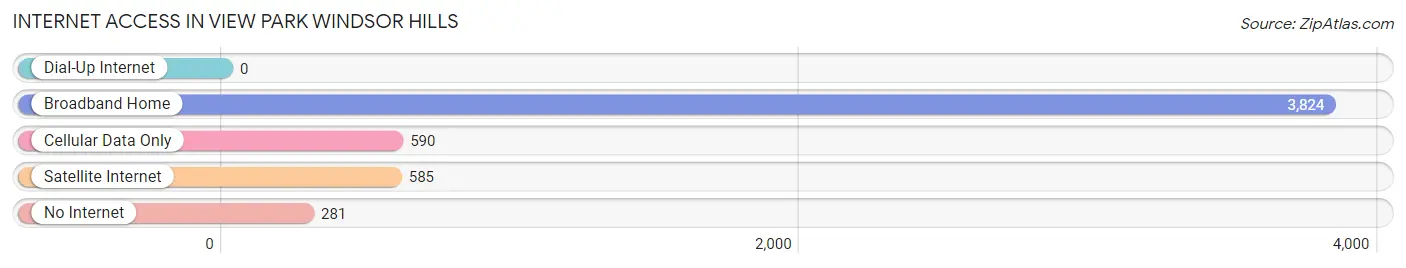
| Internet Type | # Households | % Households |
| Dial-Up Internet | 0 | 0.0% |
| Broadband Home | 3,824 | 77.9% |
| Cellular Data Only | 590 | 12.0% |
| Satellite Internet | 585 | 11.9% |
| No Internet | 281 | 5.7% |
| Total | 4,911 | 100.0% |
View Park Windsor Hills Summary
Park View Windsor Hills is a small, unincorporated community located in Los Angeles County, California. It is situated in the southwestern corner of the county, just south of the city of Los Angeles. The community is bordered by the cities of Inglewood and Hawthorne to the north, and the city of Los Angeles to the east. Park View Windsor Hills is a predominantly African-American community, with a population of approximately 8,000 people.
History
Park View Windsor Hills was originally part of the Rancho La Brea Mexican land grant, which was granted to Antonio Jose Rocha in 1845. The area was later developed as a residential neighborhood in the early 1900s. The community was named after the Park View Hotel, which was built in the area in the 1920s. The hotel was a popular destination for Hollywood celebrities, and was the site of many parties and events.
In the 1950s, the area began to experience a period of rapid growth and development. The population of Park View Windsor Hills increased significantly, and the area became a popular destination for African-American families. The community was home to many prominent African-American figures, including singer Ray Charles, actor Sidney Poitier, and civil rights leader Martin Luther King Jr.
Geography
Park View Windsor Hills is located in the southwestern corner of Los Angeles County, just south of the city of Los Angeles. The community is bordered by the cities of Inglewood and Hawthorne to the north, and the city of Los Angeles to the east. The area is characterized by rolling hills and is home to several parks, including the Park View Recreation Center and the Windsor Hills Park.
Economy
The economy of Park View Windsor Hills is largely driven by the service industry. The area is home to a variety of restaurants, retail stores, and other businesses. The community is also home to several churches, schools, and other community organizations.
Demographics
As of the 2010 census, the population of Park View Windsor Hills was 8,000. The racial makeup of the community was 79.3% African American, 11.2% White, 4.2% Asian, and 5.3% other. The median household income was $41,945, and the median age was 33.7 years.
Conclusion
Park View Windsor Hills is a small, unincorporated community located in Los Angeles County, California. It is a predominantly African-American community, with a population of approximately 8,000 people. The area is characterized by rolling hills and is home to several parks, including the Park View Recreation Center and the Windsor Hills Park. The economy of Park View Windsor Hills is largely driven by the service industry, and the population is largely African-American.
Common Questions
What is Per Capita Income in View Park Windsor Hills?
Per Capita income in View Park Windsor Hills is $53,787.
What is the Median Family Income in View Park Windsor Hills?
Median Family Income in View Park Windsor Hills is $121,235.
What is the Median Household income in View Park Windsor Hills?
Median Household Income in View Park Windsor Hills is $112,674.
What is Income or Wage Gap in View Park Windsor Hills?
Income or Wage Gap in View Park Windsor Hills is 7.8%.
Women in View Park Windsor Hills earn 92.2 cents for every dollar earned by a man.
What is Inequality or Gini Index in View Park Windsor Hills?
Inequality or Gini Index in View Park Windsor Hills is 0.41.
What is the Total Population of View Park Windsor Hills?
Total Population of View Park Windsor Hills is 11,999.
What is the Total Male Population of View Park Windsor Hills?
Total Male Population of View Park Windsor Hills is 5,739.
What is the Total Female Population of View Park Windsor Hills?
Total Female Population of View Park Windsor Hills is 6,260.
What is the Ratio of Males per 100 Females in View Park Windsor Hills?
There are 91.68 Males per 100 Females in View Park Windsor Hills.
What is the Ratio of Females per 100 Males in View Park Windsor Hills?
There are 109.08 Females per 100 Males in View Park Windsor Hills.
What is the Median Population Age in View Park Windsor Hills?
Median Population Age in View Park Windsor Hills is 47.9 Years.
What is the Average Family Size in View Park Windsor Hills
Average Family Size in View Park Windsor Hills is 3.0 People.
What is the Average Household Size in View Park Windsor Hills
Average Household Size in View Park Windsor Hills is 2.4 People.
How Large is the Labor Force in View Park Windsor Hills?
There are 6,205 People in the Labor Forcein in View Park Windsor Hills.
What is the Percentage of People in the Labor Force in View Park Windsor Hills?
60.4% of People are in the Labor Force in View Park Windsor Hills.
What is the Unemployment Rate in View Park Windsor Hills?
Unemployment Rate in View Park Windsor Hills is 11.3%.