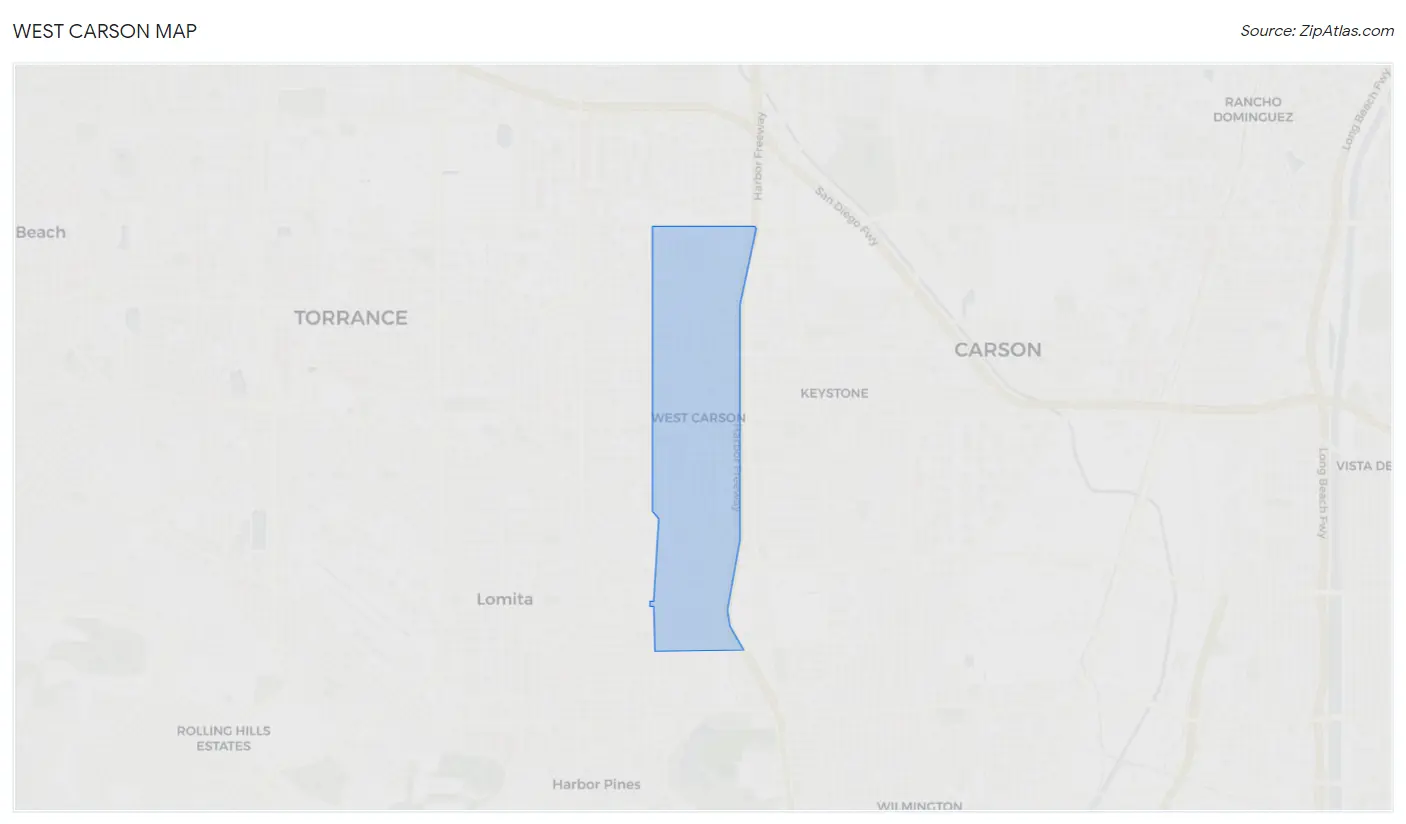
West Carson, CA Map & Demographics
West Carson Map
West Carson Overview
$42,730
PER CAPITA INCOME
$104,138
AVG FAMILY INCOME
$91,495
AVG HOUSEHOLD INCOME
7.5%
WAGE / INCOME GAP [ % ]
92.5¢/ $1
WAGE / INCOME GAP [ $ ]
0.43
INEQUALITY / GINI INDEX
22,240
TOTAL POPULATION
10,581
MALE POPULATION
11,659
FEMALE POPULATION
90.75
MALES / 100 FEMALES
110.19
FEMALES / 100 MALES
45.8
MEDIAN AGE
3.1
AVG FAMILY SIZE
2.7
AVG HOUSEHOLD SIZE
11,817
LABOR FORCE [ PEOPLE ]
61.3%
PERCENT IN LABOR FORCE
5.3%
UNEMPLOYMENT RATE
Income in West Carson
Income Overview in West Carson
Per Capita Income in West Carson is $42,730, while median incomes of families and households are $104,138 and $91,495 respectively.
| Characteristic | Number | Measure |
| Per Capita Income | 22,240 | $42,730 |
| Median Family Income | 5,758 | $104,138 |
| Mean Family Income | 5,758 | $122,655 |
| Median Household Income | 7,942 | $91,495 |
| Mean Household Income | 7,942 | $115,319 |
| Income Deficit | 5,758 | $0 |
| Wage / Income Gap (%) | 22,240 | 7.52% |
| Wage / Income Gap ($) | 22,240 | 92.48¢ per $1 |
| Gini / Inequality Index | 22,240 | 0.43 |
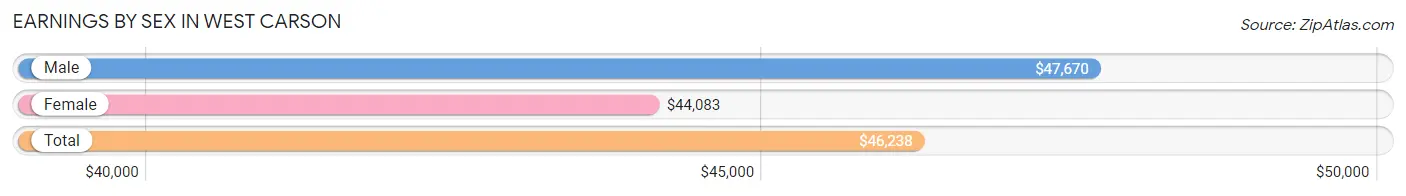
Earnings by Sex in West Carson
Average Earnings in West Carson are $46,238, $47,670 for men and $44,083 for women, a difference of 7.5%.
| Sex | Number | Average Earnings |
| Male | 6,173 (51.2%) | $47,670 |
| Female | 5,881 (48.8%) | $44,083 |
| Total | 12,054 (100.0%) | $46,238 |
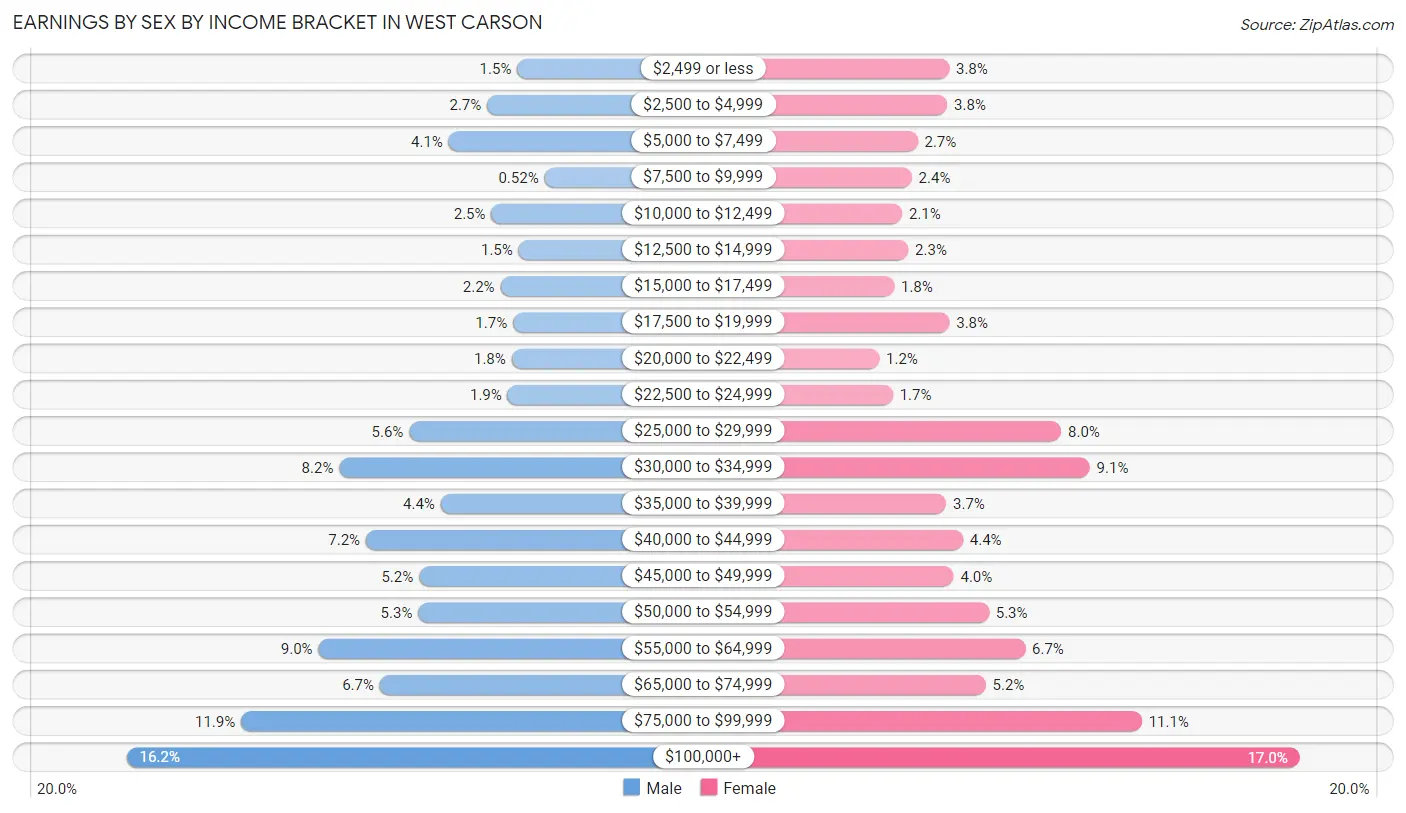
Earnings by Sex by Income Bracket in West Carson
The most common earnings brackets in West Carson are $100,000+ for men (999 | 16.2%) and $100,000+ for women (998 | 17.0%).
| Income | Male | Female |
| $2,499 or less | 95 (1.5%) | 225 (3.8%) |
| $2,500 to $4,999 | 165 (2.7%) | 221 (3.8%) |
| $5,000 to $7,499 | 254 (4.1%) | 156 (2.6%) |
| $7,500 to $9,999 | 32 (0.5%) | 143 (2.4%) |
| $10,000 to $12,499 | 155 (2.5%) | 122 (2.1%) |
| $12,500 to $14,999 | 92 (1.5%) | 135 (2.3%) |
| $15,000 to $17,499 | 134 (2.2%) | 104 (1.8%) |
| $17,500 to $19,999 | 105 (1.7%) | 226 (3.8%) |
| $20,000 to $22,499 | 108 (1.8%) | 71 (1.2%) |
| $22,500 to $24,999 | 117 (1.9%) | 101 (1.7%) |
| $25,000 to $29,999 | 345 (5.6%) | 472 (8.0%) |
| $30,000 to $34,999 | 507 (8.2%) | 535 (9.1%) |
| $35,000 to $39,999 | 272 (4.4%) | 219 (3.7%) |
| $40,000 to $44,999 | 445 (7.2%) | 256 (4.3%) |
| $45,000 to $49,999 | 322 (5.2%) | 235 (4.0%) |
| $50,000 to $54,999 | 324 (5.2%) | 313 (5.3%) |
| $55,000 to $64,999 | 555 (9.0%) | 393 (6.7%) |
| $65,000 to $74,999 | 413 (6.7%) | 306 (5.2%) |
| $75,000 to $99,999 | 734 (11.9%) | 650 (11.1%) |
| $100,000+ | 999 (16.2%) | 998 (17.0%) |
| Total | 6,173 (100.0%) | 5,881 (100.0%) |
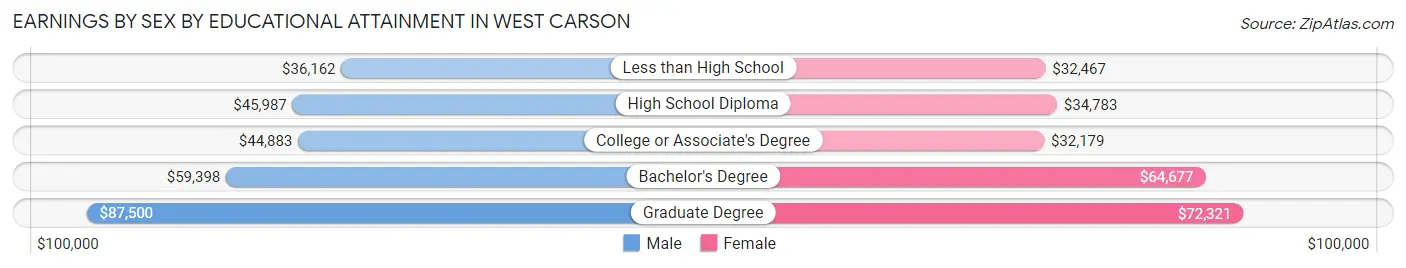
Earnings by Sex by Educational Attainment in West Carson
Average earnings in West Carson are $51,516 for men and $47,093 for women, a difference of 8.6%. Men with an educational attainment of graduate degree enjoy the highest average annual earnings of $87,500, while those with less than high school education earn the least with $36,162. Women with an educational attainment of graduate degree earn the most with the average annual earnings of $72,321, while those with college or associate's degree education have the smallest earnings of $32,179.
| Educational Attainment | Male Income | Female Income |
| Less than High School | $36,162 | $32,467 |
| High School Diploma | $45,987 | $34,783 |
| College or Associate's Degree | $44,883 | $32,179 |
| Bachelor's Degree | $59,398 | $64,677 |
| Graduate Degree | $87,500 | $72,321 |
| Total | $51,516 | $47,093 |
Family Income in West Carson
Family Income Brackets in West Carson
According to the West Carson family income data, there are 1,324 families falling into the $100,000 to $149,999 income range, which is the most common income bracket and makes up 23.0% of all families. Conversely, the $10,000 to $14,999 income bracket is the least frequent group with only 23 families (0.4%) belonging to this category.
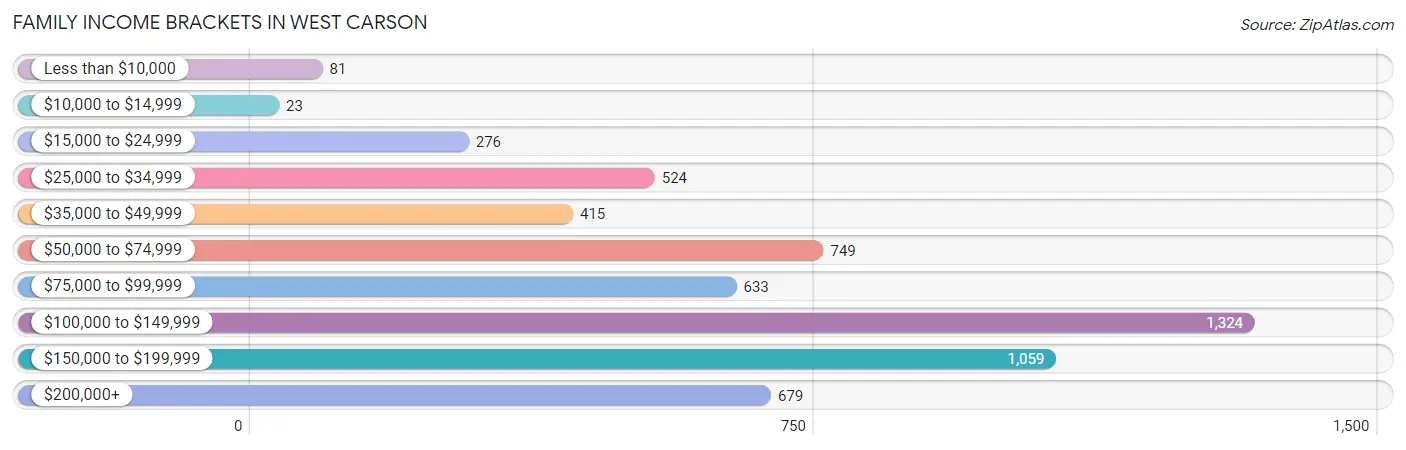
| Income Bracket | # Families | % Families |
| Less than $10,000 | 81 | 1.4% |
| $10,000 to $14,999 | 23 | 0.4% |
| $15,000 to $24,999 | 276 | 4.8% |
| $25,000 to $34,999 | 524 | 9.1% |
| $35,000 to $49,999 | 415 | 7.2% |
| $50,000 to $74,999 | 749 | 13.0% |
| $75,000 to $99,999 | 633 | 11.0% |
| $100,000 to $149,999 | 1,324 | 23.0% |
| $150,000 to $199,999 | 1,059 | 18.4% |
| $200,000+ | 679 | 11.8% |
Family Income by Famaliy Size in West Carson
7+ person families (81 | 1.4%) account for the highest median family income in West Carson with $176,424 per family, while 3-person families (1,256 | 21.8%) have the highest median income of $42,354 per family member.
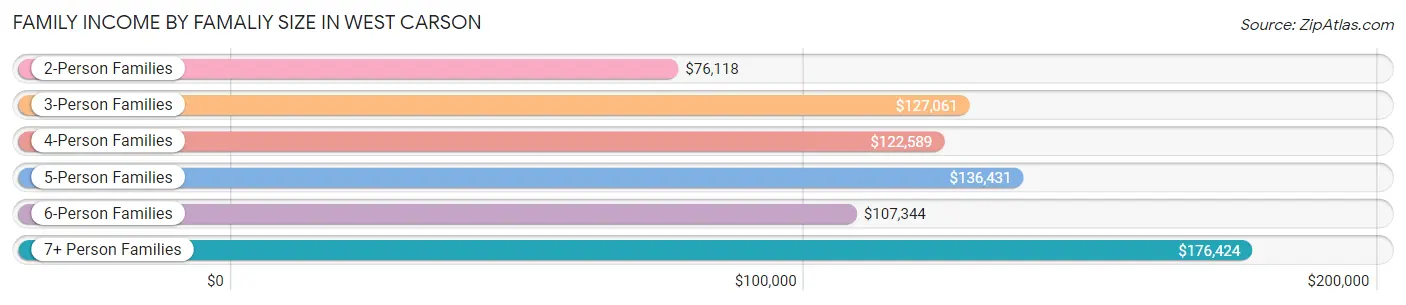
| Income Bracket | # Families | Median Income |
| 2-Person Families | 2,843 (49.4%) | $76,118 |
| 3-Person Families | 1,256 (21.8%) | $127,061 |
| 4-Person Families | 962 (16.7%) | $122,589 |
| 5-Person Families | 467 (8.1%) | $136,431 |
| 6-Person Families | 149 (2.6%) | $107,344 |
| 7+ Person Families | 81 (1.4%) | $176,424 |
| Total | 5,758 (100.0%) | $104,138 |
Family Income by Number of Earners in West Carson
The median family income in West Carson is $104,138, with families comprising 3+ earners (1,128) having the highest median family income of $159,347, while families with no earners (1,124) have the lowest median family income of $37,778, accounting for 19.6% and 19.5% of families, respectively.
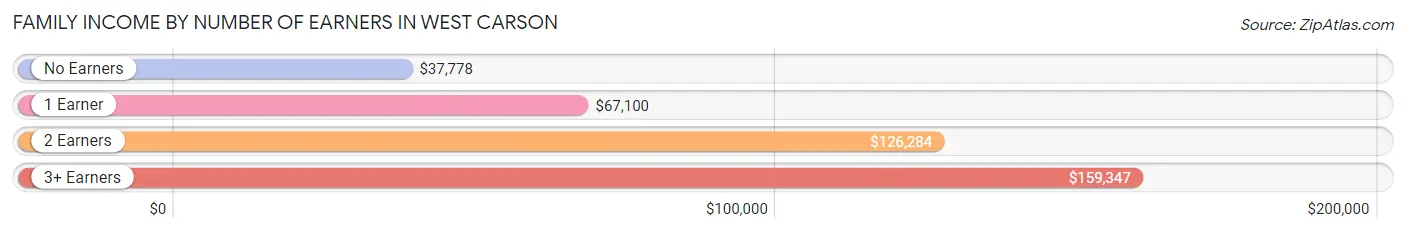
| Number of Earners | # Families | Median Income |
| No Earners | 1,124 (19.5%) | $37,778 |
| 1 Earner | 1,336 (23.2%) | $67,100 |
| 2 Earners | 2,170 (37.7%) | $126,284 |
| 3+ Earners | 1,128 (19.6%) | $159,347 |
| Total | 5,758 (100.0%) | $104,138 |
Household Income in West Carson
Household Income Brackets in West Carson
With 1,715 households falling in the category, the $100,000 to $149,999 income range is the most frequent in West Carson, accounting for 21.6% of all households. In contrast, only 111 households (1.4%) fall into the $10,000 to $14,999 income bracket, making it the least populous group.
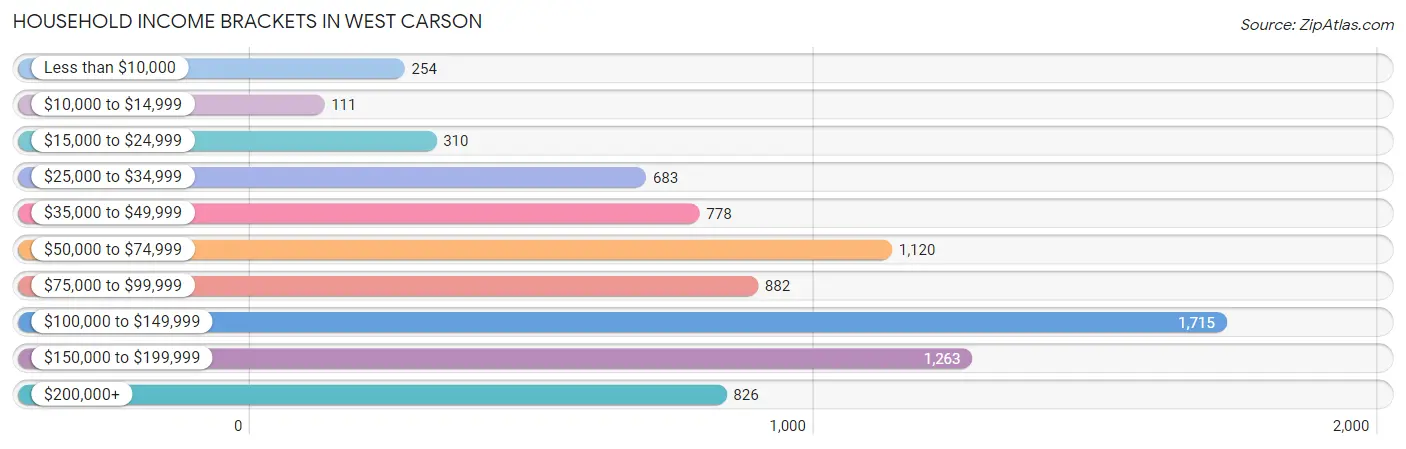
| Income Bracket | # Households | % Households |
| Less than $10,000 | 254 | 3.2% |
| $10,000 to $14,999 | 111 | 1.4% |
| $15,000 to $24,999 | 310 | 3.9% |
| $25,000 to $34,999 | 683 | 8.6% |
| $35,000 to $49,999 | 778 | 9.8% |
| $50,000 to $74,999 | 1,120 | 14.1% |
| $75,000 to $99,999 | 882 | 11.1% |
| $100,000 to $149,999 | 1,715 | 21.6% |
| $150,000 to $199,999 | 1,263 | 15.9% |
| $200,000+ | 826 | 10.4% |
Household Income by Householder Age in West Carson
The median household income in West Carson is $91,495, with the highest median household income of $123,639 found in the 45 to 64 years age bracket for the primary householder. A total of 3,061 households (38.5%) fall into this category. Meanwhile, the 15 to 24 years age bracket for the primary householder has the lowest median household income of $0, with 74 households (0.9%) in this group.
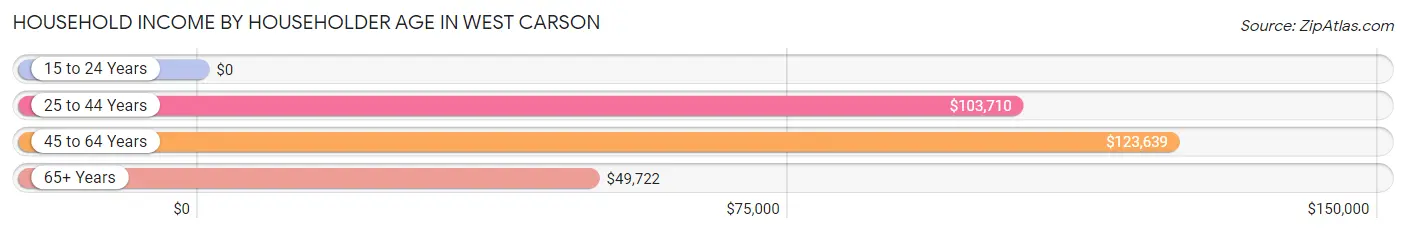
| Income Bracket | # Households | Median Income |
| 15 to 24 Years | 74 (0.9%) | $0 |
| 25 to 44 Years | 2,079 (26.2%) | $103,710 |
| 45 to 64 Years | 3,061 (38.5%) | $123,639 |
| 65+ Years | 2,728 (34.4%) | $49,722 |
| Total | 7,942 (100.0%) | $91,495 |
Poverty in West Carson
Income Below Poverty by Sex and Age in West Carson
With 7.6% poverty level for males and 10.3% for females among the residents of West Carson, 5 year old males and 18 to 24 year old females are the most vulnerable to poverty, with 32 males (49.2%) and 140 females (20.8%) in their respective age groups living below the poverty level.
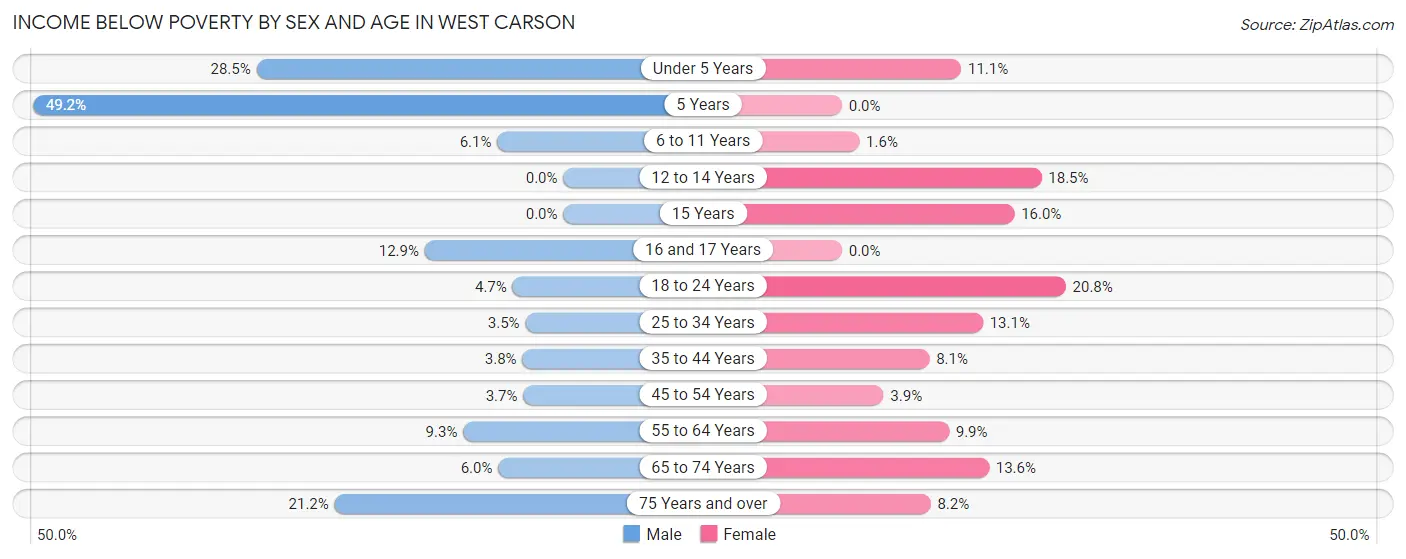
| Age Bracket | Male | Female |
| Under 5 Years | 123 (28.5%) | 56 (11.1%) |
| 5 Years | 32 (49.2%) | 0 (0.0%) |
| 6 to 11 Years | 32 (6.1%) | 7 (1.6%) |
| 12 to 14 Years | 0 (0.0%) | 70 (18.5%) |
| 15 Years | 0 (0.0%) | 12 (16.0%) |
| 16 and 17 Years | 27 (12.9%) | 0 (0.0%) |
| 18 to 24 Years | 32 (4.7%) | 140 (20.8%) |
| 25 to 34 Years | 70 (3.5%) | 221 (13.1%) |
| 35 to 44 Years | 51 (3.8%) | 104 (8.1%) |
| 45 to 54 Years | 43 (3.7%) | 54 (3.9%) |
| 55 to 64 Years | 117 (9.3%) | 175 (9.9%) |
| 65 to 74 Years | 85 (6.0%) | 223 (13.6%) |
| 75 Years and over | 166 (21.2%) | 89 (8.2%) |
| Total | 778 (7.6%) | 1,151 (10.3%) |
Income Above Poverty by Sex and Age in West Carson
According to the poverty statistics in West Carson, males aged 12 to 14 years and females aged 5 years are the age groups that are most secure financially, with 100.0% of males and 100.0% of females in these age groups living above the poverty line.
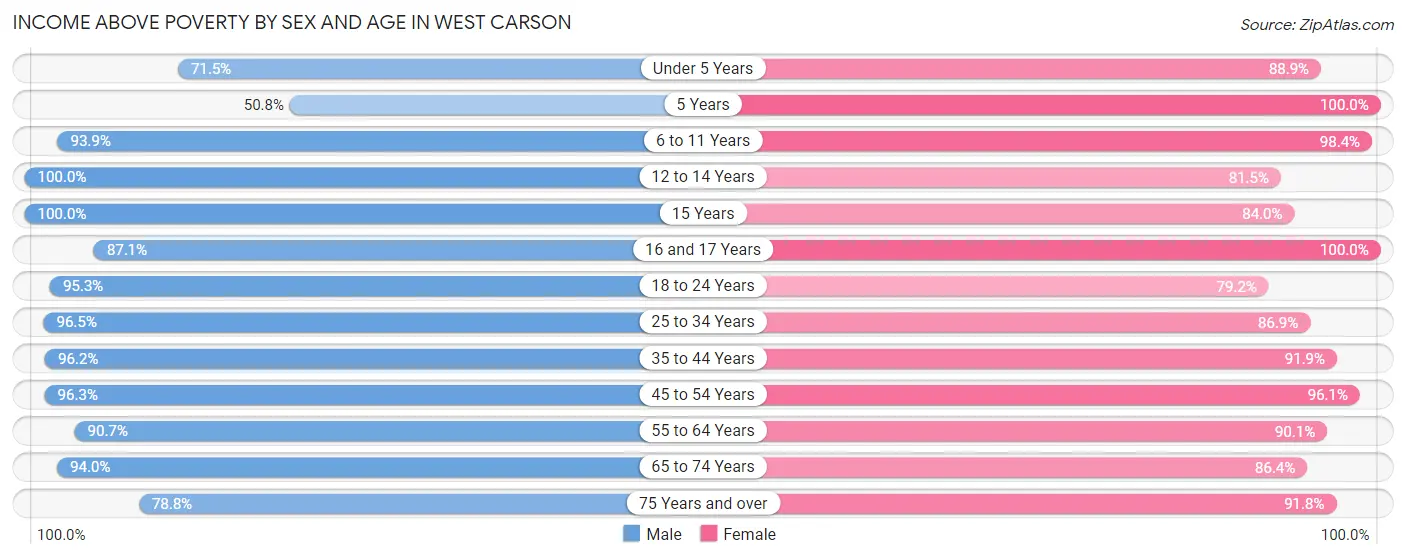
| Age Bracket | Male | Female |
| Under 5 Years | 309 (71.5%) | 450 (88.9%) |
| 5 Years | 33 (50.8%) | 124 (100.0%) |
| 6 to 11 Years | 490 (93.9%) | 428 (98.4%) |
| 12 to 14 Years | 269 (100.0%) | 308 (81.5%) |
| 15 Years | 58 (100.0%) | 63 (84.0%) |
| 16 and 17 Years | 183 (87.1%) | 154 (100.0%) |
| 18 to 24 Years | 648 (95.3%) | 534 (79.2%) |
| 25 to 34 Years | 1,917 (96.5%) | 1,468 (86.9%) |
| 35 to 44 Years | 1,290 (96.2%) | 1,178 (91.9%) |
| 45 to 54 Years | 1,113 (96.3%) | 1,344 (96.1%) |
| 55 to 64 Years | 1,143 (90.7%) | 1,588 (90.1%) |
| 65 to 74 Years | 1,323 (94.0%) | 1,412 (86.4%) |
| 75 Years and over | 616 (78.8%) | 992 (91.8%) |
| Total | 9,392 (92.3%) | 10,043 (89.7%) |
Income Below Poverty Among Married-Couple Families in West Carson
The poverty statistics for married-couple families in West Carson show that 4.3% or 171 of the total 3,963 families live below the poverty line. Families with 1 or 2 children have the highest poverty rate of 8.0%, comprising of 91 families. On the other hand, families with no children have the lowest poverty rate of 2.7%, which includes 73 families.
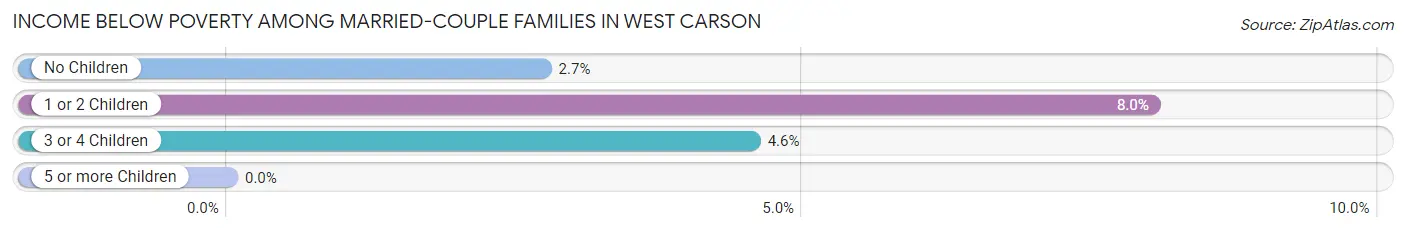
| Children | Above Poverty | Below Poverty |
| No Children | 2,603 (97.3%) | 73 (2.7%) |
| 1 or 2 Children | 1,042 (92.0%) | 91 (8.0%) |
| 3 or 4 Children | 147 (95.5%) | 7 (4.5%) |
| 5 or more Children | 0 (0.0%) | 0 (0.0%) |
| Total | 3,792 (95.7%) | 171 (4.3%) |
Income Below Poverty Among Single-Parent Households in West Carson
According to the poverty data in West Carson, 7.1% or 35 single-father households and 10.8% or 141 single-mother households are living below the poverty line. Among single-father households, those with 1 or 2 children have the highest poverty rate, with 17 households (36.2%) experiencing poverty. Likewise, among single-mother households, those with 3 or 4 children have the highest poverty rate, with 29 households (22.0%) falling below the poverty line.
| Children | Single Father | Single Mother |
| No Children | 18 (4.4%) | 68 (8.5%) |
| 1 or 2 Children | 17 (36.2%) | 44 (12.0%) |
| 3 or 4 Children | 0 (0.0%) | 29 (22.0%) |
| 5 or more Children | 0 (0.0%) | 0 (0.0%) |
| Total | 35 (7.1%) | 141 (10.8%) |
Income Below Poverty Among Married-Couple vs Single-Parent Households in West Carson
The poverty data for West Carson shows that 171 of the married-couple family households (4.3%) and 176 of the single-parent households (9.8%) are living below the poverty level. Within the married-couple family households, those with 1 or 2 children have the highest poverty rate, with 91 households (8.0%) falling below the poverty line. Among the single-parent households, those with 3 or 4 children have the highest poverty rate, with 29 household (17.4%) living below poverty.
| Children | Married-Couple Families | Single-Parent Households |
| No Children | 73 (2.7%) | 86 (7.1%) |
| 1 or 2 Children | 91 (8.0%) | 61 (14.7%) |
| 3 or 4 Children | 7 (4.5%) | 29 (17.4%) |
| 5 or more Children | 0 (0.0%) | 0 (0.0%) |
| Total | 171 (4.3%) | 176 (9.8%) |
Race in West Carson
The most populous races in West Carson are Asian (8,614 | 38.7%), Hispanic or Latino (7,002 | 31.5%), and White / Caucasian (4,917 | 22.1%).
| Race | # Population | % Population |
| Asian | 8,614 | 38.7% |
| Black / African American | 2,298 | 10.3% |
| Hawaiian / Pacific | 85 | 0.4% |
| Hispanic or Latino | 7,002 | 31.5% |
| Native / Alaskan | 228 | 1.0% |
| White / Caucasian | 4,917 | 22.1% |
| Two or more Races | 2,624 | 11.8% |
| Some other Race | 3,474 | 15.6% |
| Total | 22,240 | 100.0% |
Ancestry in West Carson
The most populous ancestries reported in West Carson are Mexican (5,786 | 26.0%), Korean (4,468 | 20.1%), Burmese (1,856 | 8.4%), Indian (Asian) (1,418 | 6.4%), and German (751 | 3.4%), together accounting for 64.2% of all West Carson residents.
| Ancestry | # Population | % Population |
| Afghan | 8 | 0.0% |
| African | 71 | 0.3% |
| Albanian | 1 | 0.0% |
| American | 580 | 2.6% |
| Arab | 45 | 0.2% |
| Argentinean | 31 | 0.1% |
| Armenian | 17 | 0.1% |
| Australian | 5 | 0.0% |
| Austrian | 6 | 0.0% |
| Bangladeshi | 11 | 0.1% |
| Basque | 23 | 0.1% |
| Belgian | 24 | 0.1% |
| Belizean | 139 | 0.6% |
| Bhutanese | 711 | 3.2% |
| Bulgarian | 45 | 0.2% |
| Burmese | 1,856 | 8.4% |
| Canadian | 9 | 0.0% |
| Central American | 339 | 1.5% |
| Central American Indian | 104 | 0.5% |
| Cherokee | 244 | 1.1% |
| Chinese | 62 | 0.3% |
| Choctaw | 26 | 0.1% |
| Colombian | 27 | 0.1% |
| Creek | 110 | 0.5% |
| Cuban | 94 | 0.4% |
| Czech | 15 | 0.1% |
| Czechoslovakian | 25 | 0.1% |
| Danish | 37 | 0.2% |
| Dominican | 15 | 0.1% |
| Dutch | 58 | 0.3% |
| Ecuadorian | 139 | 0.6% |
| Egyptian | 17 | 0.1% |
| English | 443 | 2.0% |
| European | 161 | 0.7% |
| Filipino | 75 | 0.3% |
| Finnish | 8 | 0.0% |
| French | 305 | 1.4% |
| French Canadian | 16 | 0.1% |
| German | 751 | 3.4% |
| Ghanaian | 15 | 0.1% |
| Greek | 75 | 0.3% |
| Guamanian / Chamorro | 13 | 0.1% |
| Guatemalan | 108 | 0.5% |
| Haitian | 16 | 0.1% |
| Hungarian | 25 | 0.1% |
| Indian (Asian) | 1,418 | 6.4% |
| Indonesian | 22 | 0.1% |
| Iranian | 121 | 0.5% |
| Irish | 644 | 2.9% |
| Italian | 366 | 1.7% |
| Japanese | 74 | 0.3% |
| Korean | 4,468 | 20.1% |
| Laotian | 74 | 0.3% |
| Lebanese | 3 | 0.0% |
| Lithuanian | 8 | 0.0% |
| Mexican | 5,786 | 26.0% |
| Mexican American Indian | 218 | 1.0% |
| Native Hawaiian | 5 | 0.0% |
| Nepalese | 47 | 0.2% |
| Nicaraguan | 16 | 0.1% |
| Norwegian | 57 | 0.3% |
| Pakistani | 181 | 0.8% |
| Peruvian | 53 | 0.2% |
| Polish | 137 | 0.6% |
| Portuguese | 160 | 0.7% |
| Puerto Rican | 204 | 0.9% |
| Russian | 34 | 0.2% |
| Salvadoran | 215 | 1.0% |
| Samoan | 90 | 0.4% |
| Scandinavian | 53 | 0.2% |
| Scotch-Irish | 19 | 0.1% |
| Scottish | 207 | 0.9% |
| South African | 2 | 0.0% |
| South American | 307 | 1.4% |
| South American Indian | 130 | 0.6% |
| Spaniard | 25 | 0.1% |
| Spanish | 95 | 0.4% |
| Sri Lankan | 456 | 2.1% |
| Subsaharan African | 110 | 0.5% |
| Swedish | 46 | 0.2% |
| Swiss | 23 | 0.1% |
| Syrian | 25 | 0.1% |
| Thai | 79 | 0.4% |
| Trinidadian and Tobagonian | 80 | 0.4% |
| Ukrainian | 8 | 0.0% |
| Uruguayan | 57 | 0.3% |
| Vietnamese | 49 | 0.2% |
| Welsh | 97 | 0.4% |
| Yaqui | 16 | 0.1% |
| Yugoslavian | 38 | 0.2% | View All 90 Rows |
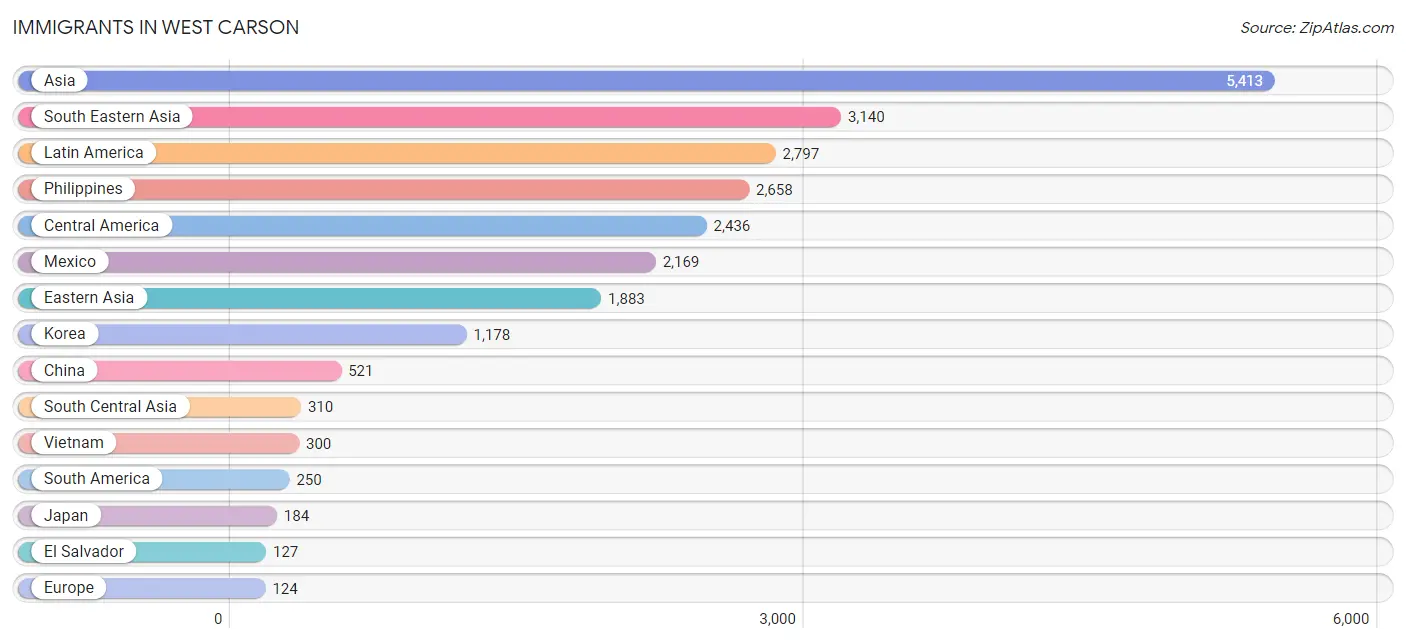
Immigrants in West Carson
The most numerous immigrant groups reported in West Carson came from Asia (5,413 | 24.3%), South Eastern Asia (3,140 | 14.1%), Latin America (2,797 | 12.6%), Philippines (2,658 | 11.9%), and Central America (2,436 | 11.0%), together accounting for 73.9% of all West Carson residents.
| Immigration Origin | # Population | % Population |
| Afghanistan | 8 | 0.0% |
| Africa | 75 | 0.3% |
| Argentina | 44 | 0.2% |
| Armenia | 6 | 0.0% |
| Asia | 5,413 | 24.3% |
| Australia | 5 | 0.0% |
| Austria | 11 | 0.1% |
| Bangladesh | 26 | 0.1% |
| Belize | 17 | 0.1% |
| Brazil | 11 | 0.1% |
| Cambodia | 17 | 0.1% |
| Caribbean | 111 | 0.5% |
| Central America | 2,436 | 11.0% |
| China | 521 | 2.3% |
| Colombia | 27 | 0.1% |
| Cuba | 31 | 0.1% |
| Denmark | 11 | 0.1% |
| Eastern Africa | 47 | 0.2% |
| Eastern Asia | 1,883 | 8.5% |
| Eastern Europe | 28 | 0.1% |
| Ecuador | 92 | 0.4% |
| Egypt | 11 | 0.1% |
| El Salvador | 127 | 0.6% |
| England | 9 | 0.0% |
| Europe | 124 | 0.6% |
| Germany | 23 | 0.1% |
| Ghana | 15 | 0.1% |
| Greece | 23 | 0.1% |
| Guatemala | 100 | 0.4% |
| Hong Kong | 89 | 0.4% |
| India | 86 | 0.4% |
| Indonesia | 20 | 0.1% |
| Iran | 55 | 0.3% |
| Italy | 6 | 0.0% |
| Japan | 184 | 0.8% |
| Korea | 1,178 | 5.3% |
| Laos | 11 | 0.1% |
| Latin America | 2,797 | 12.6% |
| Lebanon | 3 | 0.0% |
| Mexico | 2,169 | 9.8% |
| Nepal | 112 | 0.5% |
| Nicaragua | 16 | 0.1% |
| Northern Africa | 11 | 0.1% |
| Northern Europe | 33 | 0.2% |
| Oceania | 29 | 0.1% |
| Pakistan | 6 | 0.0% |
| Panama | 7 | 0.0% |
| Peru | 19 | 0.1% |
| Philippines | 2,658 | 11.9% |
| Poland | 7 | 0.0% |
| Russia | 21 | 0.1% |
| Saudi Arabia | 18 | 0.1% |
| Singapore | 21 | 0.1% |
| South Africa | 2 | 0.0% |
| South America | 250 | 1.1% |
| South Central Asia | 310 | 1.4% |
| South Eastern Asia | 3,140 | 14.1% |
| Southern Europe | 29 | 0.1% |
| Sri Lanka | 17 | 0.1% |
| Taiwan | 58 | 0.3% |
| Thailand | 84 | 0.4% |
| Trinidad and Tobago | 80 | 0.4% |
| Turkey | 5 | 0.0% |
| Uruguay | 57 | 0.3% |
| Vietnam | 300 | 1.3% |
| Western Africa | 15 | 0.1% |
| Western Asia | 80 | 0.4% |
| Western Europe | 34 | 0.2% | View All 68 Rows |
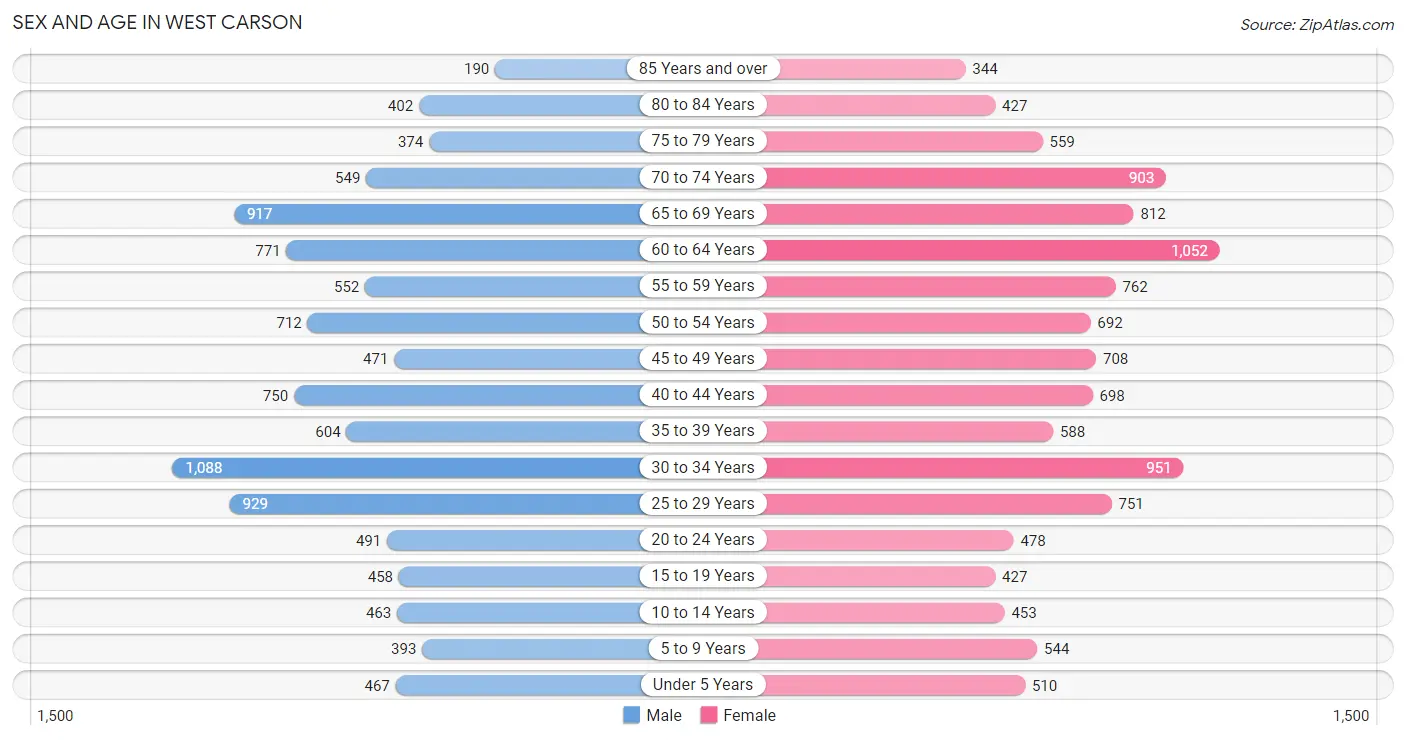
Sex and Age in West Carson
Sex and Age in West Carson
The most populous age groups in West Carson are 30 to 34 Years (1,088 | 10.3%) for men and 60 to 64 Years (1,052 | 9.0%) for women.
| Age Bracket | Male | Female |
| Under 5 Years | 467 (4.4%) | 510 (4.4%) |
| 5 to 9 Years | 393 (3.7%) | 544 (4.7%) |
| 10 to 14 Years | 463 (4.4%) | 453 (3.9%) |
| 15 to 19 Years | 458 (4.3%) | 427 (3.7%) |
| 20 to 24 Years | 491 (4.6%) | 478 (4.1%) |
| 25 to 29 Years | 929 (8.8%) | 751 (6.4%) |
| 30 to 34 Years | 1,088 (10.3%) | 951 (8.2%) |
| 35 to 39 Years | 604 (5.7%) | 588 (5.0%) |
| 40 to 44 Years | 750 (7.1%) | 698 (6.0%) |
| 45 to 49 Years | 471 (4.4%) | 708 (6.1%) |
| 50 to 54 Years | 712 (6.7%) | 692 (5.9%) |
| 55 to 59 Years | 552 (5.2%) | 762 (6.5%) |
| 60 to 64 Years | 771 (7.3%) | 1,052 (9.0%) |
| 65 to 69 Years | 917 (8.7%) | 812 (7.0%) |
| 70 to 74 Years | 549 (5.2%) | 903 (7.7%) |
| 75 to 79 Years | 374 (3.5%) | 559 (4.8%) |
| 80 to 84 Years | 402 (3.8%) | 427 (3.7%) |
| 85 Years and over | 190 (1.8%) | 344 (2.9%) |
| Total | 10,581 (100.0%) | 11,659 (100.0%) |
Families and Households in West Carson
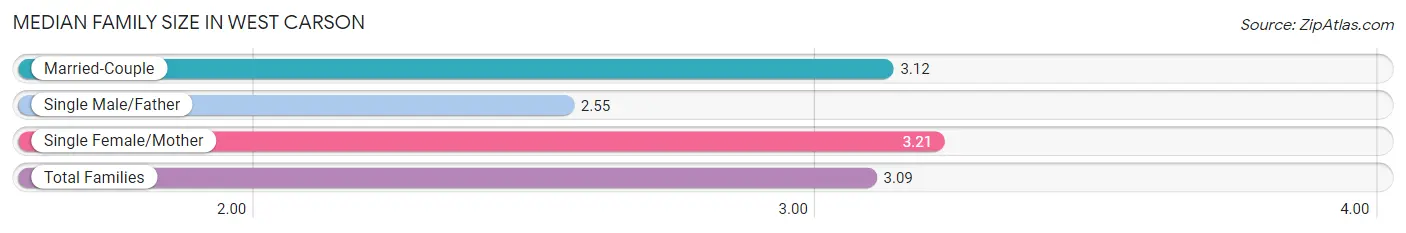
Median Family Size in West Carson
The median family size in West Carson is 3.09 persons per family, with single female/mother families (1,305 | 22.7%) accounting for the largest median family size of 3.21 persons per family. On the other hand, single male/father families (490 | 8.5%) represent the smallest median family size with 2.55 persons per family.
| Family Type | # Families | Family Size |
| Married-Couple | 3,963 (68.8%) | 3.12 |
| Single Male/Father | 490 (8.5%) | 2.55 |
| Single Female/Mother | 1,305 (22.7%) | 3.21 |
| Total Families | 5,758 (100.0%) | 3.09 |
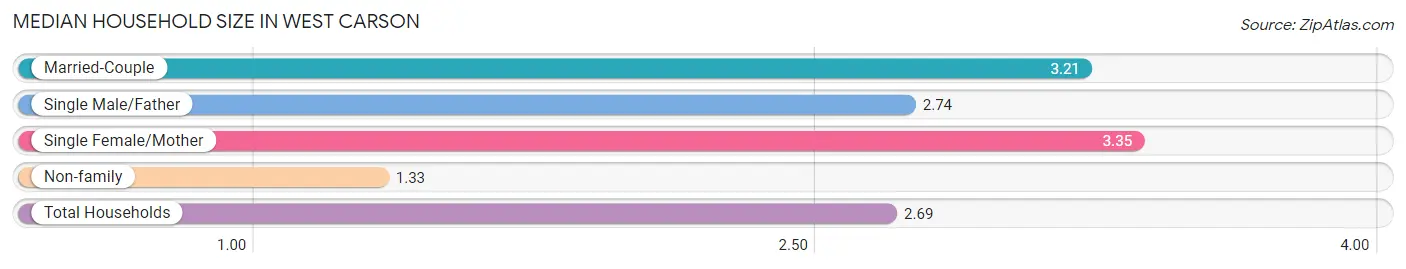
Median Household Size in West Carson
The median household size in West Carson is 2.69 persons per household, with single female/mother households (1,305 | 16.4%) accounting for the largest median household size of 3.35 persons per household. non-family households (2,184 | 27.5%) represent the smallest median household size with 1.33 persons per household.
| Household Type | # Households | Household Size |
| Married-Couple | 3,963 (49.9%) | 3.21 |
| Single Male/Father | 490 (6.2%) | 2.74 |
| Single Female/Mother | 1,305 (16.4%) | 3.35 |
| Non-family | 2,184 (27.5%) | 1.33 |
| Total Households | 7,942 (100.0%) | 2.69 |
Household Size by Marriage Status in West Carson
Out of a total of 7,942 households in West Carson, 5,758 (72.5%) are family households, while 2,184 (27.5%) are nonfamily households. The most numerous type of family households are 2-person households, comprising 2,670, and the most common type of nonfamily households are 1-person households, comprising 1,639.
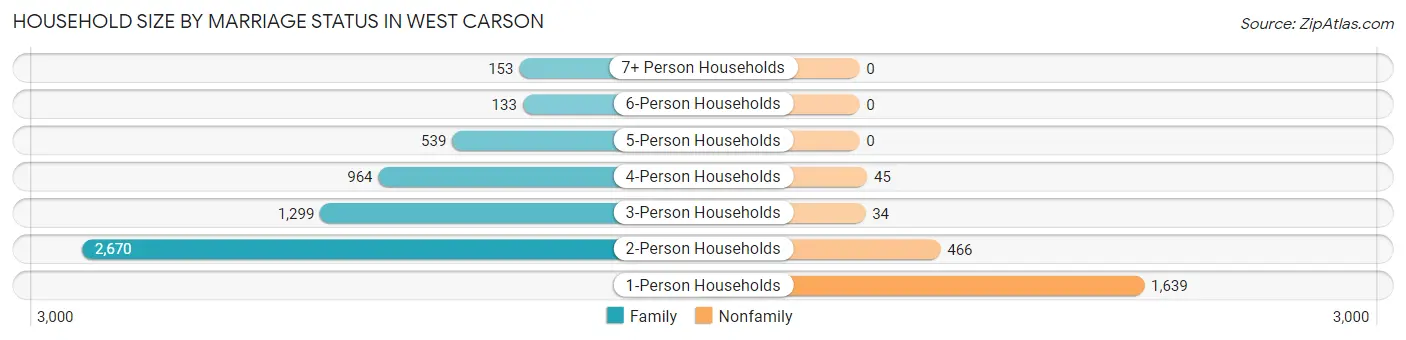
| Household Size | Family Households | Nonfamily Households |
| 1-Person Households | - | 1,639 (20.6%) |
| 2-Person Households | 2,670 (33.6%) | 466 (5.9%) |
| 3-Person Households | 1,299 (16.4%) | 34 (0.4%) |
| 4-Person Households | 964 (12.1%) | 45 (0.6%) |
| 5-Person Households | 539 (6.8%) | 0 (0.0%) |
| 6-Person Households | 133 (1.7%) | 0 (0.0%) |
| 7+ Person Households | 153 (1.9%) | 0 (0.0%) |
| Total | 5,758 (72.5%) | 2,184 (27.5%) |
Female Fertility in West Carson
Fertility by Age in West Carson
Average fertility rate in West Carson is 31.0 births per 1,000 women. Women in the age bracket of 15 to 19 years have the highest fertility rate with 63.0 births per 1,000 women. Women in the age bracket of 35 to 50 years acount for 45.0% of all women with births.
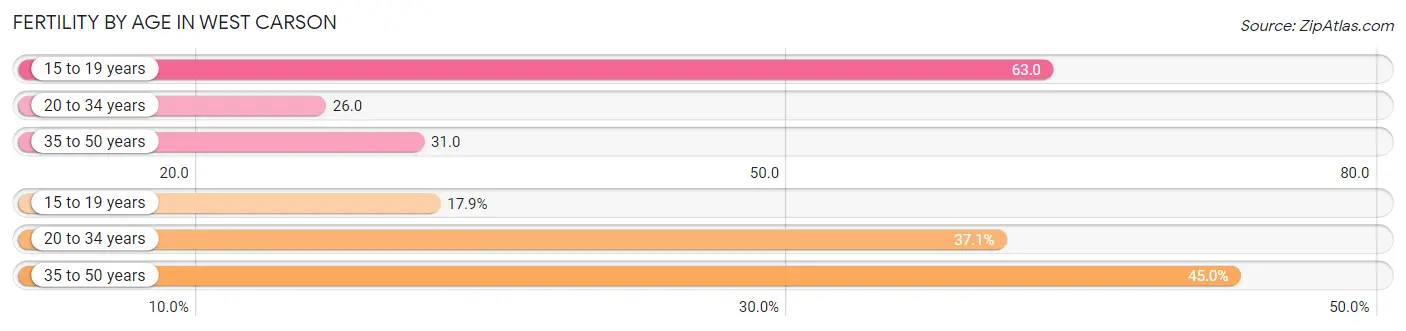
| Age Bracket | Women with Births | Births / 1,000 Women |
| 15 to 19 years | 27 (17.9%) | 63.0 |
| 20 to 34 years | 56 (37.1%) | 26.0 |
| 35 to 50 years | 68 (45.0%) | 31.0 |
| Total | 151 (100.0%) | 31.0 |
Fertility by Age by Marriage Status in West Carson
54.3% of women with births (151) in West Carson are married. The highest percentage of unmarried women with births falls into 15 to 19 years age bracket with 100.0% of them unmarried at the time of birth, while the lowest percentage of unmarried women with births belong to 20 to 34 years age bracket with 0.0% of them unmarried.
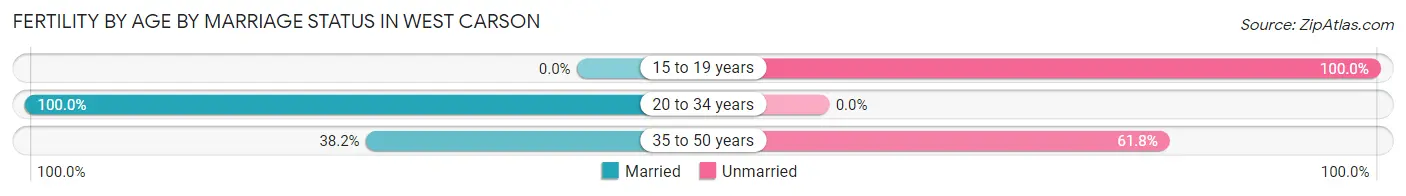
| Age Bracket | Married | Unmarried |
| 15 to 19 years | 0 (0.0%) | 27 (100.0%) |
| 20 to 34 years | 56 (100.0%) | 0 (0.0%) |
| 35 to 50 years | 26 (38.2%) | 42 (61.8%) |
| Total | 82 (54.3%) | 69 (45.7%) |
Fertility by Education in West Carson
Average fertility rate in West Carson is 31.0 births per 1,000 women. Women with the education attainment of graduate degree have the highest fertility rate of 61.0 births per 1,000 women, while women with the education attainment of college or associate's degree have the lowest fertility at 15.0 births per 1,000 women. Women with the education attainment of bachelor's degree represent 38.4% of all women with births.
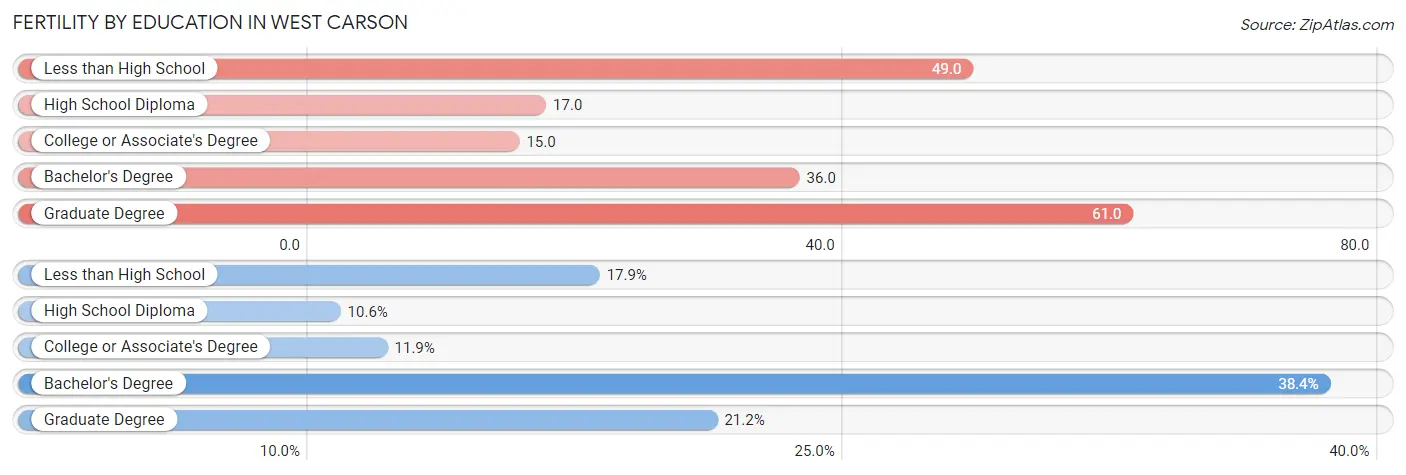
| Educational Attainment | Women with Births | Births / 1,000 Women |
| Less than High School | 27 (17.9%) | 49.0 |
| High School Diploma | 16 (10.6%) | 17.0 |
| College or Associate's Degree | 18 (11.9%) | 15.0 |
| Bachelor's Degree | 58 (38.4%) | 36.0 |
| Graduate Degree | 32 (21.2%) | 61.0 |
| Total | 151 (100.0%) | 31.0 |
Fertility by Education by Marriage Status in West Carson
45.7% of women with births in West Carson are unmarried. Women with the educational attainment of high school diploma are most likely to be married with 100.0% of them married at childbirth, while women with the educational attainment of less than high school are least likely to be married with 100.0% of them unmarried at childbirth.
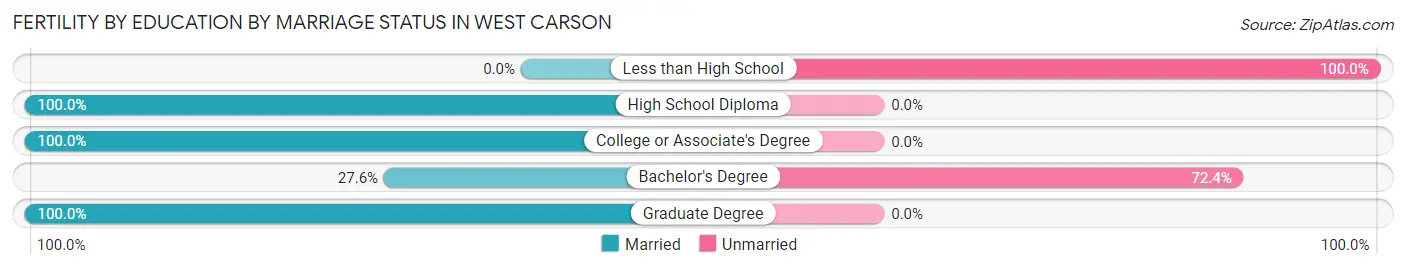
| Educational Attainment | Married | Unmarried |
| Less than High School | 0 (0.0%) | 27 (100.0%) |
| High School Diploma | 16 (100.0%) | 0 (0.0%) |
| College or Associate's Degree | 18 (100.0%) | 0 (0.0%) |
| Bachelor's Degree | 16 (27.6%) | 42 (72.4%) |
| Graduate Degree | 32 (100.0%) | 0 (0.0%) |
| Total | 82 (54.3%) | 69 (45.7%) |
Employment Characteristics in West Carson
Employment by Class of Employer in West Carson
Among the 10,948 employed individuals in West Carson, private company employees (7,168 | 65.5%), local government employees (1,627 | 14.9%), and self-employed (not incorporated) (765 | 7.0%) make up the most common classes of employment.
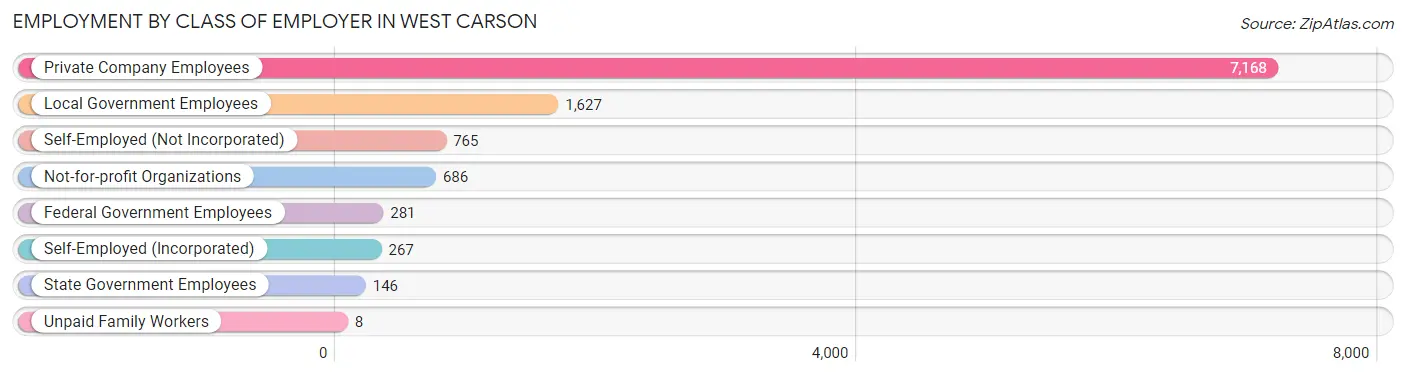
| Employer Class | # Employees | % Employees |
| Private Company Employees | 7,168 | 65.5% |
| Self-Employed (Incorporated) | 267 | 2.4% |
| Self-Employed (Not Incorporated) | 765 | 7.0% |
| Not-for-profit Organizations | 686 | 6.3% |
| Local Government Employees | 1,627 | 14.9% |
| State Government Employees | 146 | 1.3% |
| Federal Government Employees | 281 | 2.6% |
| Unpaid Family Workers | 8 | 0.1% |
| Total | 10,948 | 100.0% |
Employment Status by Age in West Carson
According to the labor force statistics for West Carson, out of the total population over 16 years of age (19,277), 61.3% or 11,817 individuals are in the labor force, with 5.3% or 626 of them unemployed. The age group with the highest labor force participation rate is 25 to 29 years, with 88.6% or 1,488 individuals in the labor force. Within the labor force, the 60 to 64 years age range has the highest percentage of unemployed individuals, with 14.4% or 169 of them being unemployed.
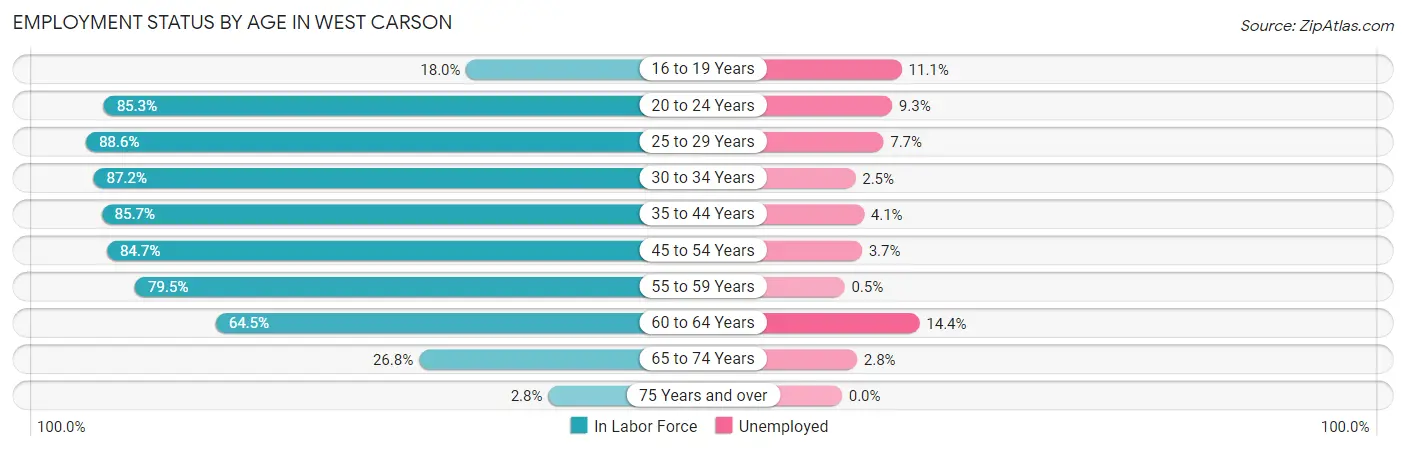
| Age Bracket | In Labor Force | Unemployed |
| 16 to 19 Years | 135 (18.0%) | 15 (11.1%) |
| 20 to 24 Years | 827 (85.3%) | 77 (9.3%) |
| 25 to 29 Years | 1,488 (88.6%) | 115 (7.7%) |
| 30 to 34 Years | 1,778 (87.2%) | 44 (2.5%) |
| 35 to 44 Years | 2,262 (85.7%) | 93 (4.1%) |
| 45 to 54 Years | 2,188 (84.7%) | 81 (3.7%) |
| 55 to 59 Years | 1,045 (79.5%) | 5 (0.5%) |
| 60 to 64 Years | 1,176 (64.5%) | 169 (14.4%) |
| 65 to 74 Years | 853 (26.8%) | 24 (2.8%) |
| 75 Years and over | 64 (2.8%) | 0 (0.0%) |
| Total | 11,817 (61.3%) | 626 (5.3%) |
Employment Status by Educational Attainment in West Carson
According to labor force statistics for West Carson, 82.2% of individuals (9,929) out of the total population between 25 and 64 years of age (12,079) are in the labor force, with 5.1% or 506 of them being unemployed. The group with the highest labor force participation rate are those with the educational attainment of bachelor's degree or higher, with 87.5% or 3,974 individuals in the labor force. Within the labor force, individuals with less than high school education have the highest percentage of unemployment, with 12.4% or 96 of them being unemployed.
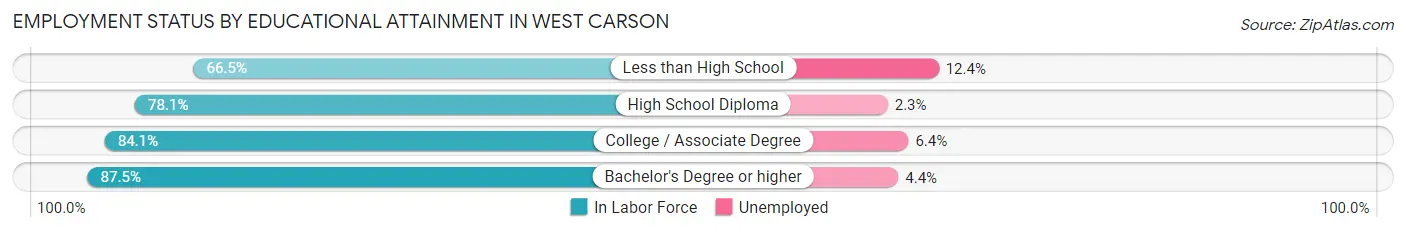
| Educational Attainment | In Labor Force | Unemployed |
| Less than High School | 775 (66.5%) | 145 (12.4%) |
| High School Diploma | 2,323 (78.1%) | 68 (2.3%) |
| College / Associate Degree | 2,857 (84.1%) | 217 (6.4%) |
| Bachelor's Degree or higher | 3,974 (87.5%) | 200 (4.4%) |
| Total | 9,929 (82.2%) | 616 (5.1%) |
Employment Occupations by Sex in West Carson
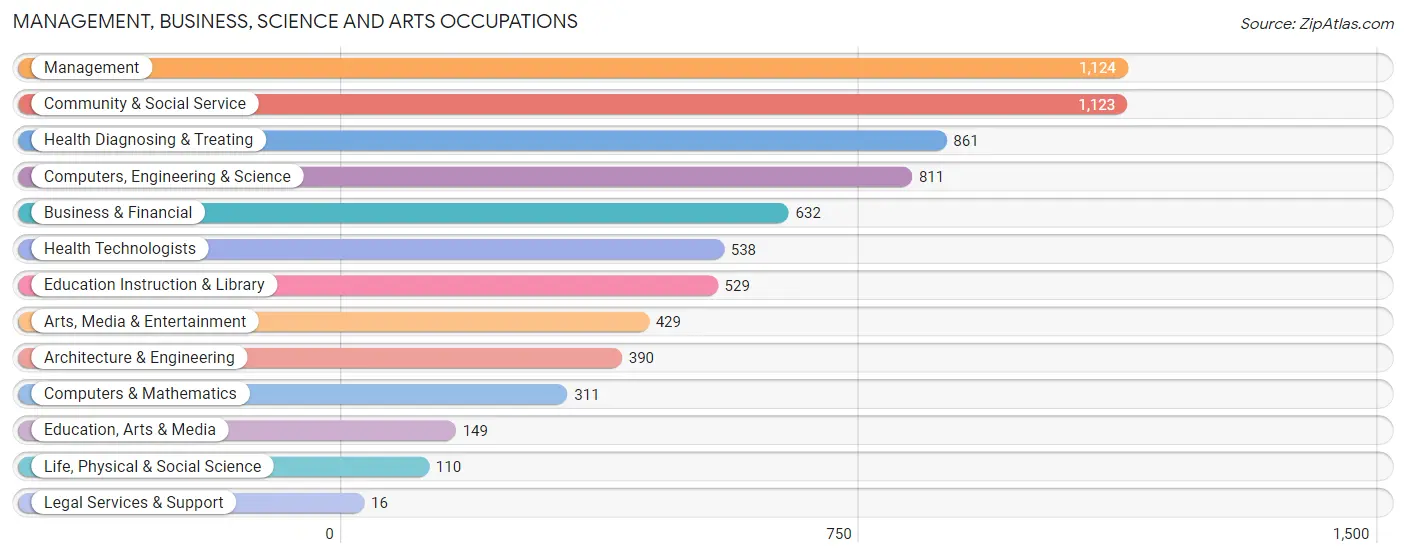
Management, Business, Science and Arts Occupations
The most common Management, Business, Science and Arts occupations in West Carson are Management (1,124 | 10.0%), Community & Social Service (1,123 | 10.0%), Health Diagnosing & Treating (861 | 7.7%), Computers, Engineering & Science (811 | 7.2%), and Business & Financial (632 | 5.7%).
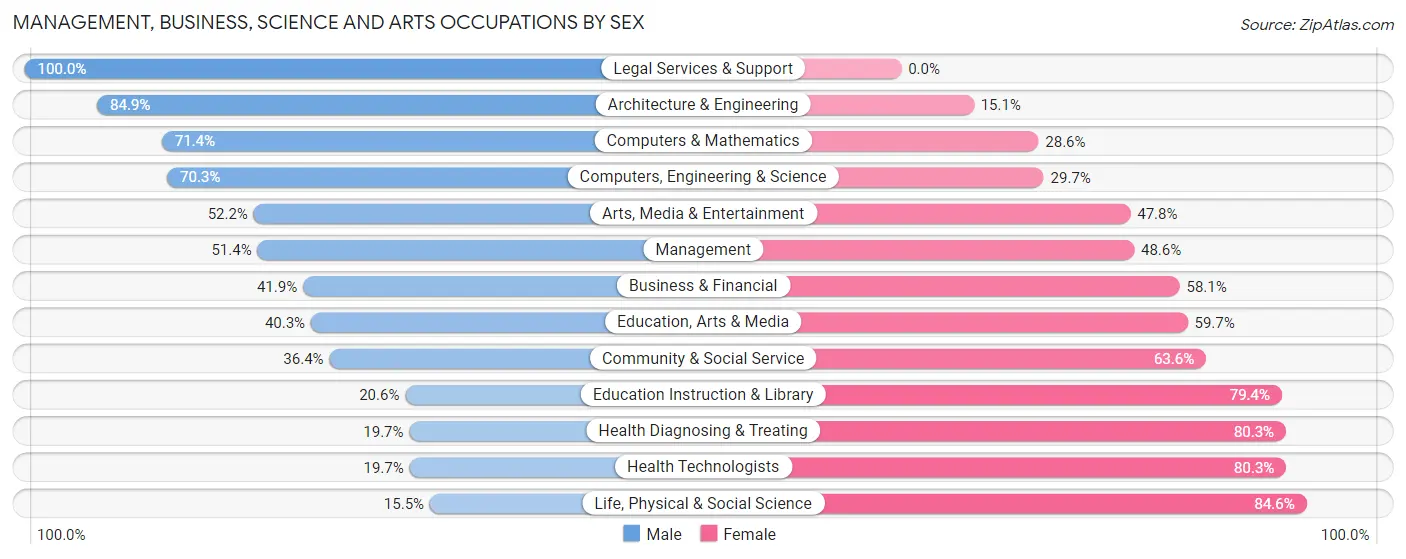
Management, Business, Science and Arts Occupations by Sex
Within the Management, Business, Science and Arts occupations in West Carson, the most male-oriented occupations are Legal Services & Support (100.0%), Architecture & Engineering (84.9%), and Computers & Mathematics (71.4%), while the most female-oriented occupations are Life, Physical & Social Science (84.6%), Health Technologists (80.3%), and Health Diagnosing & Treating (80.3%).
| Occupation | Male | Female |
| Management | 578 (51.4%) | 546 (48.6%) |
| Business & Financial | 265 (41.9%) | 367 (58.1%) |
| Computers, Engineering & Science | 570 (70.3%) | 241 (29.7%) |
| Computers & Mathematics | 222 (71.4%) | 89 (28.6%) |
| Architecture & Engineering | 331 (84.9%) | 59 (15.1%) |
| Life, Physical & Social Science | 17 (15.4%) | 93 (84.6%) |
| Community & Social Service | 409 (36.4%) | 714 (63.6%) |
| Education, Arts & Media | 60 (40.3%) | 89 (59.7%) |
| Legal Services & Support | 16 (100.0%) | 0 (0.0%) |
| Education Instruction & Library | 109 (20.6%) | 420 (79.4%) |
| Arts, Media & Entertainment | 224 (52.2%) | 205 (47.8%) |
| Health Diagnosing & Treating | 170 (19.7%) | 691 (80.3%) |
| Health Technologists | 106 (19.7%) | 432 (80.3%) |
| Total (Category) | 1,992 (43.8%) | 2,559 (56.2%) |
| Total (Overall) | 5,851 (52.3%) | 5,339 (47.7%) |
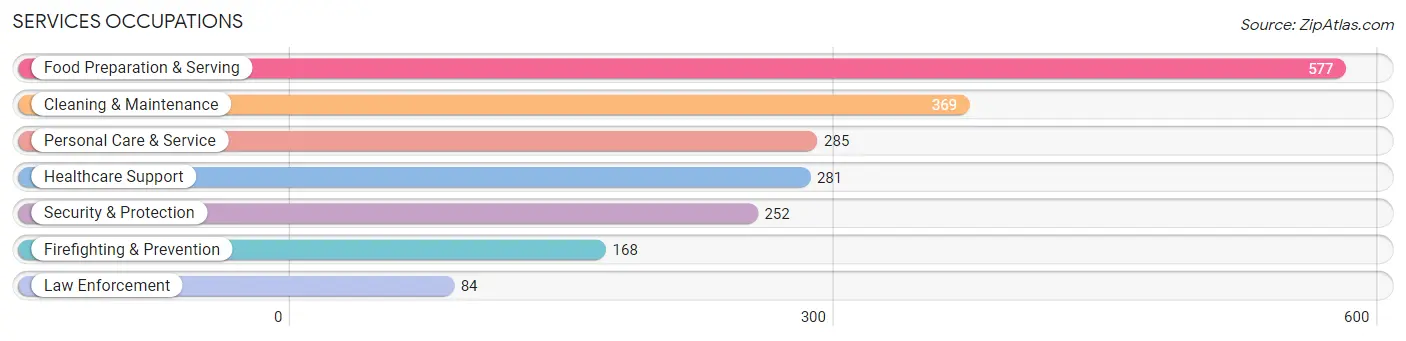
Services Occupations
The most common Services occupations in West Carson are Food Preparation & Serving (577 | 5.2%), Cleaning & Maintenance (369 | 3.3%), Personal Care & Service (285 | 2.5%), Healthcare Support (281 | 2.5%), and Security & Protection (252 | 2.2%).
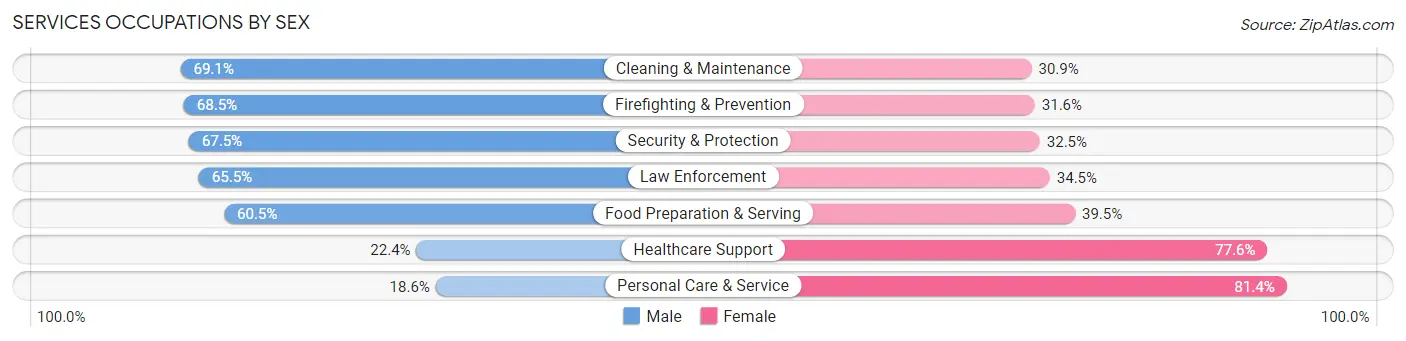
Services Occupations by Sex
Within the Services occupations in West Carson, the most male-oriented occupations are Cleaning & Maintenance (69.1%), Firefighting & Prevention (68.4%), and Security & Protection (67.5%), while the most female-oriented occupations are Personal Care & Service (81.4%), Healthcare Support (77.6%), and Food Preparation & Serving (39.5%).
| Occupation | Male | Female |
| Healthcare Support | 63 (22.4%) | 218 (77.6%) |
| Security & Protection | 170 (67.5%) | 82 (32.5%) |
| Firefighting & Prevention | 115 (68.4%) | 53 (31.6%) |
| Law Enforcement | 55 (65.5%) | 29 (34.5%) |
| Food Preparation & Serving | 349 (60.5%) | 228 (39.5%) |
| Cleaning & Maintenance | 255 (69.1%) | 114 (30.9%) |
| Personal Care & Service | 53 (18.6%) | 232 (81.4%) |
| Total (Category) | 890 (50.4%) | 874 (49.5%) |
| Total (Overall) | 5,851 (52.3%) | 5,339 (47.7%) |
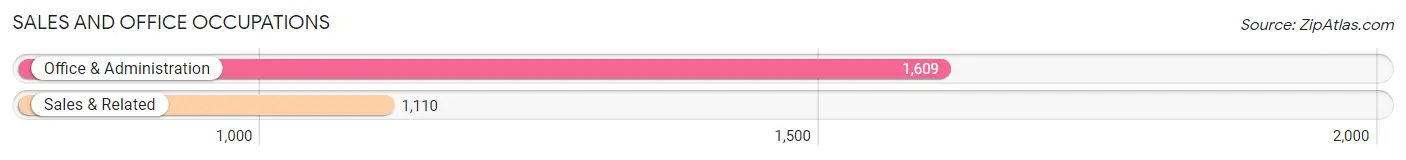
Sales and Office Occupations
The most common Sales and Office occupations in West Carson are Office & Administration (1,609 | 14.4%), and Sales & Related (1,110 | 9.9%).
Sales and Office Occupations by Sex
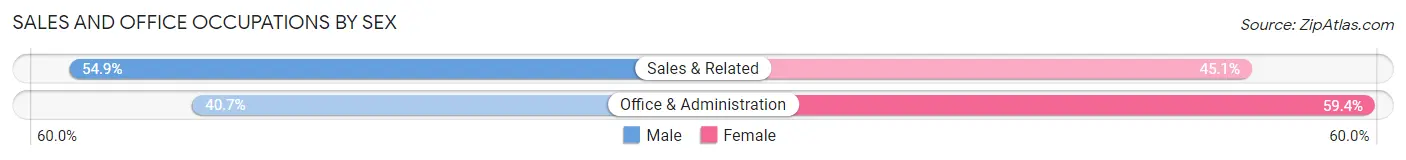
| Occupation | Male | Female |
| Sales & Related | 609 (54.9%) | 501 (45.1%) |
| Office & Administration | 654 (40.6%) | 955 (59.4%) |
| Total (Category) | 1,263 (46.5%) | 1,456 (53.5%) |
| Total (Overall) | 5,851 (52.3%) | 5,339 (47.7%) |
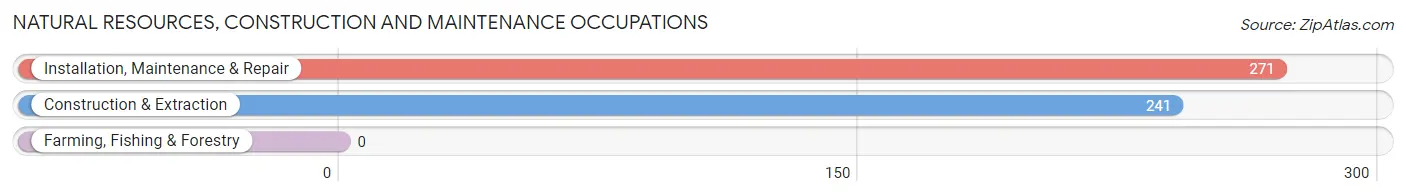
Natural Resources, Construction and Maintenance Occupations
The most common Natural Resources, Construction and Maintenance occupations in West Carson are Installation, Maintenance & Repair (271 | 2.4%), and Construction & Extraction (241 | 2.1%).
Natural Resources, Construction and Maintenance Occupations by Sex
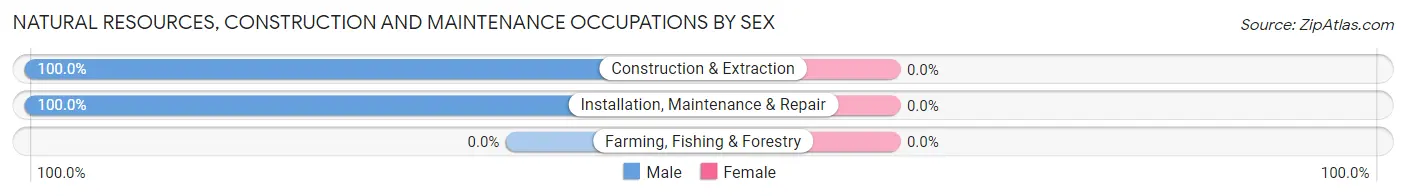
| Occupation | Male | Female |
| Farming, Fishing & Forestry | 0 (0.0%) | 0 (0.0%) |
| Construction & Extraction | 241 (100.0%) | 0 (0.0%) |
| Installation, Maintenance & Repair | 271 (100.0%) | 0 (0.0%) |
| Total (Category) | 512 (100.0%) | 0 (0.0%) |
| Total (Overall) | 5,851 (52.3%) | 5,339 (47.7%) |
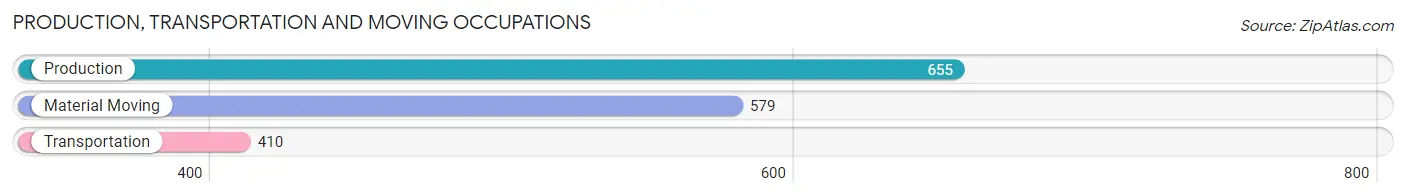
Production, Transportation and Moving Occupations
The most common Production, Transportation and Moving occupations in West Carson are Production (655 | 5.9%), Material Moving (579 | 5.2%), and Transportation (410 | 3.7%).
Production, Transportation and Moving Occupations by Sex
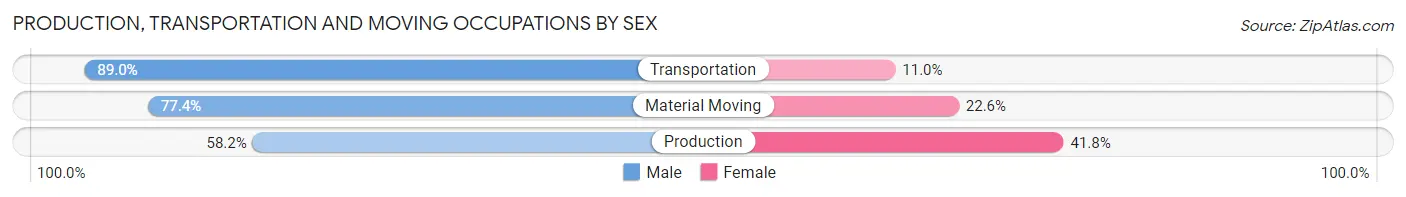
| Occupation | Male | Female |
| Production | 381 (58.2%) | 274 (41.8%) |
| Transportation | 365 (89.0%) | 45 (11.0%) |
| Material Moving | 448 (77.4%) | 131 (22.6%) |
| Total (Category) | 1,194 (72.6%) | 450 (27.4%) |
| Total (Overall) | 5,851 (52.3%) | 5,339 (47.7%) |
Employment Industries by Sex in West Carson
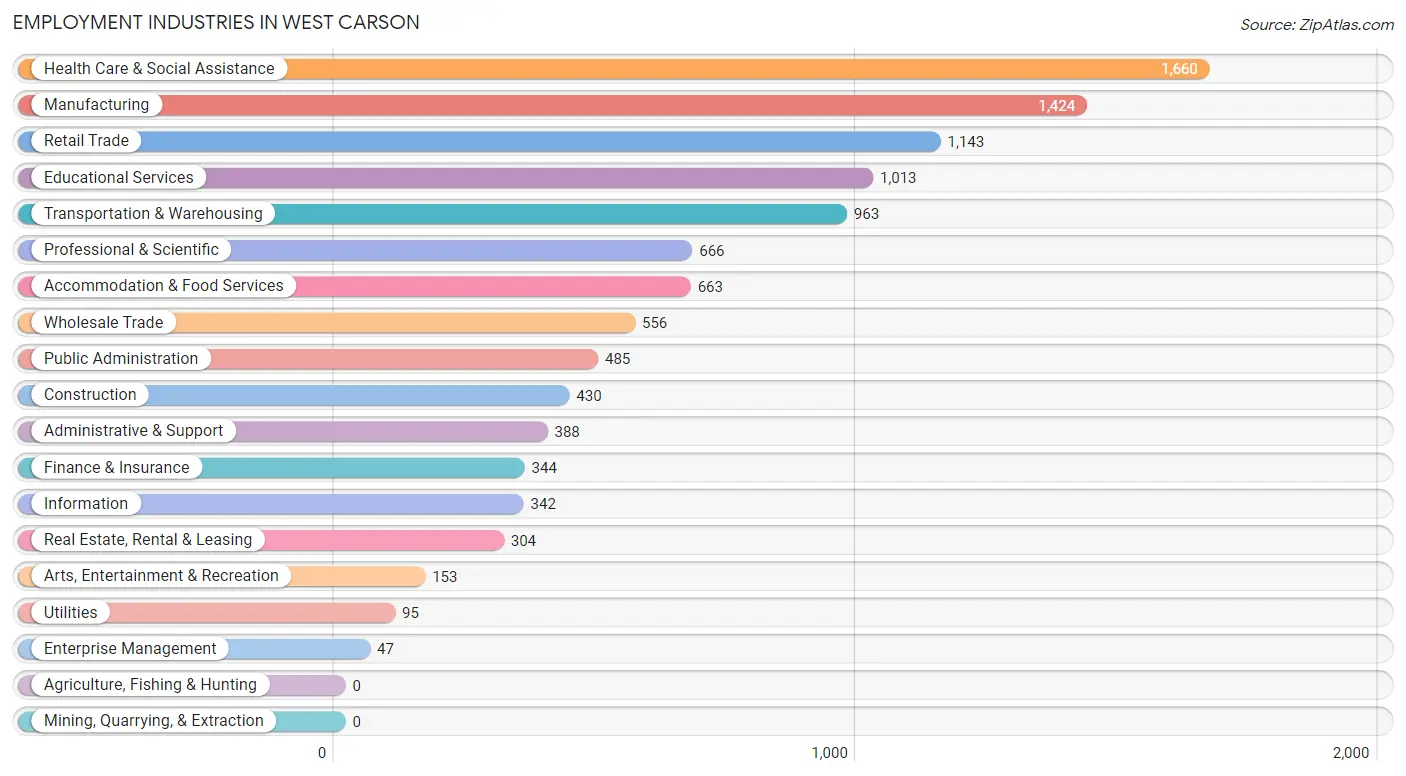
Employment Industries in West Carson
The major employment industries in West Carson include Health Care & Social Assistance (1,660 | 14.8%), Manufacturing (1,424 | 12.7%), Retail Trade (1,143 | 10.2%), Educational Services (1,013 | 9.0%), and Transportation & Warehousing (963 | 8.6%).
Employment Industries by Sex in West Carson
The West Carson industries that see more men than women are Utilities (100.0%), Construction (95.8%), and Information (87.4%), whereas the industries that tend to have a higher number of women are Enterprise Management (100.0%), Educational Services (75.7%), and Health Care & Social Assistance (75.5%).
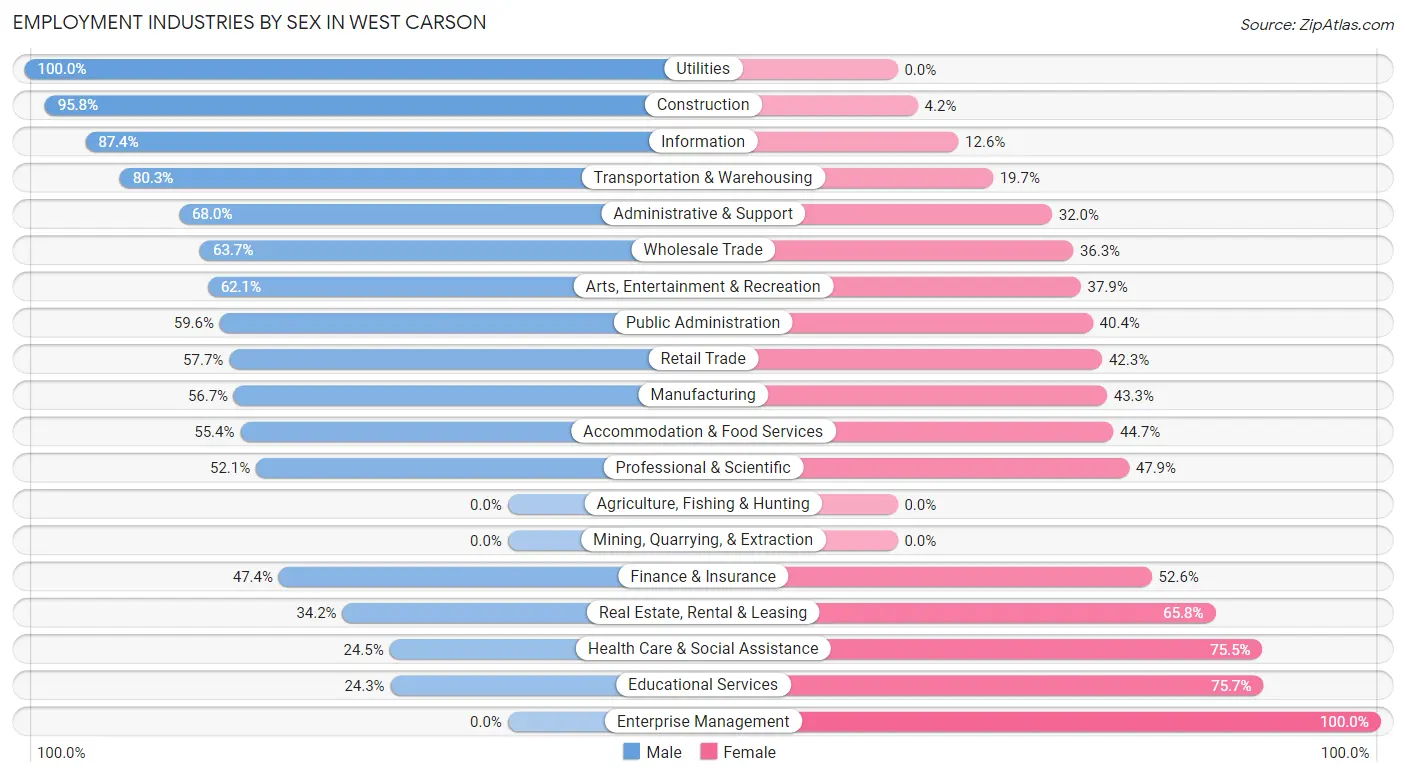
| Industry | Male | Female |
| Agriculture, Fishing & Hunting | 0 (0.0%) | 0 (0.0%) |
| Mining, Quarrying, & Extraction | 0 (0.0%) | 0 (0.0%) |
| Construction | 412 (95.8%) | 18 (4.2%) |
| Manufacturing | 807 (56.7%) | 617 (43.3%) |
| Wholesale Trade | 354 (63.7%) | 202 (36.3%) |
| Retail Trade | 659 (57.7%) | 484 (42.3%) |
| Transportation & Warehousing | 773 (80.3%) | 190 (19.7%) |
| Utilities | 95 (100.0%) | 0 (0.0%) |
| Information | 299 (87.4%) | 43 (12.6%) |
| Finance & Insurance | 163 (47.4%) | 181 (52.6%) |
| Real Estate, Rental & Leasing | 104 (34.2%) | 200 (65.8%) |
| Professional & Scientific | 347 (52.1%) | 319 (47.9%) |
| Enterprise Management | 0 (0.0%) | 47 (100.0%) |
| Administrative & Support | 264 (68.0%) | 124 (32.0%) |
| Educational Services | 246 (24.3%) | 767 (75.7%) |
| Health Care & Social Assistance | 406 (24.5%) | 1,254 (75.5%) |
| Arts, Entertainment & Recreation | 95 (62.1%) | 58 (37.9%) |
| Accommodation & Food Services | 367 (55.3%) | 296 (44.7%) |
| Public Administration | 289 (59.6%) | 196 (40.4%) |
| Total | 5,851 (52.3%) | 5,339 (47.7%) |
Education in West Carson
School Enrollment in West Carson
The most common levels of schooling among the 4,208 students in West Carson are college / undergraduate (1,223 | 29.1%), high school (771 | 18.3%), and middle school (761 | 18.1%).
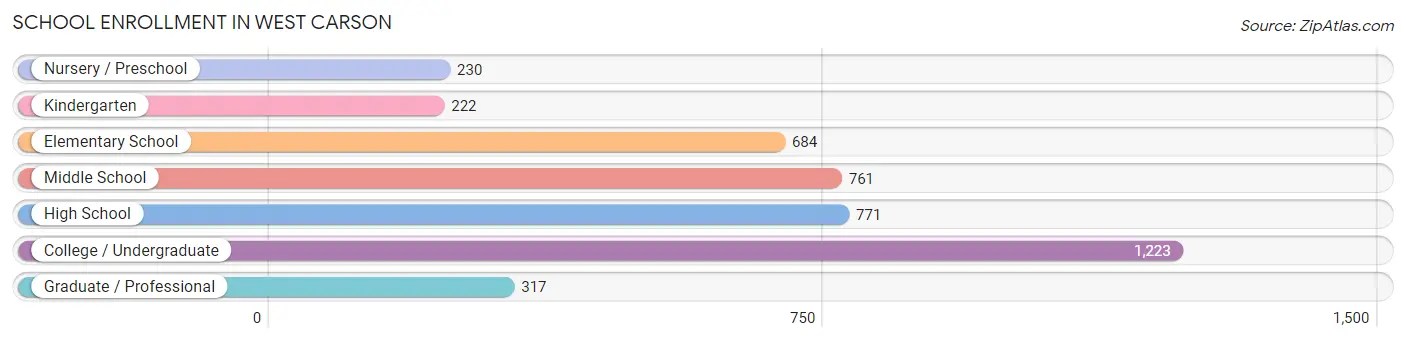
| School Level | # Students | % Students |
| Nursery / Preschool | 230 | 5.5% |
| Kindergarten | 222 | 5.3% |
| Elementary School | 684 | 16.3% |
| Middle School | 761 | 18.1% |
| High School | 771 | 18.3% |
| College / Undergraduate | 1,223 | 29.1% |
| Graduate / Professional | 317 | 7.5% |
| Total | 4,208 | 100.0% |
School Enrollment by Age by Funding Source in West Carson
Out of a total of 4,208 students who are enrolled in schools in West Carson, 896 (21.3%) attend a private institution, while the remaining 3,312 (78.7%) are enrolled in public schools. The age group of 25 to 34 year olds has the highest likelihood of being enrolled in private schools, with 282 (51.4% in the age bracket) enrolled. Conversely, the age group of 5 to 9 year old has the lowest likelihood of being enrolled in a private school, with 812 (88.4% in the age bracket) attending a public institution.
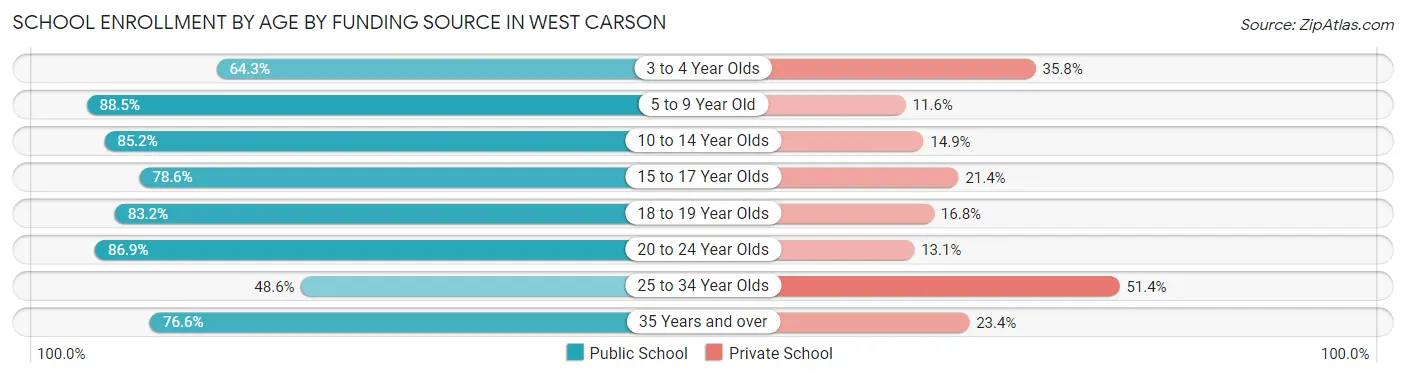
| Age Bracket | Public School | Private School |
| 3 to 4 Year Olds | 133 (64.2%) | 74 (35.7%) |
| 5 to 9 Year Old | 812 (88.4%) | 106 (11.6%) |
| 10 to 14 Year Olds | 780 (85.2%) | 136 (14.8%) |
| 15 to 17 Year Olds | 375 (78.6%) | 102 (21.4%) |
| 18 to 19 Year Olds | 198 (83.2%) | 40 (16.8%) |
| 20 to 24 Year Olds | 476 (86.9%) | 72 (13.1%) |
| 25 to 34 Year Olds | 267 (48.6%) | 282 (51.4%) |
| 35 Years and over | 272 (76.6%) | 83 (23.4%) |
| Total | 3,312 (78.7%) | 896 (21.3%) |
Educational Attainment by Field of Study in West Carson
Business (1,438 | 22.8%), science & technology (767 | 12.1%), engineering (595 | 9.4%), education (516 | 8.2%), and visual & performing arts (418 | 6.6%) are the most common fields of study among 6,322 individuals in West Carson who have obtained a bachelor's degree or higher.
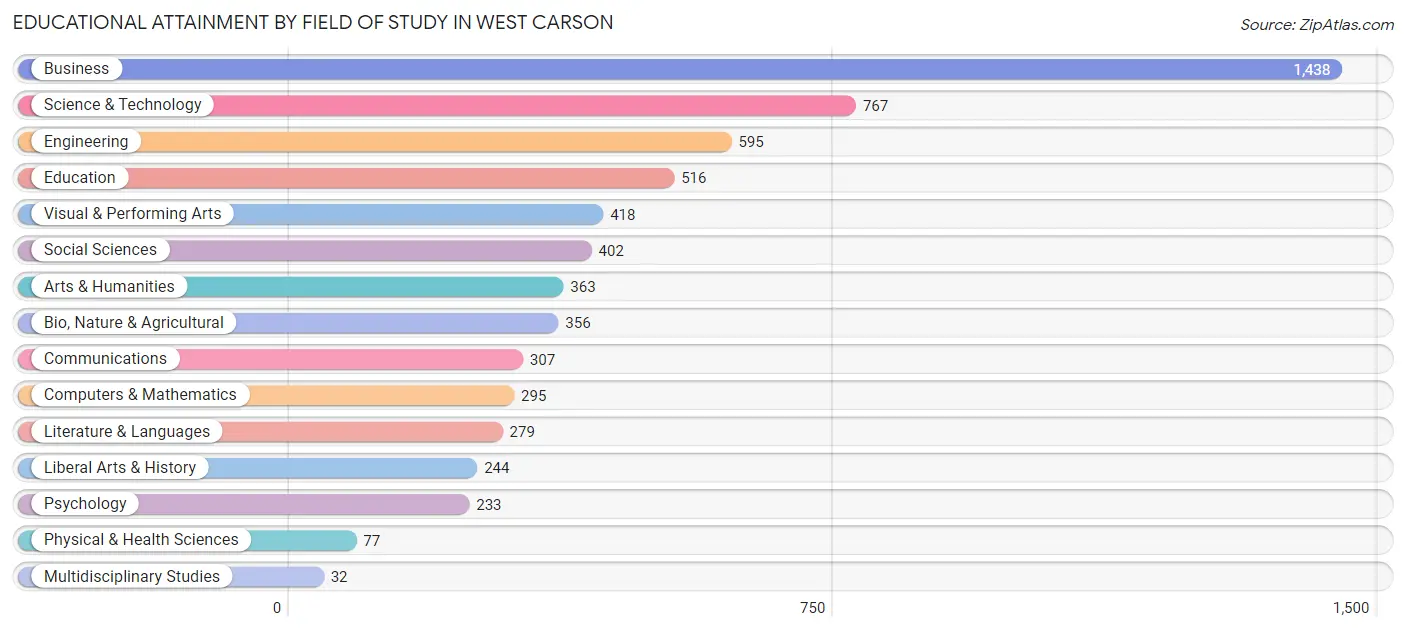
| Field of Study | # Graduates | % Graduates |
| Computers & Mathematics | 295 | 4.7% |
| Bio, Nature & Agricultural | 356 | 5.6% |
| Physical & Health Sciences | 77 | 1.2% |
| Psychology | 233 | 3.7% |
| Social Sciences | 402 | 6.4% |
| Engineering | 595 | 9.4% |
| Multidisciplinary Studies | 32 | 0.5% |
| Science & Technology | 767 | 12.1% |
| Business | 1,438 | 22.8% |
| Education | 516 | 8.2% |
| Literature & Languages | 279 | 4.4% |
| Liberal Arts & History | 244 | 3.9% |
| Visual & Performing Arts | 418 | 6.6% |
| Communications | 307 | 4.9% |
| Arts & Humanities | 363 | 5.7% |
| Total | 6,322 | 100.0% |
Transportation & Commute in West Carson
Vehicle Availability by Sex in West Carson
The most prevalent vehicle ownership categories in West Carson are males with 2 vehicles (2,154, accounting for 37.6%) and females with 2 vehicles (1,922, making up 41.4%).
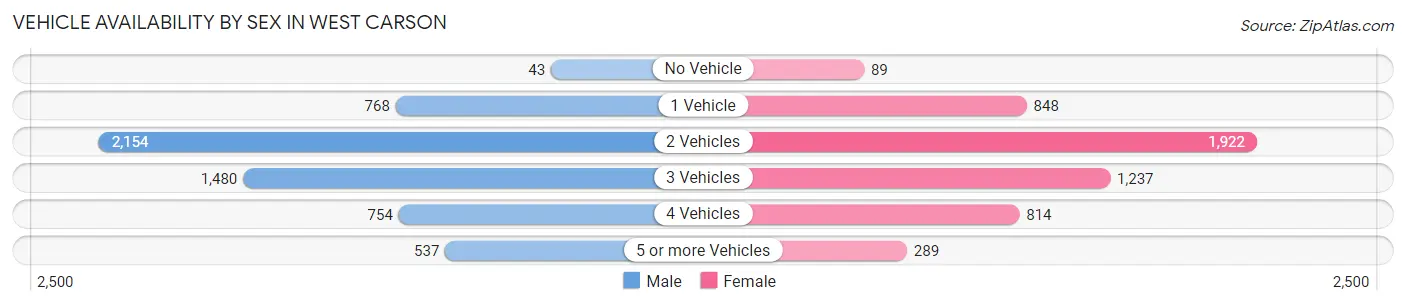
| Vehicles Available | Male | Female |
| No Vehicle | 43 (0.7%) | 89 (1.7%) |
| 1 Vehicle | 768 (13.4%) | 848 (16.3%) |
| 2 Vehicles | 2,154 (37.6%) | 1,922 (37.0%) |
| 3 Vehicles | 1,480 (25.8%) | 1,237 (23.8%) |
| 4 Vehicles | 754 (13.2%) | 814 (15.7%) |
| 5 or more Vehicles | 537 (9.4%) | 289 (5.6%) |
| Total | 5,736 (100.0%) | 5,199 (100.0%) |
Commute Time in West Carson
The most frequently occuring commute durations in West Carson are 15 to 19 minutes (2,323 commuters, 23.6%), 20 to 24 minutes (1,561 commuters, 15.8%), and 10 to 14 minutes (1,241 commuters, 12.6%).
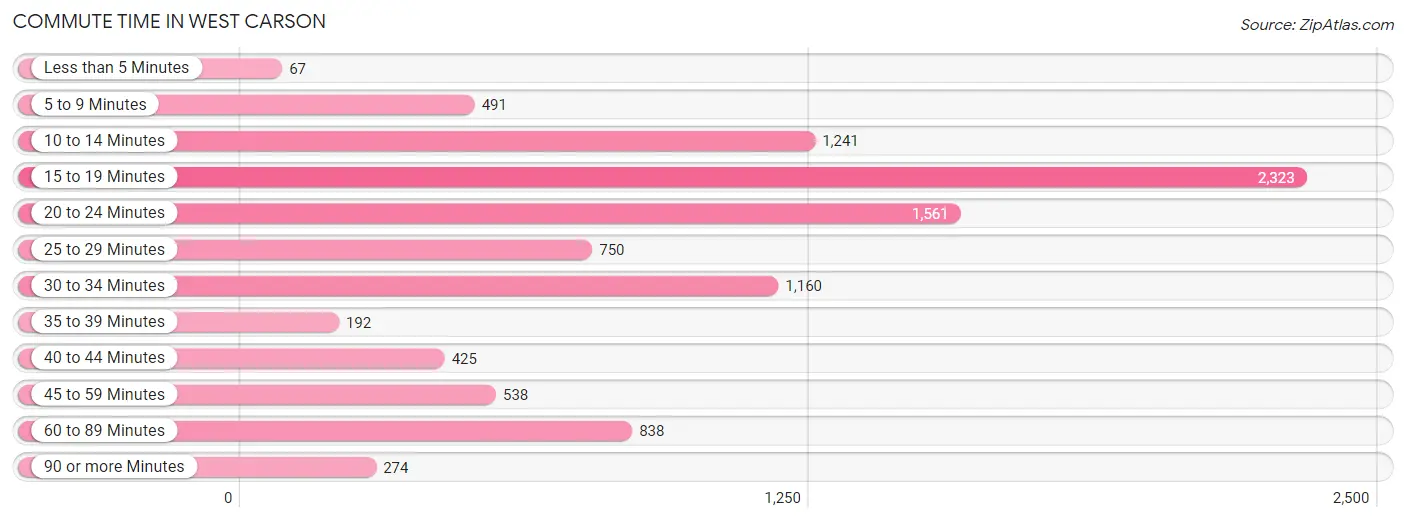
| Commute Time | # Commuters | % Commuters |
| Less than 5 Minutes | 67 | 0.7% |
| 5 to 9 Minutes | 491 | 5.0% |
| 10 to 14 Minutes | 1,241 | 12.6% |
| 15 to 19 Minutes | 2,323 | 23.6% |
| 20 to 24 Minutes | 1,561 | 15.8% |
| 25 to 29 Minutes | 750 | 7.6% |
| 30 to 34 Minutes | 1,160 | 11.8% |
| 35 to 39 Minutes | 192 | 1.9% |
| 40 to 44 Minutes | 425 | 4.3% |
| 45 to 59 Minutes | 538 | 5.5% |
| 60 to 89 Minutes | 838 | 8.5% |
| 90 or more Minutes | 274 | 2.8% |
Commute Time by Sex in West Carson
The most common commute times in West Carson are 15 to 19 minutes (1,320 commuters, 25.4%) for males and 15 to 19 minutes (1,003 commuters, 21.5%) for females.
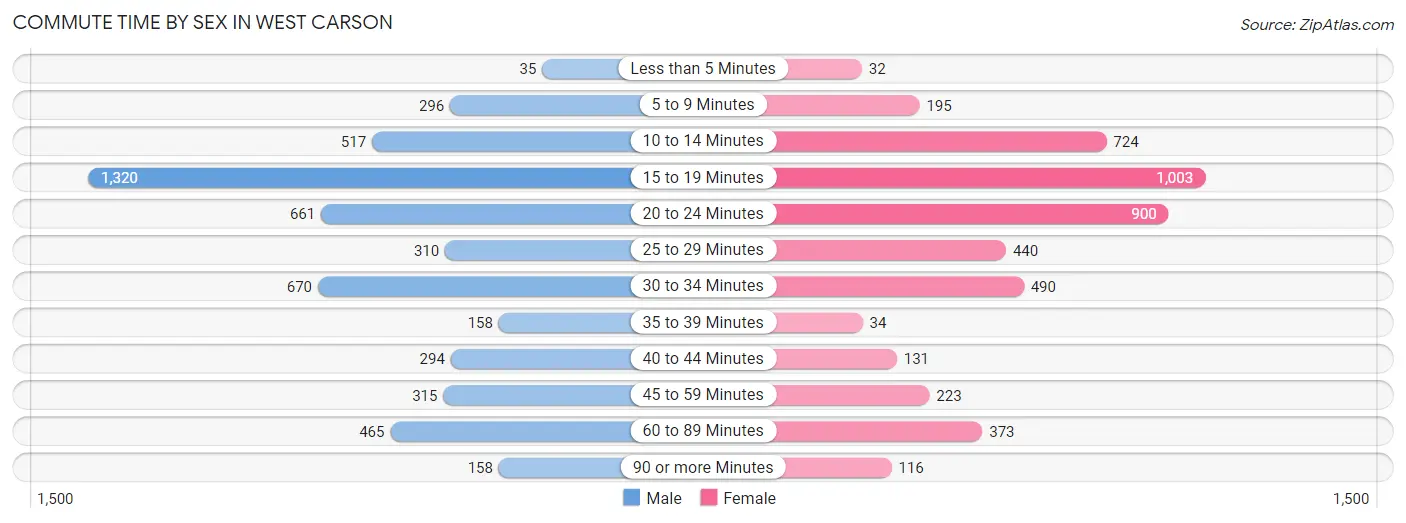
| Commute Time | Male | Female |
| Less than 5 Minutes | 35 (0.7%) | 32 (0.7%) |
| 5 to 9 Minutes | 296 (5.7%) | 195 (4.2%) |
| 10 to 14 Minutes | 517 (9.9%) | 724 (15.5%) |
| 15 to 19 Minutes | 1,320 (25.4%) | 1,003 (21.5%) |
| 20 to 24 Minutes | 661 (12.7%) | 900 (19.3%) |
| 25 to 29 Minutes | 310 (6.0%) | 440 (9.4%) |
| 30 to 34 Minutes | 670 (12.9%) | 490 (10.5%) |
| 35 to 39 Minutes | 158 (3.0%) | 34 (0.7%) |
| 40 to 44 Minutes | 294 (5.7%) | 131 (2.8%) |
| 45 to 59 Minutes | 315 (6.1%) | 223 (4.8%) |
| 60 to 89 Minutes | 465 (8.9%) | 373 (8.0%) |
| 90 or more Minutes | 158 (3.0%) | 116 (2.5%) |
Time of Departure to Work by Sex in West Carson
The most frequent times of departure to work in West Carson are 12:00 AM to 4:59 AM (582, 11.2%) for males and 8:00 AM to 8:29 AM (867, 18.6%) for females.
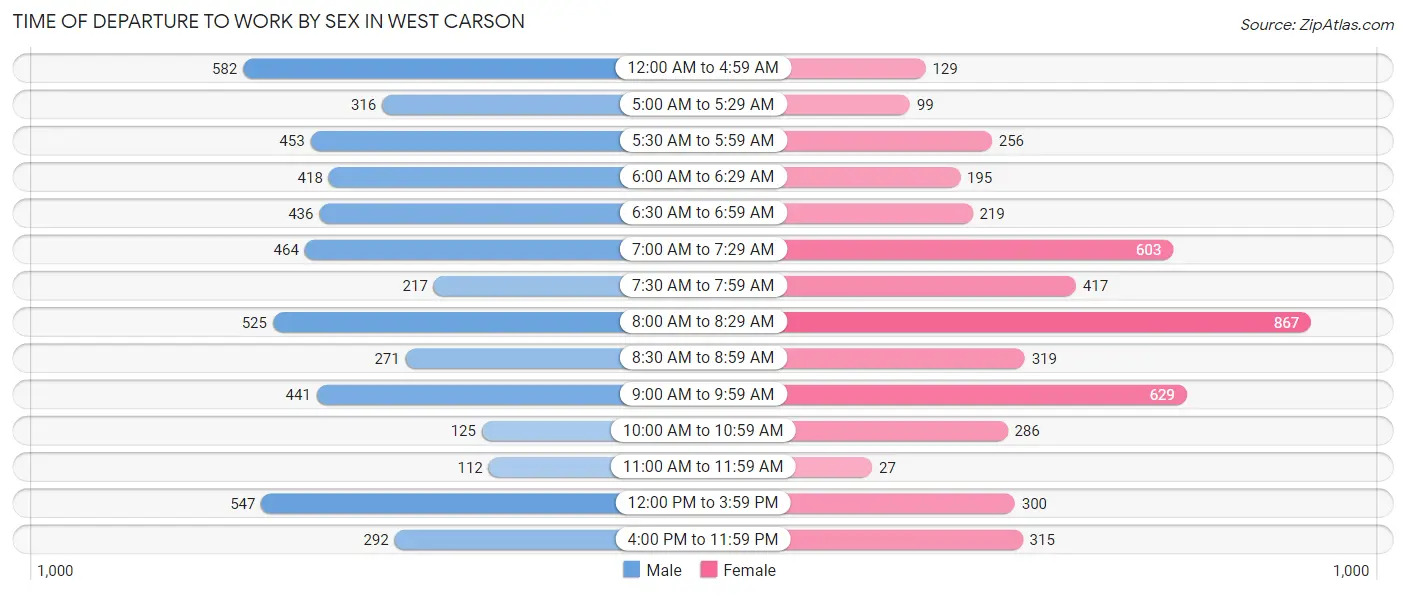
| Time of Departure | Male | Female |
| 12:00 AM to 4:59 AM | 582 (11.2%) | 129 (2.8%) |
| 5:00 AM to 5:29 AM | 316 (6.1%) | 99 (2.1%) |
| 5:30 AM to 5:59 AM | 453 (8.7%) | 256 (5.5%) |
| 6:00 AM to 6:29 AM | 418 (8.0%) | 195 (4.2%) |
| 6:30 AM to 6:59 AM | 436 (8.4%) | 219 (4.7%) |
| 7:00 AM to 7:29 AM | 464 (8.9%) | 603 (12.9%) |
| 7:30 AM to 7:59 AM | 217 (4.2%) | 417 (8.9%) |
| 8:00 AM to 8:29 AM | 525 (10.1%) | 867 (18.6%) |
| 8:30 AM to 8:59 AM | 271 (5.2%) | 319 (6.8%) |
| 9:00 AM to 9:59 AM | 441 (8.5%) | 629 (13.5%) |
| 10:00 AM to 10:59 AM | 125 (2.4%) | 286 (6.1%) |
| 11:00 AM to 11:59 AM | 112 (2.1%) | 27 (0.6%) |
| 12:00 PM to 3:59 PM | 547 (10.5%) | 300 (6.4%) |
| 4:00 PM to 11:59 PM | 292 (5.6%) | 315 (6.8%) |
| Total | 5,199 (100.0%) | 4,661 (100.0%) |
Housing Occupancy in West Carson
Occupancy by Ownership in West Carson
Of the total 7,942 dwellings in West Carson, owner-occupied units account for 5,833 (73.4%), while renter-occupied units make up 2,109 (26.6%).
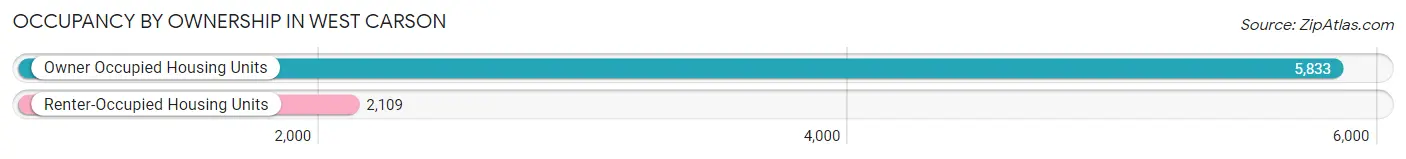
| Occupancy | # Housing Units | % Housing Units |
| Owner Occupied Housing Units | 5,833 | 73.4% |
| Renter-Occupied Housing Units | 2,109 | 26.6% |
| Total Occupied Housing Units | 7,942 | 100.0% |
Occupancy by Household Size in West Carson
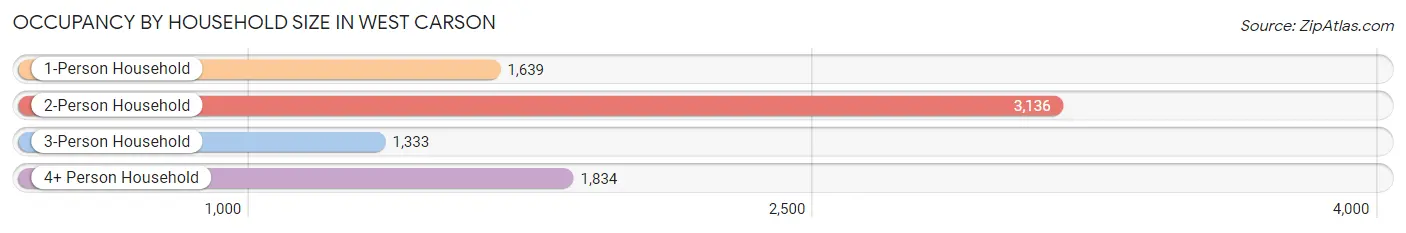
| Household Size | # Housing Units | % Housing Units |
| 1-Person Household | 1,639 | 20.6% |
| 2-Person Household | 3,136 | 39.5% |
| 3-Person Household | 1,333 | 16.8% |
| 4+ Person Household | 1,834 | 23.1% |
| Total Housing Units | 7,942 | 100.0% |
Occupancy by Ownership by Household Size in West Carson
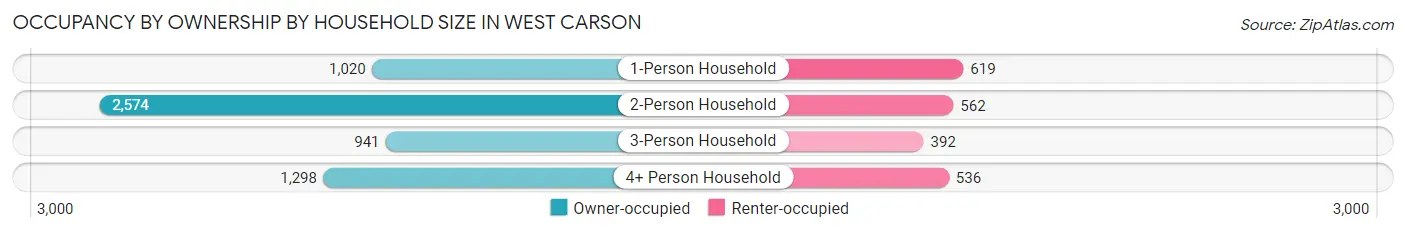
| Household Size | Owner-occupied | Renter-occupied |
| 1-Person Household | 1,020 (62.2%) | 619 (37.8%) |
| 2-Person Household | 2,574 (82.1%) | 562 (17.9%) |
| 3-Person Household | 941 (70.6%) | 392 (29.4%) |
| 4+ Person Household | 1,298 (70.8%) | 536 (29.2%) |
| Total Housing Units | 5,833 (73.4%) | 2,109 (26.6%) |
Occupancy by Educational Attainment in West Carson
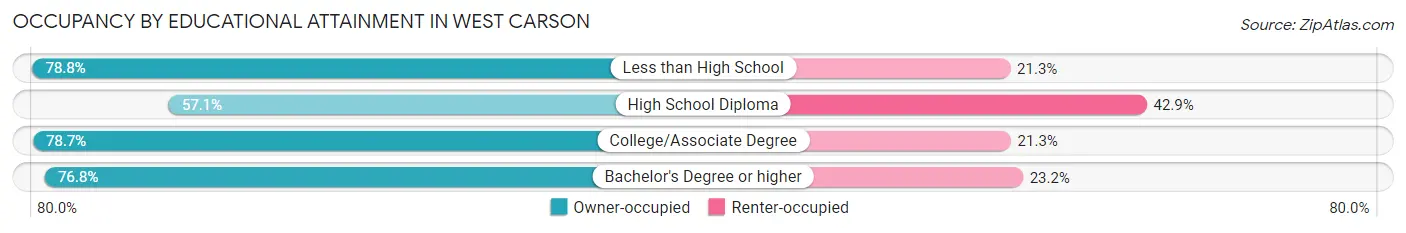
| Household Size | Owner-occupied | Renter-occupied |
| Less than High School | 730 (78.7%) | 197 (21.2%) |
| High School Diploma | 955 (57.1%) | 717 (42.9%) |
| College/Associate Degree | 1,922 (78.7%) | 521 (21.3%) |
| Bachelor's Degree or higher | 2,226 (76.8%) | 674 (23.2%) |
Occupancy by Age of Householder in West Carson
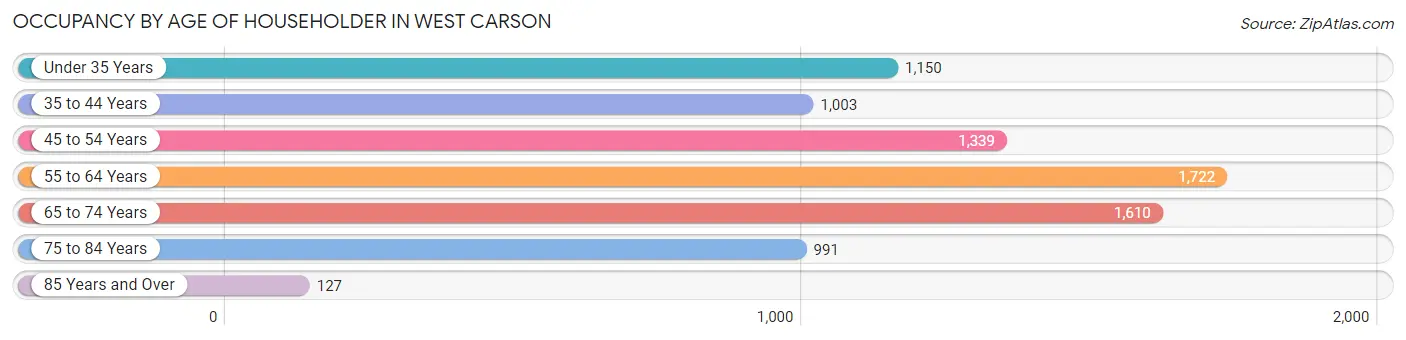
| Age Bracket | # Households | % Households |
| Under 35 Years | 1,150 | 14.5% |
| 35 to 44 Years | 1,003 | 12.6% |
| 45 to 54 Years | 1,339 | 16.9% |
| 55 to 64 Years | 1,722 | 21.7% |
| 65 to 74 Years | 1,610 | 20.3% |
| 75 to 84 Years | 991 | 12.5% |
| 85 Years and Over | 127 | 1.6% |
| Total | 7,942 | 100.0% |
Housing Finances in West Carson
Median Income by Occupancy in West Carson
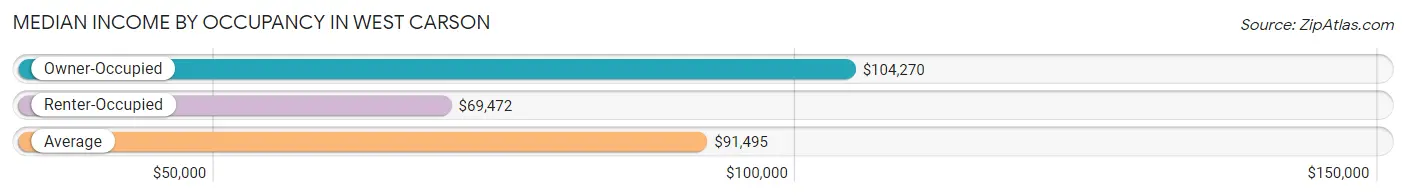
| Occupancy Type | # Households | Median Income |
| Owner-Occupied | 5,833 (73.4%) | $104,270 |
| Renter-Occupied | 2,109 (26.6%) | $69,472 |
| Average | 7,942 (100.0%) | $91,495 |
Occupancy by Householder Income Bracket in West Carson
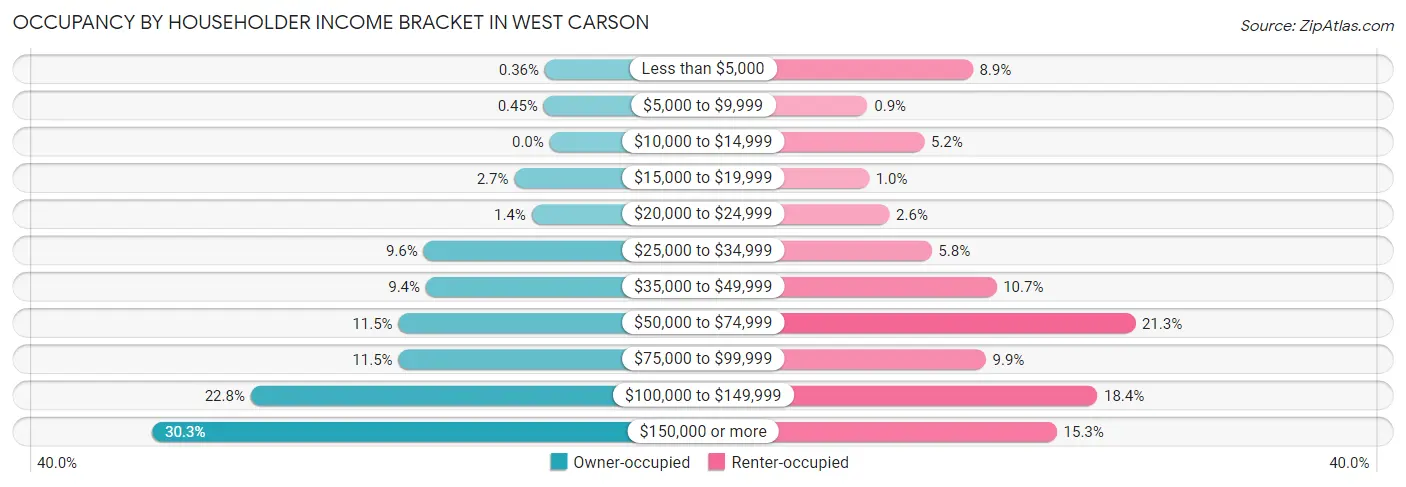
| Income Bracket | Owner-occupied | Renter-occupied |
| Less than $5,000 | 21 (0.4%) | 188 (8.9%) |
| $5,000 to $9,999 | 26 (0.4%) | 19 (0.9%) |
| $10,000 to $14,999 | 0 (0.0%) | 110 (5.2%) |
| $15,000 to $19,999 | 157 (2.7%) | 21 (1.0%) |
| $20,000 to $24,999 | 80 (1.4%) | 54 (2.6%) |
| $25,000 to $34,999 | 560 (9.6%) | 122 (5.8%) |
| $35,000 to $49,999 | 550 (9.4%) | 226 (10.7%) |
| $50,000 to $74,999 | 672 (11.5%) | 449 (21.3%) |
| $75,000 to $99,999 | 672 (11.5%) | 209 (9.9%) |
| $100,000 to $149,999 | 1,328 (22.8%) | 388 (18.4%) |
| $150,000 or more | 1,767 (30.3%) | 323 (15.3%) |
| Total | 5,833 (100.0%) | 2,109 (100.0%) |
Monthly Housing Cost Tiers in West Carson
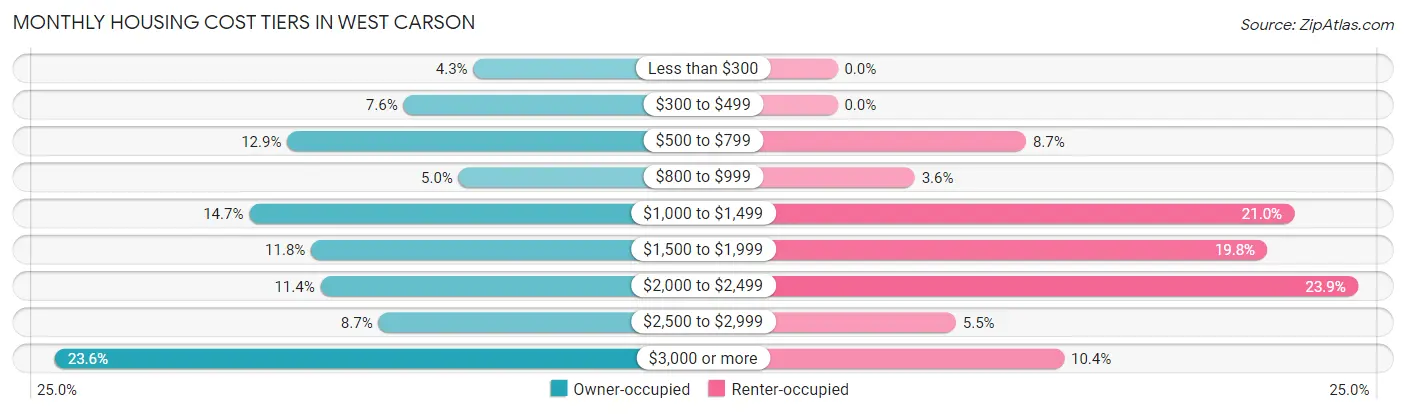
| Monthly Cost | Owner-occupied | Renter-occupied |
| Less than $300 | 253 (4.3%) | 0 (0.0%) |
| $300 to $499 | 441 (7.6%) | 0 (0.0%) |
| $500 to $799 | 753 (12.9%) | 183 (8.7%) |
| $800 to $999 | 293 (5.0%) | 75 (3.6%) |
| $1,000 to $1,499 | 855 (14.7%) | 443 (21.0%) |
| $1,500 to $1,999 | 689 (11.8%) | 417 (19.8%) |
| $2,000 to $2,499 | 664 (11.4%) | 505 (23.9%) |
| $2,500 to $2,999 | 508 (8.7%) | 115 (5.4%) |
| $3,000 or more | 1,377 (23.6%) | 220 (10.4%) |
| Total | 5,833 (100.0%) | 2,109 (100.0%) |
Physical Housing Characteristics in West Carson
Housing Structures in West Carson
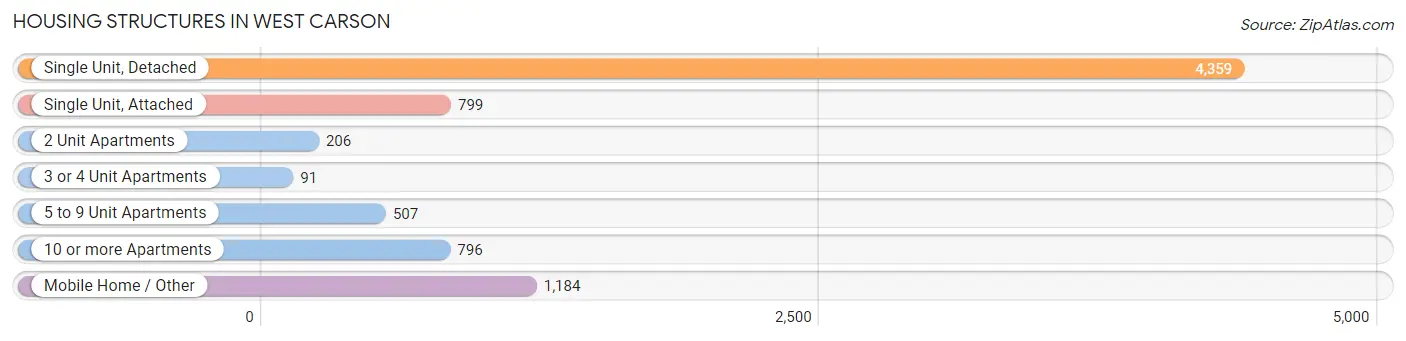
| Structure Type | # Housing Units | % Housing Units |
| Single Unit, Detached | 4,359 | 54.9% |
| Single Unit, Attached | 799 | 10.1% |
| 2 Unit Apartments | 206 | 2.6% |
| 3 or 4 Unit Apartments | 91 | 1.1% |
| 5 to 9 Unit Apartments | 507 | 6.4% |
| 10 or more Apartments | 796 | 10.0% |
| Mobile Home / Other | 1,184 | 14.9% |
| Total | 7,942 | 100.0% |
Housing Structures by Occupancy in West Carson
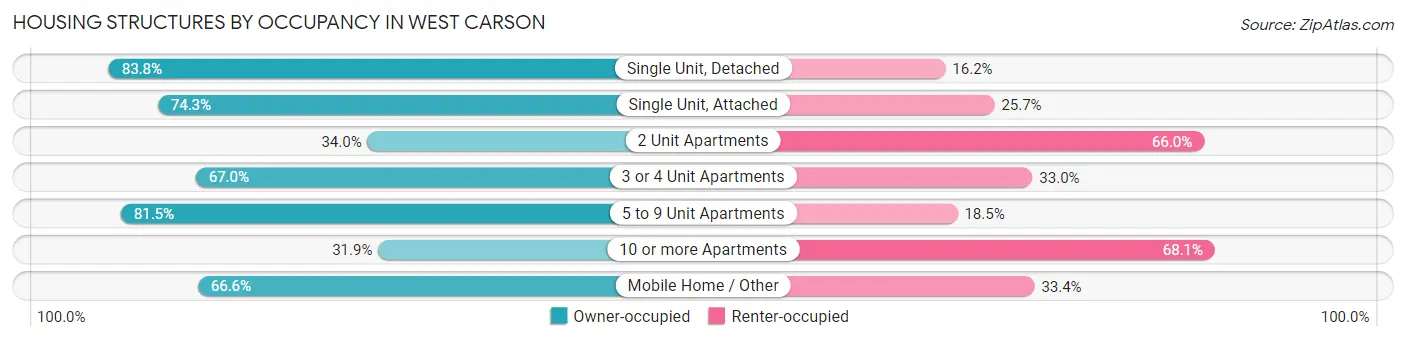
| Structure Type | Owner-occupied | Renter-occupied |
| Single Unit, Detached | 3,652 (83.8%) | 707 (16.2%) |
| Single Unit, Attached | 594 (74.3%) | 205 (25.7%) |
| 2 Unit Apartments | 70 (34.0%) | 136 (66.0%) |
| 3 or 4 Unit Apartments | 61 (67.0%) | 30 (33.0%) |
| 5 to 9 Unit Apartments | 413 (81.5%) | 94 (18.5%) |
| 10 or more Apartments | 254 (31.9%) | 542 (68.1%) |
| Mobile Home / Other | 789 (66.6%) | 395 (33.4%) |
| Total | 5,833 (73.4%) | 2,109 (26.6%) |
Housing Structures by Number of Rooms in West Carson
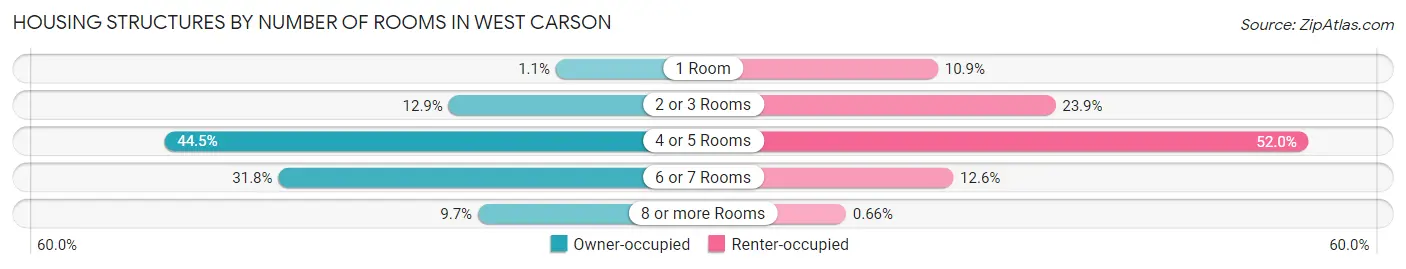
| Number of Rooms | Owner-occupied | Renter-occupied |
| 1 Room | 61 (1.1%) | 229 (10.9%) |
| 2 or 3 Rooms | 755 (12.9%) | 504 (23.9%) |
| 4 or 5 Rooms | 2,595 (44.5%) | 1,097 (52.0%) |
| 6 or 7 Rooms | 1,857 (31.8%) | 265 (12.6%) |
| 8 or more Rooms | 565 (9.7%) | 14 (0.7%) |
| Total | 5,833 (100.0%) | 2,109 (100.0%) |
Housing Structure by Heating Type in West Carson
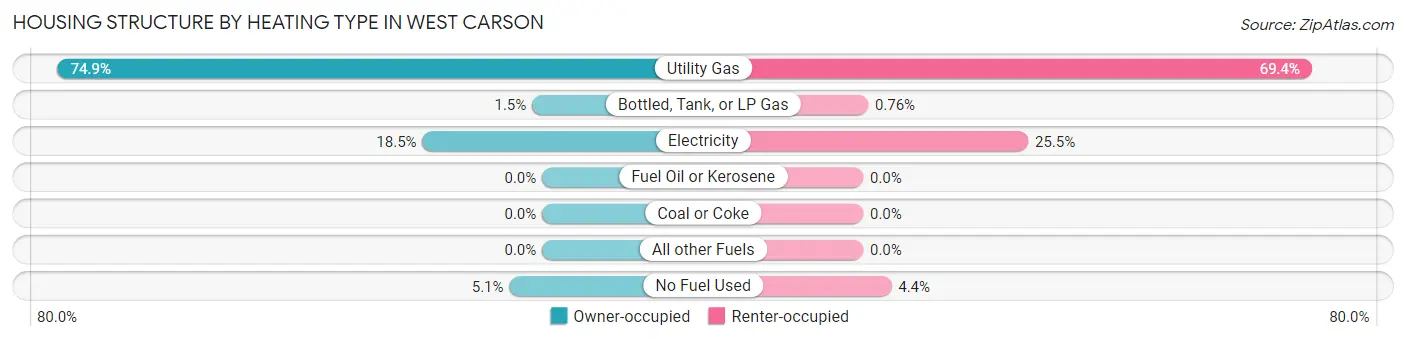
| Heating Type | Owner-occupied | Renter-occupied |
| Utility Gas | 4,369 (74.9%) | 1,463 (69.4%) |
| Bottled, Tank, or LP Gas | 90 (1.5%) | 16 (0.8%) |
| Electricity | 1,079 (18.5%) | 538 (25.5%) |
| Fuel Oil or Kerosene | 0 (0.0%) | 0 (0.0%) |
| Coal or Coke | 0 (0.0%) | 0 (0.0%) |
| All other Fuels | 0 (0.0%) | 0 (0.0%) |
| No Fuel Used | 295 (5.1%) | 92 (4.4%) |
| Total | 5,833 (100.0%) | 2,109 (100.0%) |
Household Vehicle Usage in West Carson
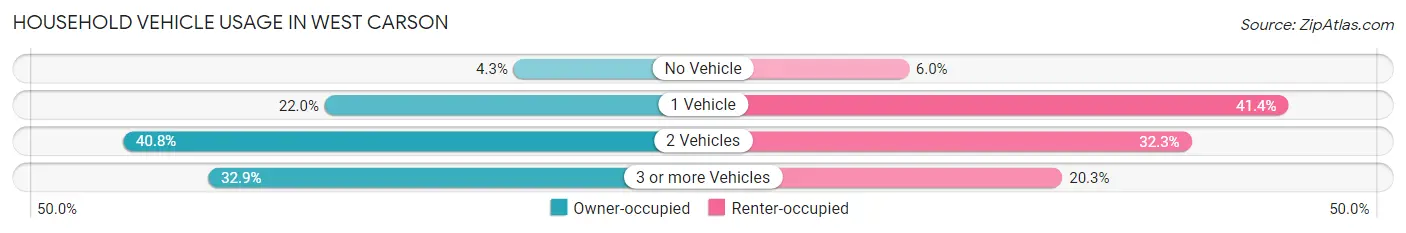
| Vehicles per Household | Owner-occupied | Renter-occupied |
| No Vehicle | 253 (4.3%) | 126 (6.0%) |
| 1 Vehicle | 1,282 (22.0%) | 873 (41.4%) |
| 2 Vehicles | 2,381 (40.8%) | 682 (32.3%) |
| 3 or more Vehicles | 1,917 (32.9%) | 428 (20.3%) |
| Total | 5,833 (100.0%) | 2,109 (100.0%) |
Real Estate & Mortgages in West Carson
Real Estate and Mortgage Overview in West Carson
| Characteristic | Without Mortgage | With Mortgage |
| Housing Units | 2,106 | 3,727 |
| Median Property Value | $451,700 | $638,200 |
| Median Household Income | $69,057 | $1,452 |
| Monthly Housing Costs | $632 | $1,377 |
| Real Estate Taxes | $2,249 | $45 |
Property Value by Mortgage Status in West Carson
| Property Value | Without Mortgage | With Mortgage |
| Less than $50,000 | 203 (9.6%) | 50 (1.3%) |
| $50,000 to $99,999 | 276 (13.1%) | 21 (0.6%) |
| $100,000 to $299,999 | 361 (17.1%) | 150 (4.0%) |
| $300,000 to $499,999 | 358 (17.0%) | 790 (21.2%) |
| $500,000 to $749,999 | 656 (31.1%) | 1,542 (41.4%) |
| $750,000 to $999,999 | 232 (11.0%) | 1,087 (29.2%) |
| $1,000,000 or more | 20 (0.9%) | 87 (2.3%) |
| Total | 2,106 (100.0%) | 3,727 (100.0%) |
Household Income by Mortgage Status in West Carson
| Household Income | Without Mortgage | With Mortgage |
| Less than $10,000 | 8 (0.4%) | 106 (2.8%) |
| $10,000 to $24,999 | 156 (7.4%) | 39 (1.1%) |
| $25,000 to $34,999 | 256 (12.2%) | 81 (2.2%) |
| $35,000 to $49,999 | 352 (16.7%) | 304 (8.2%) |
| $50,000 to $74,999 | 364 (17.3%) | 198 (5.3%) |
| $75,000 to $99,999 | 307 (14.6%) | 308 (8.3%) |
| $100,000 to $149,999 | 348 (16.5%) | 365 (9.8%) |
| $150,000 or more | 315 (15.0%) | 980 (26.3%) |
| Total | 2,106 (100.0%) | 3,727 (100.0%) |
Property Value to Household Income Ratio in West Carson
| Value-to-Income Ratio | Without Mortgage | With Mortgage |
| Less than 2.0x | 535 (25.4%) | 126,080 (3,382.9%) |
| 2.0x to 2.9x | 161 (7.6%) | 297 (8.0%) |
| 3.0x to 3.9x | 156 (7.4%) | 544 (14.6%) |
| 4.0x or more | 1,254 (59.5%) | 654 (17.5%) |
| Total | 2,106 (100.0%) | 3,727 (100.0%) |
Real Estate Taxes by Mortgage Status in West Carson
| Property Taxes | Without Mortgage | With Mortgage |
| Less than $800 | 427 (20.3%) | 5 (0.1%) |
| $800 to $1,499 | 244 (11.6%) | 34 (0.9%) |
| $800 to $1,499 | 1,134 (53.8%) | 171 (4.6%) |
| Total | 2,106 (100.0%) | 3,727 (100.0%) |
Health & Disability in West Carson
Health Insurance Coverage by Age in West Carson
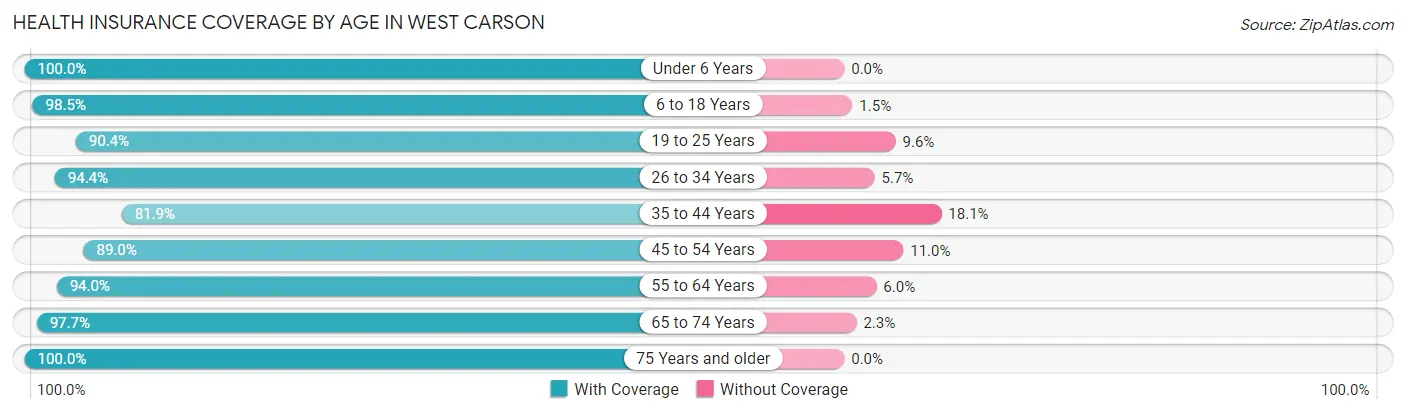
| Age Bracket | With Coverage | Without Coverage |
| Under 6 Years | 1,166 (100.0%) | 0 (0.0%) |
| 6 to 18 Years | 2,344 (98.5%) | 36 (1.5%) |
| 19 to 25 Years | 1,247 (90.4%) | 132 (9.6%) |
| 26 to 34 Years | 3,238 (94.4%) | 194 (5.7%) |
| 35 to 44 Years | 2,148 (81.9%) | 475 (18.1%) |
| 45 to 54 Years | 2,273 (89.0%) | 281 (11.0%) |
| 55 to 64 Years | 2,842 (94.0%) | 181 (6.0%) |
| 65 to 74 Years | 2,974 (97.7%) | 69 (2.3%) |
| 75 Years and older | 1,863 (100.0%) | 0 (0.0%) |
| Total | 20,095 (93.6%) | 1,368 (6.4%) |
Health Insurance Coverage by Citizenship Status in West Carson
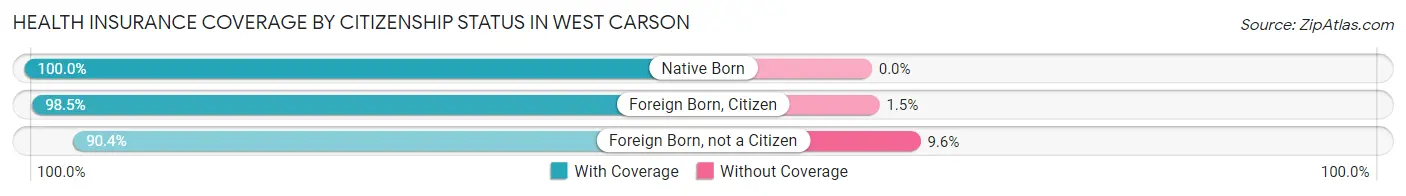
| Citizenship Status | With Coverage | Without Coverage |
| Native Born | 1,166 (100.0%) | 0 (0.0%) |
| Foreign Born, Citizen | 2,344 (98.5%) | 36 (1.5%) |
| Foreign Born, not a Citizen | 1,247 (90.4%) | 132 (9.6%) |
Health Insurance Coverage by Household Income in West Carson
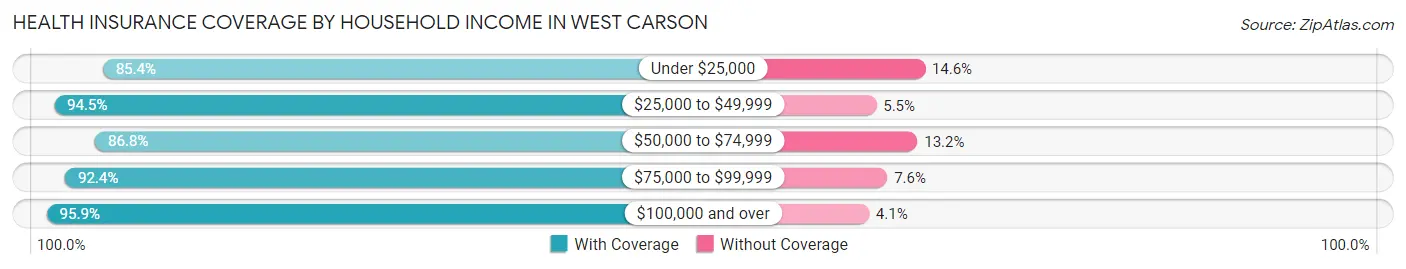
| Household Income | With Coverage | Without Coverage |
| Under $25,000 | 1,114 (85.4%) | 191 (14.6%) |
| $25,000 to $49,999 | 2,875 (94.5%) | 168 (5.5%) |
| $50,000 to $74,999 | 2,207 (86.8%) | 336 (13.2%) |
| $75,000 to $99,999 | 2,035 (92.4%) | 167 (7.6%) |
| $100,000 and over | 11,726 (95.9%) | 506 (4.1%) |
Public vs Private Health Insurance Coverage by Age in West Carson
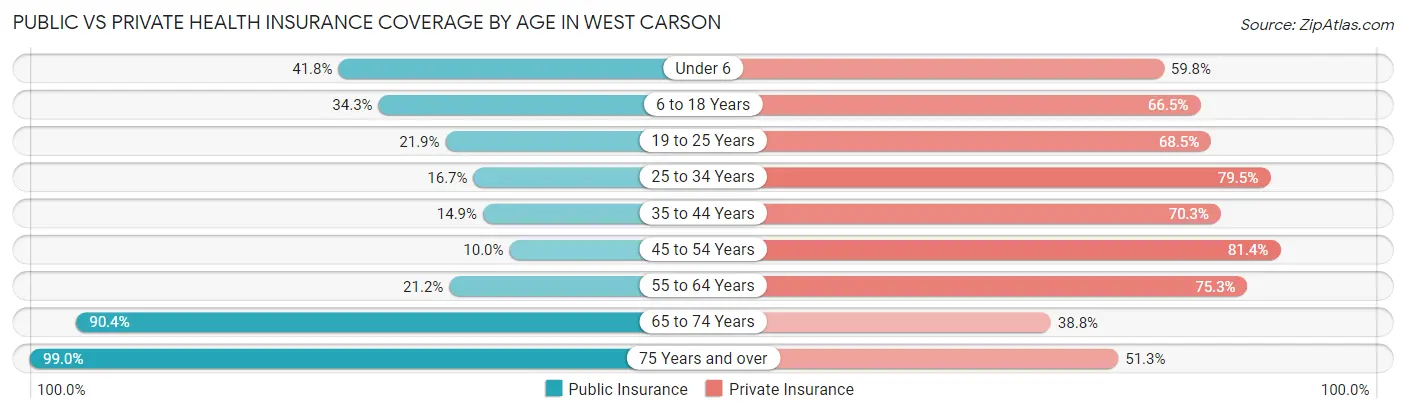
| Age Bracket | Public Insurance | Private Insurance |
| Under 6 | 487 (41.8%) | 697 (59.8%) |
| 6 to 18 Years | 817 (34.3%) | 1,583 (66.5%) |
| 19 to 25 Years | 302 (21.9%) | 945 (68.5%) |
| 25 to 34 Years | 573 (16.7%) | 2,728 (79.5%) |
| 35 to 44 Years | 392 (14.9%) | 1,845 (70.3%) |
| 45 to 54 Years | 256 (10.0%) | 2,078 (81.4%) |
| 55 to 64 Years | 641 (21.2%) | 2,276 (75.3%) |
| 65 to 74 Years | 2,751 (90.4%) | 1,181 (38.8%) |
| 75 Years and over | 1,844 (99.0%) | 956 (51.3%) |
| Total | 8,063 (37.6%) | 14,289 (66.6%) |
Disability Status by Sex by Age in West Carson
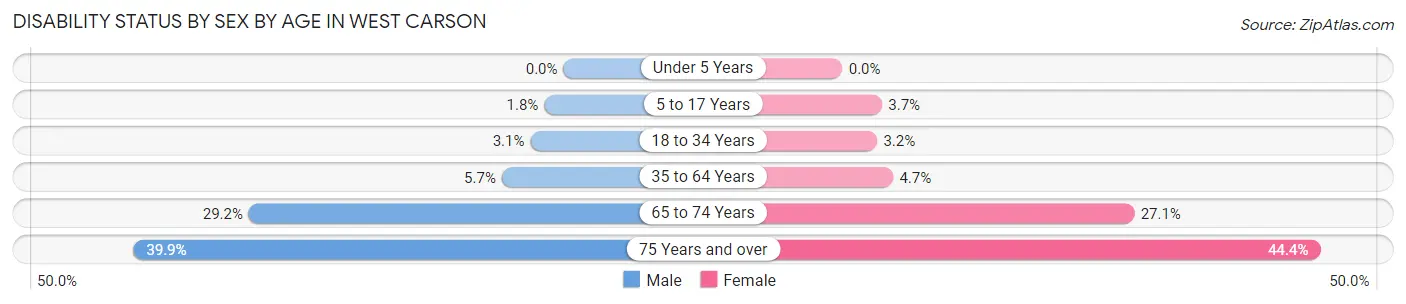
| Age Bracket | Male | Female |
| Under 5 Years | 0 (0.0%) | 0 (0.0%) |
| 5 to 17 Years | 20 (1.8%) | 45 (3.7%) |
| 18 to 34 Years | 82 (3.1%) | 76 (3.2%) |
| 35 to 64 Years | 215 (5.7%) | 209 (4.7%) |
| 65 to 74 Years | 411 (29.2%) | 443 (27.1%) |
| 75 Years and over | 312 (39.9%) | 480 (44.4%) |
Disability Class by Sex by Age in West Carson
Disability Class: Hearing Difficulty
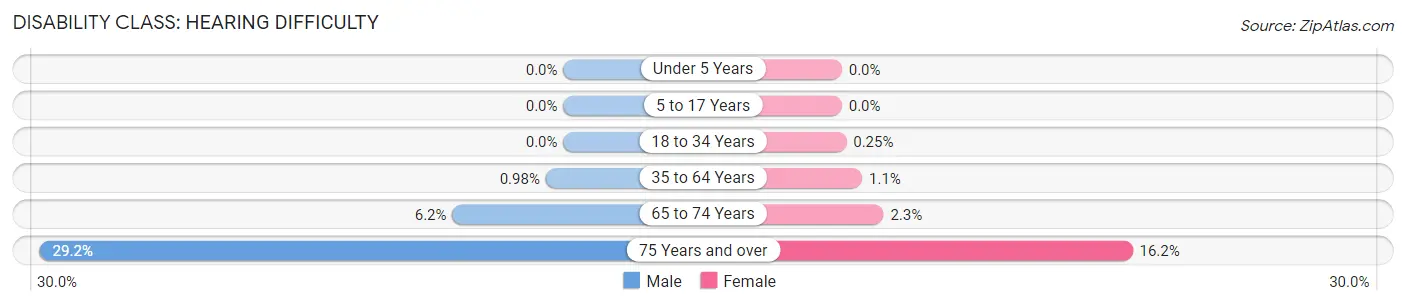
| Age Bracket | Male | Female |
| Under 5 Years | 0 (0.0%) | 0 (0.0%) |
| 5 to 17 Years | 0 (0.0%) | 0 (0.0%) |
| 18 to 34 Years | 0 (0.0%) | 6 (0.3%) |
| 35 to 64 Years | 37 (1.0%) | 50 (1.1%) |
| 65 to 74 Years | 87 (6.2%) | 38 (2.3%) |
| 75 Years and over | 228 (29.2%) | 175 (16.2%) |
Disability Class: Vision Difficulty
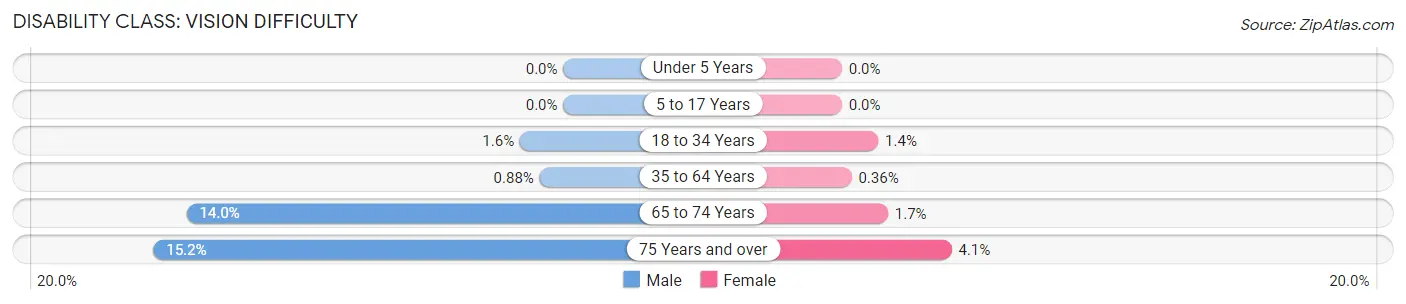
| Age Bracket | Male | Female |
| Under 5 Years | 0 (0.0%) | 0 (0.0%) |
| 5 to 17 Years | 0 (0.0%) | 0 (0.0%) |
| 18 to 34 Years | 43 (1.6%) | 32 (1.3%) |
| 35 to 64 Years | 33 (0.9%) | 16 (0.4%) |
| 65 to 74 Years | 197 (14.0%) | 28 (1.7%) |
| 75 Years and over | 119 (15.2%) | 44 (4.1%) |
Disability Class: Cognitive Difficulty
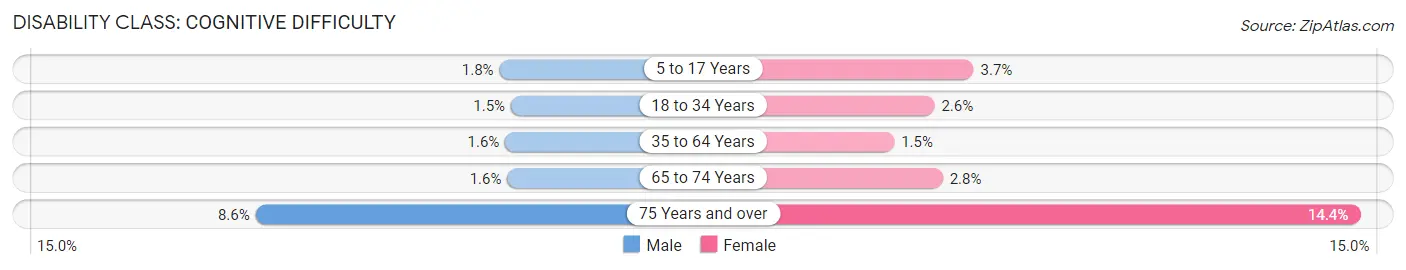
| Age Bracket | Male | Female |
| 5 to 17 Years | 20 (1.8%) | 45 (3.7%) |
| 18 to 34 Years | 39 (1.5%) | 61 (2.6%) |
| 35 to 64 Years | 61 (1.6%) | 65 (1.5%) |
| 65 to 74 Years | 22 (1.6%) | 46 (2.8%) |
| 75 Years and over | 67 (8.6%) | 156 (14.4%) |
Disability Class: Ambulatory Difficulty
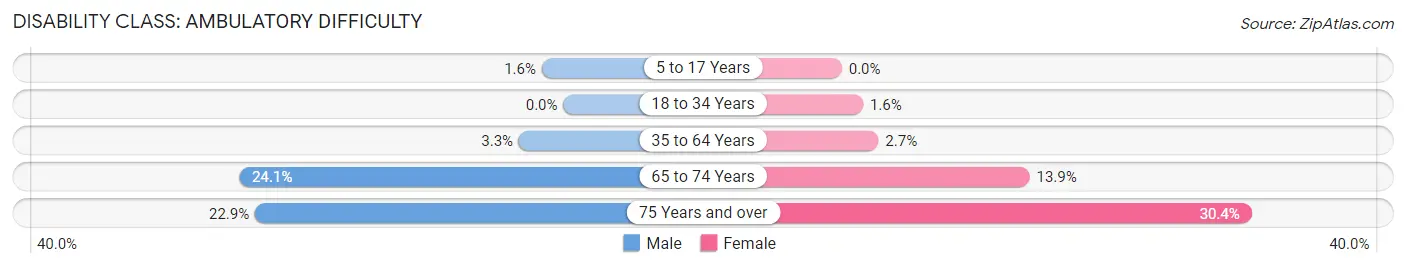
| Age Bracket | Male | Female |
| 5 to 17 Years | 18 (1.6%) | 0 (0.0%) |
| 18 to 34 Years | 0 (0.0%) | 37 (1.6%) |
| 35 to 64 Years | 124 (3.3%) | 121 (2.7%) |
| 65 to 74 Years | 339 (24.1%) | 228 (13.9%) |
| 75 Years and over | 179 (22.9%) | 329 (30.4%) |
Disability Class: Self-Care Difficulty
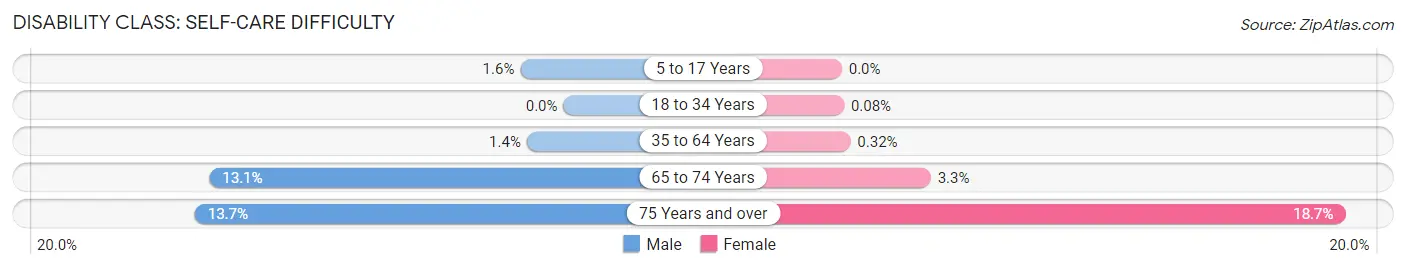
| Age Bracket | Male | Female |
| 5 to 17 Years | 18 (1.6%) | 0 (0.0%) |
| 18 to 34 Years | 0 (0.0%) | 2 (0.1%) |
| 35 to 64 Years | 51 (1.4%) | 14 (0.3%) |
| 65 to 74 Years | 185 (13.1%) | 54 (3.3%) |
| 75 Years and over | 107 (13.7%) | 202 (18.7%) |
Technology Access in West Carson
Computing Device Access in West Carson
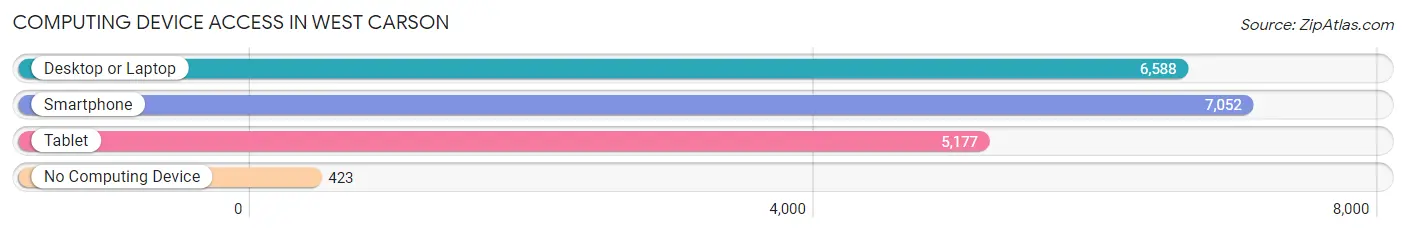
| Device Type | # Households | % Households |
| Desktop or Laptop | 6,588 | 83.0% |
| Smartphone | 7,052 | 88.8% |
| Tablet | 5,177 | 65.2% |
| No Computing Device | 423 | 5.3% |
| Total | 7,942 | 100.0% |
Internet Access in West Carson
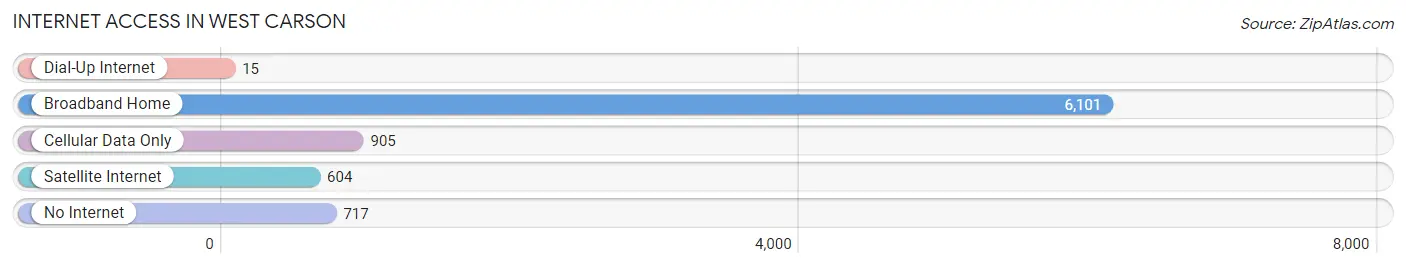
| Internet Type | # Households | % Households |
| Dial-Up Internet | 15 | 0.2% |
| Broadband Home | 6,101 | 76.8% |
| Cellular Data Only | 905 | 11.4% |
| Satellite Internet | 604 | 7.6% |
| No Internet | 717 | 9.0% |
| Total | 7,942 | 100.0% |
West Carson Summary
Carson is a city located in Los Angeles County, California, United States. It is located 13 miles (21 km) south of downtown Los Angeles and is part of the South Bay region of the Greater Los Angeles Area. As of the 2010 census, Carson had a population of 91,714.
History
The area that is now Carson was originally part of the Rancho San Pedro, a Spanish land grant given to Juan Jose Dominguez in 1784. The land was later divided and sold to a group of settlers in 1854. The area was named after the Carson family, who were among the first settlers.
In the early 1900s, the area was mostly agricultural, with some oil production. In the 1920s, the area began to develop as a residential community. The city of Carson was officially incorporated in 1968.
Geography
Carson is located at 33°51′17″N 118°13′39″W (33.854722, -118.2275). It is bordered by the cities of Long Beach, Compton, and Torrance. It is located in the South Bay region of Los Angeles County.
The city has a total area of 19.0 square miles (49.2 km2), of which 18.7 square miles (48.4 km2) is land and 0.3 square miles (0.8 km2) (1.6%) is water.
Economy
Carson is home to a variety of businesses, including manufacturing, retail, and service industries. The city is also home to the California State University, Dominguez Hills, which is located in the city's western portion.
The city is also home to the Home Depot Center, a sports and entertainment complex that is home to the Los Angeles Galaxy of Major League Soccer and Chivas USA of the United Soccer League.
Demographics
As of the 2010 census, there were 91,714 people, 28,845 households, and 21,845 families residing in the city. The population density was 4,849.4 people per square mile (1,876.2/km2). There were 30,711 housing units at an average density of 1,622.5 per square mile (625.7/km2). The racial makeup of the city was 33.2% White, 11.2% African American, 0.8% Native American, 10.7% Asian, 0.3% Pacific Islander, 32.5% from other races, and 11.3% from two or more races. Hispanic or Latino of any race were 57.2% of the population.
The median income for a household in the city was $45,711, and the median income for a family was $50,919. Males had a median income of $35,945 versus $30,935 for females. The per capita income for the city was $17,945. About 11.2% of families and 14.2% of the population were below the poverty line, including 19.2% of those under age 18 and 8.7% of those age 65 or over.
Common Questions
What is Per Capita Income in West Carson?
Per Capita income in West Carson is $42,730.
What is the Median Family Income in West Carson?
Median Family Income in West Carson is $104,138.
What is the Median Household income in West Carson?
Median Household Income in West Carson is $91,495.
What is Income or Wage Gap in West Carson?
Income or Wage Gap in West Carson is 7.5%.
Women in West Carson earn 92.5 cents for every dollar earned by a man.
What is Inequality or Gini Index in West Carson?
Inequality or Gini Index in West Carson is 0.43.
What is the Total Population of West Carson?
Total Population of West Carson is 22,240.
What is the Total Male Population of West Carson?
Total Male Population of West Carson is 10,581.
What is the Total Female Population of West Carson?
Total Female Population of West Carson is 11,659.
What is the Ratio of Males per 100 Females in West Carson?
There are 90.75 Males per 100 Females in West Carson.
What is the Ratio of Females per 100 Males in West Carson?
There are 110.19 Females per 100 Males in West Carson.
What is the Median Population Age in West Carson?
Median Population Age in West Carson is 45.8 Years.
What is the Average Family Size in West Carson
Average Family Size in West Carson is 3.1 People.
What is the Average Household Size in West Carson
Average Household Size in West Carson is 2.7 People.
How Large is the Labor Force in West Carson?
There are 11,817 People in the Labor Forcein in West Carson.
What is the Percentage of People in the Labor Force in West Carson?
61.3% of People are in the Labor Force in West Carson.
What is the Unemployment Rate in West Carson?
Unemployment Rate in West Carson is 5.3%.