Cities with the Highest Percentage of Black / African American Population in Indiana
RELATED REPORTS & OPTIONS
Black / African American
Indiana
Compare Cities
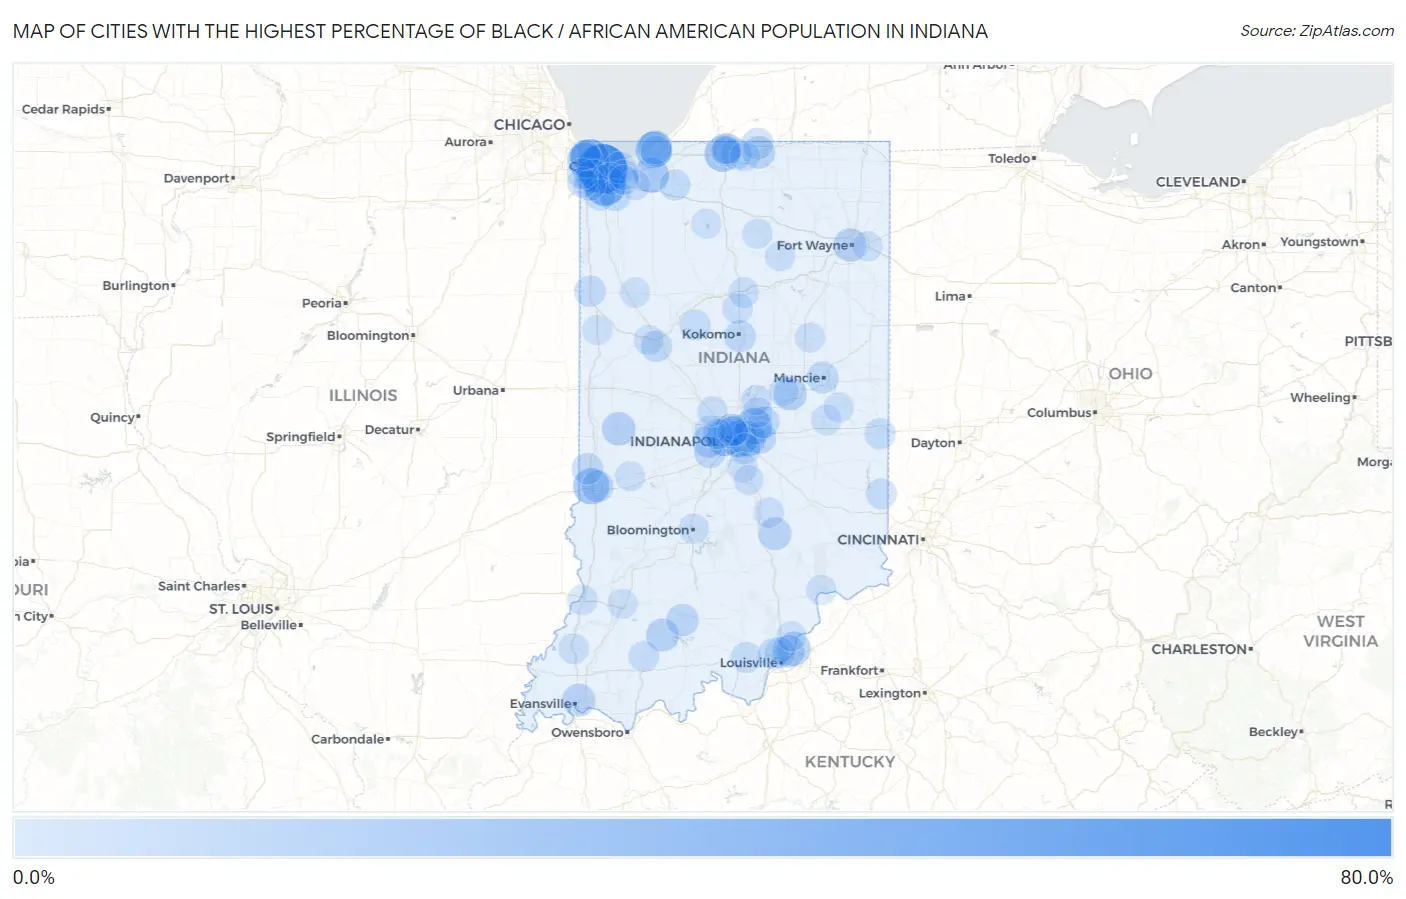
Map of Cities with the Highest Percentage of Black / African American Population in Indiana
0.0%
80.0%
Cities with the Highest Percentage of Black / African American Population in Indiana
| City | Black / African American | vs State | vs National | |
| 1. | Gary | 77.6% | 9.4%(+68.1)#1 | 12.5%(+65.1)#442 |
| 2. | New Marion | 72.7% | 9.4%(+63.3)#2 | 12.5%(+60.3)#554 |
| 3. | Merrillville | 46.3% | 9.4%(+36.8)#3 | 12.5%(+33.8)#1,418 |
| 4. | Hemlock | 39.1% | 9.4%(+29.7)#4 | 12.5%(+26.7)#1,788 |
| 5. | East Chicago | 38.4% | 9.4%(+29.0)#5 | 12.5%(+26.0)#1,828 |
| 6. | Putnamville | 32.7% | 9.4%(+23.2)#6 | 12.5%(+20.2)#2,168 |
| 7. | Speedway | 29.6% | 9.4%(+20.1)#7 | 12.5%(+17.1)#2,391 |
| 8. | Lake Bruce | 29.1% | 9.4%(+19.6)#8 | 12.5%(+16.6)#2,426 |
| 9. | Indianapolis | 28.8% | 9.4%(+19.4)#9 | 12.5%(+16.4)#2,441 |
| 10. | Michigan City | 27.5% | 9.4%(+18.1)#10 | 12.5%(+15.0)#2,535 |
| 11. | Lawrence | 27.2% | 9.4%(+17.8)#11 | 12.5%(+14.8)#2,554 |
| 12. | Dresser | 26.4% | 9.4%(+17.0)#12 | 12.5%(+13.9)#2,618 |
| 13. | South Bend | 25.4% | 9.4%(+15.9)#13 | 12.5%(+12.9)#2,733 |
| 14. | Warren Park | 24.0% | 9.4%(+14.6)#14 | 12.5%(+11.5)#2,858 |
| 15. | Westville | 22.9% | 9.4%(+13.4)#15 | 12.5%(+10.4)#2,975 |
| 16. | Hammond | 22.4% | 9.4%(+12.9)#16 | 12.5%(+9.92)#3,037 |
| 17. | Fairbanks | 20.4% | 9.4%(+10.9)#17 | 12.5%(+7.89)#3,257 |
| 18. | Wynnedale | 20.2% | 9.4%(+10.7)#18 | 12.5%(+7.71)#3,289 |
| 19. | Utica | 18.3% | 9.4%(+8.90)#19 | 12.5%(+5.88)#3,524 |
| 20. | Pottawattamie Park | 17.7% | 9.4%(+8.22)#20 | 12.5%(+5.20)#3,621 |
| 21. | Griffith | 16.5% | 9.4%(+7.07)#21 | 12.5%(+4.04)#3,814 |
| 22. | Marshall | 16.0% | 9.4%(+6.57)#22 | 12.5%(+3.54)#3,910 |
| 23. | Anderson | 15.5% | 9.4%(+6.08)#23 | 12.5%(+3.05)#3,994 |
| 24. | Fort Wayne | 15.2% | 9.4%(+5.79)#24 | 12.5%(+2.76)#4,053 |
| 25. | Malden | 14.7% | 9.4%(+5.27)#25 | 12.5%(+2.25)#4,157 |
| 26. | Dubois | 14.5% | 9.4%(+5.05)#26 | 12.5%(+2.03)#4,200 |
| 27. | Evansville | 13.6% | 9.4%(+4.20)#27 | 12.5%(+1.17)#4,366 |
| 28. | Elizabethtown | 13.2% | 9.4%(+3.78)#28 | 12.5%(+0.756)#4,463 |
| 29. | Avon | 13.2% | 9.4%(+3.74)#29 | 12.5%(+0.719)#4,474 |
| 30. | Jeffersonville | 12.4% | 9.4%(+2.98)#30 | 12.5%(-0.047)#4,649 |
| 31. | Elkhart | 12.3% | 9.4%(+2.83)#31 | 12.5%(-0.199)#4,693 |
| 32. | Young America | 12.0% | 9.4%(+2.56)#32 | 12.5%(-0.470)#4,760 |
| 33. | Cumberland | 12.0% | 9.4%(+2.54)#33 | 12.5%(-0.486)#4,763 |
| 34. | French Lick | 11.8% | 9.4%(+2.31)#34 | 12.5%(-0.712)#4,808 |
| 35. | Hobart | 11.3% | 9.4%(+1.83)#35 | 12.5%(-1.20)#4,935 |
| 36. | Terre Haute | 11.0% | 9.4%(+1.52)#36 | 12.5%(-1.50)#5,023 |
| 37. | Kokomo | 10.5% | 9.4%(+1.04)#37 | 12.5%(-1.99)#5,163 |
| 38. | Lakes Of The Four Seasons | 10.3% | 9.4%(+0.899)#38 | 12.5%(-2.13)#5,210 |
| 39. | Muncie | 10.2% | 9.4%(+0.709)#39 | 12.5%(-2.32)#5,272 |
| 40. | Hashtown | 9.8% | 9.4%(+0.392)#40 | 12.5%(-2.63)#5,375 |
| 41. | Mccordsville | 9.6% | 9.4%(+0.107)#41 | 12.5%(-2.92)#5,456 |
| 42. | Portage | 9.5% | 9.4%(+0.090)#42 | 12.5%(-2.94)#5,461 |
| 43. | New Goshen | 9.4% | 9.4%(-0.011)#43 | 12.5%(-3.04)#5,497 |
| 44. | Plainfield | 9.4% | 9.4%(-0.017)#44 | 12.5%(-3.04)#5,500 |
| 45. | Lafayette | 9.4% | 9.4%(-0.078)#45 | 12.5%(-3.10)#5,523 |
| 46. | Simonton Lake | 9.3% | 9.4%(-0.123)#46 | 12.5%(-3.15)#5,534 |
| 47. | Trail Creek | 9.1% | 9.4%(-0.376)#47 | 12.5%(-3.40)#5,623 |
| 48. | Brownsburg | 8.7% | 9.4%(-0.741)#48 | 12.5%(-3.77)#5,758 |
| 49. | Kentland | 8.7% | 9.4%(-0.770)#49 | 12.5%(-3.80)#5,773 |
| 50. | Mishawaka | 8.6% | 9.4%(-0.853)#50 | 12.5%(-3.88)#5,809 |
| 51. | New Albany | 8.6% | 9.4%(-0.875)#51 | 12.5%(-3.90)#5,819 |
| 52. | Crown Point | 8.0% | 9.4%(-1.48)#52 | 12.5%(-4.51)#6,065 |
| 53. | Schererville | 7.8% | 9.4%(-1.61)#53 | 12.5%(-4.64)#6,129 |
| 54. | Rocky Ripple | 7.3% | 9.4%(-2.12)#54 | 12.5%(-5.14)#6,359 |
| 55. | Kingsford Heights | 7.1% | 9.4%(-2.33)#55 | 12.5%(-5.35)#6,451 |
| 56. | Richmond | 7.1% | 9.4%(-2.35)#56 | 12.5%(-5.38)#6,463 |
| 57. | Beech Grove | 6.9% | 9.4%(-2.50)#57 | 12.5%(-5.53)#6,538 |
| 58. | Crandall | 6.8% | 9.4%(-2.64)#58 | 12.5%(-5.66)#6,612 |
| 59. | Clarksville | 6.8% | 9.4%(-2.67)#59 | 12.5%(-5.70)#6,629 |
| 60. | Mount Carmel | 6.5% | 9.4%(-2.99)#60 | 12.5%(-6.02)#6,799 |
| 61. | Roseland | 6.4% | 9.4%(-3.02)#61 | 12.5%(-6.05)#6,812 |
| 62. | Clermont | 6.4% | 9.4%(-3.04)#62 | 12.5%(-6.07)#6,820 |
| 63. | Huntingburg | 6.2% | 9.4%(-3.29)#63 | 12.5%(-6.31)#6,962 |
| 64. | Munster | 6.1% | 9.4%(-3.39)#64 | 12.5%(-6.41)#7,035 |
| 65. | Flora | 6.0% | 9.4%(-3.43)#65 | 12.5%(-6.46)#7,063 |
| 66. | Clifford | 5.6% | 9.4%(-3.87)#66 | 12.5%(-6.89)#7,328 |
| 67. | Grissom Afb | 5.5% | 9.4%(-3.98)#67 | 12.5%(-7.01)#7,386 |
| 68. | Noblesville | 5.3% | 9.4%(-4.12)#68 | 12.5%(-7.15)#7,487 |
| 69. | Princeton | 5.2% | 9.4%(-4.28)#69 | 12.5%(-7.30)#7,599 |
| 70. | Fishers | 5.1% | 9.4%(-4.34)#70 | 12.5%(-7.36)#7,644 |
| 71. | Valparaiso | 4.9% | 9.4%(-4.58)#71 | 12.5%(-7.60)#7,797 |
| 72. | Whitestown | 4.8% | 9.4%(-4.60)#72 | 12.5%(-7.62)#7,813 |
| 73. | Bloomington | 4.8% | 9.4%(-4.69)#73 | 12.5%(-7.72)#7,892 |
| 74. | Dyer | 4.7% | 9.4%(-4.70)#74 | 12.5%(-7.73)#7,905 |
| 75. | Vincennes | 4.7% | 9.4%(-4.72)#75 | 12.5%(-7.74)#7,914 |
| 76. | Whiting | 4.7% | 9.4%(-4.77)#76 | 12.5%(-7.79)#7,943 |
| 77. | New Castle | 4.6% | 9.4%(-4.88)#77 | 12.5%(-7.90)#8,036 |
| 78. | Peru | 4.5% | 9.4%(-4.92)#78 | 12.5%(-7.95)#8,082 |
| 79. | Indian Village | 4.5% | 9.4%(-4.93)#79 | 12.5%(-7.96)#8,092 |
| 80. | Burket | 4.5% | 9.4%(-4.94)#80 | 12.5%(-7.97)#8,104 |
| 81. | Wolcott | 4.4% | 9.4%(-5.02)#81 | 12.5%(-8.05)#8,180 |
| 82. | Madison | 4.4% | 9.4%(-5.04)#82 | 12.5%(-8.06)#8,192 |
| 83. | South Haven | 4.2% | 9.4%(-5.20)#83 | 12.5%(-8.23)#8,342 |
| 84. | New Haven | 4.2% | 9.4%(-5.26)#84 | 12.5%(-8.29)#8,396 |
| 85. | Boswell | 4.2% | 9.4%(-5.28)#85 | 12.5%(-8.30)#8,409 |
| 86. | Spring Hill | 4.2% | 9.4%(-5.28)#86 | 12.5%(-8.30)#8,412 |
| 87. | Charlestown | 4.1% | 9.4%(-5.37)#87 | 12.5%(-8.40)#8,498 |
| 88. | North Manchester | 4.1% | 9.4%(-5.38)#88 | 12.5%(-8.40)#8,501 |
| 89. | Knightsville | 4.1% | 9.4%(-5.38)#89 | 12.5%(-8.41)#8,504 |
| 90. | Greenwood | 4.0% | 9.4%(-5.40)#90 | 12.5%(-8.43)#8,526 |
| 91. | Osceola | 4.0% | 9.4%(-5.43)#91 | 12.5%(-8.45)#8,546 |
| 92. | Mooreland | 4.0% | 9.4%(-5.47)#92 | 12.5%(-8.49)#8,577 |
| 93. | Edgewood | 4.0% | 9.4%(-5.48)#93 | 12.5%(-8.51)#8,592 |
| 94. | Upland | 3.9% | 9.4%(-5.51)#94 | 12.5%(-8.53)#8,623 |
| 95. | Salt Creek Commons | 3.9% | 9.4%(-5.56)#95 | 12.5%(-8.59)#8,684 |
| 96. | Washington | 3.9% | 9.4%(-5.59)#96 | 12.5%(-8.61)#8,712 |
| 97. | Franklin | 3.9% | 9.4%(-5.59)#97 | 12.5%(-8.61)#8,713 |
| 98. | West Lafayette | 3.8% | 9.4%(-5.62)#98 | 12.5%(-8.65)#8,740 |
| 99. | Culver | 3.8% | 9.4%(-5.62)#99 | 12.5%(-8.65)#8,749 |
| 100. | Notre Dame | 3.8% | 9.4%(-5.63)#100 | 12.5%(-8.66)#8,760 |
Common Questions
What are the Top 10 Cities with the Highest Percentage of Black / African American Population in Indiana?
Top 10 Cities with the Highest Percentage of Black / African American Population in Indiana are:
#1
77.6%
#2
46.3%
#3
38.4%
#4
29.6%
#5
28.8%
#6
27.5%
#7
27.2%
#8
26.4%
#9
25.4%
#10
24.0%
What city has the Highest Percentage of Black / African American Population in Indiana?
Gary has the Highest Percentage of Black / African American Population in Indiana with 77.6%.
What is the Percentage of Black / African American Population in the State of Indiana?
Percentage of Black / African American Population in Indiana is 9.4%.
What is the Percentage of Black / African American Population in the United States?
Percentage of Black / African American Population in the United States is 12.5%.