Tecopa, CA Map & Demographics
Tecopa Map
Tecopa Overview
$26,498
PER CAPITA INCOME
$31,563
AVG HOUSEHOLD INCOME
0.44
INEQUALITY / GINI INDEX
187
TOTAL POPULATION
106
MALE POPULATION
81
FEMALE POPULATION
130.86
MALES / 100 FEMALES
76.42
FEMALES / 100 MALES
67.4
MEDIAN AGE
2.3
AVG FAMILY SIZE
1.7
AVG HOUSEHOLD SIZE
22
LABOR FORCE [ PEOPLE ]
11.8%
PERCENT IN LABOR FORCE
Tecopa Zip Codes
Tecopa Area Codes
Income in Tecopa
Income Overview in Tecopa
| Characteristic | Number | Measure |
| Per Capita Income | 187 | $26,498 |
| Median Family Income | 52 | $0 |
| Mean Family Income | 52 | $60,987 |
| Median Household Income | 111 | $31,563 |
| Mean Household Income | 111 | $46,651 |
| Income Deficit | 52 | $0 |
| Wage / Income Gap (%) | 187 | 0.00% |
| Wage / Income Gap ($) | 187 | 100.00¢ per $1 |
| Gini / Inequality Index | 187 | 0.44 |
Earnings by Sex in Tecopa
| Sex | Number | Average Earnings |
| Male | 33 (55.0%) | $0 |
| Female | 27 (45.0%) | $0 |
| Total | 60 (100.0%) | $0 |
Earnings by Sex by Income Bracket in Tecopa
The most common earnings brackets in Tecopa are $15,000 to $17,499 for men (16 | 48.5%) and $2,499 or less for women (18 | 66.7%).
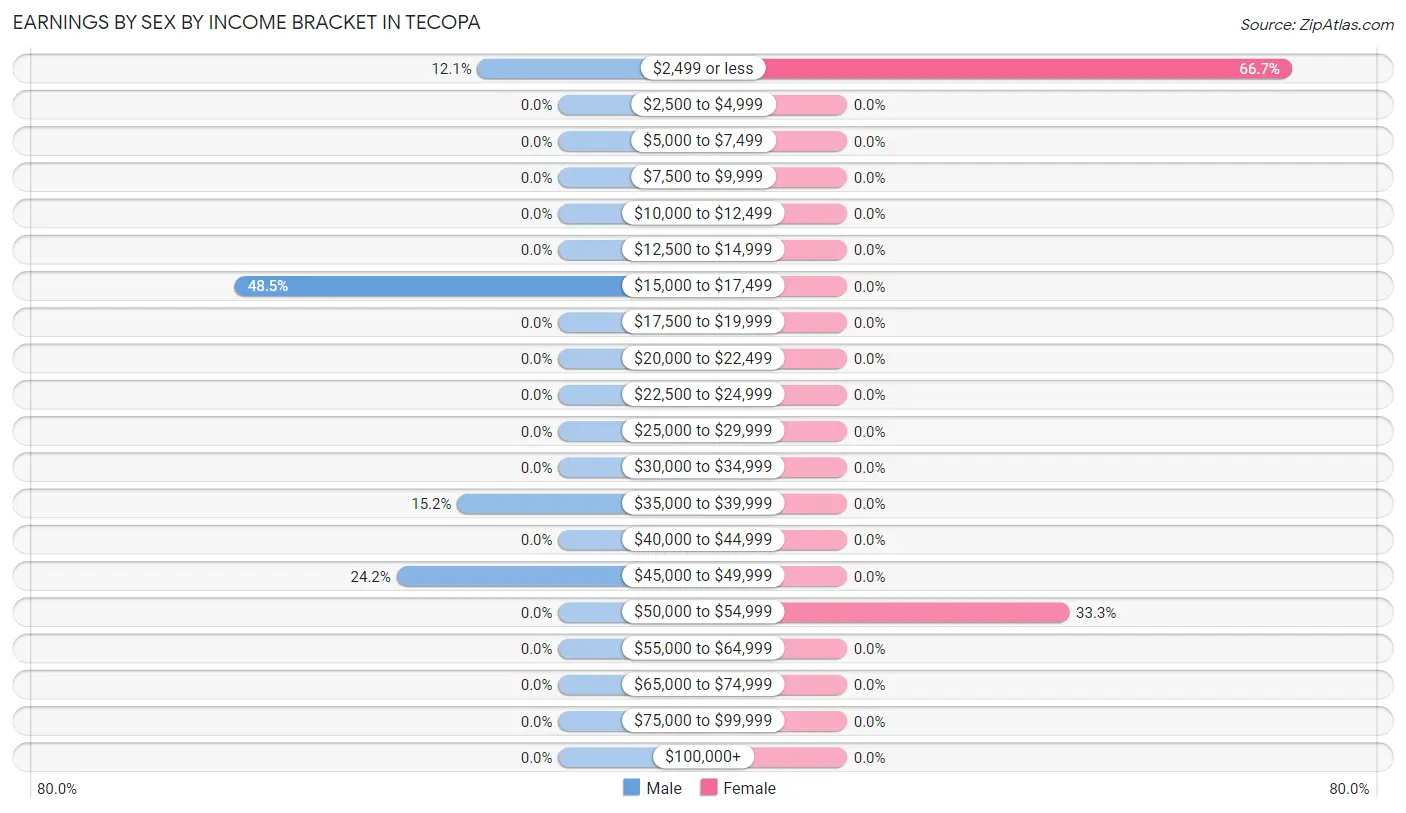
| Income | Male | Female |
| $2,499 or less | 4 (12.1%) | 18 (66.7%) |
| $2,500 to $4,999 | 0 (0.0%) | 0 (0.0%) |
| $5,000 to $7,499 | 0 (0.0%) | 0 (0.0%) |
| $7,500 to $9,999 | 0 (0.0%) | 0 (0.0%) |
| $10,000 to $12,499 | 0 (0.0%) | 0 (0.0%) |
| $12,500 to $14,999 | 0 (0.0%) | 0 (0.0%) |
| $15,000 to $17,499 | 16 (48.5%) | 0 (0.0%) |
| $17,500 to $19,999 | 0 (0.0%) | 0 (0.0%) |
| $20,000 to $22,499 | 0 (0.0%) | 0 (0.0%) |
| $22,500 to $24,999 | 0 (0.0%) | 0 (0.0%) |
| $25,000 to $29,999 | 0 (0.0%) | 0 (0.0%) |
| $30,000 to $34,999 | 0 (0.0%) | 0 (0.0%) |
| $35,000 to $39,999 | 5 (15.1%) | 0 (0.0%) |
| $40,000 to $44,999 | 0 (0.0%) | 0 (0.0%) |
| $45,000 to $49,999 | 8 (24.2%) | 0 (0.0%) |
| $50,000 to $54,999 | 0 (0.0%) | 9 (33.3%) |
| $55,000 to $64,999 | 0 (0.0%) | 0 (0.0%) |
| $65,000 to $74,999 | 0 (0.0%) | 0 (0.0%) |
| $75,000 to $99,999 | 0 (0.0%) | 0 (0.0%) |
| $100,000+ | 0 (0.0%) | 0 (0.0%) |
| Total | 33 (100.0%) | 27 (100.0%) |
Earnings by Sex by Educational Attainment in Tecopa
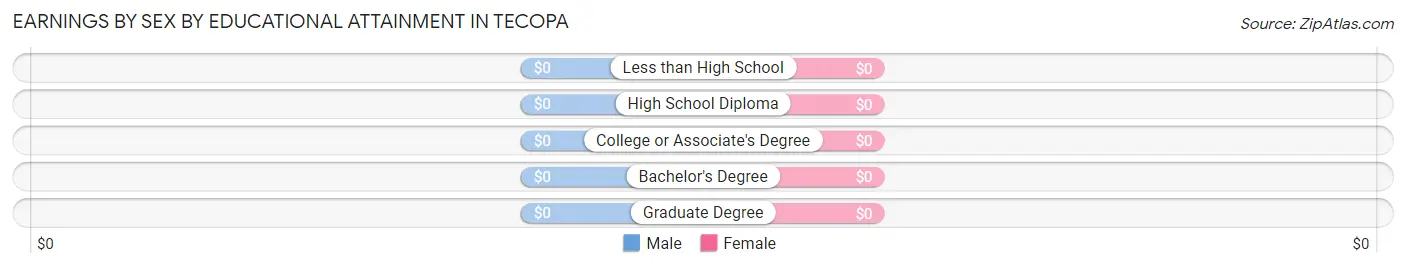
| Educational Attainment | Male Income | Female Income |
| Less than High School | - | - |
| High School Diploma | - | - |
| College or Associate's Degree | - | - |
| Bachelor's Degree | - | - |
| Graduate Degree | - | - |
| Total | - | - |
Family Income in Tecopa
Family Income Brackets in Tecopa
According to the Tecopa family income data, there are 21 families falling into the $15,000 to $24,999 income range, which is the most common income bracket and makes up 40.4% of all families.
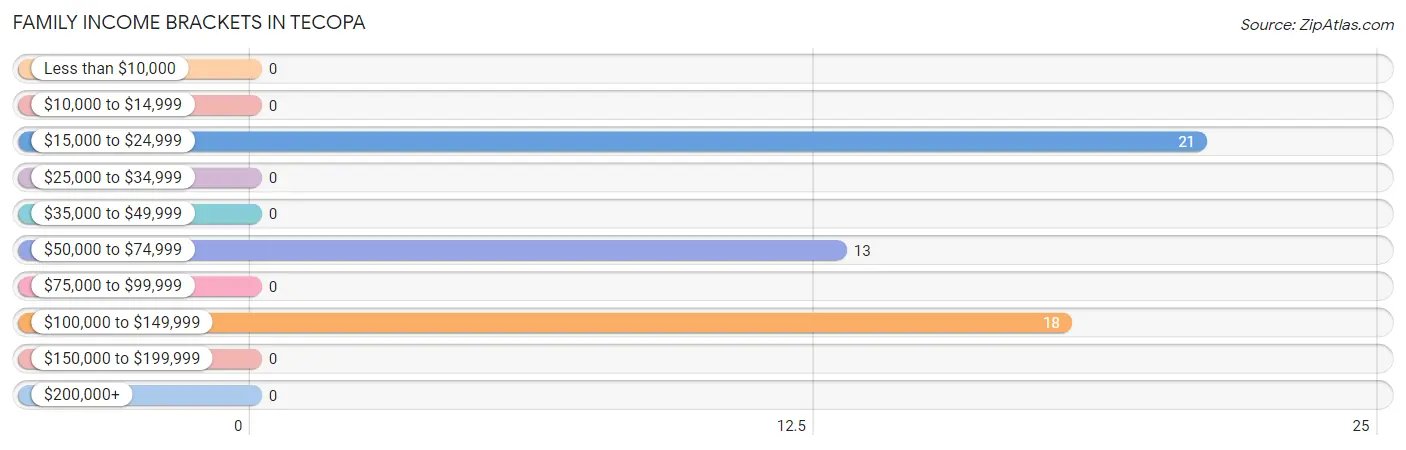
| Income Bracket | # Families | % Families |
| Less than $10,000 | 0 | 0.0% |
| $10,000 to $14,999 | 0 | 0.0% |
| $15,000 to $24,999 | 21 | 40.4% |
| $25,000 to $34,999 | 0 | 0.0% |
| $35,000 to $49,999 | 0 | 0.0% |
| $50,000 to $74,999 | 13 | 25.0% |
| $75,000 to $99,999 | 0 | 0.0% |
| $100,000 to $149,999 | 18 | 34.6% |
| $150,000 to $199,999 | 0 | 0.0% |
| $200,000+ | 0 | 0.0% |
Family Income by Famaliy Size in Tecopa
3-person families (17 | 32.7%) account for the highest median family income in Tecopa with $110,568 per family, while 3-person families (17 | 32.7%) have the highest median income of $36,856 per family member.
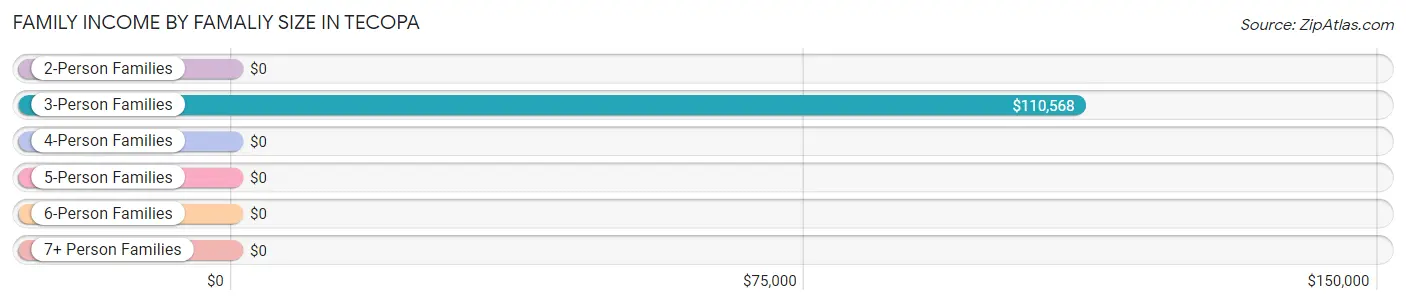
| Income Bracket | # Families | Median Income |
| 2-Person Families | 35 (67.3%) | $0 |
| 3-Person Families | 17 (32.7%) | $110,568 |
| 4-Person Families | 0 (0.0%) | $0 |
| 5-Person Families | 0 (0.0%) | $0 |
| 6-Person Families | 0 (0.0%) | $0 |
| 7+ Person Families | 0 (0.0%) | $0 |
| Total | 52 (100.0%) | $0 |
Family Income by Number of Earners in Tecopa
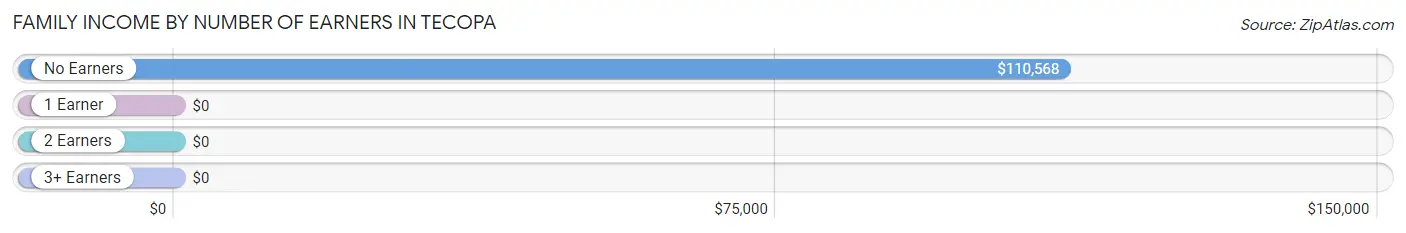
| Number of Earners | # Families | Median Income |
| No Earners | 31 (59.6%) | $110,568 |
| 1 Earner | 3 (5.8%) | $0 |
| 2 Earners | 18 (34.6%) | $0 |
| 3+ Earners | 0 (0.0%) | $0 |
| Total | 52 (100.0%) | $0 |
Household Income in Tecopa
Household Income Brackets in Tecopa
With 27 households falling in the category, the $15,000 to $24,999 income range is the most frequent in Tecopa, accounting for 24.3% of all households.
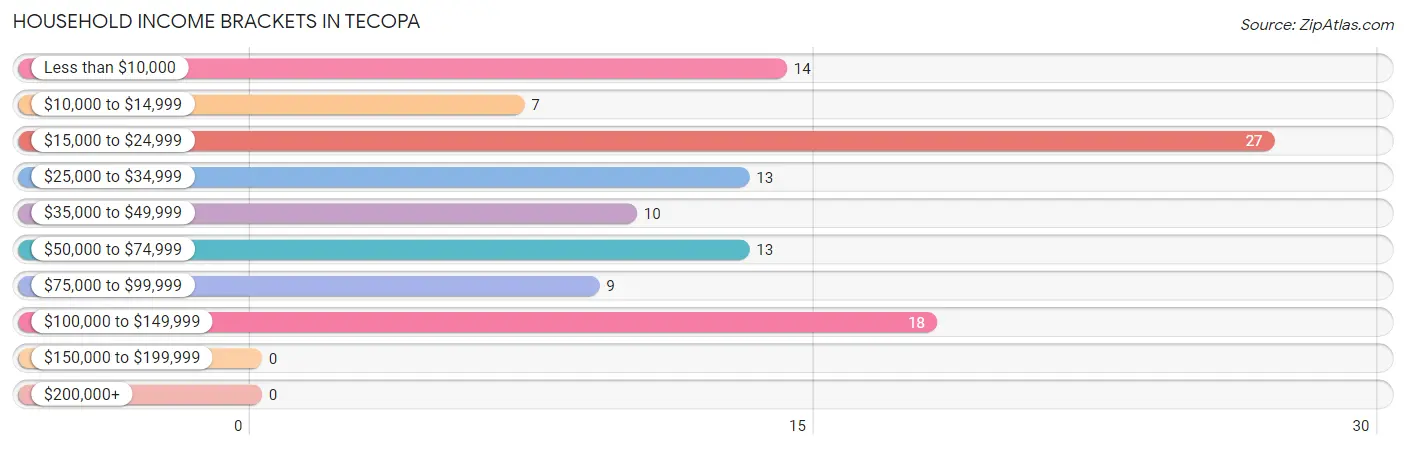
| Income Bracket | # Households | % Households |
| Less than $10,000 | 14 | 12.6% |
| $10,000 to $14,999 | 7 | 6.3% |
| $15,000 to $24,999 | 27 | 24.3% |
| $25,000 to $34,999 | 13 | 11.7% |
| $35,000 to $49,999 | 10 | 9.0% |
| $50,000 to $74,999 | 13 | 11.7% |
| $75,000 to $99,999 | 9 | 8.1% |
| $100,000 to $149,999 | 18 | 16.2% |
| $150,000 to $199,999 | 0 | 0.0% |
| $200,000+ | 0 | 0.0% |
Household Income by Householder Age in Tecopa
The median household income in Tecopa is $31,563, with the highest median household income of $38,875 found in the 65+ years age bracket for the primary householder. A total of 71 households (64.0%) fall into this category.
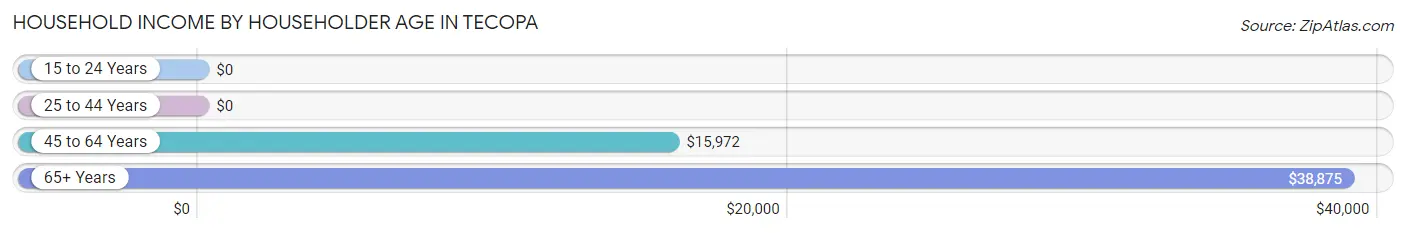
| Income Bracket | # Households | Median Income |
| 15 to 24 Years | 0 (0.0%) | $0 |
| 25 to 44 Years | 0 (0.0%) | $0 |
| 45 to 64 Years | 40 (36.0%) | $15,972 |
| 65+ Years | 71 (64.0%) | $38,875 |
| Total | 111 (100.0%) | $31,563 |
Poverty in Tecopa
Income Below Poverty by Sex and Age in Tecopa
With 34.9% poverty level for males and 29.6% for females among the residents of Tecopa, 18 to 24 year old males and 45 to 54 year old females are the most vulnerable to poverty, with 3 males (100.0%) and 18 females (100.0%) in their respective age groups living below the poverty level.
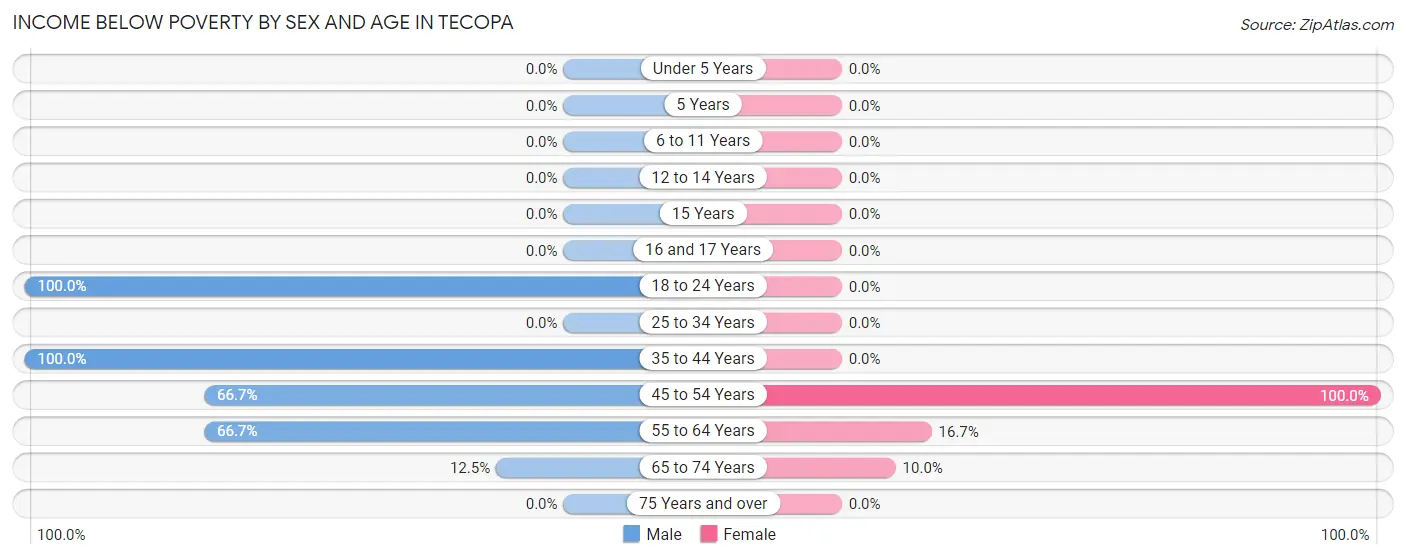
| Age Bracket | Male | Female |
| Under 5 Years | 0 (0.0%) | 0 (0.0%) |
| 5 Years | 0 (0.0%) | 0 (0.0%) |
| 6 to 11 Years | 0 (0.0%) | 0 (0.0%) |
| 12 to 14 Years | 0 (0.0%) | 0 (0.0%) |
| 15 Years | 0 (0.0%) | 0 (0.0%) |
| 16 and 17 Years | 0 (0.0%) | 0 (0.0%) |
| 18 to 24 Years | 3 (100.0%) | 0 (0.0%) |
| 25 to 34 Years | 0 (0.0%) | 0 (0.0%) |
| 35 to 44 Years | 4 (100.0%) | 0 (0.0%) |
| 45 to 54 Years | 16 (66.7%) | 18 (100.0%) |
| 55 to 64 Years | 10 (66.7%) | 3 (16.7%) |
| 65 to 74 Years | 4 (12.5%) | 3 (10.0%) |
| 75 Years and over | 0 (0.0%) | 0 (0.0%) |
| Total | 37 (34.9%) | 24 (29.6%) |
Income Above Poverty by Sex and Age in Tecopa
According to the poverty statistics in Tecopa, males aged 75 years and over and females aged 75 years and over are the age groups that are most secure financially, with 100.0% of males and 100.0% of females in these age groups living above the poverty line.
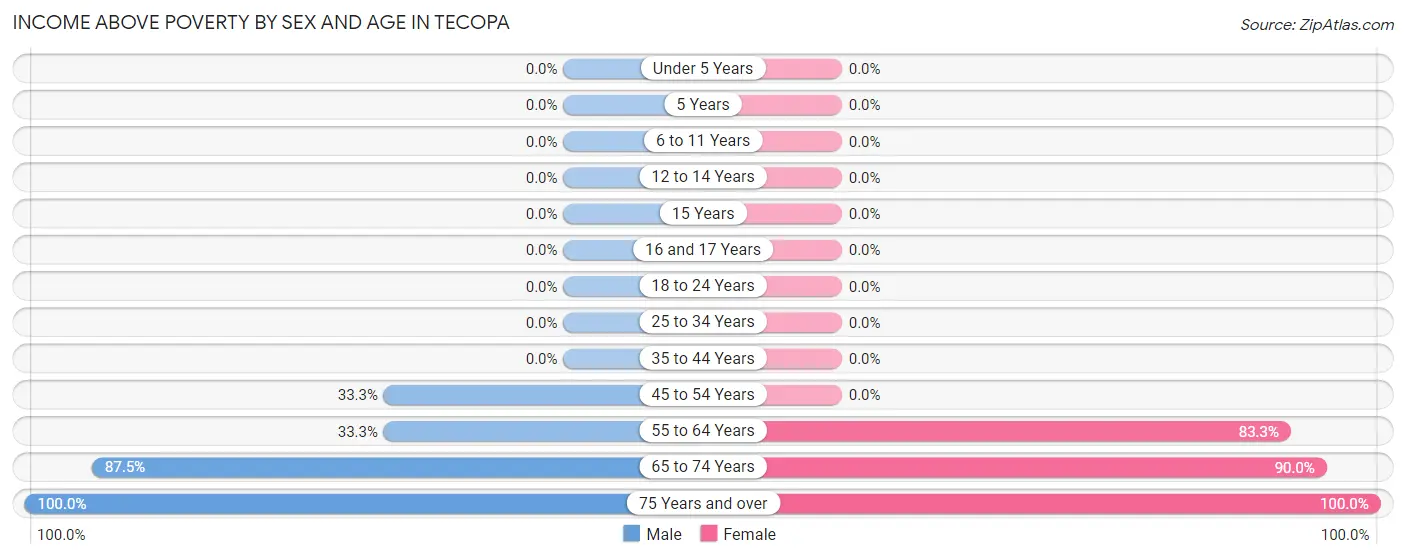
| Age Bracket | Male | Female |
| Under 5 Years | 0 (0.0%) | 0 (0.0%) |
| 5 Years | 0 (0.0%) | 0 (0.0%) |
| 6 to 11 Years | 0 (0.0%) | 0 (0.0%) |
| 12 to 14 Years | 0 (0.0%) | 0 (0.0%) |
| 15 Years | 0 (0.0%) | 0 (0.0%) |
| 16 and 17 Years | 0 (0.0%) | 0 (0.0%) |
| 18 to 24 Years | 0 (0.0%) | 0 (0.0%) |
| 25 to 34 Years | 0 (0.0%) | 0 (0.0%) |
| 35 to 44 Years | 0 (0.0%) | 0 (0.0%) |
| 45 to 54 Years | 8 (33.3%) | 0 (0.0%) |
| 55 to 64 Years | 5 (33.3%) | 15 (83.3%) |
| 65 to 74 Years | 28 (87.5%) | 27 (90.0%) |
| 75 Years and over | 28 (100.0%) | 15 (100.0%) |
| Total | 69 (65.1%) | 57 (70.4%) |
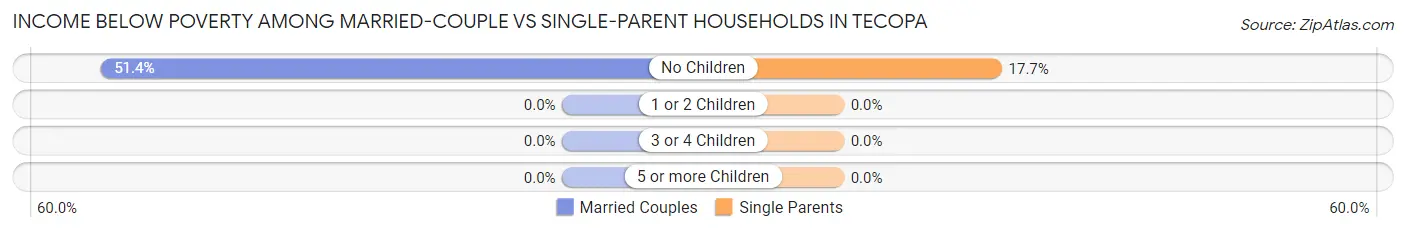
Income Below Poverty Among Married-Couple Families in Tecopa
The poverty statistics for married-couple families in Tecopa show that 51.4% or 18 of the total 35 families live below the poverty line. Families with no children have the highest poverty rate of 51.4%, comprising of 18 families. On the other hand, families with no children have the lowest poverty rate of 51.4%, which includes 18 families.
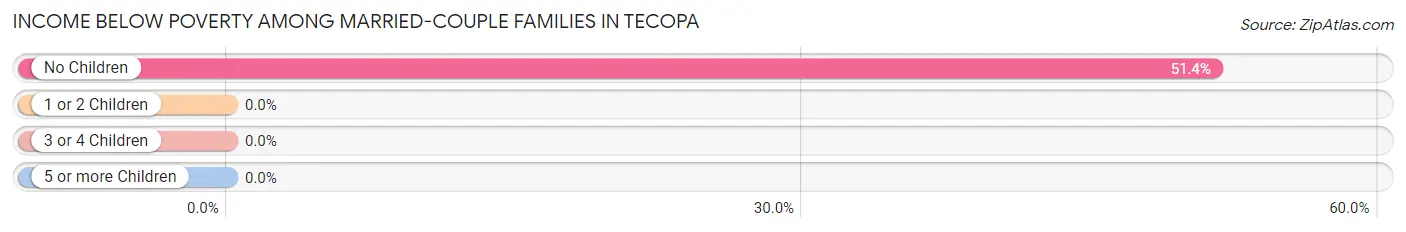
| Children | Above Poverty | Below Poverty |
| No Children | 17 (48.6%) | 18 (51.4%) |
| 1 or 2 Children | 0 (0.0%) | 0 (0.0%) |
| 3 or 4 Children | 0 (0.0%) | 0 (0.0%) |
| 5 or more Children | 0 (0.0%) | 0 (0.0%) |
| Total | 17 (48.6%) | 18 (51.4%) |
Income Below Poverty Among Single-Parent Households in Tecopa
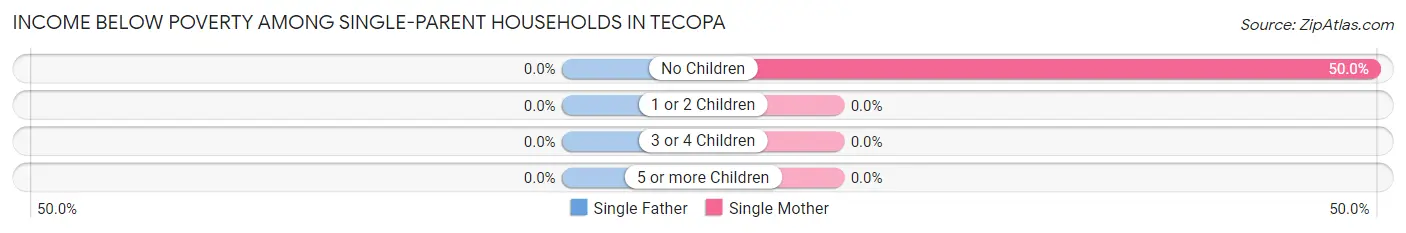
| Children | Single Father | Single Mother |
| No Children | 0 (0.0%) | 3 (50.0%) |
| 1 or 2 Children | 0 (0.0%) | 0 (0.0%) |
| 3 or 4 Children | 0 (0.0%) | 0 (0.0%) |
| 5 or more Children | 0 (0.0%) | 0 (0.0%) |
| Total | 0 (0.0%) | 3 (50.0%) |
Income Below Poverty Among Married-Couple vs Single-Parent Households in Tecopa
The poverty data for Tecopa shows that 18 of the married-couple family households (51.4%) and 3 of the single-parent households (17.6%) are living below the poverty level. Within the married-couple family households, those with no children have the highest poverty rate, with 18 households (51.4%) falling below the poverty line. Among the single-parent households, those with no children have the highest poverty rate, with 3 household (17.6%) living below poverty.
| Children | Married-Couple Families | Single-Parent Households |
| No Children | 18 (51.4%) | 3 (17.6%) |
| 1 or 2 Children | 0 (0.0%) | 0 (0.0%) |
| 3 or 4 Children | 0 (0.0%) | 0 (0.0%) |
| 5 or more Children | 0 (0.0%) | 0 (0.0%) |
| Total | 18 (51.4%) | 3 (17.6%) |
Race in Tecopa
The most populous races in Tecopa are White / Caucasian (125 | 66.8%), Native / Alaskan (26 | 13.9%), and Two or more Races (23 | 12.3%).
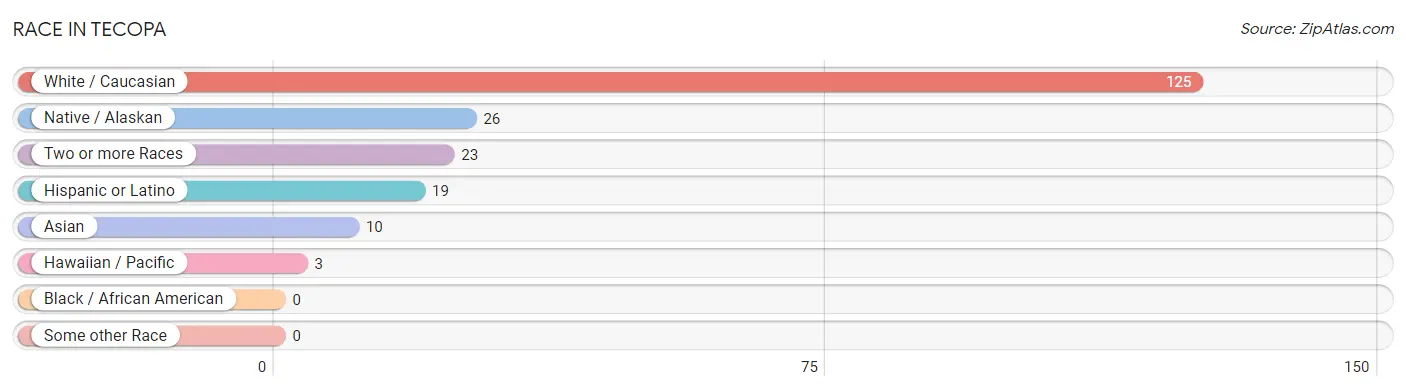
| Race | # Population | % Population |
| Asian | 10 | 5.3% |
| Black / African American | 0 | 0.0% |
| Hawaiian / Pacific | 3 | 1.6% |
| Hispanic or Latino | 19 | 10.2% |
| Native / Alaskan | 26 | 13.9% |
| White / Caucasian | 125 | 66.8% |
| Two or more Races | 23 | 12.3% |
| Some other Race | 0 | 0.0% |
| Total | 187 | 100.0% |
Ancestry in Tecopa
The most populous ancestries reported in Tecopa are German (43 | 23.0%), Irish (29 | 15.5%), Paiute (26 | 13.9%), American (20 | 10.7%), and Mexican (19 | 10.2%), together accounting for 73.3% of all Tecopa residents.
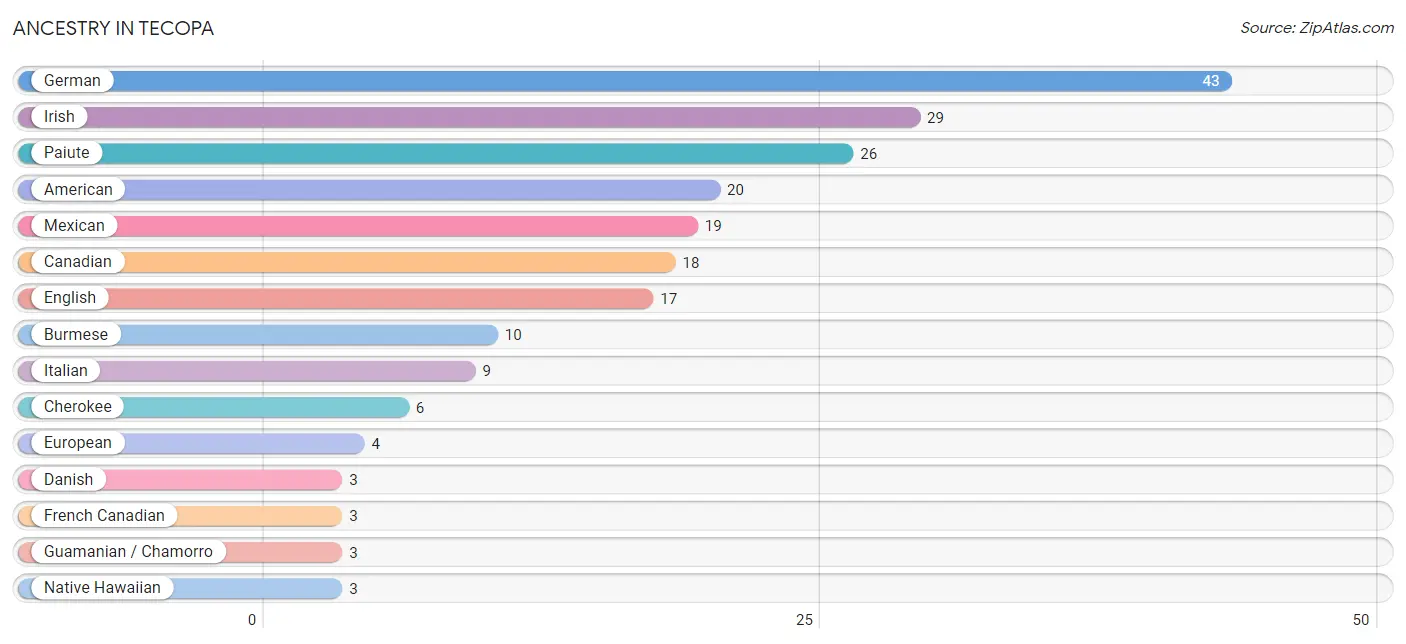
| Ancestry | # Population | % Population |
| American | 20 | 10.7% |
| Burmese | 10 | 5.3% |
| Canadian | 18 | 9.6% |
| Cherokee | 6 | 3.2% |
| Danish | 3 | 1.6% |
| English | 17 | 9.1% |
| European | 4 | 2.1% |
| French Canadian | 3 | 1.6% |
| German | 43 | 23.0% |
| Guamanian / Chamorro | 3 | 1.6% |
| Irish | 29 | 15.5% |
| Italian | 9 | 4.8% |
| Mexican | 19 | 10.2% |
| Native Hawaiian | 3 | 1.6% |
| Paiute | 26 | 13.9% |
| Polish | 3 | 1.6% |
| Russian | 3 | 1.6% | View All 17 Rows |
Immigrants in Tecopa
The most numerous immigrant groups reported in Tecopa came from Canada (18 | 9.6%), Europe (10 | 5.3%), Germany (10 | 5.3%), Western Europe (10 | 5.3%), and Asia (3 | 1.6%), together accounting for 27.3% of all Tecopa residents.
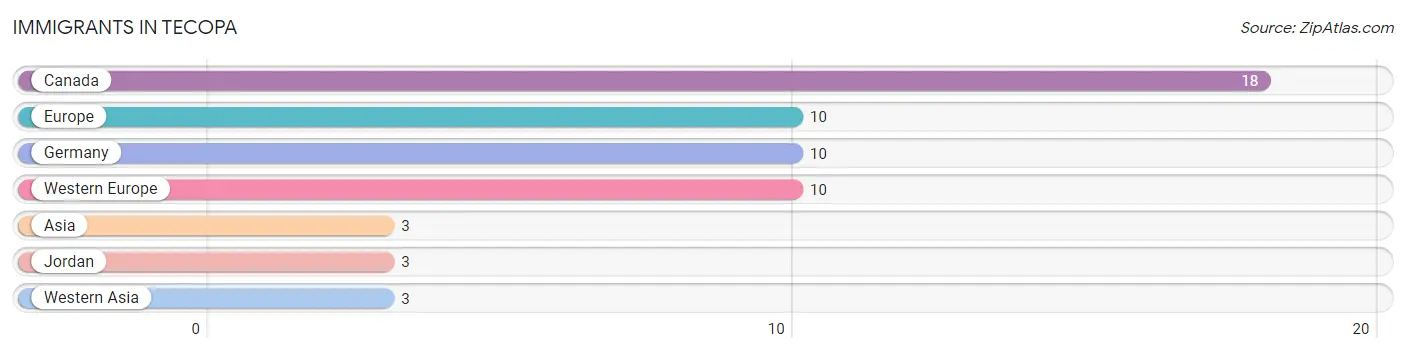
| Immigration Origin | # Population | % Population |
| Asia | 3 | 1.6% |
| Canada | 18 | 9.6% |
| Europe | 10 | 5.3% |
| Germany | 10 | 5.3% |
| Jordan | 3 | 1.6% |
| Western Asia | 3 | 1.6% |
| Western Europe | 10 | 5.3% | View All 7 Rows |
Sex and Age in Tecopa
Sex and Age in Tecopa
The most populous age groups in Tecopa are 50 to 54 Years (24 | 22.6%) for men and 70 to 74 Years (27 | 33.3%) for women.
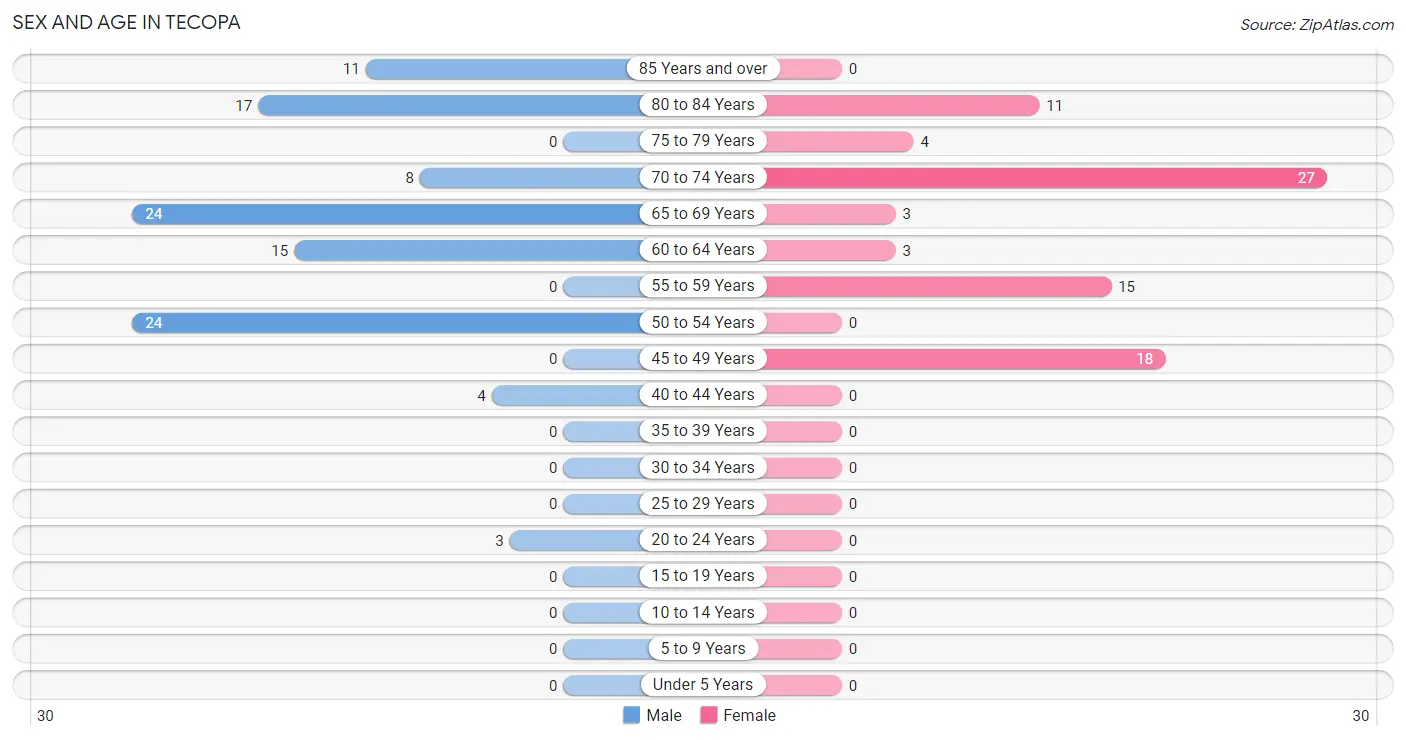
| Age Bracket | Male | Female |
| Under 5 Years | 0 (0.0%) | 0 (0.0%) |
| 5 to 9 Years | 0 (0.0%) | 0 (0.0%) |
| 10 to 14 Years | 0 (0.0%) | 0 (0.0%) |
| 15 to 19 Years | 0 (0.0%) | 0 (0.0%) |
| 20 to 24 Years | 3 (2.8%) | 0 (0.0%) |
| 25 to 29 Years | 0 (0.0%) | 0 (0.0%) |
| 30 to 34 Years | 0 (0.0%) | 0 (0.0%) |
| 35 to 39 Years | 0 (0.0%) | 0 (0.0%) |
| 40 to 44 Years | 4 (3.8%) | 0 (0.0%) |
| 45 to 49 Years | 0 (0.0%) | 18 (22.2%) |
| 50 to 54 Years | 24 (22.6%) | 0 (0.0%) |
| 55 to 59 Years | 0 (0.0%) | 15 (18.5%) |
| 60 to 64 Years | 15 (14.1%) | 3 (3.7%) |
| 65 to 69 Years | 24 (22.6%) | 3 (3.7%) |
| 70 to 74 Years | 8 (7.5%) | 27 (33.3%) |
| 75 to 79 Years | 0 (0.0%) | 4 (4.9%) |
| 80 to 84 Years | 17 (16.0%) | 11 (13.6%) |
| 85 Years and over | 11 (10.4%) | 0 (0.0%) |
| Total | 106 (100.0%) | 81 (100.0%) |
Families and Households in Tecopa
Median Family Size in Tecopa
The median family size in Tecopa is 2.31 persons per family, with single female/mother families (6 | 11.5%) accounting for the largest median family size of 4 persons per family. On the other hand, married-couple families (35 | 67.3%) represent the smallest median family size with 2.00 persons per family.
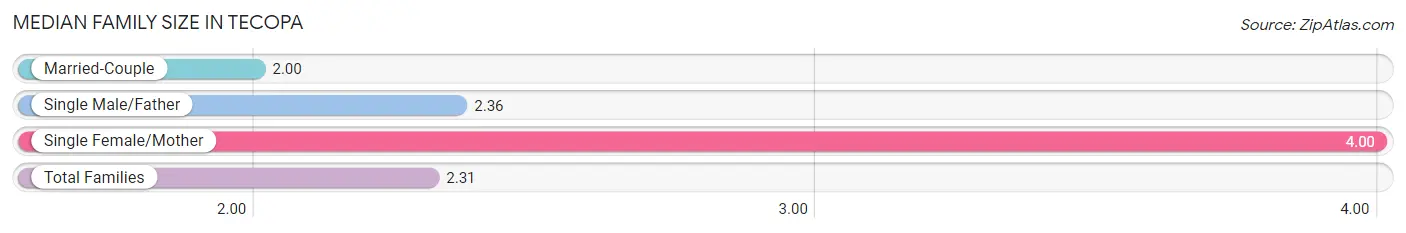
| Family Type | # Families | Family Size |
| Married-Couple | 35 (67.3%) | 2.00 |
| Single Male/Father | 11 (21.1%) | 2.36 |
| Single Female/Mother | 6 (11.5%) | 4.00 |
| Total Families | 52 (100.0%) | 2.31 |
Median Household Size in Tecopa
The median household size in Tecopa is 1.68 persons per household, with single female/mother households (6 | 5.4%) accounting for the largest median household size of 4 persons per household. non-family households (59 | 53.1%) represent the smallest median household size with 1.14 persons per household.
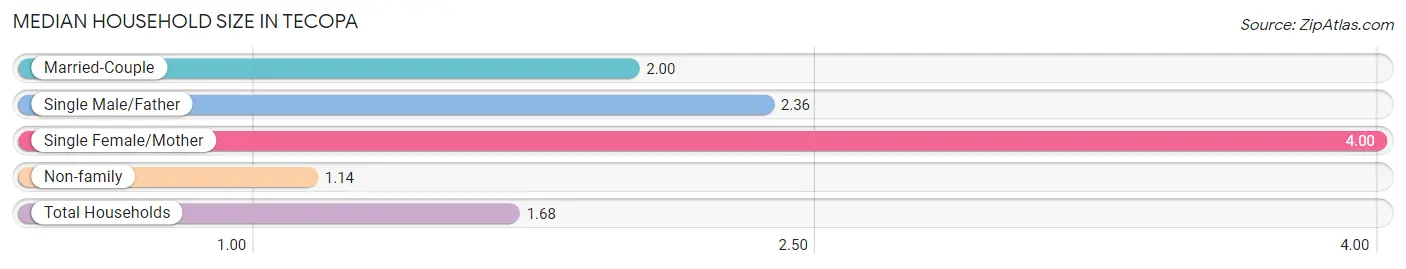
| Household Type | # Households | Household Size |
| Married-Couple | 35 (31.5%) | 2.00 |
| Single Male/Father | 11 (9.9%) | 2.36 |
| Single Female/Mother | 6 (5.4%) | 4.00 |
| Non-family | 59 (53.1%) | 1.14 |
| Total Households | 111 (100.0%) | 1.68 |
Household Size by Marriage Status in Tecopa
Out of a total of 111 households in Tecopa, 52 (46.9%) are family households, while 59 (53.1%) are nonfamily households. The most numerous type of family households are 2-person households, comprising 35, and the most common type of nonfamily households are 1-person households, comprising 50.
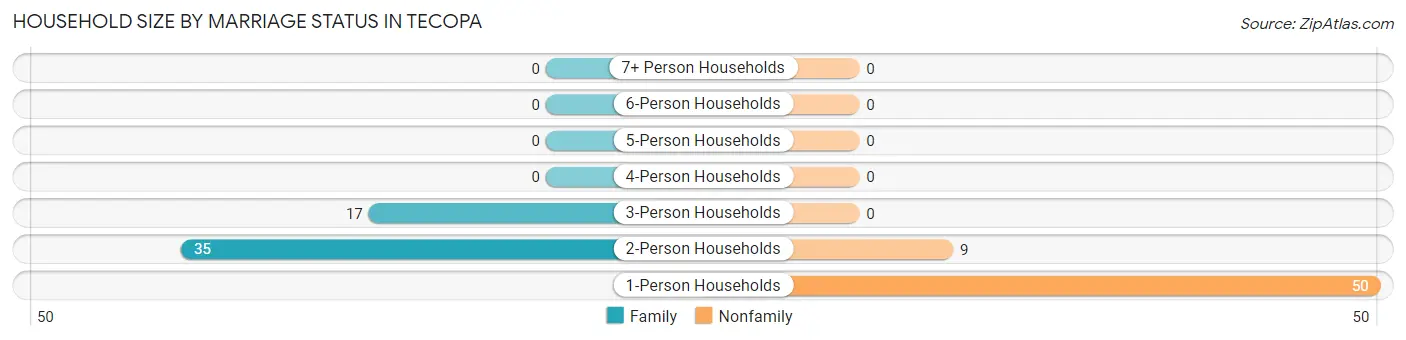
| Household Size | Family Households | Nonfamily Households |
| 1-Person Households | - | 50 (45.1%) |
| 2-Person Households | 35 (31.5%) | 9 (8.1%) |
| 3-Person Households | 17 (15.3%) | 0 (0.0%) |
| 4-Person Households | 0 (0.0%) | 0 (0.0%) |
| 5-Person Households | 0 (0.0%) | 0 (0.0%) |
| 6-Person Households | 0 (0.0%) | 0 (0.0%) |
| 7+ Person Households | 0 (0.0%) | 0 (0.0%) |
| Total | 52 (46.9%) | 59 (53.1%) |
Female Fertility in Tecopa
Fertility by Age in Tecopa
| Age Bracket | Women with Births | Births / 1,000 Women |
| 15 to 19 years | 0 (0.0%) | 0.0 |
| 20 to 34 years | 0 (0.0%) | 0.0 |
| 35 to 50 years | 0 (0.0%) | 0.0 |
| Total | 0 (0.0%) | 0.0 |
Fertility by Age by Marriage Status in Tecopa
| Age Bracket | Married | Unmarried |
| 15 to 19 years | 0 (0.0%) | 0 (0.0%) |
| 20 to 34 years | 0 (0.0%) | 0 (0.0%) |
| 35 to 50 years | 0 (0.0%) | 0 (0.0%) |
| Total | 0 (0.0%) | 0 (0.0%) |
Fertility by Education in Tecopa
| Educational Attainment | Women with Births | Births / 1,000 Women |
| Less than High School | 0 (0.0%) | 0.0 |
| High School Diploma | 0 (0.0%) | 0.0 |
| College or Associate's Degree | 0 (0.0%) | 0.0 |
| Bachelor's Degree | 0 (0.0%) | 0.0 |
| Graduate Degree | 0 (0.0%) | 0.0 |
| Total | 0 (0.0%) | 0.0 |
Fertility by Education by Marriage Status in Tecopa
| Educational Attainment | Married | Unmarried |
| Less than High School | 0 (0.0%) | 0 (0.0%) |
| High School Diploma | 0 (0.0%) | 0 (0.0%) |
| College or Associate's Degree | 0 (0.0%) | 0 (0.0%) |
| Bachelor's Degree | 0 (0.0%) | 0 (0.0%) |
| Graduate Degree | 0 (0.0%) | 0 (0.0%) |
| Total | 0 (0.0%) | 0 (0.0%) |
Employment Characteristics in Tecopa
Employment by Class of Employer in Tecopa
Among the 22 employed individuals in Tecopa, , and local government employees (22 | 100.0%) make up the most common classes of employment.
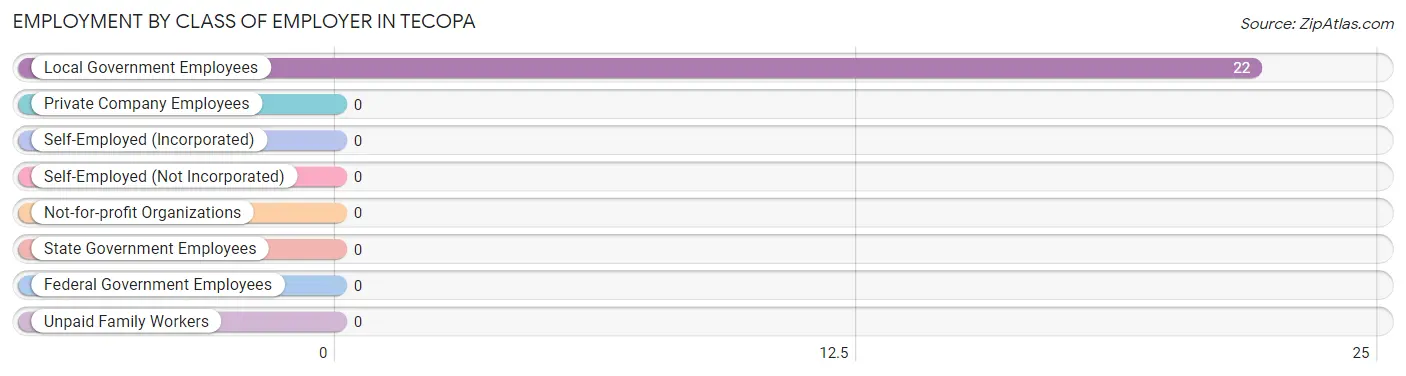
| Employer Class | # Employees | % Employees |
| Private Company Employees | 0 | 0.0% |
| Self-Employed (Incorporated) | 0 | 0.0% |
| Self-Employed (Not Incorporated) | 0 | 0.0% |
| Not-for-profit Organizations | 0 | 0.0% |
| Local Government Employees | 22 | 100.0% |
| State Government Employees | 0 | 0.0% |
| Federal Government Employees | 0 | 0.0% |
| Unpaid Family Workers | 0 | 0.0% |
| Total | 22 | 100.0% |
Employment Status by Age in Tecopa
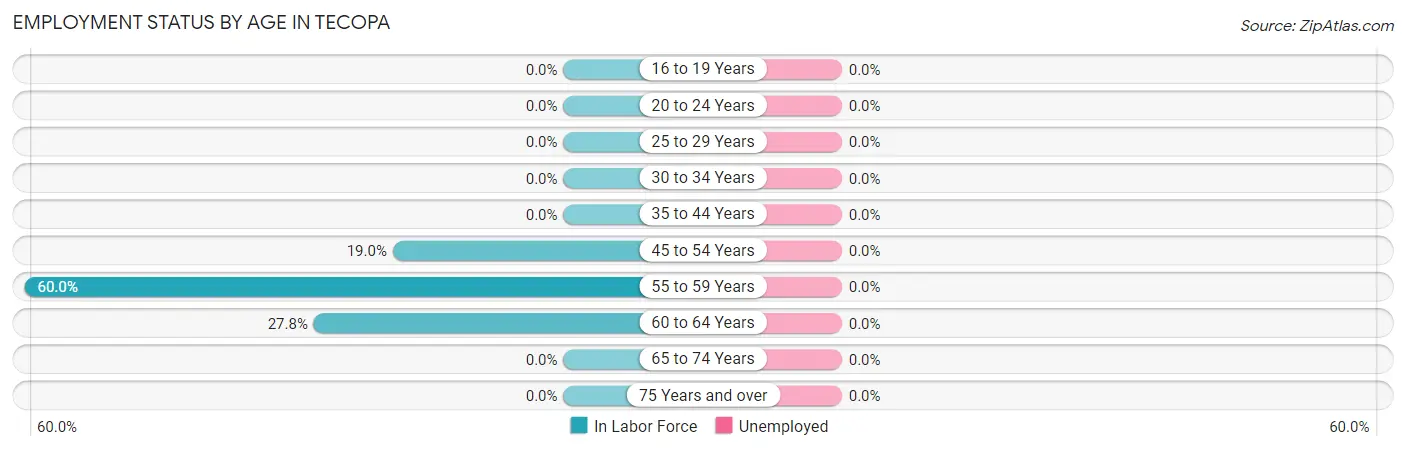
| Age Bracket | In Labor Force | Unemployed |
| 16 to 19 Years | 0 (0.0%) | 0 (0.0%) |
| 20 to 24 Years | 0 (0.0%) | 0 (0.0%) |
| 25 to 29 Years | 0 (0.0%) | 0 (0.0%) |
| 30 to 34 Years | 0 (0.0%) | 0 (0.0%) |
| 35 to 44 Years | 0 (0.0%) | 0 (0.0%) |
| 45 to 54 Years | 8 (19.0%) | 0 (0.0%) |
| 55 to 59 Years | 9 (60.0%) | 0 (0.0%) |
| 60 to 64 Years | 5 (27.8%) | 0 (0.0%) |
| 65 to 74 Years | 0 (0.0%) | 0 (0.0%) |
| 75 Years and over | 0 (0.0%) | 0 (0.0%) |
| Total | 22 (11.8%) | 0 (0.0%) |
Employment Status by Educational Attainment in Tecopa
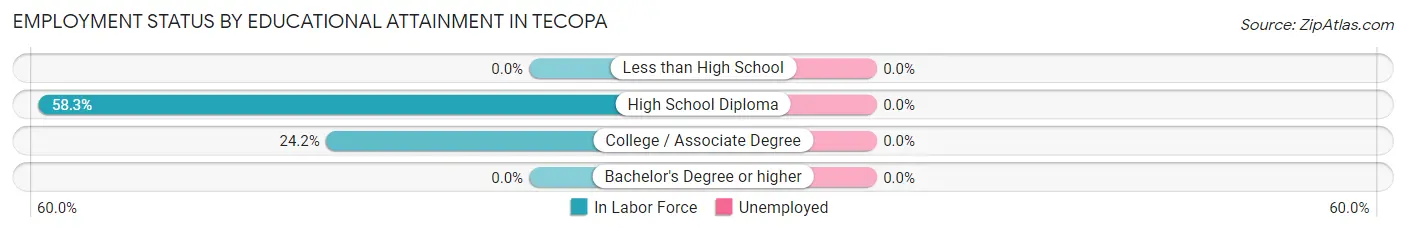
| Educational Attainment | In Labor Force | Unemployed |
| Less than High School | 0 (0.0%) | 0 (0.0%) |
| High School Diploma | 14 (58.3%) | 0 (0.0%) |
| College / Associate Degree | 8 (24.2%) | 0 (0.0%) |
| Bachelor's Degree or higher | 0 (0.0%) | 0 (0.0%) |
| Total | 22 (27.8%) | 0 (0.0%) |
Employment Occupations by Sex in Tecopa
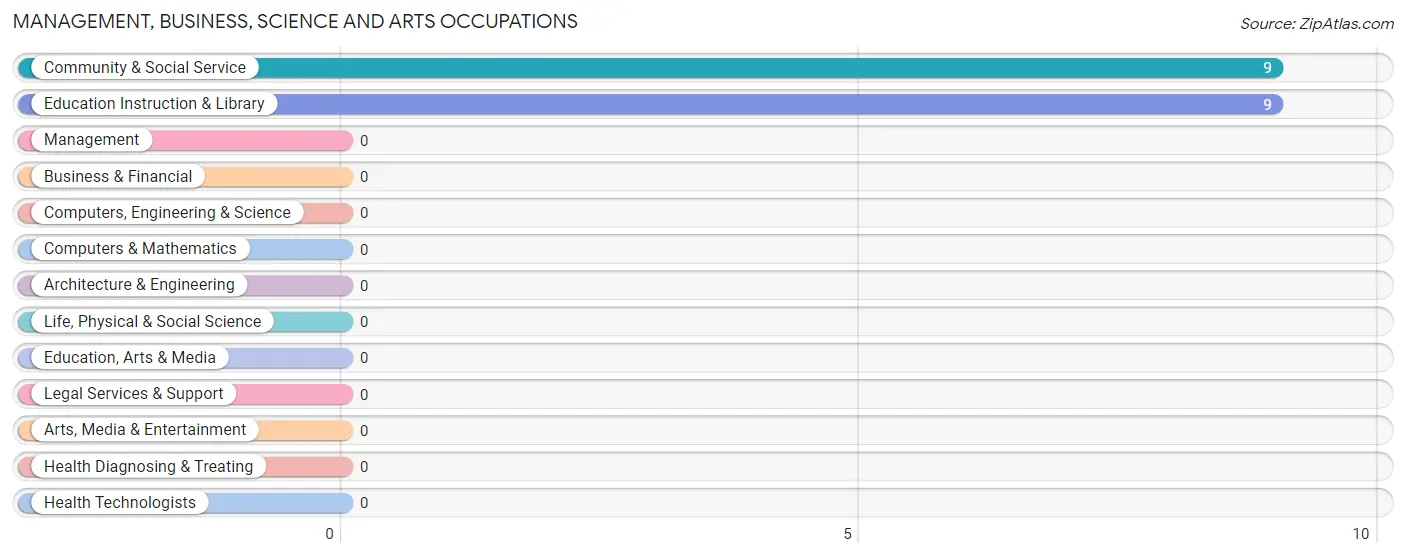
Management, Business, Science and Arts Occupations
The most common Management, Business, Science and Arts occupations in Tecopa are Community & Social Service (9 | 40.9%), and Education Instruction & Library (9 | 40.9%).
Management, Business, Science and Arts Occupations by Sex
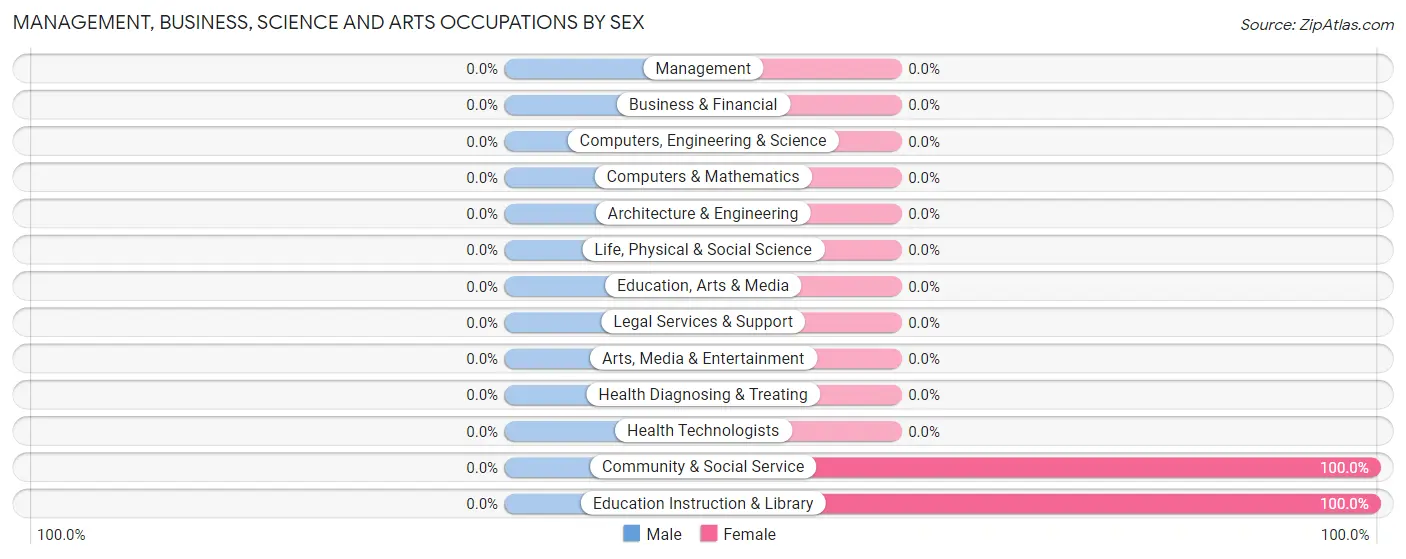
| Occupation | Male | Female |
| Management | 0 (0.0%) | 0 (0.0%) |
| Business & Financial | 0 (0.0%) | 0 (0.0%) |
| Computers, Engineering & Science | 0 (0.0%) | 0 (0.0%) |
| Computers & Mathematics | 0 (0.0%) | 0 (0.0%) |
| Architecture & Engineering | 0 (0.0%) | 0 (0.0%) |
| Life, Physical & Social Science | 0 (0.0%) | 0 (0.0%) |
| Community & Social Service | 0 (0.0%) | 9 (100.0%) |
| Education, Arts & Media | 0 (0.0%) | 0 (0.0%) |
| Legal Services & Support | 0 (0.0%) | 0 (0.0%) |
| Education Instruction & Library | 0 (0.0%) | 9 (100.0%) |
| Arts, Media & Entertainment | 0 (0.0%) | 0 (0.0%) |
| Health Diagnosing & Treating | 0 (0.0%) | 0 (0.0%) |
| Health Technologists | 0 (0.0%) | 0 (0.0%) |
| Total (Category) | 0 (0.0%) | 9 (100.0%) |
| Total (Overall) | 13 (59.1%) | 9 (40.9%) |
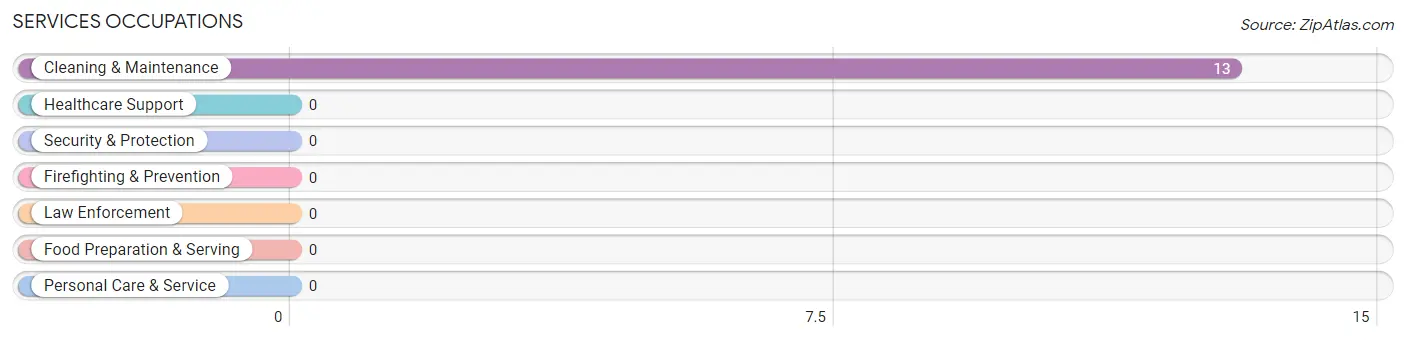
Services Occupations
The most common Services occupations in Tecopa are , and Cleaning & Maintenance (13 | 59.1%).
Services Occupations by Sex
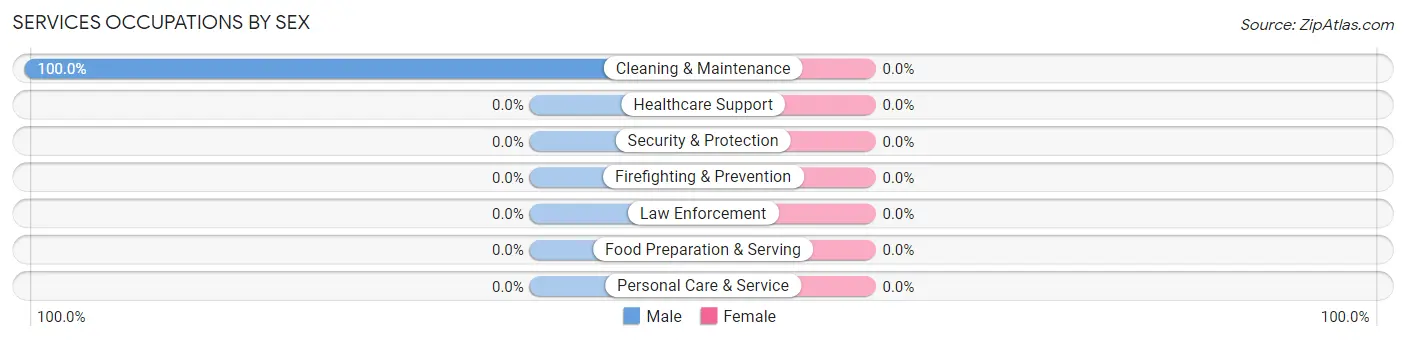
| Occupation | Male | Female |
| Healthcare Support | 0 (0.0%) | 0 (0.0%) |
| Security & Protection | 0 (0.0%) | 0 (0.0%) |
| Firefighting & Prevention | 0 (0.0%) | 0 (0.0%) |
| Law Enforcement | 0 (0.0%) | 0 (0.0%) |
| Food Preparation & Serving | 0 (0.0%) | 0 (0.0%) |
| Cleaning & Maintenance | 13 (100.0%) | 0 (0.0%) |
| Personal Care & Service | 0 (0.0%) | 0 (0.0%) |
| Total (Category) | 13 (100.0%) | 0 (0.0%) |
| Total (Overall) | 13 (59.1%) | 9 (40.9%) |
Sales and Office Occupations
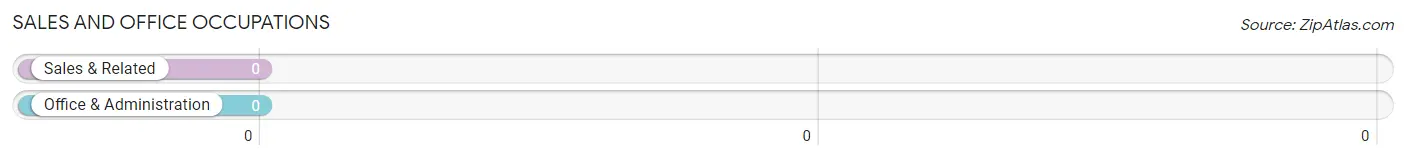
Sales and Office Occupations by Sex
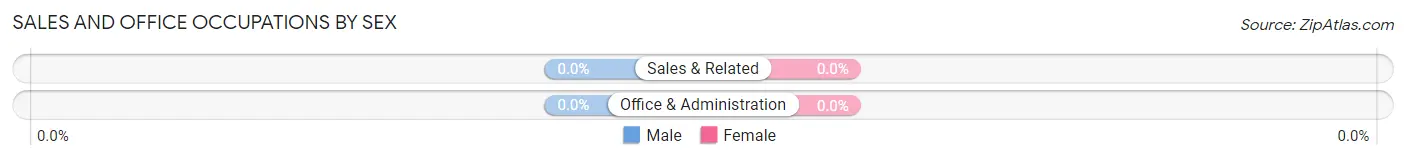
| Occupation | Male | Female |
| Sales & Related | 0 (0.0%) | 0 (0.0%) |
| Office & Administration | 0 (0.0%) | 0 (0.0%) |
| Total (Category) | 0 (0.0%) | 0 (0.0%) |
| Total (Overall) | 13 (59.1%) | 9 (40.9%) |
Natural Resources, Construction and Maintenance Occupations
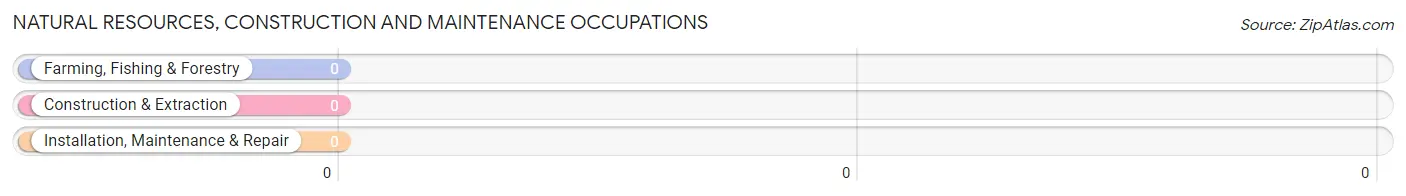
Natural Resources, Construction and Maintenance Occupations by Sex
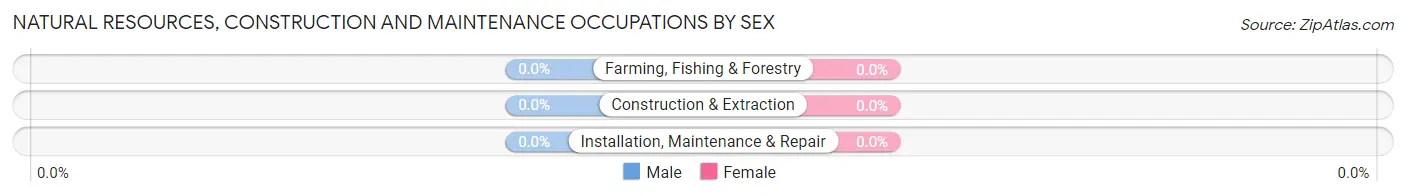
| Occupation | Male | Female |
| Farming, Fishing & Forestry | 0 (0.0%) | 0 (0.0%) |
| Construction & Extraction | 0 (0.0%) | 0 (0.0%) |
| Installation, Maintenance & Repair | 0 (0.0%) | 0 (0.0%) |
| Total (Category) | 0 (0.0%) | 0 (0.0%) |
| Total (Overall) | 13 (59.1%) | 9 (40.9%) |
Production, Transportation and Moving Occupations
Production, Transportation and Moving Occupations by Sex
| Occupation | Male | Female |
| Production | 0 (0.0%) | 0 (0.0%) |
| Transportation | 0 (0.0%) | 0 (0.0%) |
| Material Moving | 0 (0.0%) | 0 (0.0%) |
| Total (Category) | 0 (0.0%) | 0 (0.0%) |
| Total (Overall) | 13 (59.1%) | 9 (40.9%) |
Employment Industries by Sex in Tecopa
Employment Industries in Tecopa
The major employment industries in Tecopa include , and Educational Services (22 | 100.0%).
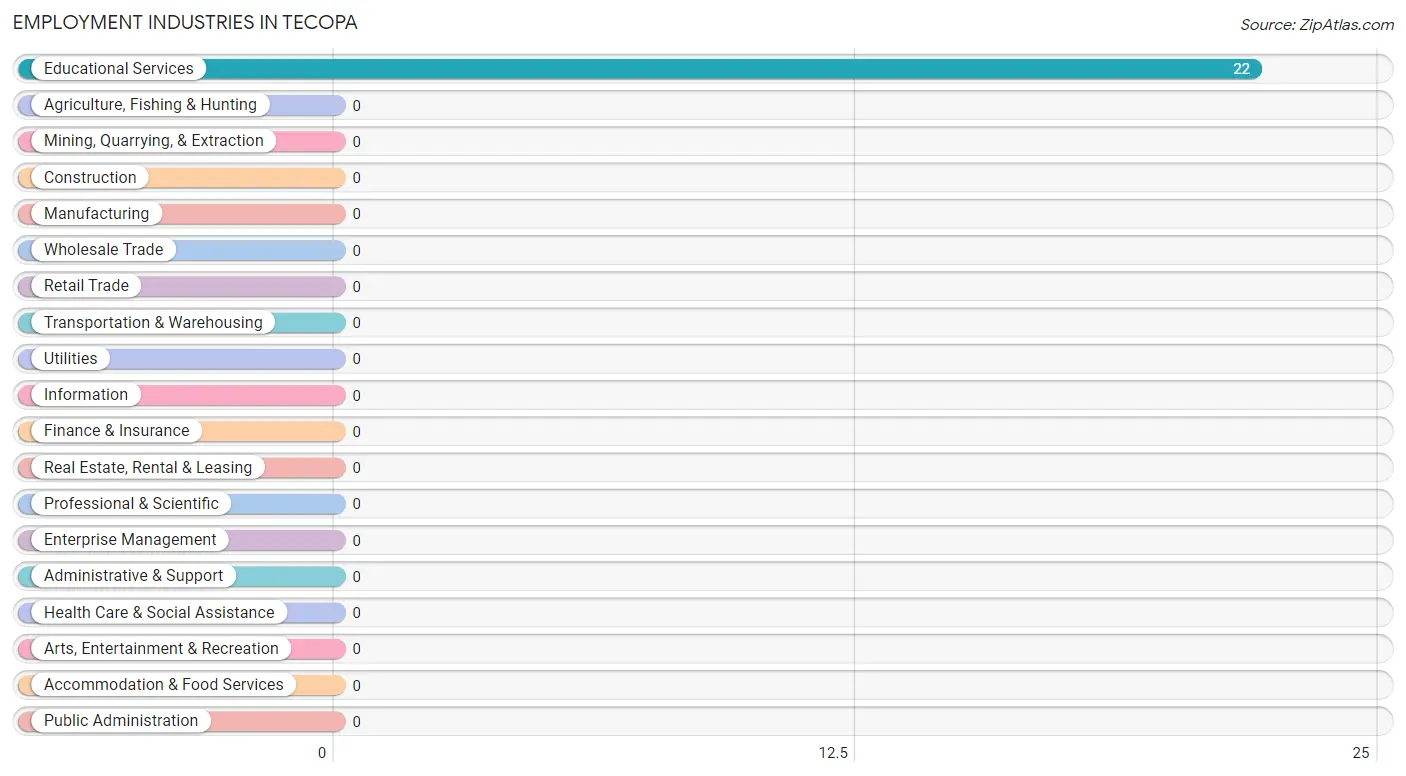
Employment Industries by Sex in Tecopa
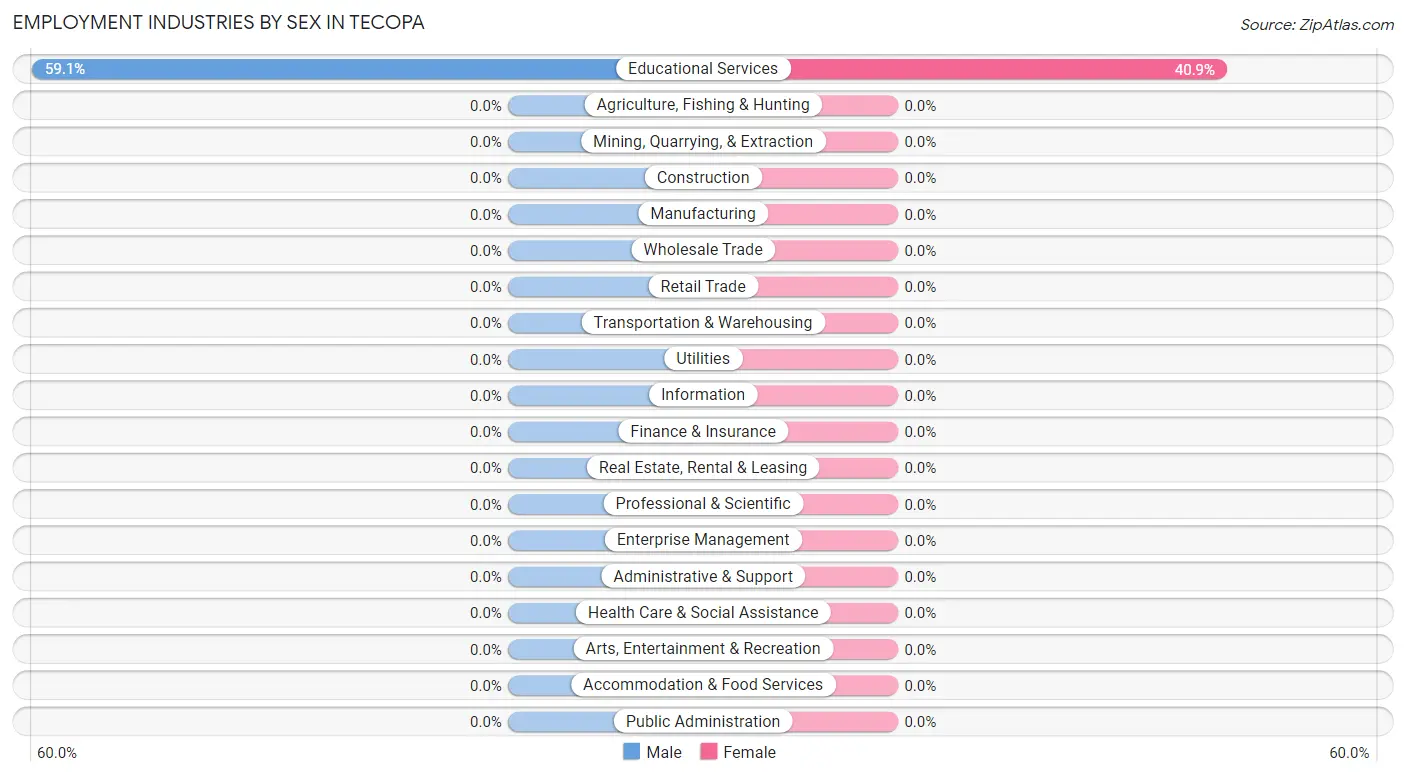
| Industry | Male | Female |
| Agriculture, Fishing & Hunting | 0 (0.0%) | 0 (0.0%) |
| Mining, Quarrying, & Extraction | 0 (0.0%) | 0 (0.0%) |
| Construction | 0 (0.0%) | 0 (0.0%) |
| Manufacturing | 0 (0.0%) | 0 (0.0%) |
| Wholesale Trade | 0 (0.0%) | 0 (0.0%) |
| Retail Trade | 0 (0.0%) | 0 (0.0%) |
| Transportation & Warehousing | 0 (0.0%) | 0 (0.0%) |
| Utilities | 0 (0.0%) | 0 (0.0%) |
| Information | 0 (0.0%) | 0 (0.0%) |
| Finance & Insurance | 0 (0.0%) | 0 (0.0%) |
| Real Estate, Rental & Leasing | 0 (0.0%) | 0 (0.0%) |
| Professional & Scientific | 0 (0.0%) | 0 (0.0%) |
| Enterprise Management | 0 (0.0%) | 0 (0.0%) |
| Administrative & Support | 0 (0.0%) | 0 (0.0%) |
| Educational Services | 13 (59.1%) | 9 (40.9%) |
| Health Care & Social Assistance | 0 (0.0%) | 0 (0.0%) |
| Arts, Entertainment & Recreation | 0 (0.0%) | 0 (0.0%) |
| Accommodation & Food Services | 0 (0.0%) | 0 (0.0%) |
| Public Administration | 0 (0.0%) | 0 (0.0%) |
| Total | 13 (59.1%) | 9 (40.9%) |
Education in Tecopa
School Enrollment in Tecopa
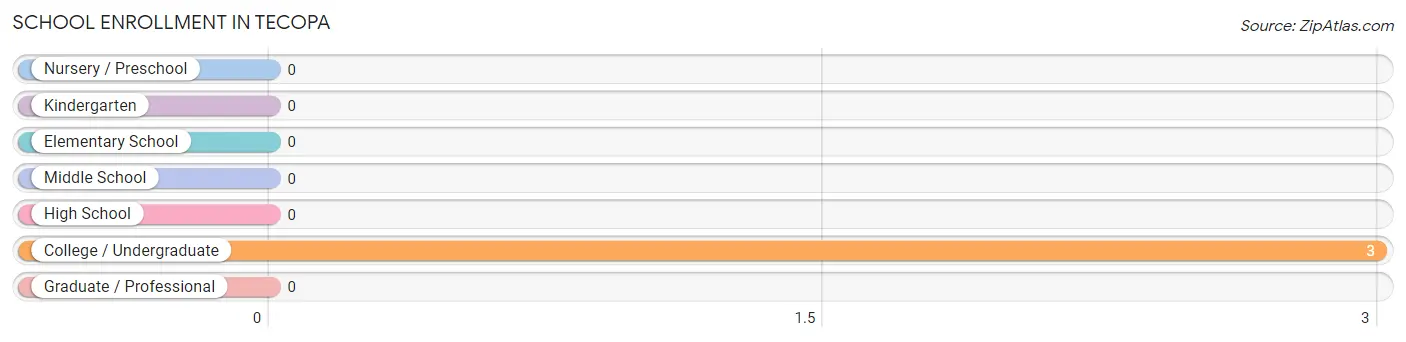
| School Level | # Students | % Students |
| Nursery / Preschool | 0 | 0.0% |
| Kindergarten | 0 | 0.0% |
| Elementary School | 0 | 0.0% |
| Middle School | 0 | 0.0% |
| High School | 0 | 0.0% |
| College / Undergraduate | 3 | 100.0% |
| Graduate / Professional | 0 | 0.0% |
| Total | 3 | 100.0% |
School Enrollment by Age by Funding Source in Tecopa
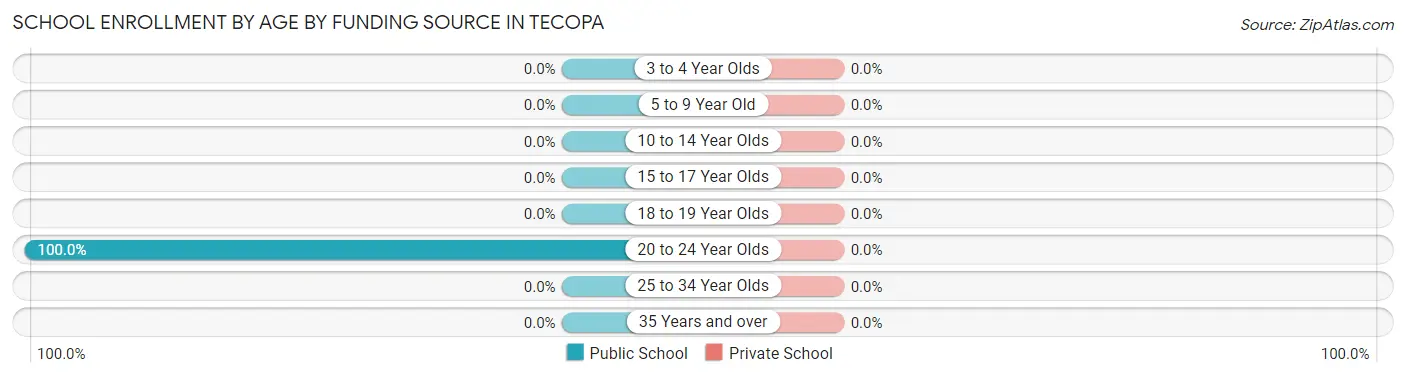
| Age Bracket | Public School | Private School |
| 3 to 4 Year Olds | 0 (0.0%) | 0 (0.0%) |
| 5 to 9 Year Old | 0 (0.0%) | 0 (0.0%) |
| 10 to 14 Year Olds | 0 (0.0%) | 0 (0.0%) |
| 15 to 17 Year Olds | 0 (0.0%) | 0 (0.0%) |
| 18 to 19 Year Olds | 0 (0.0%) | 0 (0.0%) |
| 20 to 24 Year Olds | 3 (100.0%) | 0 (0.0%) |
| 25 to 34 Year Olds | 0 (0.0%) | 0 (0.0%) |
| 35 Years and over | 0 (0.0%) | 0 (0.0%) |
| Total | 3 (100.0%) | 0 (0.0%) |
Educational Attainment by Field of Study in Tecopa
Science & technology (8 | 42.1%), education (7 | 36.8%), and social sciences (4 | 21.0%) are the most common fields of study among 19 individuals in Tecopa who have obtained a bachelor's degree or higher.
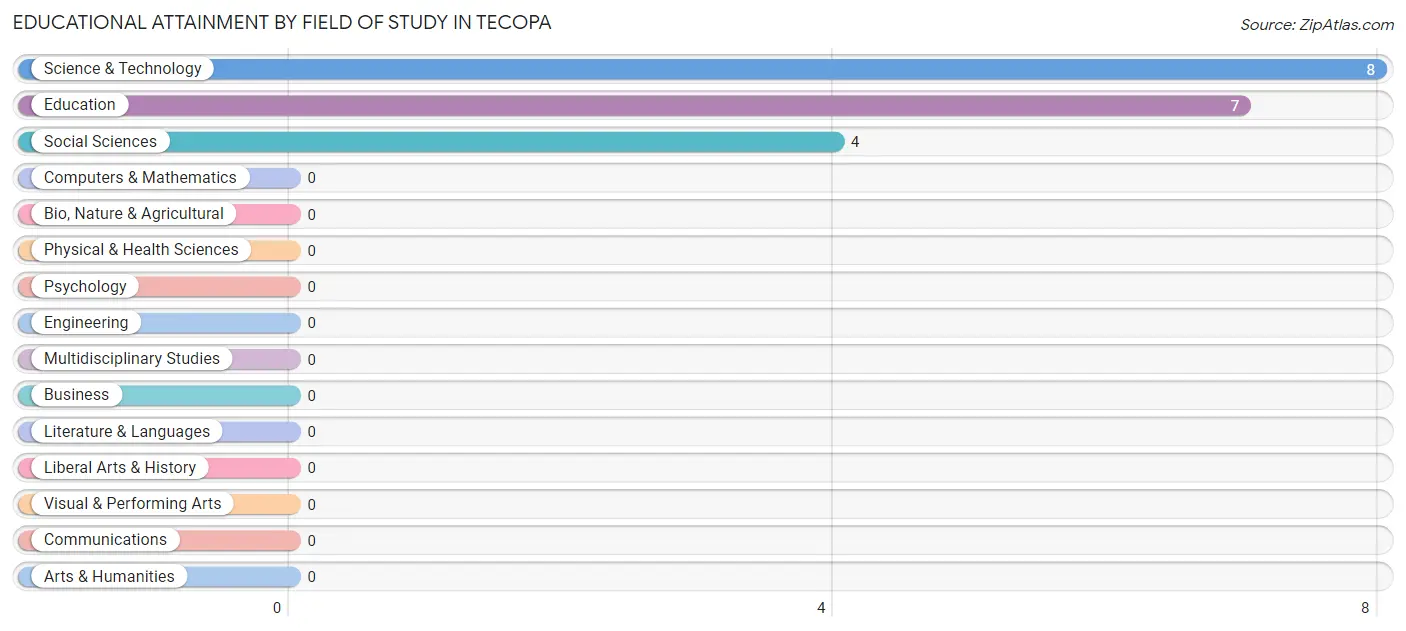
| Field of Study | # Graduates | % Graduates |
| Computers & Mathematics | 0 | 0.0% |
| Bio, Nature & Agricultural | 0 | 0.0% |
| Physical & Health Sciences | 0 | 0.0% |
| Psychology | 0 | 0.0% |
| Social Sciences | 4 | 21.0% |
| Engineering | 0 | 0.0% |
| Multidisciplinary Studies | 0 | 0.0% |
| Science & Technology | 8 | 42.1% |
| Business | 0 | 0.0% |
| Education | 7 | 36.8% |
| Literature & Languages | 0 | 0.0% |
| Liberal Arts & History | 0 | 0.0% |
| Visual & Performing Arts | 0 | 0.0% |
| Communications | 0 | 0.0% |
| Arts & Humanities | 0 | 0.0% |
| Total | 19 | 100.0% |
Transportation & Commute in Tecopa
Vehicle Availability by Sex in Tecopa
The most prevalent vehicle ownership categories in Tecopa are males with 2 vehicles (8, accounting for 61.5%) and females with 2 vehicles (9, making up 88.9%).
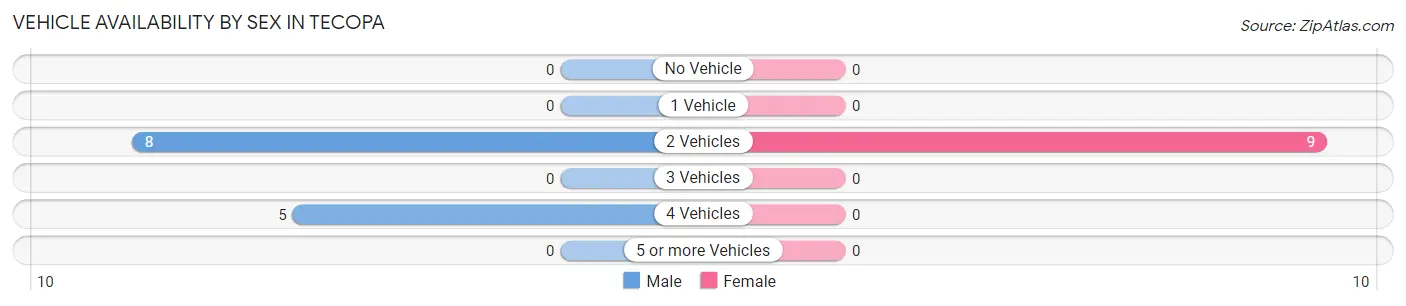
| Vehicles Available | Male | Female |
| No Vehicle | 0 (0.0%) | 0 (0.0%) |
| 1 Vehicle | 0 (0.0%) | 0 (0.0%) |
| 2 Vehicles | 8 (61.5%) | 9 (100.0%) |
| 3 Vehicles | 0 (0.0%) | 0 (0.0%) |
| 4 Vehicles | 5 (38.5%) | 0 (0.0%) |
| 5 or more Vehicles | 0 (0.0%) | 0 (0.0%) |
| Total | 13 (100.0%) | 9 (100.0%) |
Commute Time in Tecopa
The most frequently occuring commute durations in Tecopa are 20 to 24 minutes (22 commuters, 100.0%), less than 5 minutes (0 commuters, 0.0%), and 5 to 9 minutes (0 commuters, 0.0%).
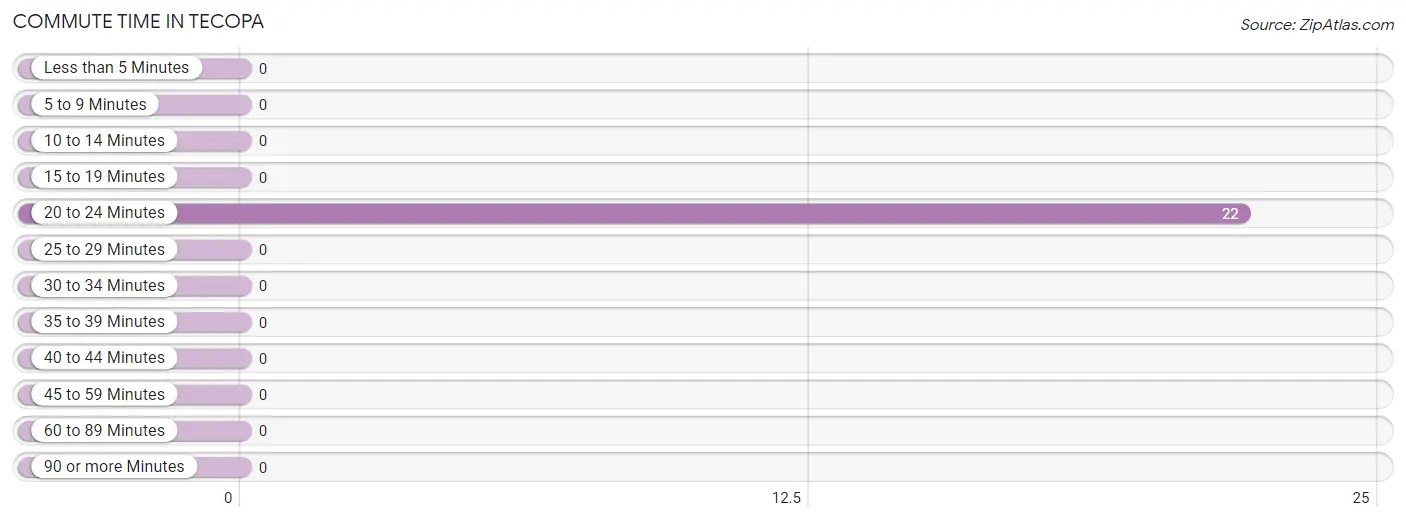
| Commute Time | # Commuters | % Commuters |
| Less than 5 Minutes | 0 | 0.0% |
| 5 to 9 Minutes | 0 | 0.0% |
| 10 to 14 Minutes | 0 | 0.0% |
| 15 to 19 Minutes | 0 | 0.0% |
| 20 to 24 Minutes | 22 | 100.0% |
| 25 to 29 Minutes | 0 | 0.0% |
| 30 to 34 Minutes | 0 | 0.0% |
| 35 to 39 Minutes | 0 | 0.0% |
| 40 to 44 Minutes | 0 | 0.0% |
| 45 to 59 Minutes | 0 | 0.0% |
| 60 to 89 Minutes | 0 | 0.0% |
| 90 or more Minutes | 0 | 0.0% |
Commute Time by Sex in Tecopa
The most common commute times in Tecopa are 20 to 24 minutes (13 commuters, 100.0%) for males and 20 to 24 minutes (9 commuters, 100.0%) for females.
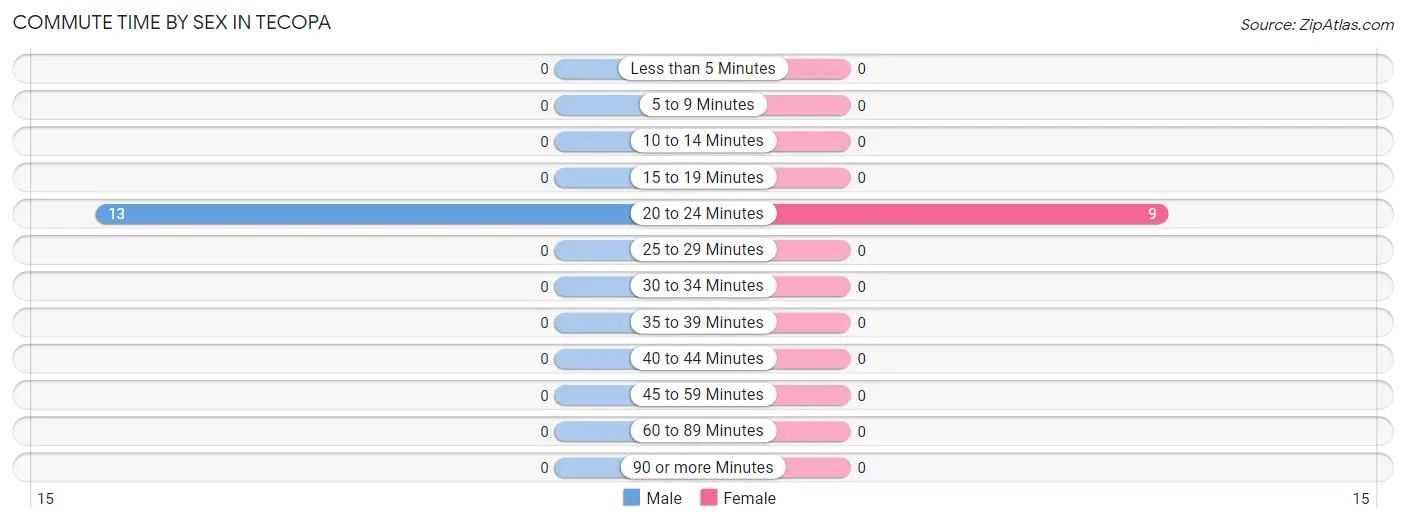
| Commute Time | Male | Female |
| Less than 5 Minutes | 0 (0.0%) | 0 (0.0%) |
| 5 to 9 Minutes | 0 (0.0%) | 0 (0.0%) |
| 10 to 14 Minutes | 0 (0.0%) | 0 (0.0%) |
| 15 to 19 Minutes | 0 (0.0%) | 0 (0.0%) |
| 20 to 24 Minutes | 13 (100.0%) | 9 (100.0%) |
| 25 to 29 Minutes | 0 (0.0%) | 0 (0.0%) |
| 30 to 34 Minutes | 0 (0.0%) | 0 (0.0%) |
| 35 to 39 Minutes | 0 (0.0%) | 0 (0.0%) |
| 40 to 44 Minutes | 0 (0.0%) | 0 (0.0%) |
| 45 to 59 Minutes | 0 (0.0%) | 0 (0.0%) |
| 60 to 89 Minutes | 0 (0.0%) | 0 (0.0%) |
| 90 or more Minutes | 0 (0.0%) | 0 (0.0%) |
Time of Departure to Work by Sex in Tecopa
The most frequent times of departure to work in Tecopa are 5:30 AM to 5:59 AM (8, 61.5%) for males and 7:00 AM to 7:29 AM (9, 100.0%) for females.
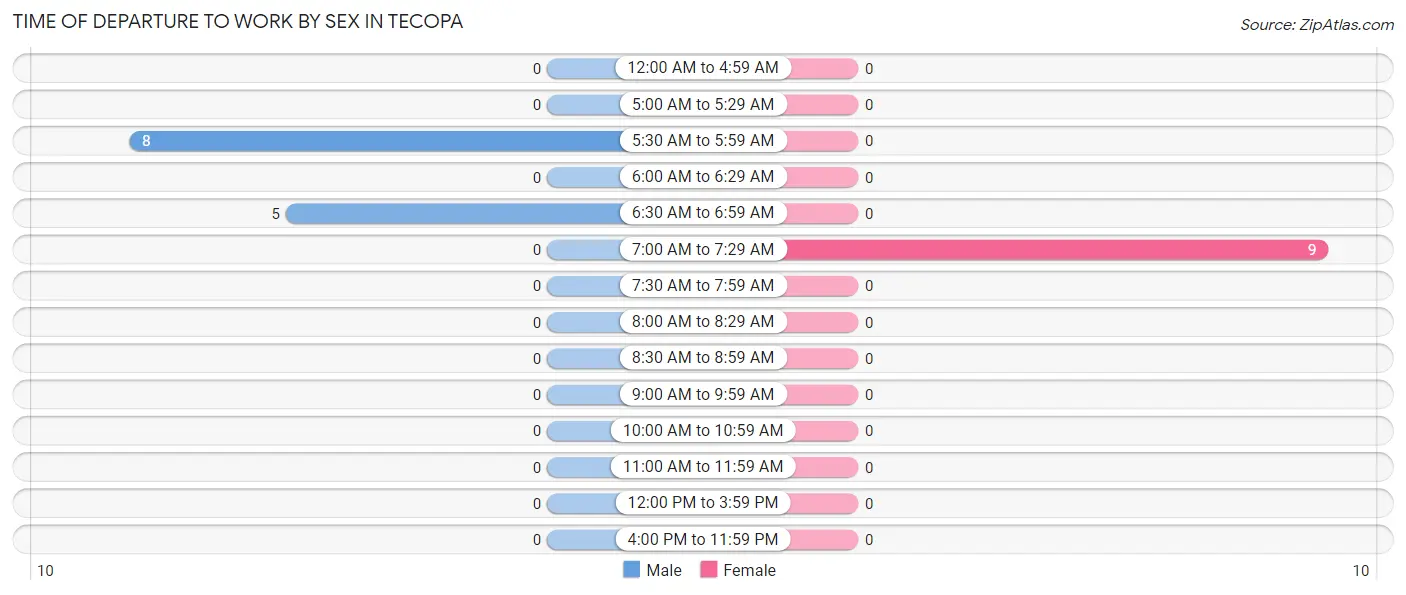
| Time of Departure | Male | Female |
| 12:00 AM to 4:59 AM | 0 (0.0%) | 0 (0.0%) |
| 5:00 AM to 5:29 AM | 0 (0.0%) | 0 (0.0%) |
| 5:30 AM to 5:59 AM | 8 (61.5%) | 0 (0.0%) |
| 6:00 AM to 6:29 AM | 0 (0.0%) | 0 (0.0%) |
| 6:30 AM to 6:59 AM | 5 (38.5%) | 0 (0.0%) |
| 7:00 AM to 7:29 AM | 0 (0.0%) | 9 (100.0%) |
| 7:30 AM to 7:59 AM | 0 (0.0%) | 0 (0.0%) |
| 8:00 AM to 8:29 AM | 0 (0.0%) | 0 (0.0%) |
| 8:30 AM to 8:59 AM | 0 (0.0%) | 0 (0.0%) |
| 9:00 AM to 9:59 AM | 0 (0.0%) | 0 (0.0%) |
| 10:00 AM to 10:59 AM | 0 (0.0%) | 0 (0.0%) |
| 11:00 AM to 11:59 AM | 0 (0.0%) | 0 (0.0%) |
| 12:00 PM to 3:59 PM | 0 (0.0%) | 0 (0.0%) |
| 4:00 PM to 11:59 PM | 0 (0.0%) | 0 (0.0%) |
| Total | 13 (100.0%) | 9 (100.0%) |
Housing Occupancy in Tecopa
Occupancy by Ownership in Tecopa
Of the total 111 dwellings in Tecopa, owner-occupied units account for 94 (84.7%), while renter-occupied units make up 17 (15.3%).
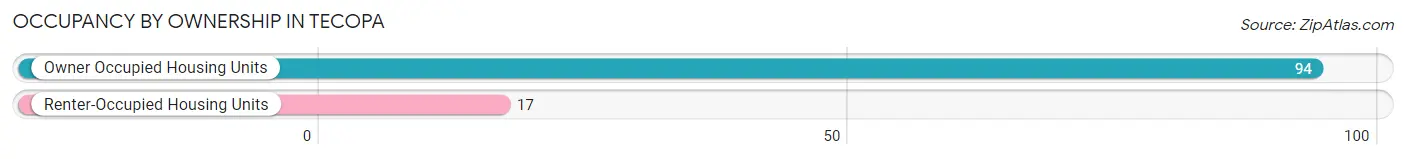
| Occupancy | # Housing Units | % Housing Units |
| Owner Occupied Housing Units | 94 | 84.7% |
| Renter-Occupied Housing Units | 17 | 15.3% |
| Total Occupied Housing Units | 111 | 100.0% |
Occupancy by Household Size in Tecopa
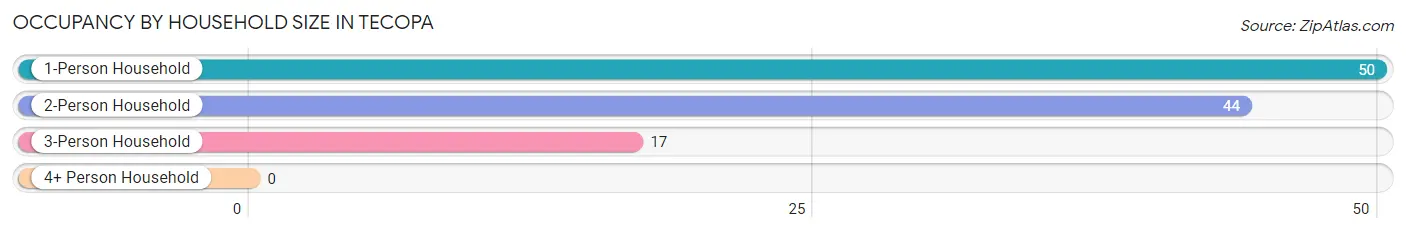
| Household Size | # Housing Units | % Housing Units |
| 1-Person Household | 50 | 45.1% |
| 2-Person Household | 44 | 39.6% |
| 3-Person Household | 17 | 15.3% |
| 4+ Person Household | 0 | 0.0% |
| Total Housing Units | 111 | 100.0% |
Occupancy by Ownership by Household Size in Tecopa
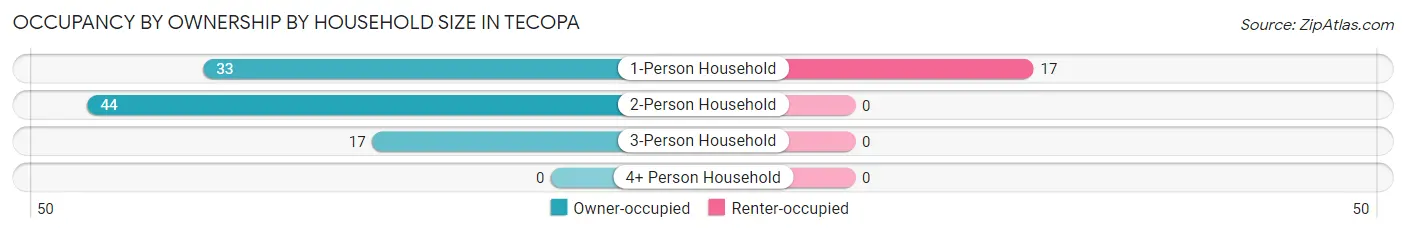
| Household Size | Owner-occupied | Renter-occupied |
| 1-Person Household | 33 (66.0%) | 17 (34.0%) |
| 2-Person Household | 44 (100.0%) | 0 (0.0%) |
| 3-Person Household | 17 (100.0%) | 0 (0.0%) |
| 4+ Person Household | 0 (0.0%) | 0 (0.0%) |
| Total Housing Units | 94 (84.7%) | 17 (15.3%) |
Occupancy by Educational Attainment in Tecopa
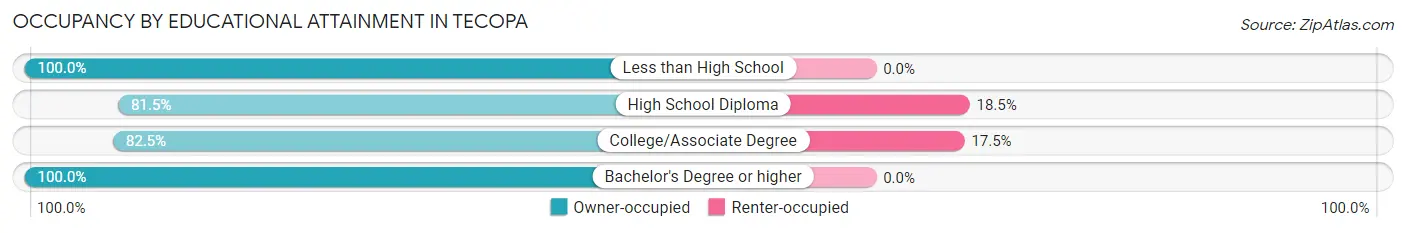
| Household Size | Owner-occupied | Renter-occupied |
| Less than High School | 10 (100.0%) | 0 (0.0%) |
| High School Diploma | 44 (81.5%) | 10 (18.5%) |
| College/Associate Degree | 33 (82.5%) | 7 (17.5%) |
| Bachelor's Degree or higher | 7 (100.0%) | 0 (0.0%) |
Occupancy by Age of Householder in Tecopa
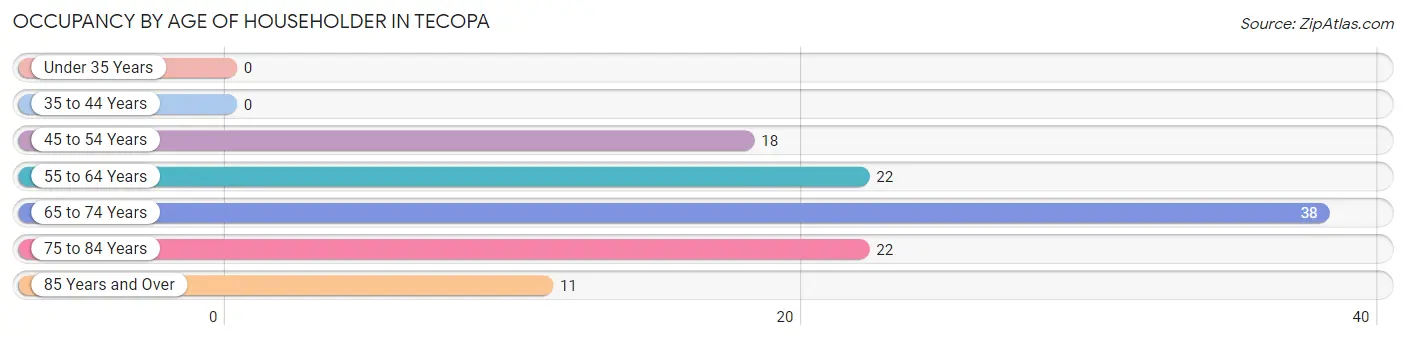
| Age Bracket | # Households | % Households |
| Under 35 Years | 0 | 0.0% |
| 35 to 44 Years | 0 | 0.0% |
| 45 to 54 Years | 18 | 16.2% |
| 55 to 64 Years | 22 | 19.8% |
| 65 to 74 Years | 38 | 34.2% |
| 75 to 84 Years | 22 | 19.8% |
| 85 Years and Over | 11 | 9.9% |
| Total | 111 | 100.0% |
Housing Finances in Tecopa
Median Income by Occupancy in Tecopa
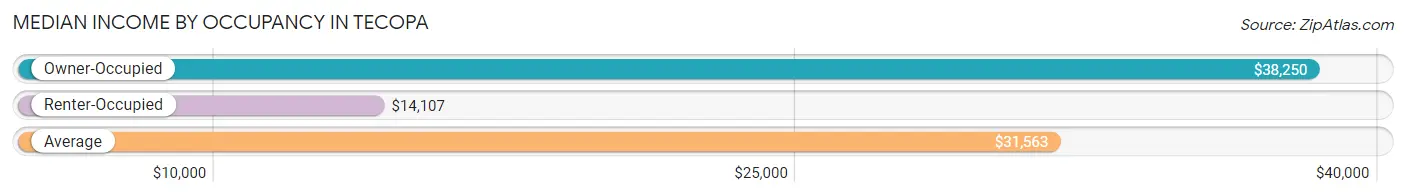
| Occupancy Type | # Households | Median Income |
| Owner-Occupied | 94 (84.7%) | $38,250 |
| Renter-Occupied | 17 (15.3%) | $14,107 |
| Average | 111 (100.0%) | $31,563 |
Occupancy by Householder Income Bracket in Tecopa
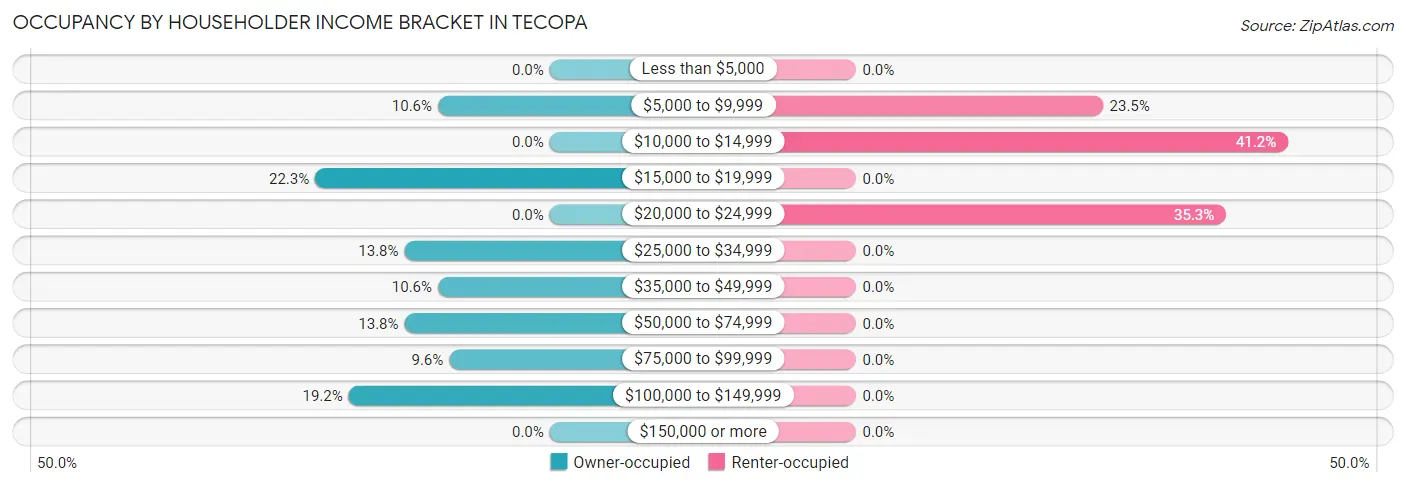
| Income Bracket | Owner-occupied | Renter-occupied |
| Less than $5,000 | 0 (0.0%) | 0 (0.0%) |
| $5,000 to $9,999 | 10 (10.6%) | 4 (23.5%) |
| $10,000 to $14,999 | 0 (0.0%) | 7 (41.2%) |
| $15,000 to $19,999 | 21 (22.3%) | 0 (0.0%) |
| $20,000 to $24,999 | 0 (0.0%) | 6 (35.3%) |
| $25,000 to $34,999 | 13 (13.8%) | 0 (0.0%) |
| $35,000 to $49,999 | 10 (10.6%) | 0 (0.0%) |
| $50,000 to $74,999 | 13 (13.8%) | 0 (0.0%) |
| $75,000 to $99,999 | 9 (9.6%) | 0 (0.0%) |
| $100,000 to $149,999 | 18 (19.2%) | 0 (0.0%) |
| $150,000 or more | 0 (0.0%) | 0 (0.0%) |
| Total | 94 (100.0%) | 17 (100.0%) |
Monthly Housing Cost Tiers in Tecopa
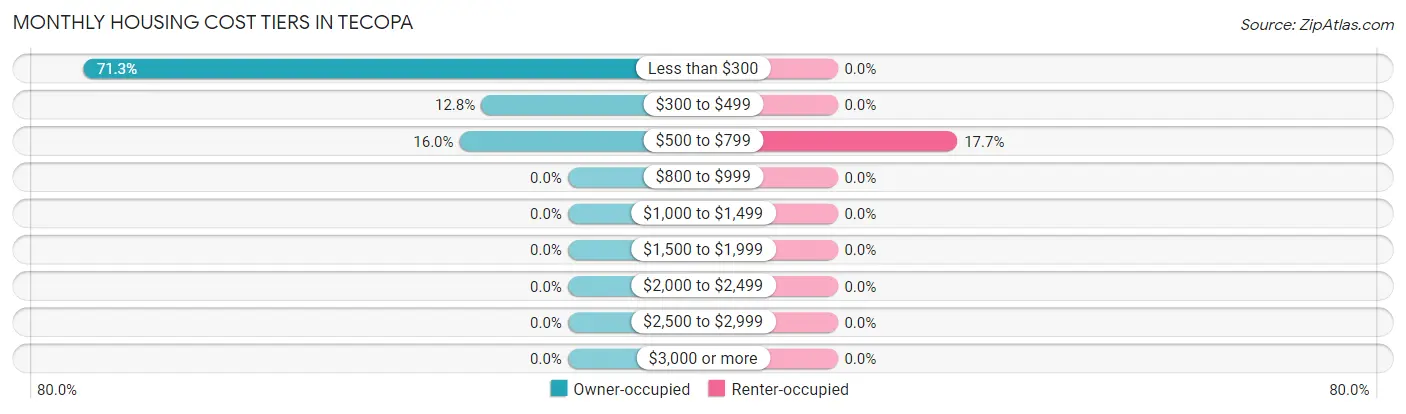
| Monthly Cost | Owner-occupied | Renter-occupied |
| Less than $300 | 67 (71.3%) | 0 (0.0%) |
| $300 to $499 | 12 (12.8%) | 0 (0.0%) |
| $500 to $799 | 15 (16.0%) | 3 (17.6%) |
| $800 to $999 | 0 (0.0%) | 0 (0.0%) |
| $1,000 to $1,499 | 0 (0.0%) | 0 (0.0%) |
| $1,500 to $1,999 | 0 (0.0%) | 0 (0.0%) |
| $2,000 to $2,499 | 0 (0.0%) | 0 (0.0%) |
| $2,500 to $2,999 | 0 (0.0%) | 0 (0.0%) |
| $3,000 or more | 0 (0.0%) | 0 (0.0%) |
| Total | 94 (100.0%) | 17 (100.0%) |
Physical Housing Characteristics in Tecopa
Housing Structures in Tecopa
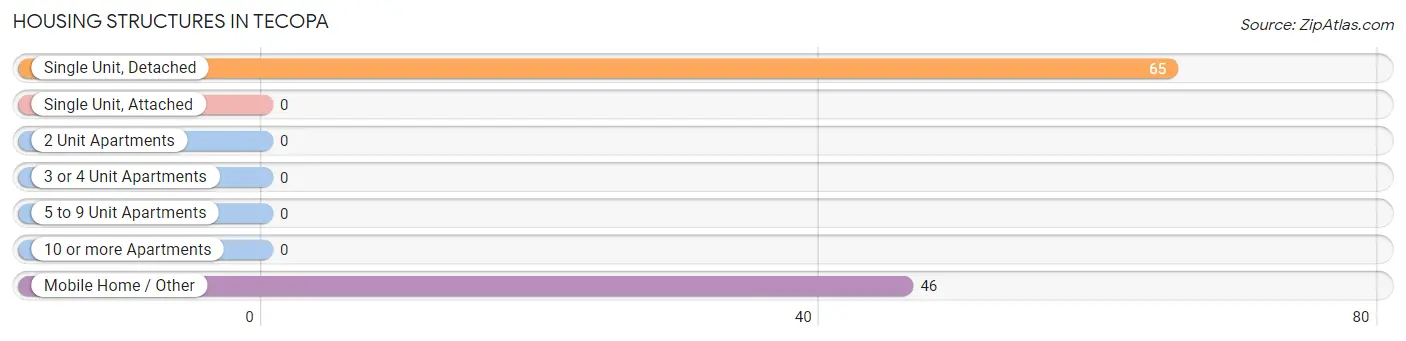
| Structure Type | # Housing Units | % Housing Units |
| Single Unit, Detached | 65 | 58.6% |
| Single Unit, Attached | 0 | 0.0% |
| 2 Unit Apartments | 0 | 0.0% |
| 3 or 4 Unit Apartments | 0 | 0.0% |
| 5 to 9 Unit Apartments | 0 | 0.0% |
| 10 or more Apartments | 0 | 0.0% |
| Mobile Home / Other | 46 | 41.4% |
| Total | 111 | 100.0% |
Housing Structures by Occupancy in Tecopa
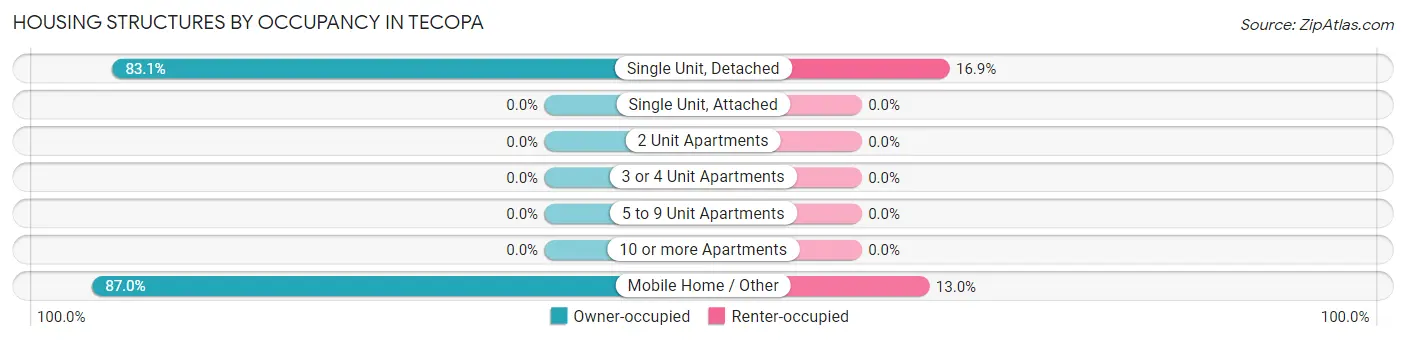
| Structure Type | Owner-occupied | Renter-occupied |
| Single Unit, Detached | 54 (83.1%) | 11 (16.9%) |
| Single Unit, Attached | 0 (0.0%) | 0 (0.0%) |
| 2 Unit Apartments | 0 (0.0%) | 0 (0.0%) |
| 3 or 4 Unit Apartments | 0 (0.0%) | 0 (0.0%) |
| 5 to 9 Unit Apartments | 0 (0.0%) | 0 (0.0%) |
| 10 or more Apartments | 0 (0.0%) | 0 (0.0%) |
| Mobile Home / Other | 40 (87.0%) | 6 (13.0%) |
| Total | 94 (84.7%) | 17 (15.3%) |
Housing Structures by Number of Rooms in Tecopa
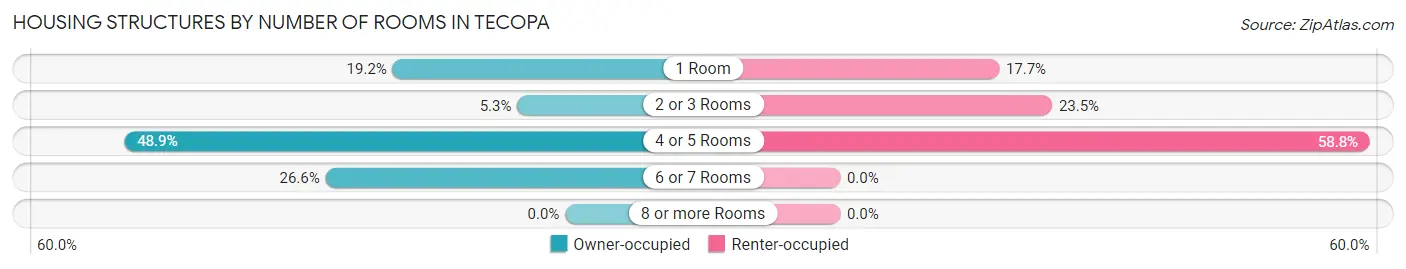
| Number of Rooms | Owner-occupied | Renter-occupied |
| 1 Room | 18 (19.2%) | 3 (17.6%) |
| 2 or 3 Rooms | 5 (5.3%) | 4 (23.5%) |
| 4 or 5 Rooms | 46 (48.9%) | 10 (58.8%) |
| 6 or 7 Rooms | 25 (26.6%) | 0 (0.0%) |
| 8 or more Rooms | 0 (0.0%) | 0 (0.0%) |
| Total | 94 (100.0%) | 17 (100.0%) |
Housing Structure by Heating Type in Tecopa
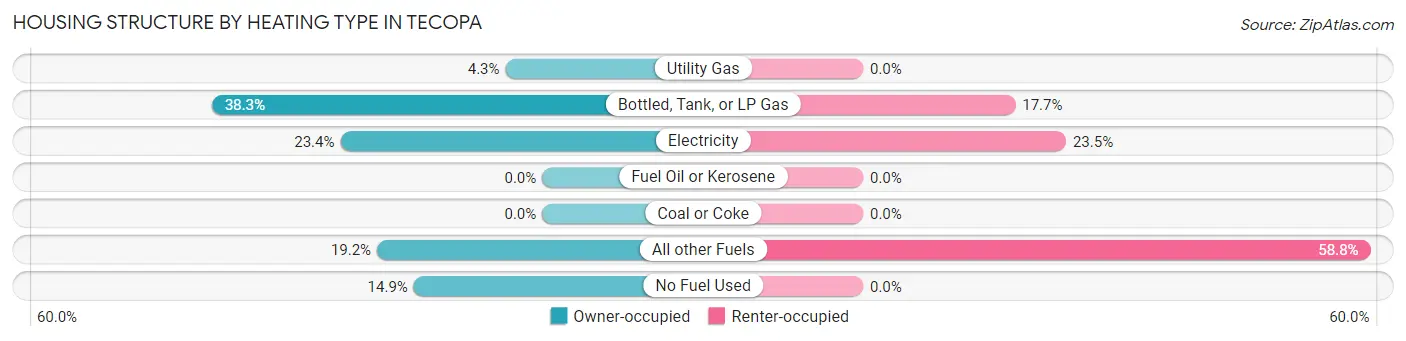
| Heating Type | Owner-occupied | Renter-occupied |
| Utility Gas | 4 (4.3%) | 0 (0.0%) |
| Bottled, Tank, or LP Gas | 36 (38.3%) | 3 (17.6%) |
| Electricity | 22 (23.4%) | 4 (23.5%) |
| Fuel Oil or Kerosene | 0 (0.0%) | 0 (0.0%) |
| Coal or Coke | 0 (0.0%) | 0 (0.0%) |
| All other Fuels | 18 (19.2%) | 10 (58.8%) |
| No Fuel Used | 14 (14.9%) | 0 (0.0%) |
| Total | 94 (100.0%) | 17 (100.0%) |
Household Vehicle Usage in Tecopa
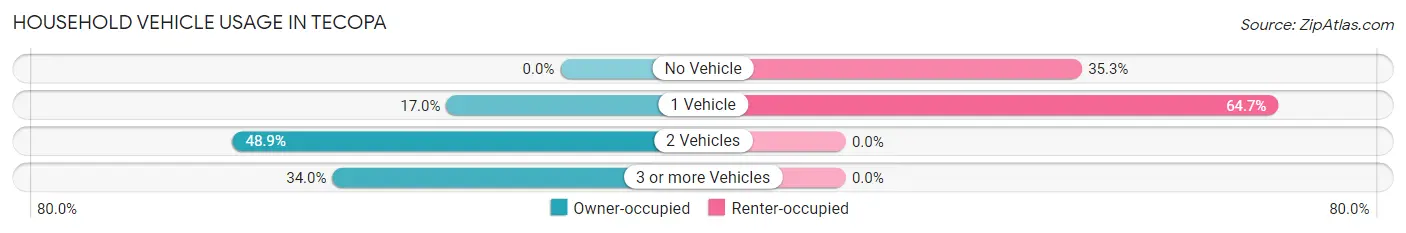
| Vehicles per Household | Owner-occupied | Renter-occupied |
| No Vehicle | 0 (0.0%) | 6 (35.3%) |
| 1 Vehicle | 16 (17.0%) | 11 (64.7%) |
| 2 Vehicles | 46 (48.9%) | 0 (0.0%) |
| 3 or more Vehicles | 32 (34.0%) | 0 (0.0%) |
| Total | 94 (100.0%) | 17 (100.0%) |
Real Estate & Mortgages in Tecopa
Real Estate and Mortgage Overview in Tecopa
| Characteristic | Without Mortgage | With Mortgage |
| Housing Units | 91 | 3 |
| Median Property Value | - | - |
| Median Household Income | $38,625 | $0 |
| Monthly Housing Costs | $168 | $0 |
| Real Estate Taxes | $377 | $0 |
Property Value by Mortgage Status in Tecopa
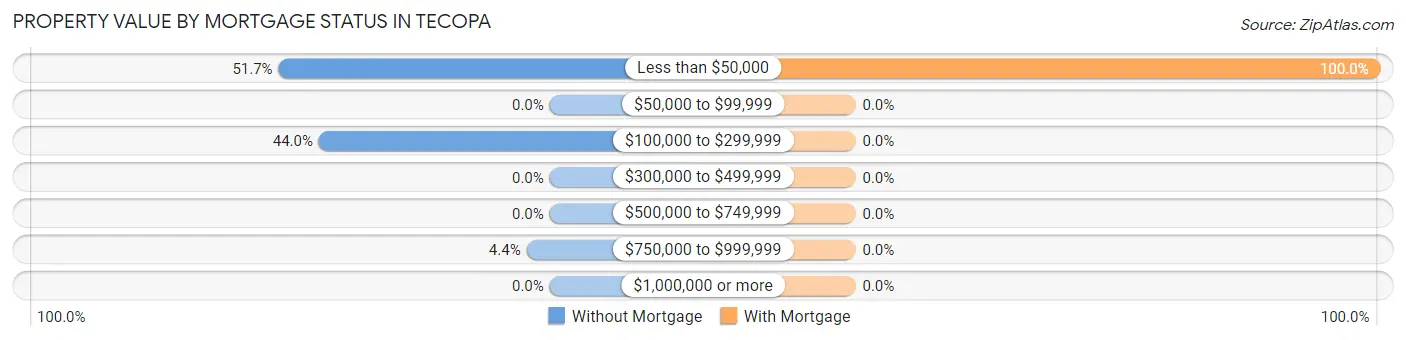
| Property Value | Without Mortgage | With Mortgage |
| Less than $50,000 | 47 (51.6%) | 3 (100.0%) |
| $50,000 to $99,999 | 0 (0.0%) | 0 (0.0%) |
| $100,000 to $299,999 | 40 (44.0%) | 0 (0.0%) |
| $300,000 to $499,999 | 0 (0.0%) | 0 (0.0%) |
| $500,000 to $749,999 | 0 (0.0%) | 0 (0.0%) |
| $750,000 to $999,999 | 4 (4.4%) | 0 (0.0%) |
| $1,000,000 or more | 0 (0.0%) | 0 (0.0%) |
| Total | 91 (100.0%) | 3 (100.0%) |
Household Income by Mortgage Status in Tecopa
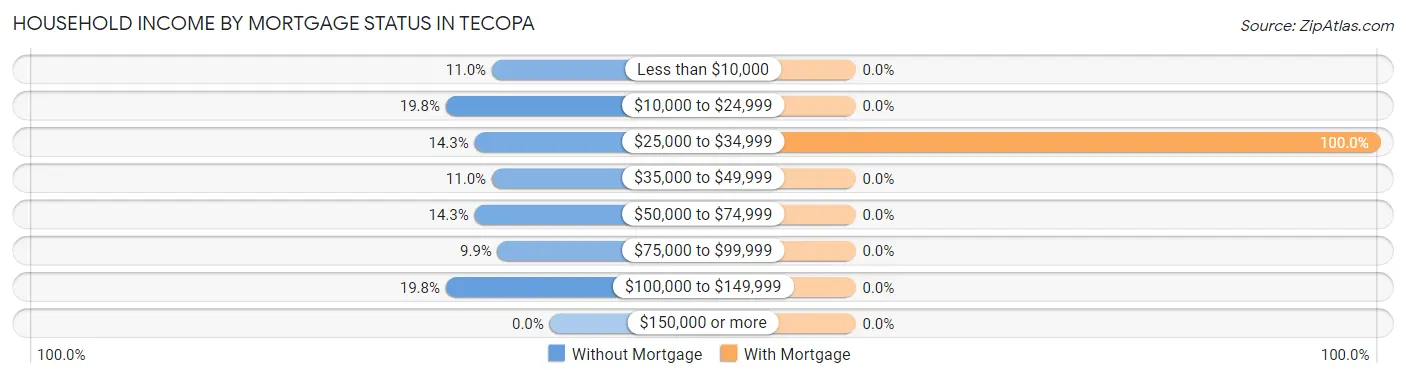
| Household Income | Without Mortgage | With Mortgage |
| Less than $10,000 | 10 (11.0%) | 0 (0.0%) |
| $10,000 to $24,999 | 18 (19.8%) | 0 (0.0%) |
| $25,000 to $34,999 | 13 (14.3%) | 3 (100.0%) |
| $35,000 to $49,999 | 10 (11.0%) | 0 (0.0%) |
| $50,000 to $74,999 | 13 (14.3%) | 0 (0.0%) |
| $75,000 to $99,999 | 9 (9.9%) | 0 (0.0%) |
| $100,000 to $149,999 | 18 (19.8%) | 0 (0.0%) |
| $150,000 or more | 0 (0.0%) | 0 (0.0%) |
| Total | 91 (100.0%) | 3 (100.0%) |
Property Value to Household Income Ratio in Tecopa
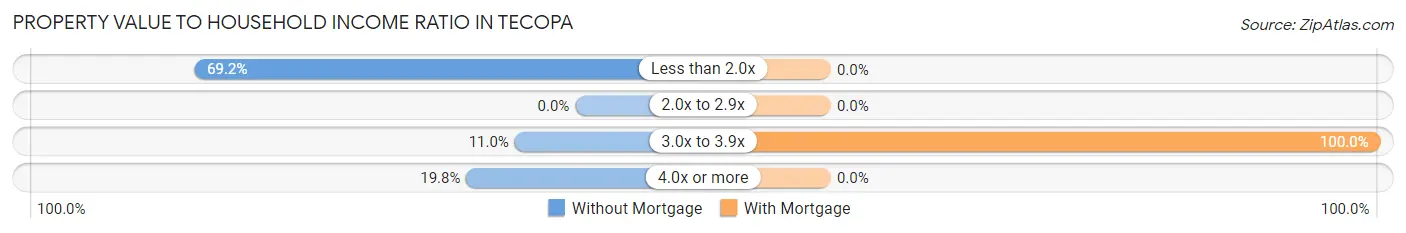
| Value-to-Income Ratio | Without Mortgage | With Mortgage |
| Less than 2.0x | 63 (69.2%) | 0 (0.0%) |
| 2.0x to 2.9x | 0 (0.0%) | 0 (0.0%) |
| 3.0x to 3.9x | 10 (11.0%) | 3 (100.0%) |
| 4.0x or more | 18 (19.8%) | 0 (0.0%) |
| Total | 91 (100.0%) | 3 (100.0%) |
Real Estate Taxes by Mortgage Status in Tecopa
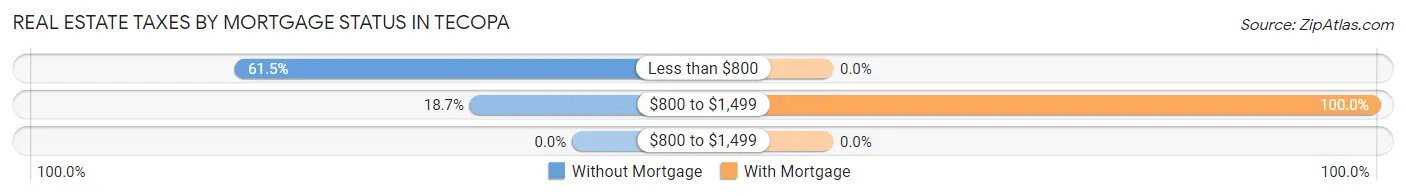
| Property Taxes | Without Mortgage | With Mortgage |
| Less than $800 | 56 (61.5%) | 0 (0.0%) |
| $800 to $1,499 | 17 (18.7%) | 3 (100.0%) |
| $800 to $1,499 | 0 (0.0%) | 0 (0.0%) |
| Total | 91 (100.0%) | 3 (100.0%) |
Health & Disability in Tecopa
Health Insurance Coverage by Age in Tecopa
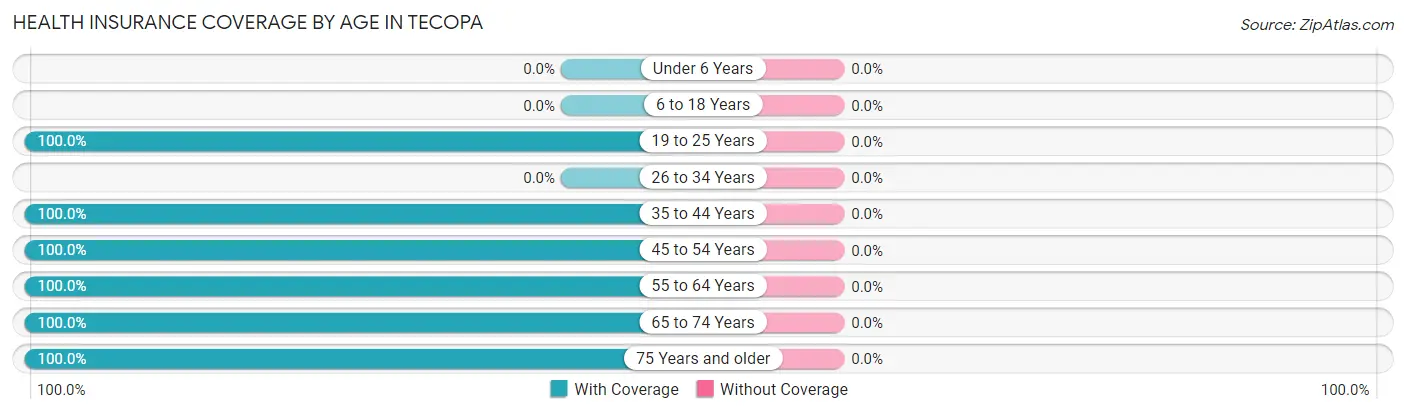
| Age Bracket | With Coverage | Without Coverage |
| Under 6 Years | 0 (0.0%) | 0 (0.0%) |
| 6 to 18 Years | 0 (0.0%) | 0 (0.0%) |
| 19 to 25 Years | 3 (100.0%) | 0 (0.0%) |
| 26 to 34 Years | 0 (0.0%) | 0 (0.0%) |
| 35 to 44 Years | 4 (100.0%) | 0 (0.0%) |
| 45 to 54 Years | 42 (100.0%) | 0 (0.0%) |
| 55 to 64 Years | 33 (100.0%) | 0 (0.0%) |
| 65 to 74 Years | 62 (100.0%) | 0 (0.0%) |
| 75 Years and older | 43 (100.0%) | 0 (0.0%) |
| Total | 187 (100.0%) | 0 (0.0%) |
Health Insurance Coverage by Citizenship Status in Tecopa
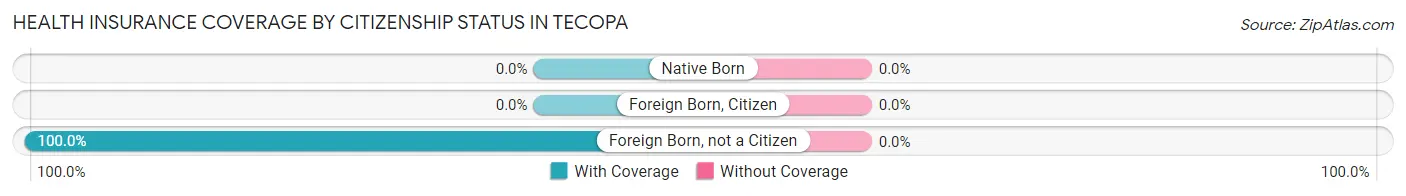
| Citizenship Status | With Coverage | Without Coverage |
| Native Born | 0 (0.0%) | 0 (0.0%) |
| Foreign Born, Citizen | 0 (0.0%) | 0 (0.0%) |
| Foreign Born, not a Citizen | 3 (100.0%) | 0 (0.0%) |
Health Insurance Coverage by Household Income in Tecopa
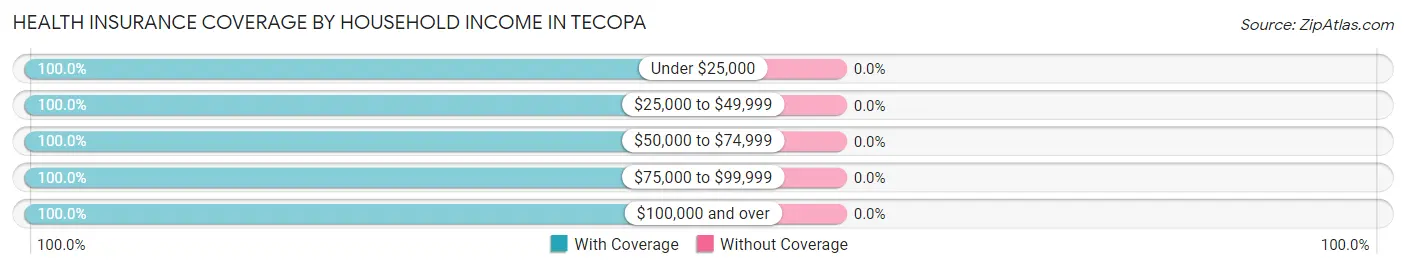
| Household Income | With Coverage | Without Coverage |
| Under $25,000 | 71 (100.0%) | 0 (0.0%) |
| $25,000 to $49,999 | 23 (100.0%) | 0 (0.0%) |
| $50,000 to $74,999 | 33 (100.0%) | 0 (0.0%) |
| $75,000 to $99,999 | 17 (100.0%) | 0 (0.0%) |
| $100,000 and over | 43 (100.0%) | 0 (0.0%) |
Public vs Private Health Insurance Coverage by Age in Tecopa
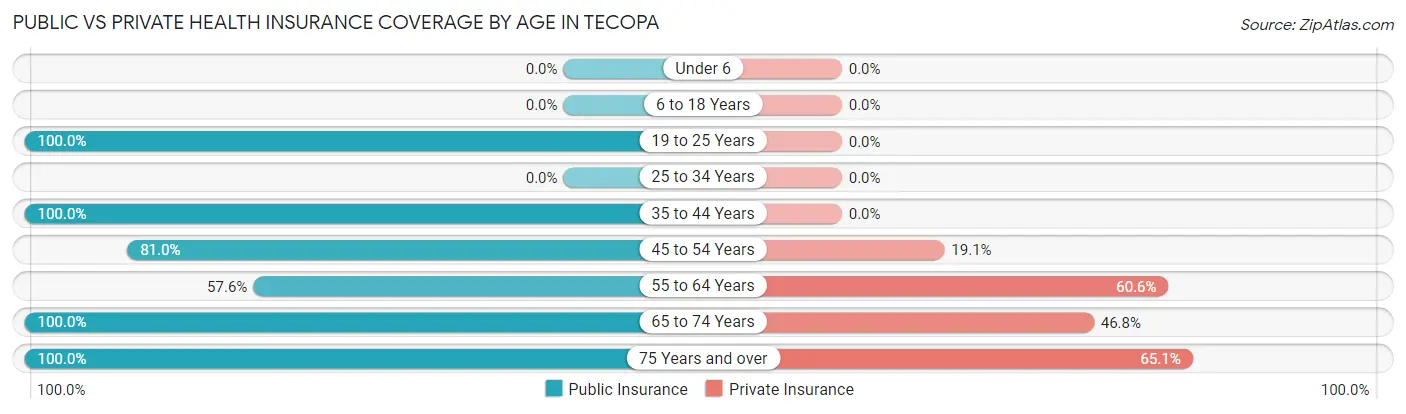
| Age Bracket | Public Insurance | Private Insurance |
| Under 6 | 0 (0.0%) | 0 (0.0%) |
| 6 to 18 Years | 0 (0.0%) | 0 (0.0%) |
| 19 to 25 Years | 3 (100.0%) | 0 (0.0%) |
| 25 to 34 Years | 0 (0.0%) | 0 (0.0%) |
| 35 to 44 Years | 4 (100.0%) | 0 (0.0%) |
| 45 to 54 Years | 34 (80.9%) | 8 (19.1%) |
| 55 to 64 Years | 19 (57.6%) | 20 (60.6%) |
| 65 to 74 Years | 62 (100.0%) | 29 (46.8%) |
| 75 Years and over | 43 (100.0%) | 28 (65.1%) |
| Total | 165 (88.2%) | 85 (45.5%) |
Disability Status by Sex by Age in Tecopa
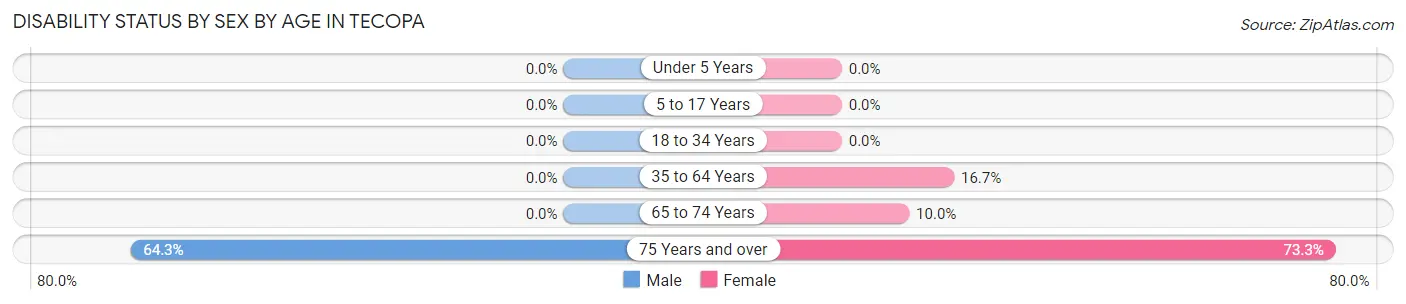
| Age Bracket | Male | Female |
| Under 5 Years | 0 (0.0%) | 0 (0.0%) |
| 5 to 17 Years | 0 (0.0%) | 0 (0.0%) |
| 18 to 34 Years | 0 (0.0%) | 0 (0.0%) |
| 35 to 64 Years | 0 (0.0%) | 6 (16.7%) |
| 65 to 74 Years | 0 (0.0%) | 3 (10.0%) |
| 75 Years and over | 18 (64.3%) | 11 (73.3%) |
Disability Class by Sex by Age in Tecopa
Disability Class: Hearing Difficulty
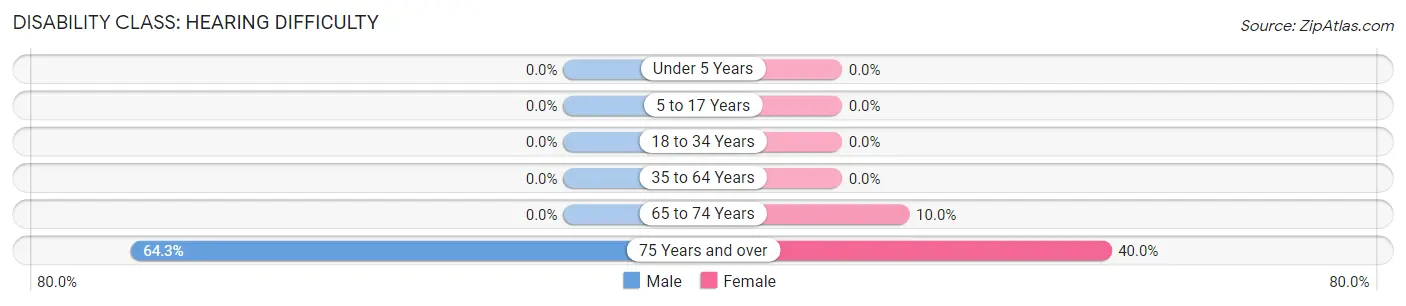
| Age Bracket | Male | Female |
| Under 5 Years | 0 (0.0%) | 0 (0.0%) |
| 5 to 17 Years | 0 (0.0%) | 0 (0.0%) |
| 18 to 34 Years | 0 (0.0%) | 0 (0.0%) |
| 35 to 64 Years | 0 (0.0%) | 0 (0.0%) |
| 65 to 74 Years | 0 (0.0%) | 3 (10.0%) |
| 75 Years and over | 18 (64.3%) | 6 (40.0%) |
Disability Class: Vision Difficulty
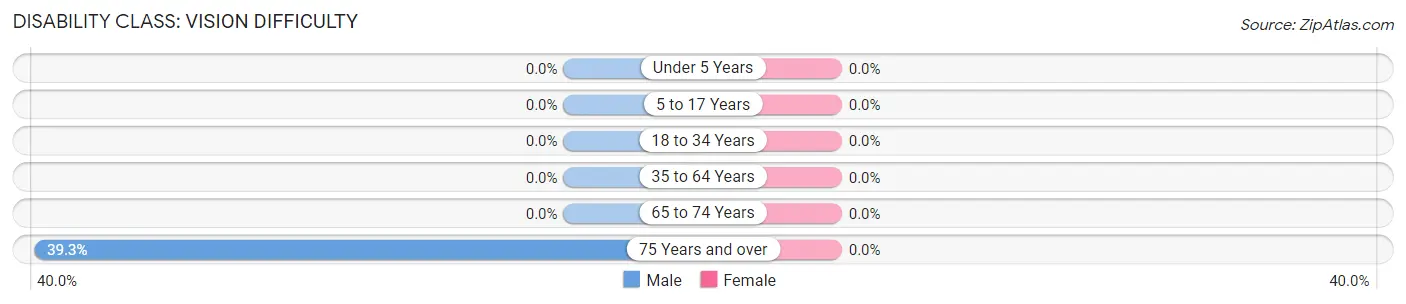
| Age Bracket | Male | Female |
| Under 5 Years | 0 (0.0%) | 0 (0.0%) |
| 5 to 17 Years | 0 (0.0%) | 0 (0.0%) |
| 18 to 34 Years | 0 (0.0%) | 0 (0.0%) |
| 35 to 64 Years | 0 (0.0%) | 0 (0.0%) |
| 65 to 74 Years | 0 (0.0%) | 0 (0.0%) |
| 75 Years and over | 11 (39.3%) | 0 (0.0%) |
Disability Class: Cognitive Difficulty
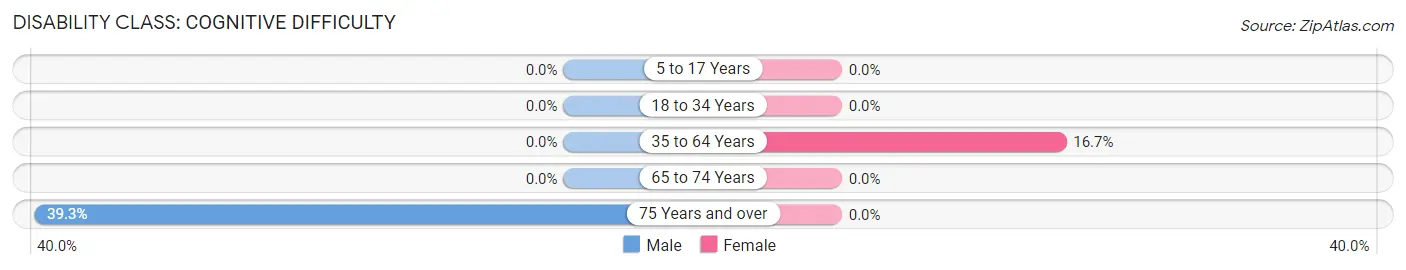
| Age Bracket | Male | Female |
| 5 to 17 Years | 0 (0.0%) | 0 (0.0%) |
| 18 to 34 Years | 0 (0.0%) | 0 (0.0%) |
| 35 to 64 Years | 0 (0.0%) | 6 (16.7%) |
| 65 to 74 Years | 0 (0.0%) | 0 (0.0%) |
| 75 Years and over | 11 (39.3%) | 0 (0.0%) |
Disability Class: Ambulatory Difficulty
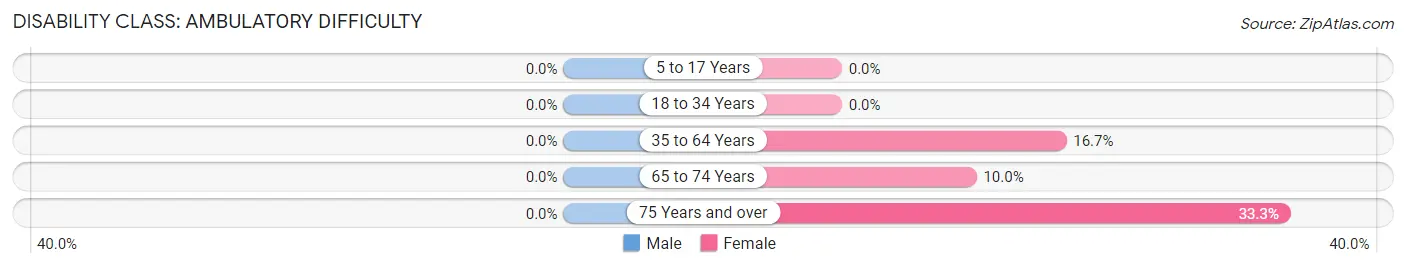
| Age Bracket | Male | Female |
| 5 to 17 Years | 0 (0.0%) | 0 (0.0%) |
| 18 to 34 Years | 0 (0.0%) | 0 (0.0%) |
| 35 to 64 Years | 0 (0.0%) | 6 (16.7%) |
| 65 to 74 Years | 0 (0.0%) | 3 (10.0%) |
| 75 Years and over | 0 (0.0%) | 5 (33.3%) |
Disability Class: Self-Care Difficulty
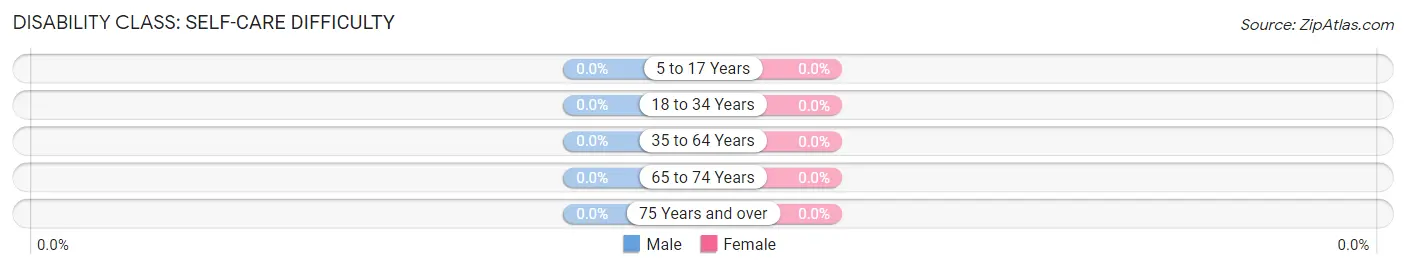
| Age Bracket | Male | Female |
| 5 to 17 Years | 0 (0.0%) | 0 (0.0%) |
| 18 to 34 Years | 0 (0.0%) | 0 (0.0%) |
| 35 to 64 Years | 0 (0.0%) | 0 (0.0%) |
| 65 to 74 Years | 0 (0.0%) | 0 (0.0%) |
| 75 Years and over | 0 (0.0%) | 0 (0.0%) |
Technology Access in Tecopa
Computing Device Access in Tecopa
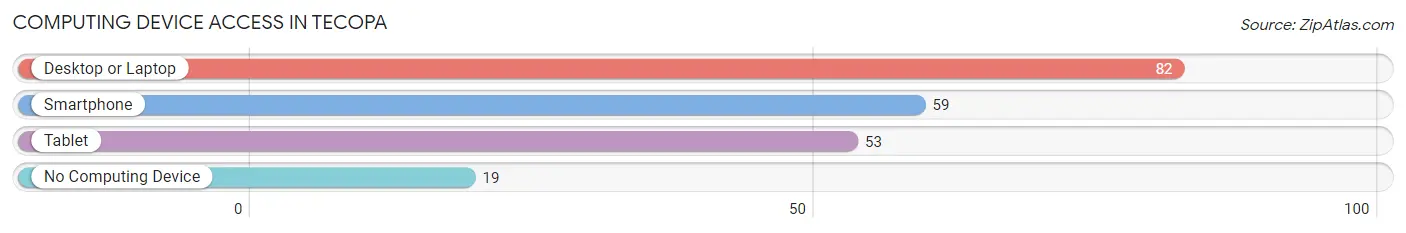
| Device Type | # Households | % Households |
| Desktop or Laptop | 82 | 73.9% |
| Smartphone | 59 | 53.1% |
| Tablet | 53 | 47.7% |
| No Computing Device | 19 | 17.1% |
| Total | 111 | 100.0% |
Internet Access in Tecopa
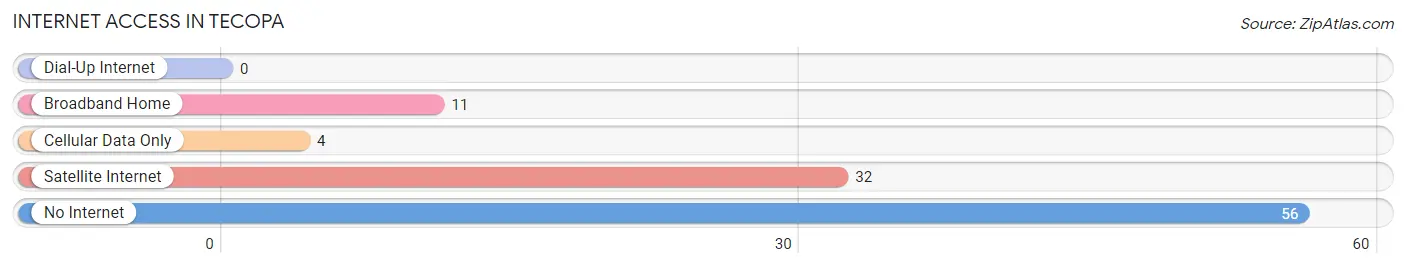
| Internet Type | # Households | % Households |
| Dial-Up Internet | 0 | 0.0% |
| Broadband Home | 11 | 9.9% |
| Cellular Data Only | 4 | 3.6% |
| Satellite Internet | 32 | 28.8% |
| No Internet | 56 | 50.4% |
| Total | 111 | 100.0% |
Tecopa Summary
Tecopa is a small unincorporated community located in Inyo County, California, United States. It is situated in the Amargosa Valley, approximately 10 miles (16 km) south of the Nevada border. The population was estimated to be around 200 in 2020.
History
Tecopa was originally inhabited by the Shoshone Indians, who called the area “Tecopa”, meaning “place of the sun”. The first non-native settlers arrived in the area in the late 1800s, and the town was officially founded in 1876. The town was named after Tecopa, a Shoshone chief who lived in the area.
In the early 1900s, Tecopa was a thriving mining town, with several mines in the area producing gold, silver, and copper. The town also had a post office, a school, and a hotel.
In the 1950s, the mining industry in Tecopa began to decline, and the town’s population began to dwindle. In the 1960s, the town was almost abandoned, but in the 1970s, it began to experience a resurgence as a tourist destination.
Geography
Tecopa is located in the Amargosa Valley, in the Mojave Desert of southeastern California. It is situated at an elevation of 1,890 feet (576 m). The town is surrounded by the Amargosa Range to the east, the Nopah Range to the west, and the Ibex Hills to the south.
The climate in Tecopa is arid and hot, with temperatures reaching over 100°F (38°C) in the summer months. The area receives very little rainfall, with an average of only 4 inches (10 cm) per year.
Economy
Tecopa’s economy is largely based on tourism. The town is home to several hot springs, which attract visitors from all over the world. The town also has several RV parks, campgrounds, and resorts.
In addition to tourism, Tecopa is also home to several small businesses, including a general store, a gas station, and a restaurant. The town also has a post office and a library.
Demographics
As of the 2010 census, the population of Tecopa was estimated to be around 200. The racial makeup of the town was 94.5% White, 0.5% African American, 0.5% Native American, 0.5% Asian, and 4% from other races.
The median household income in Tecopa was $25,000, and the median family income was $30,000. The per capita income was $14,000. The town had a poverty rate of 28.6%.
Conclusion
Tecopa is a small unincorporated community located in Inyo County, California. It was originally inhabited by the Shoshone Indians, and was later settled by non-native settlers in the late 1800s. The town was once a thriving mining town, but the industry declined in the 1950s. Today, Tecopa’s economy is largely based on tourism, and the town has a population of around 200.
Common Questions
What is Per Capita Income in Tecopa?
Per Capita income in Tecopa is $26,498.
What is the Median Household income in Tecopa?
Median Household Income in Tecopa is $31,563.
What is Inequality or Gini Index in Tecopa?
Inequality or Gini Index in Tecopa is 0.44.
What is the Total Population of Tecopa?
Total Population of Tecopa is 187.
What is the Total Male Population of Tecopa?
Total Male Population of Tecopa is 106.
What is the Total Female Population of Tecopa?
Total Female Population of Tecopa is 81.
What is the Ratio of Males per 100 Females in Tecopa?
There are 130.86 Males per 100 Females in Tecopa.
What is the Ratio of Females per 100 Males in Tecopa?
There are 76.42 Females per 100 Males in Tecopa.
What is the Median Population Age in Tecopa?
Median Population Age in Tecopa is 67.4 Years.
What is the Average Family Size in Tecopa
Average Family Size in Tecopa is 2.3 People.
What is the Average Household Size in Tecopa
Average Household Size in Tecopa is 1.7 People.
How Large is the Labor Force in Tecopa?
There are 22 People in the Labor Forcein in Tecopa.
What is the Percentage of People in the Labor Force in Tecopa?
11.8% of People are in the Labor Force in Tecopa.