Cities with the Highest Percentage of Population Employed in Community & Social Service in Maryland
RELATED REPORTS & OPTIONS
Community & Social Service
Maryland
Compare Cities
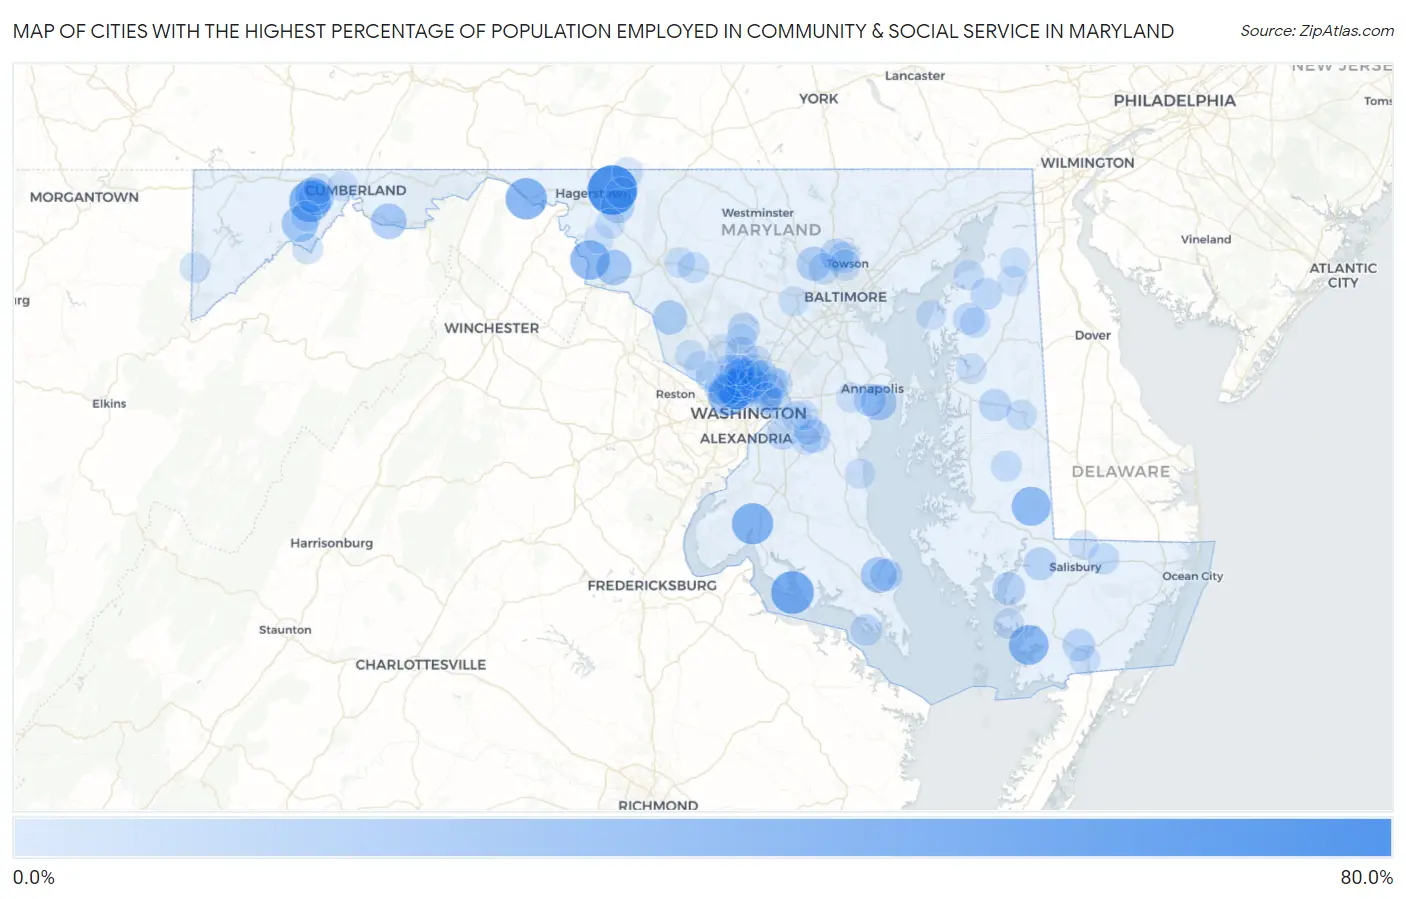
Map of Cities with the Highest Percentage of Population Employed in Community & Social Service in Maryland
0.0%
80.0%
Cities with the Highest Percentage of Population Employed in Community & Social Service in Maryland
| City | % Employed | vs State | vs National | |
| 1. | Chewsville | 75.8% | 12.6%(+63.2)#1 | 11.2%(+64.5)#73 |
| 2. | Rock Point | 54.5% | 12.6%(+41.9)#2 | 11.2%(+43.3)#158 |
| 3. | Klondike | 50.7% | 12.6%(+38.1)#3 | 11.2%(+39.5)#183 |
| 4. | Big Pool | 50.0% | 12.6%(+37.4)#4 | 11.2%(+38.8)#194 |
| 5. | Port Tobacco Village | 50.0% | 12.6%(+37.4)#5 | 11.2%(+38.8)#203 |
| 6. | Fairmount | 45.0% | 12.6%(+32.4)#6 | 11.2%(+33.8)#273 |
| 7. | Antietam | 44.4% | 12.6%(+31.8)#7 | 11.2%(+33.2)#278 |
| 8. | Brookmont | 43.0% | 12.6%(+30.4)#8 | 11.2%(+31.8)#304 |
| 9. | Brookview | 42.9% | 12.6%(+30.3)#9 | 11.2%(+31.6)#314 |
| 10. | Chevy Chase Village | 40.1% | 12.6%(+27.5)#10 | 11.2%(+28.9)#347 |
| 11. | Chevy Chase Section Three | 39.0% | 12.6%(+26.4)#11 | 11.2%(+27.7)#372 |
| 12. | Martin S Additions | 35.9% | 12.6%(+23.3)#12 | 11.2%(+24.6)#465 |
| 13. | Somerset | 34.7% | 12.6%(+22.0)#13 | 11.2%(+23.4)#514 |
| 14. | Moscow | 34.5% | 12.6%(+21.9)#14 | 11.2%(+23.3)#522 |
| 15. | Solomons | 33.2% | 12.6%(+20.6)#15 | 11.2%(+22.0)#580 |
| 16. | Shaft | 32.5% | 12.6%(+19.9)#16 | 11.2%(+21.3)#612 |
| 17. | Oldtown | 32.4% | 12.6%(+19.8)#17 | 11.2%(+21.2)#614 |
| 18. | Burkittsville | 32.4% | 12.6%(+19.8)#18 | 11.2%(+21.2)#615 |
| 19. | Highland Beach | 32.3% | 12.6%(+19.7)#19 | 11.2%(+21.0)#625 |
| 20. | Midlothian | 30.9% | 12.6%(+18.3)#20 | 11.2%(+19.7)#695 |
| 21. | Chevy Chase Section Five | 30.4% | 12.6%(+17.8)#21 | 11.2%(+19.2)#730 |
| 22. | Barnesville | 28.4% | 12.6%(+15.8)#22 | 11.2%(+17.2)#876 |
| 23. | Garrison | 27.8% | 12.6%(+15.2)#23 | 11.2%(+16.6)#917 |
| 24. | Forest Glen | 27.4% | 12.6%(+14.8)#24 | 11.2%(+16.2)#963 |
| 25. | Mount Aetna | 27.2% | 12.6%(+14.6)#25 | 11.2%(+16.0)#981 |
| 26. | Friendship Heights Village | 27.0% | 12.6%(+14.4)#26 | 11.2%(+15.8)#1,007 |
| 27. | Bethesda | 25.1% | 12.6%(+12.5)#27 | 11.2%(+13.9)#1,193 |
| 28. | Jesterville | 25.0% | 12.6%(+12.4)#28 | 11.2%(+13.8)#1,227 |
| 29. | Upper Marlboro | 24.9% | 12.6%(+12.3)#29 | 11.2%(+13.7)#1,245 |
| 30. | Quantico | 24.5% | 12.6%(+11.9)#30 | 11.2%(+13.3)#1,297 |
| 31. | South Kensington | 24.4% | 12.6%(+11.8)#31 | 11.2%(+13.1)#1,327 |
| 32. | Chevy Chase | 24.3% | 12.6%(+11.7)#32 | 11.2%(+13.1)#1,341 |
| 33. | Garrett Park | 24.2% | 12.6%(+11.6)#33 | 11.2%(+13.0)#1,353 |
| 34. | Glen Echo | 24.1% | 12.6%(+11.5)#34 | 11.2%(+12.9)#1,378 |
| 35. | Mays Chapel | 23.8% | 12.6%(+11.2)#35 | 11.2%(+12.6)#1,444 |
| 36. | Drum Point | 23.6% | 12.6%(+11.0)#36 | 11.2%(+12.4)#1,474 |
| 37. | University Park | 23.5% | 12.6%(+10.9)#37 | 11.2%(+12.3)#1,492 |
| 38. | Annapolis Neck | 23.4% | 12.6%(+10.8)#38 | 11.2%(+12.2)#1,511 |
| 39. | College Park | 23.1% | 12.6%(+10.5)#39 | 11.2%(+11.9)#1,569 |
| 40. | West Pocomoke | 23.0% | 12.6%(+10.4)#40 | 11.2%(+11.8)#1,595 |
| 41. | Takoma Park | 22.6% | 12.6%(+10.0)#41 | 11.2%(+11.4)#1,682 |
| 42. | Queen Anne | 22.5% | 12.6%(+9.94)#42 | 11.2%(+11.3)#1,700 |
| 43. | Brookeville | 22.2% | 12.6%(+9.62)#43 | 11.2%(+11.0)#1,771 |
| 44. | Mount Rainier | 21.5% | 12.6%(+8.92)#44 | 11.2%(+10.3)#1,932 |
| 45. | Leisure World | 21.2% | 12.6%(+8.56)#45 | 11.2%(+9.95)#2,017 |
| 46. | Kennedyville | 21.2% | 12.6%(+8.55)#46 | 11.2%(+9.94)#2,019 |
| 47. | Piney Point | 21.0% | 12.6%(+8.36)#47 | 11.2%(+9.75)#2,074 |
| 48. | Chestertown | 21.0% | 12.6%(+8.35)#48 | 11.2%(+9.74)#2,077 |
| 49. | Morningside | 20.9% | 12.6%(+8.30)#49 | 11.2%(+9.70)#2,090 |
| 50. | North Chevy Chase | 20.6% | 12.6%(+7.97)#50 | 11.2%(+9.36)#2,179 |
| 51. | Kensington | 20.6% | 12.6%(+7.95)#51 | 11.2%(+9.34)#2,187 |
| 52. | Lutherville | 20.4% | 12.6%(+7.83)#52 | 11.2%(+9.22)#2,234 |
| 53. | Kemp Mill | 20.2% | 12.6%(+7.59)#53 | 11.2%(+8.98)#2,325 |
| 54. | Pikesville | 20.1% | 12.6%(+7.51)#54 | 11.2%(+8.90)#2,354 |
| 55. | Parsonsburg | 19.8% | 12.6%(+7.17)#55 | 11.2%(+8.57)#2,486 |
| 56. | Potomac | 19.7% | 12.6%(+7.14)#56 | 11.2%(+8.53)#2,498 |
| 57. | Towson | 19.7% | 12.6%(+7.05)#57 | 11.2%(+8.44)#2,531 |
| 58. | Four Corners | 19.5% | 12.6%(+6.94)#58 | 11.2%(+8.33)#2,585 |
| 59. | Cabin John | 19.4% | 12.6%(+6.80)#59 | 11.2%(+8.19)#2,636 |
| 60. | Cheverly | 18.9% | 12.6%(+6.30)#60 | 11.2%(+7.69)#2,830 |
| 61. | New Market | 18.8% | 12.6%(+6.19)#61 | 11.2%(+7.58)#2,883 |
| 62. | Silver Spring | 18.7% | 12.6%(+6.13)#62 | 11.2%(+7.52)#2,913 |
| 63. | Mccoole | 18.7% | 12.6%(+6.09)#63 | 11.2%(+7.48)#2,928 |
| 64. | Cavetown | 18.4% | 12.6%(+5.80)#64 | 11.2%(+7.19)#3,054 |
| 65. | West Denton | 18.4% | 12.6%(+5.76)#65 | 11.2%(+7.15)#3,078 |
| 66. | Preston | 18.4% | 12.6%(+5.75)#66 | 11.2%(+7.14)#3,082 |
| 67. | Dames Quarter | 18.3% | 12.6%(+5.69)#67 | 11.2%(+7.09)#3,108 |
| 68. | Colesville | 18.3% | 12.6%(+5.69)#68 | 11.2%(+7.08)#3,110 |
| 69. | North Bethesda | 18.3% | 12.6%(+5.66)#69 | 11.2%(+7.05)#3,128 |
| 70. | Berwyn Heights | 18.1% | 12.6%(+5.54)#70 | 11.2%(+6.93)#3,190 |
| 71. | Largo | 18.1% | 12.6%(+5.45)#71 | 11.2%(+6.84)#3,228 |
| 72. | Frostburg | 17.9% | 12.6%(+5.29)#72 | 11.2%(+6.69)#3,296 |
| 73. | Travilah | 17.9% | 12.6%(+5.25)#73 | 11.2%(+6.64)#3,326 |
| 74. | Spring Ridge | 17.8% | 12.6%(+5.20)#74 | 11.2%(+6.59)#3,348 |
| 75. | Lonaconing | 17.7% | 12.6%(+5.14)#75 | 11.2%(+6.53)#3,382 |
| 76. | Crellin | 17.7% | 12.6%(+5.09)#76 | 11.2%(+6.48)#3,397 |
| 77. | Centreville | 17.5% | 12.6%(+4.93)#77 | 11.2%(+6.32)#3,500 |
| 78. | Betterton | 17.5% | 12.6%(+4.89)#78 | 11.2%(+6.29)#3,526 |
| 79. | Kingstown | 17.4% | 12.6%(+4.79)#79 | 11.2%(+6.18)#3,583 |
| 80. | North Kensington | 17.2% | 12.6%(+4.57)#80 | 11.2%(+5.97)#3,700 |
| 81. | Chesapeake Beach | 17.1% | 12.6%(+4.48)#81 | 11.2%(+5.87)#3,770 |
| 82. | Ringgold | 17.1% | 12.6%(+4.47)#82 | 11.2%(+5.86)#3,780 |
| 83. | Riva | 16.9% | 12.6%(+4.30)#83 | 11.2%(+5.69)#3,856 |
| 84. | Tolchester | 16.7% | 12.6%(+4.12)#84 | 11.2%(+5.51)#3,947 |
| 85. | Pocomoke City | 16.7% | 12.6%(+4.10)#85 | 11.2%(+5.50)#3,958 |
| 86. | La Vale | 16.7% | 12.6%(+4.08)#86 | 11.2%(+5.47)#3,971 |
| 87. | Olney | 16.6% | 12.6%(+4.04)#87 | 11.2%(+5.43)#4,042 |
| 88. | Ellicott City | 16.6% | 12.6%(+3.99)#88 | 11.2%(+5.38)#4,068 |
| 89. | Brentwood | 16.4% | 12.6%(+3.82)#89 | 11.2%(+5.21)#4,183 |
| 90. | Queensland | 16.4% | 12.6%(+3.80)#90 | 11.2%(+5.19)#4,197 |
| 91. | Hillandale | 16.4% | 12.6%(+3.79)#91 | 11.2%(+5.19)#4,201 |
| 92. | Marlboro Village | 16.4% | 12.6%(+3.76)#92 | 11.2%(+5.15)#4,226 |
| 93. | Keedysville | 16.3% | 12.6%(+3.72)#93 | 11.2%(+5.11)#4,253 |
| 94. | Darnestown | 16.3% | 12.6%(+3.67)#94 | 11.2%(+5.06)#4,285 |
| 95. | Galena | 16.1% | 12.6%(+3.51)#95 | 11.2%(+4.90)#4,393 |
| 96. | Kettering | 16.1% | 12.6%(+3.48)#96 | 11.2%(+4.87)#4,414 |
| 97. | Mapleville | 16.1% | 12.6%(+3.47)#97 | 11.2%(+4.86)#4,426 |
| 98. | Cecilton | 16.0% | 12.6%(+3.43)#98 | 11.2%(+4.82)#4,442 |
| 99. | Delmar | 16.0% | 12.6%(+3.40)#99 | 11.2%(+4.80)#4,466 |
| 100. | Derwood | 15.9% | 12.6%(+3.25)#100 | 11.2%(+4.65)#4,580 |
Common Questions
What are the Top 10 Cities with the Highest Percentage of Population Employed in Community & Social Service in Maryland?
Top 10 Cities with the Highest Percentage of Population Employed in Community & Social Service in Maryland are:
#1
75.8%
#2
54.5%
#3
50.7%
#4
50.0%
#5
50.0%
#6
45.0%
#7
44.4%
#8
43.0%
#9
42.9%
#10
40.1%
What city has the Highest Percentage of Population Employed in Community & Social Service in Maryland?
Chewsville has the Highest Percentage of Population Employed in Community & Social Service in Maryland with 75.8%.
What is the Percentage of Population Employed in Community & Social Service in the State of Maryland?
Percentage of Population Employed in Community & Social Service in Maryland is 12.6%.
What is the Percentage of Population Employed in Community & Social Service in the United States?
Percentage of Population Employed in Community & Social Service in the United States is 11.2%.