Zip Codes with the Highest Percentage of Population Employed in Community & Social Service in San Diego, CA
RELATED REPORTS & OPTIONS
Community & Social Service
San Diego
Compare Zip Codes
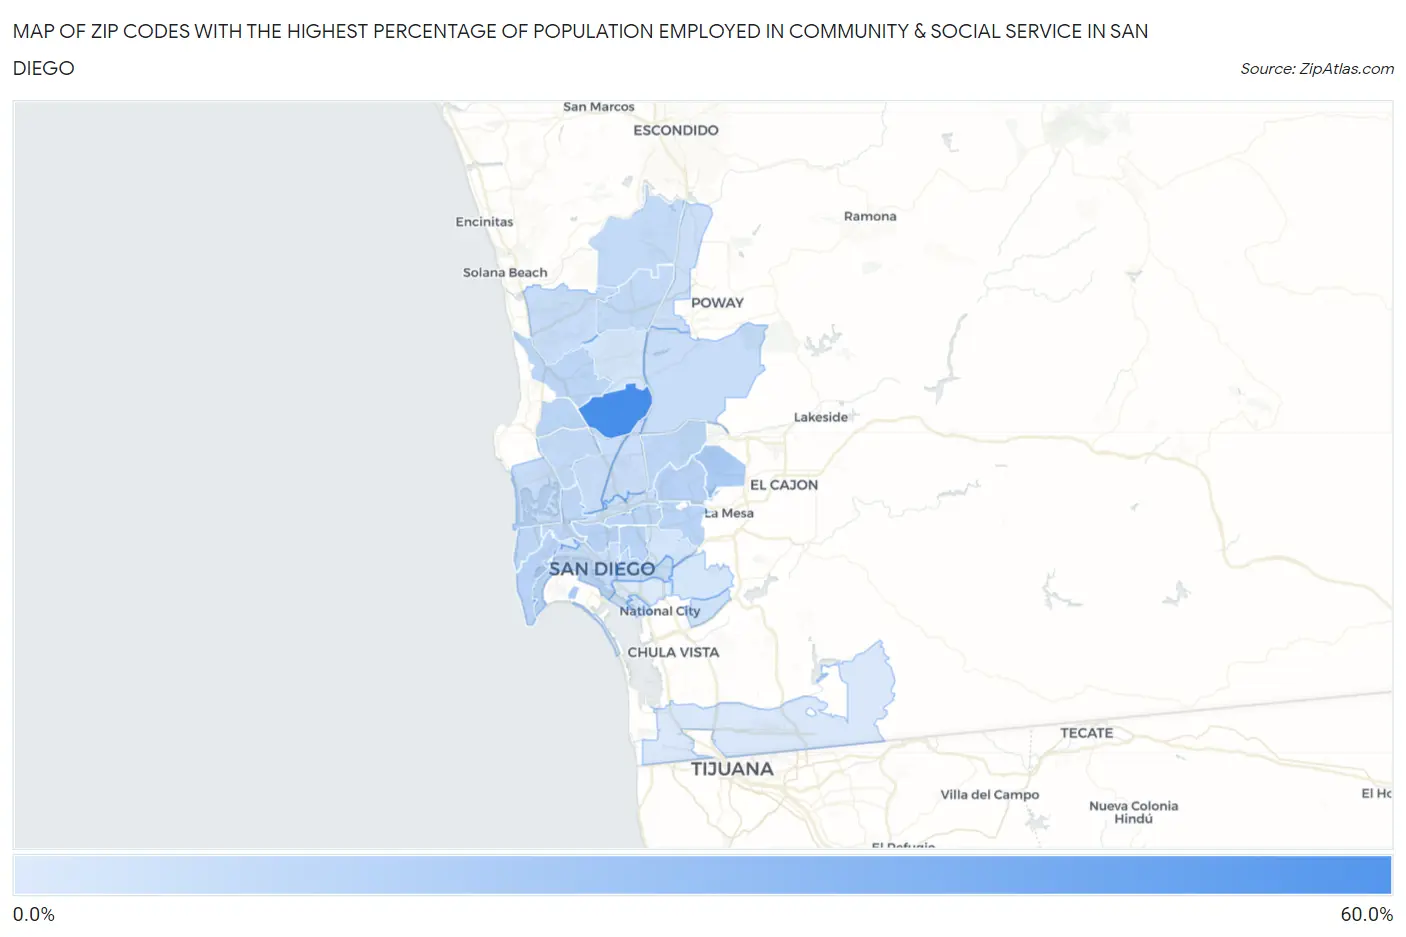
Map of Zip Codes with the Highest Percentage of Population Employed in Community & Social Service in San Diego
6.2%
55.2%
Zip Codes with the Highest Percentage of Population Employed in Community & Social Service in San Diego, CA
| Zip Code | % Employed | vs State | vs National | |
| 1. | 92145 | 55.2% | 11.5%(+43.7)#7 | 11.2%(+44.0)#112 |
| 2. | 92134 | 52.4% | 11.5%(+40.9)#8 | 11.2%(+41.2)#131 |
| 3. | 92135 | 21.1% | 11.5%(+9.57)#145 | 11.2%(+9.84)#1,701 |
| 4. | 92119 | 19.7% | 11.5%(+8.23)#176 | 11.2%(+8.50)#2,119 |
| 5. | 92120 | 16.7% | 11.5%(+5.23)#270 | 11.2%(+5.50)#3,559 |
| 6. | 92106 | 16.6% | 11.5%(+5.12)#279 | 11.2%(+5.39)#3,638 |
| 7. | 92103 | 16.2% | 11.5%(+4.76)#296 | 11.2%(+5.03)#3,874 |
| 8. | 92104 | 15.8% | 11.5%(+4.30)#331 | 11.2%(+4.57)#4,268 |
| 9. | 92115 | 15.8% | 11.5%(+4.29)#332 | 11.2%(+4.56)#4,272 |
| 10. | 92116 | 15.2% | 11.5%(+3.71)#369 | 11.2%(+3.98)#4,802 |
| 11. | 92121 | 15.1% | 11.5%(+3.65)#372 | 11.2%(+3.93)#4,841 |
| 12. | 92122 | 14.9% | 11.5%(+3.43)#390 | 11.2%(+3.70)#5,047 |
| 13. | 92110 | 14.6% | 11.5%(+3.15)#405 | 11.2%(+3.42)#5,323 |
| 14. | 92107 | 14.3% | 11.5%(+2.84)#424 | 11.2%(+3.11)#5,679 |
| 15. | 92124 | 14.3% | 11.5%(+2.77)#433 | 11.2%(+3.04)#5,771 |
| 16. | 92117 | 13.5% | 11.5%(+2.00)#501 | 11.2%(+2.27)#6,764 |
| 17. | 92129 | 12.9% | 11.5%(+1.45)#562 | 11.2%(+1.72)#7,666 |
| 18. | 92127 | 12.9% | 11.5%(+1.43)#565 | 11.2%(+1.70)#7,712 |
| 19. | 92102 | 12.5% | 11.5%(+1.01)#603 | 11.2%(+1.28)#8,436 |
| 20. | 92131 | 12.1% | 11.5%(+0.643)#642 | 11.2%(+0.913)#9,100 |
| 21. | 92111 | 12.0% | 11.5%(+0.515)#659 | 11.2%(+0.785)#9,378 |
| 22. | 92130 | 11.8% | 11.5%(+0.355)#677 | 11.2%(+0.626)#9,679 |
| 23. | 92109 | 11.8% | 11.5%(+0.270)#692 | 11.2%(+0.541)#9,883 |
| 24. | 92123 | 11.2% | 11.5%(-0.244)#764 | 11.2%(+0.026)#11,031 |
| 25. | 92101 | 11.1% | 11.5%(-0.384)#783 | 11.2%(-0.114)#11,387 |
| 26. | 92128 | 10.8% | 11.5%(-0.649)#814 | 11.2%(-0.379)#12,049 |
| 27. | 92108 | 10.5% | 11.5%(-0.970)#854 | 11.2%(-0.700)#12,839 |
| 28. | 92139 | 9.8% | 11.5%(-1.65)#947 | 11.2%(-1.38)#14,566 |
| 29. | 92126 | 8.6% | 11.5%(-2.87)#1,095 | 11.2%(-2.60)#17,844 |
| 30. | 92105 | 8.5% | 11.5%(-3.02)#1,110 | 11.2%(-2.75)#18,264 |
| 31. | 92114 | 8.0% | 11.5%(-3.48)#1,162 | 11.2%(-3.21)#19,567 |
| 32. | 92136 | 8.0% | 11.5%(-3.50)#1,163 | 11.2%(-3.23)#19,599 |
| 33. | 92140 | 7.6% | 11.5%(-3.88)#1,211 | 11.2%(-3.61)#20,619 |
| 34. | 92154 | 6.6% | 11.5%(-4.86)#1,343 | 11.2%(-4.59)#22,988 |
| 35. | 92113 | 6.2% | 11.5%(-5.33)#1,393 | 11.2%(-5.06)#24,050 |
1
Common Questions
What are the Top 10 Zip Codes with the Highest Percentage of Population Employed in Community & Social Service in San Diego, CA?
Top 10 Zip Codes with the Highest Percentage of Population Employed in Community & Social Service in San Diego, CA are:
What zip code has the Highest Percentage of Population Employed in Community & Social Service in San Diego, CA?
92145 has the Highest Percentage of Population Employed in Community & Social Service in San Diego, CA with 55.2%.
What is the Percentage of Population Employed in Community & Social Service in San Diego, CA?
Percentage of Population Employed in Community & Social Service in San Diego is 12.1%.
What is the Percentage of Population Employed in Community & Social Service in California?
Percentage of Population Employed in Community & Social Service in California is 11.5%.
What is the Percentage of Population Employed in Community & Social Service in the United States?
Percentage of Population Employed in Community & Social Service in the United States is 11.2%.