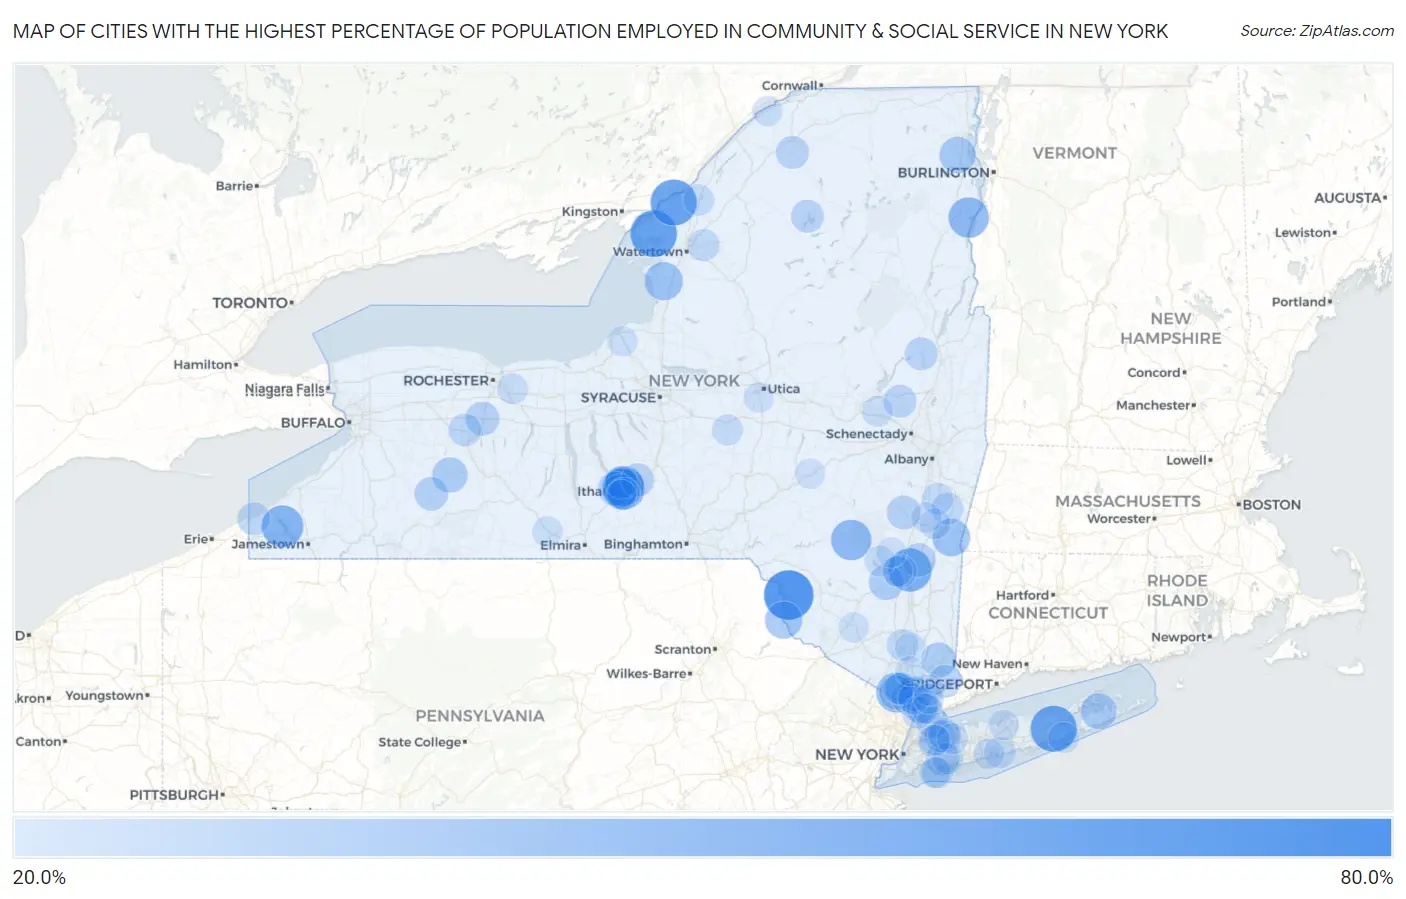
Cities with the Highest Percentage of Population Employed in Community & Social Service in New York
RELATED REPORTS & OPTIONS
Community & Social Service
New York
Compare Cities
Map of Cities with the Highest Percentage of Population Employed in Community & Social Service in New York
0.0%
80.0%
Cities with the Highest Percentage of Population Employed in Community & Social Service in New York
| City | % Employed | vs State | vs National | |
| 1. | Slaterville Springs | 67.4% | 15.0%(+52.4)#1 | 11.2%(+56.2)#93 |
| 2. | Hortonville | 64.3% | 15.0%(+49.3)#2 | 11.2%(+53.1)#104 |
| 3. | Three Mile Bay | 57.9% | 15.0%(+42.9)#3 | 11.2%(+46.7)#128 |
| 4. | Northampton | 57.4% | 15.0%(+42.5)#4 | 11.2%(+46.2)#130 |
| 5. | Thousand Island Park | 57.4% | 15.0%(+42.5)#5 | 11.2%(+46.2)#131 |
| 6. | Fallsburg | 56.9% | 15.0%(+41.9)#6 | 11.2%(+45.6)#141 |
| 7. | Rhinecliff | 51.2% | 15.0%(+36.2)#7 | 11.2%(+39.9)#181 |
| 8. | Lake Huntington | 49.7% | 15.0%(+34.7)#8 | 11.2%(+38.4)#204 |
| 9. | Chautauqua | 48.1% | 15.0%(+33.1)#9 | 11.2%(+36.9)#221 |
| 10. | Forest Home | 48.1% | 15.0%(+33.1)#10 | 11.2%(+36.8)#222 |
| 11. | Pine Hill | 45.4% | 15.0%(+30.4)#11 | 11.2%(+34.2)#261 |
| 12. | Westport | 45.2% | 15.0%(+30.2)#12 | 11.2%(+34.0)#266 |
| 13. | Northeast Ithaca | 45.2% | 15.0%(+30.2)#13 | 11.2%(+34.0)#268 |
| 14. | Kaser | 44.5% | 15.0%(+29.6)#14 | 11.2%(+33.3)#276 |
| 15. | Belleville | 40.7% | 15.0%(+25.7)#15 | 11.2%(+29.5)#339 |
| 16. | Cayuga Heights | 40.6% | 15.0%(+25.6)#16 | 11.2%(+29.4)#341 |
| 17. | Copake Lake | 40.1% | 15.0%(+25.1)#17 | 11.2%(+28.9)#346 |
| 18. | Mountain Dale | 39.6% | 15.0%(+24.6)#18 | 11.2%(+28.4)#358 |
| 19. | Narrowsburg | 39.0% | 15.0%(+24.0)#19 | 11.2%(+27.8)#371 |
| 20. | Brooktondale | 38.5% | 15.0%(+23.5)#20 | 11.2%(+27.3)#388 |
| 21. | Peru | 37.0% | 15.0%(+22.0)#21 | 11.2%(+25.7)#435 |
| 22. | Sag Harbor | 36.1% | 15.0%(+21.2)#22 | 11.2%(+24.9)#460 |
| 23. | Hunt | 35.0% | 15.0%(+20.0)#23 | 11.2%(+23.8)#497 |
| 24. | Irvington | 34.7% | 15.0%(+19.7)#24 | 11.2%(+23.5)#513 |
| 25. | Heritage Hills | 34.5% | 15.0%(+19.5)#25 | 11.2%(+23.2)#525 |
| 26. | Bard College | 34.3% | 15.0%(+19.4)#26 | 11.2%(+23.1)#529 |
| 27. | Upper Nyack | 34.3% | 15.0%(+19.3)#27 | 11.2%(+23.1)#532 |
| 28. | Stone Ridge | 34.3% | 15.0%(+19.3)#28 | 11.2%(+23.0)#533 |
| 29. | Cementon | 33.8% | 15.0%(+18.8)#29 | 11.2%(+22.6)#549 |
| 30. | Jacksonville | 33.2% | 15.0%(+18.2)#30 | 11.2%(+22.0)#577 |
| 31. | Northwest Ithaca | 32.9% | 15.0%(+17.9)#31 | 11.2%(+21.7)#595 |
| 32. | Ithaca | 32.8% | 15.0%(+17.8)#32 | 11.2%(+21.6)#599 |
| 33. | Monsey | 32.7% | 15.0%(+17.8)#33 | 11.2%(+21.5)#602 |
| 34. | East Avon | 32.2% | 15.0%(+17.3)#34 | 11.2%(+21.0)#626 |
| 35. | Vassar College | 32.2% | 15.0%(+17.2)#35 | 11.2%(+20.9)#628 |
| 36. | Cairo | 32.1% | 15.0%(+17.1)#36 | 11.2%(+20.9)#633 |
| 37. | Red Hook | 31.9% | 15.0%(+16.9)#37 | 11.2%(+20.7)#641 |
| 38. | Houghton | 31.8% | 15.0%(+16.9)#38 | 11.2%(+20.6)#644 |
| 39. | Freeville | 31.2% | 15.0%(+16.3)#39 | 11.2%(+20.0)#673 |
| 40. | Macdonnell Heights | 31.2% | 15.0%(+16.2)#40 | 11.2%(+20.0)#678 |
| 41. | Round Top | 31.1% | 15.0%(+16.2)#41 | 11.2%(+19.9)#679 |
| 42. | Malverne Park Oaks | 31.0% | 15.0%(+16.0)#42 | 11.2%(+19.7)#689 |
| 43. | Hillside | 30.8% | 15.0%(+15.9)#43 | 11.2%(+19.6)#698 |
| 44. | Hannawa Falls | 30.5% | 15.0%(+15.6)#44 | 11.2%(+19.3)#721 |
| 45. | West Nyack | 30.3% | 15.0%(+15.4)#45 | 11.2%(+19.1)#731 |
| 46. | Cranberry Lake | 30.3% | 15.0%(+15.3)#46 | 11.2%(+19.1)#734 |
| 47. | Lake Luzerne | 30.3% | 15.0%(+15.3)#47 | 11.2%(+19.1)#736 |
| 48. | Galway | 30.1% | 15.0%(+15.2)#48 | 11.2%(+18.9)#744 |
| 49. | Piffard | 30.1% | 15.0%(+15.1)#49 | 11.2%(+18.9)#746 |
| 50. | Bedford | 30.0% | 15.0%(+15.0)#50 | 11.2%(+18.8)#751 |
| 51. | Ripley | 29.9% | 15.0%(+15.0)#51 | 11.2%(+18.7)#763 |
| 52. | New Square | 29.6% | 15.0%(+14.6)#52 | 11.2%(+18.4)#790 |
| 53. | Lansing | 29.5% | 15.0%(+14.5)#53 | 11.2%(+18.3)#793 |
| 54. | Glenwood Landing | 29.0% | 15.0%(+14.0)#54 | 11.2%(+17.7)#830 |
| 55. | Hastings On Hudson | 28.4% | 15.0%(+13.4)#55 | 11.2%(+17.2)#877 |
| 56. | Ardsley | 28.3% | 15.0%(+13.4)#56 | 11.2%(+17.1)#880 |
| 57. | Felts Mills | 28.3% | 15.0%(+13.3)#57 | 11.2%(+17.1)#884 |
| 58. | East Ithaca | 28.2% | 15.0%(+13.3)#58 | 11.2%(+17.0)#890 |
| 59. | Cadyville | 28.2% | 15.0%(+13.2)#59 | 11.2%(+17.0)#895 |
| 60. | Saddle Rock Estates | 28.2% | 15.0%(+13.2)#60 | 11.2%(+16.9)#897 |
| 61. | Cornwall On Hudson | 28.1% | 15.0%(+13.2)#61 | 11.2%(+16.9)#898 |
| 62. | Ghent | 28.1% | 15.0%(+13.2)#62 | 11.2%(+16.9)#899 |
| 63. | Larchmont | 28.1% | 15.0%(+13.1)#63 | 11.2%(+16.9)#900 |
| 64. | Port Washington | 27.8% | 15.0%(+12.8)#64 | 11.2%(+16.6)#918 |
| 65. | New Hempstead | 27.5% | 15.0%(+12.5)#65 | 11.2%(+16.3)#954 |
| 66. | East Atlantic Beach | 27.4% | 15.0%(+12.5)#66 | 11.2%(+16.2)#958 |
| 67. | Sea Cliff | 27.3% | 15.0%(+12.4)#67 | 11.2%(+16.1)#967 |
| 68. | Kinderhook | 27.3% | 15.0%(+12.3)#68 | 11.2%(+16.1)#969 |
| 69. | South Nyack | 27.2% | 15.0%(+12.2)#69 | 11.2%(+16.0)#988 |
| 70. | Great River | 27.0% | 15.0%(+12.0)#70 | 11.2%(+15.8)#1,006 |
| 71. | Redwood | 26.7% | 15.0%(+11.7)#71 | 11.2%(+15.5)#1,036 |
| 72. | South Hempstead | 26.7% | 15.0%(+11.7)#72 | 11.2%(+15.5)#1,038 |
| 73. | Atlantic Beach | 26.7% | 15.0%(+11.7)#73 | 11.2%(+15.5)#1,039 |
| 74. | Hamilton | 26.6% | 15.0%(+11.7)#74 | 11.2%(+15.4)#1,045 |
| 75. | Fairport | 26.5% | 15.0%(+11.6)#75 | 11.2%(+15.3)#1,051 |
| 76. | Brookville | 26.5% | 15.0%(+11.5)#76 | 11.2%(+15.3)#1,054 |
| 77. | Quogue | 26.3% | 15.0%(+11.4)#77 | 11.2%(+15.1)#1,068 |
| 78. | Claverack Red Mills | 26.3% | 15.0%(+11.3)#78 | 11.2%(+15.1)#1,073 |
| 79. | Fort Johnson | 26.3% | 15.0%(+11.3)#79 | 11.2%(+15.1)#1,080 |
| 80. | Shorehaven | 26.3% | 15.0%(+11.3)#80 | 11.2%(+15.0)#1,083 |
| 81. | Copake | 26.2% | 15.0%(+11.2)#81 | 11.2%(+15.0)#1,087 |
| 82. | Shokan | 26.1% | 15.0%(+11.2)#82 | 11.2%(+14.9)#1,092 |
| 83. | Pleasantville | 26.1% | 15.0%(+11.1)#83 | 11.2%(+14.9)#1,096 |
| 84. | Brightwaters | 26.0% | 15.0%(+11.1)#84 | 11.2%(+14.8)#1,100 |
| 85. | Athens | 25.5% | 15.0%(+10.5)#85 | 11.2%(+14.3)#1,150 |
| 86. | Stony Brook | 25.3% | 15.0%(+10.3)#86 | 11.2%(+14.0)#1,175 |
| 87. | Washington Mills | 25.2% | 15.0%(+10.2)#87 | 11.2%(+14.0)#1,183 |
| 88. | Coopers Plains | 25.2% | 15.0%(+10.2)#88 | 11.2%(+14.0)#1,185 |
| 89. | Waddington | 25.2% | 15.0%(+10.2)#89 | 11.2%(+14.0)#1,187 |
| 90. | Great Neck | 25.2% | 15.0%(+10.2)#90 | 11.2%(+14.0)#1,188 |
| 91. | Hurley | 25.1% | 15.0%(+10.1)#91 | 11.2%(+13.9)#1,199 |
| 92. | Woodstock | 25.0% | 15.0%(+10.1)#92 | 11.2%(+13.8)#1,204 |
| 93. | Hartsdale | 25.0% | 15.0%(+10.1)#93 | 11.2%(+13.8)#1,205 |
| 94. | Cold Spring | 25.0% | 15.0%(+10.1)#94 | 11.2%(+13.8)#1,206 |
| 95. | Valhalla | 25.0% | 15.0%(+10.0)#95 | 11.2%(+13.8)#1,207 |
| 96. | South Hill | 25.0% | 15.0%(+10.0)#96 | 11.2%(+13.8)#1,208 |
| 97. | Bloomingburg | 25.0% | 15.0%(+10.0)#97 | 11.2%(+13.8)#1,209 |
| 98. | Schenevus | 25.0% | 15.0%(+10.0)#98 | 11.2%(+13.8)#1,213 |
| 99. | Minetto | 24.8% | 15.0%(+9.87)#99 | 11.2%(+13.6)#1,260 |
| 100. | Buchanan | 24.8% | 15.0%(+9.83)#100 | 11.2%(+13.6)#1,264 |
Common Questions
What are the Top 10 Cities with the Highest Percentage of Population Employed in Community & Social Service in New York?
Top 10 Cities with the Highest Percentage of Population Employed in Community & Social Service in New York are:
#1
64.3%
#2
57.9%
#3
57.4%
#4
57.4%
#5
51.2%
#6
48.1%
#7
48.1%
#8
45.4%
#9
45.2%
#10
45.2%
What city has the Highest Percentage of Population Employed in Community & Social Service in New York?
Hortonville has the Highest Percentage of Population Employed in Community & Social Service in New York with 64.3%.
What is the Percentage of Population Employed in Community & Social Service in the State of New York?
Percentage of Population Employed in Community & Social Service in New York is 15.0%.
What is the Percentage of Population Employed in Community & Social Service in the United States?
Percentage of Population Employed in Community & Social Service in the United States is 11.2%.