Marina Del Rey, CA Map & Demographics
Marina Del Rey Map
Marina Del Rey Overview
$94,583
PER CAPITA INCOME
$177,703
AVG FAMILY INCOME
$135,584
AVG HOUSEHOLD INCOME
6.0%
WAGE / INCOME GAP [ % ]
94.0¢/ $1
WAGE / INCOME GAP [ $ ]
0.43
INEQUALITY / GINI INDEX
10,274
TOTAL POPULATION
4,758
MALE POPULATION
5,516
FEMALE POPULATION
86.26
MALES / 100 FEMALES
115.93
FEMALES / 100 MALES
37.4
MEDIAN AGE
2.6
AVG FAMILY SIZE
1.9
AVG HOUSEHOLD SIZE
7,867
LABOR FORCE [ PEOPLE ]
86.4%
PERCENT IN LABOR FORCE
5.2%
UNEMPLOYMENT RATE
Marina Del Rey Zip Codes
Marina Del Rey Area Codes
Income in Marina Del Rey
Income Overview in Marina Del Rey
Per Capita Income in Marina Del Rey is $94,583, while median incomes of families and households are $177,703 and $135,584 respectively.
| Characteristic | Number | Measure |
| Per Capita Income | 10,274 | $94,583 |
| Median Family Income | 2,293 | $177,703 |
| Mean Family Income | 2,293 | $191,631 |
| Median Household Income | 5,511 | $135,584 |
| Mean Household Income | 5,511 | $174,440 |
| Income Deficit | 2,293 | $0 |
| Wage / Income Gap (%) | 10,274 | 5.99% |
| Wage / Income Gap ($) | 10,274 | 94.01¢ per $1 |
| Gini / Inequality Index | 10,274 | 0.43 |
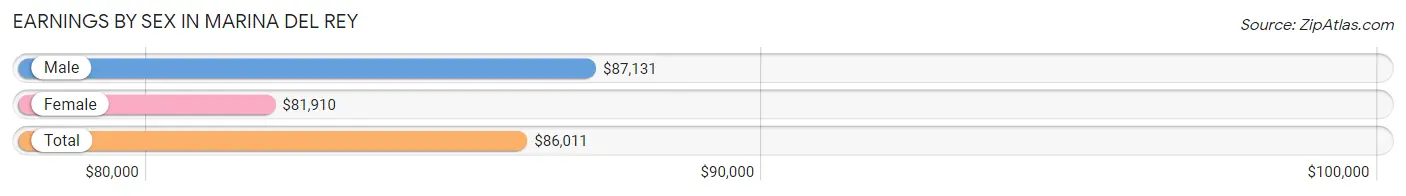
Earnings by Sex in Marina Del Rey
Average Earnings in Marina Del Rey are $86,011, $87,131 for men and $81,910 for women, a difference of 6.0%.
| Sex | Number | Average Earnings |
| Male | 3,874 (49.2%) | $87,131 |
| Female | 4,004 (50.8%) | $81,910 |
| Total | 7,878 (100.0%) | $86,011 |
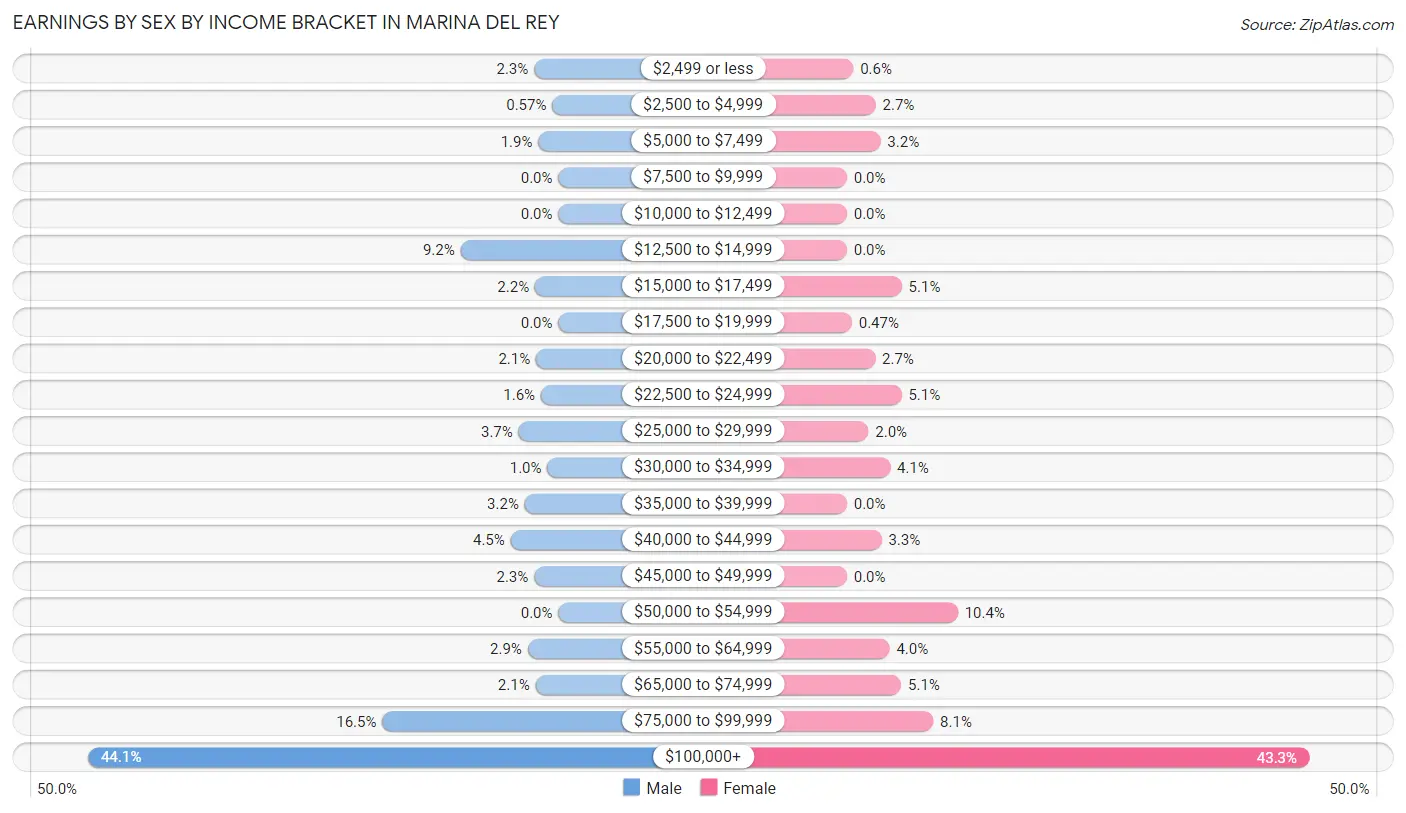
Earnings by Sex by Income Bracket in Marina Del Rey
The most common earnings brackets in Marina Del Rey are $100,000+ for men (1,707 | 44.1%) and $100,000+ for women (1,733 | 43.3%).
| Income | Male | Female |
| $2,499 or less | 88 (2.3%) | 24 (0.6%) |
| $2,500 to $4,999 | 22 (0.6%) | 108 (2.7%) |
| $5,000 to $7,499 | 73 (1.9%) | 126 (3.2%) |
| $7,500 to $9,999 | 0 (0.0%) | 0 (0.0%) |
| $10,000 to $12,499 | 0 (0.0%) | 0 (0.0%) |
| $12,500 to $14,999 | 355 (9.2%) | 0 (0.0%) |
| $15,000 to $17,499 | 85 (2.2%) | 206 (5.1%) |
| $17,500 to $19,999 | 0 (0.0%) | 19 (0.5%) |
| $20,000 to $22,499 | 81 (2.1%) | 106 (2.6%) |
| $22,500 to $24,999 | 63 (1.6%) | 205 (5.1%) |
| $25,000 to $29,999 | 144 (3.7%) | 81 (2.0%) |
| $30,000 to $34,999 | 40 (1.0%) | 162 (4.1%) |
| $35,000 to $39,999 | 122 (3.2%) | 0 (0.0%) |
| $40,000 to $44,999 | 173 (4.5%) | 130 (3.3%) |
| $45,000 to $49,999 | 88 (2.3%) | 0 (0.0%) |
| $50,000 to $54,999 | 0 (0.0%) | 416 (10.4%) |
| $55,000 to $64,999 | 111 (2.9%) | 160 (4.0%) |
| $65,000 to $74,999 | 83 (2.1%) | 204 (5.1%) |
| $75,000 to $99,999 | 639 (16.5%) | 324 (8.1%) |
| $100,000+ | 1,707 (44.1%) | 1,733 (43.3%) |
| Total | 3,874 (100.0%) | 4,004 (100.0%) |
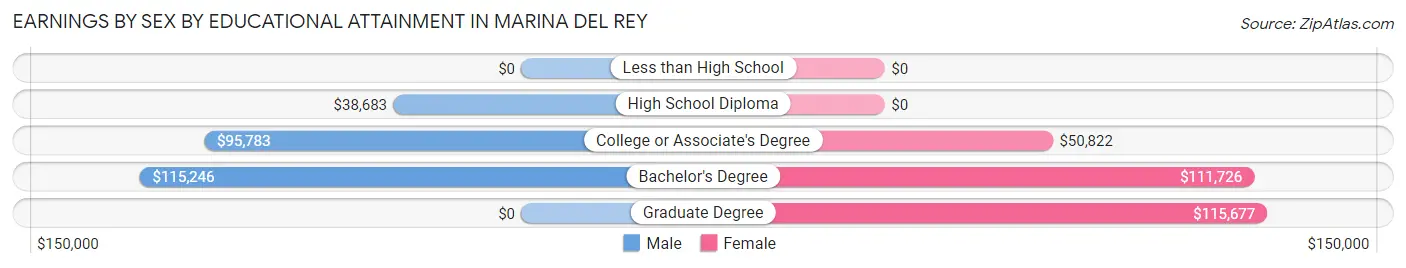
Earnings by Sex by Educational Attainment in Marina Del Rey
Average earnings in Marina Del Rey are $97,095 for men and $101,220 for women, a difference of 4.1%. Men with an educational attainment of bachelor's degree enjoy the highest average annual earnings of $115,246, while those with high school diploma education earn the least with $38,683. Women with an educational attainment of graduate degree earn the most with the average annual earnings of $115,677, while those with college or associate's degree education have the smallest earnings of $50,822.
| Educational Attainment | Male Income | Female Income |
| Less than High School | - | - |
| High School Diploma | $38,683 | $0 |
| College or Associate's Degree | $95,783 | $50,822 |
| Bachelor's Degree | $115,246 | $111,726 |
| Graduate Degree | - | - |
| Total | $97,095 | $101,220 |
Family Income in Marina Del Rey
Family Income Brackets in Marina Del Rey
According to the Marina Del Rey family income data, there are 908 families falling into the $200,000+ income range, which is the most common income bracket and makes up 39.6% of all families.
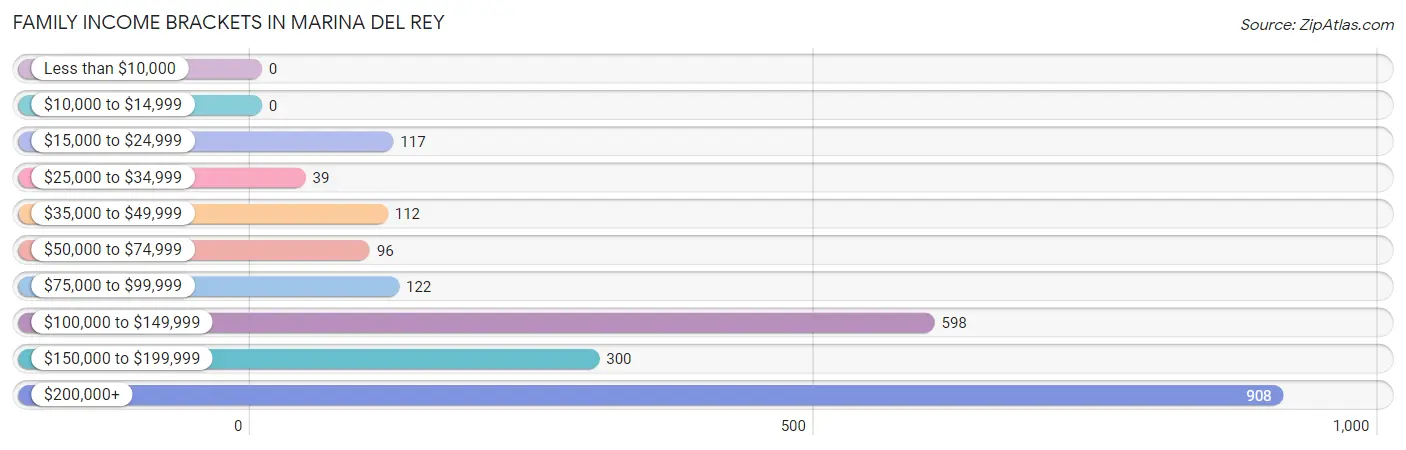
| Income Bracket | # Families | % Families |
| Less than $10,000 | 0 | 0.0% |
| $10,000 to $14,999 | 0 | 0.0% |
| $15,000 to $24,999 | 117 | 5.1% |
| $25,000 to $34,999 | 39 | 1.7% |
| $35,000 to $49,999 | 112 | 4.9% |
| $50,000 to $74,999 | 96 | 4.2% |
| $75,000 to $99,999 | 122 | 5.3% |
| $100,000 to $149,999 | 598 | 26.1% |
| $150,000 to $199,999 | 300 | 13.1% |
| $200,000+ | 908 | 39.6% |
Family Income by Famaliy Size in Marina Del Rey
3-person families (884 | 38.6%) account for the highest median family income in Marina Del Rey with $235,058 per family, while 3-person families (884 | 38.6%) have the highest median income of $78,353 per family member.
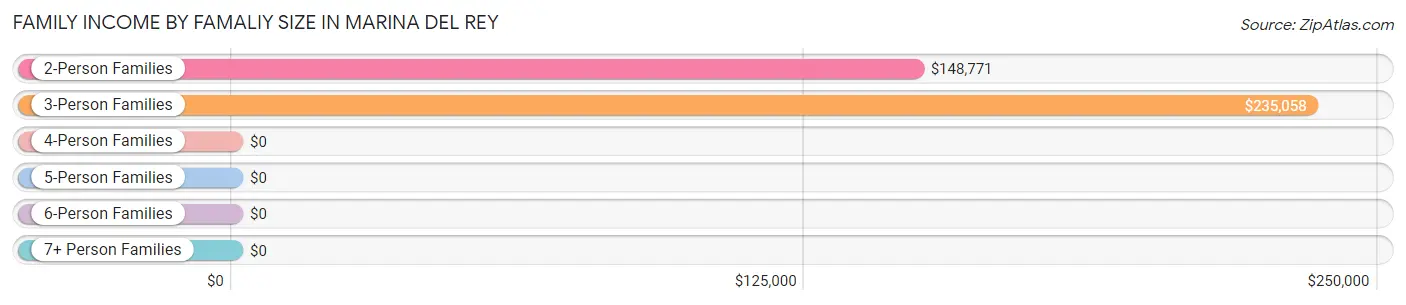
| Income Bracket | # Families | Median Income |
| 2-Person Families | 1,264 (55.1%) | $148,771 |
| 3-Person Families | 884 (38.6%) | $235,058 |
| 4-Person Families | 145 (6.3%) | $0 |
| 5-Person Families | 0 (0.0%) | $0 |
| 6-Person Families | 0 (0.0%) | $0 |
| 7+ Person Families | 0 (0.0%) | $0 |
| Total | 2,293 (100.0%) | $177,703 |
Family Income by Number of Earners in Marina Del Rey
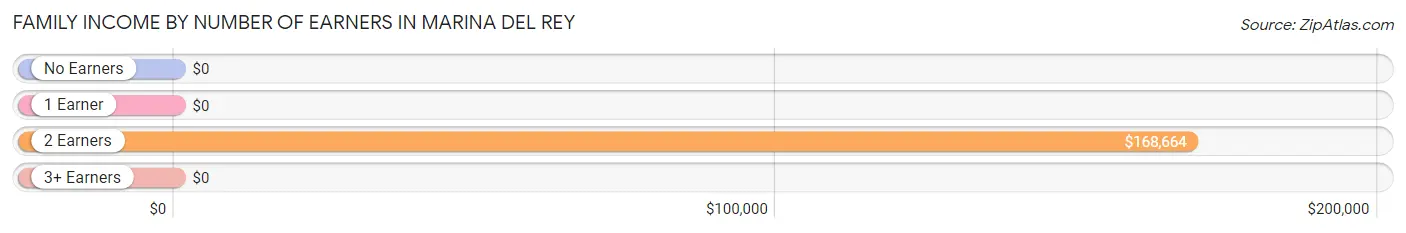
| Number of Earners | # Families | Median Income |
| No Earners | 130 (5.7%) | $0 |
| 1 Earner | 645 (28.1%) | $0 |
| 2 Earners | 1,427 (62.2%) | $168,664 |
| 3+ Earners | 91 (4.0%) | $0 |
| Total | 2,293 (100.0%) | $177,703 |
Household Income in Marina Del Rey
Household Income Brackets in Marina Del Rey
With 1,571 households falling in the category, the $200,000+ income range is the most frequent in Marina Del Rey, accounting for 28.5% of all households.
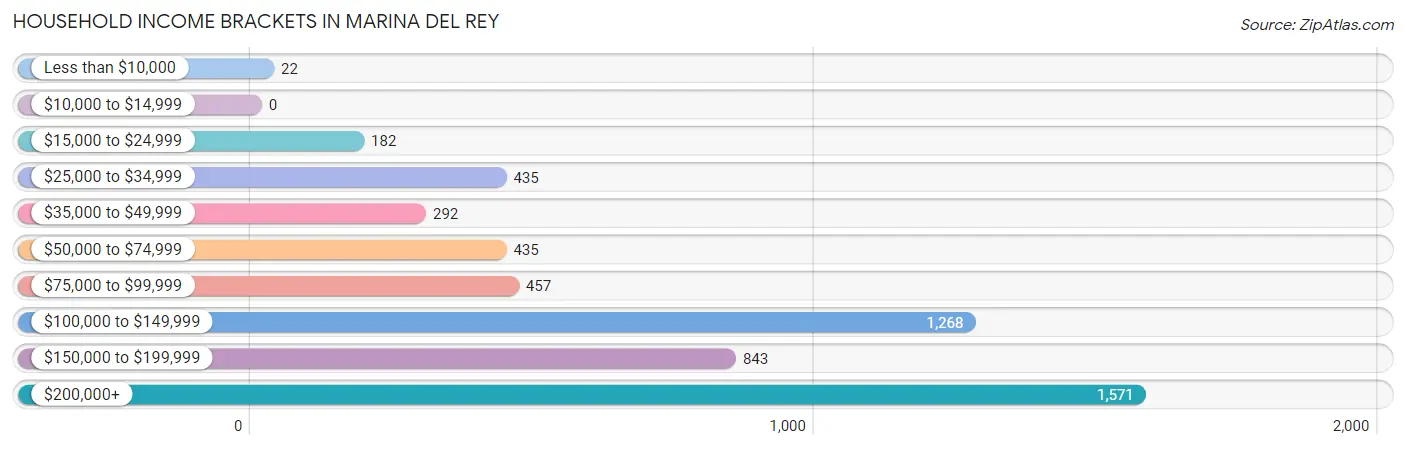
| Income Bracket | # Households | % Households |
| Less than $10,000 | 22 | 0.4% |
| $10,000 to $14,999 | 0 | 0.0% |
| $15,000 to $24,999 | 182 | 3.3% |
| $25,000 to $34,999 | 435 | 7.9% |
| $35,000 to $49,999 | 292 | 5.3% |
| $50,000 to $74,999 | 435 | 7.9% |
| $75,000 to $99,999 | 457 | 8.3% |
| $100,000 to $149,999 | 1,268 | 23.0% |
| $150,000 to $199,999 | 843 | 15.3% |
| $200,000+ | 1,571 | 28.5% |
Household Income by Householder Age in Marina Del Rey
The median household income in Marina Del Rey is $135,584, with the highest median household income of $178,002 found in the 25 to 44 years age bracket for the primary householder. A total of 2,409 households (43.7%) fall into this category. Meanwhile, the 15 to 24 years age bracket for the primary householder has the lowest median household income of $130,352, with 550 households (10.0%) in this group.
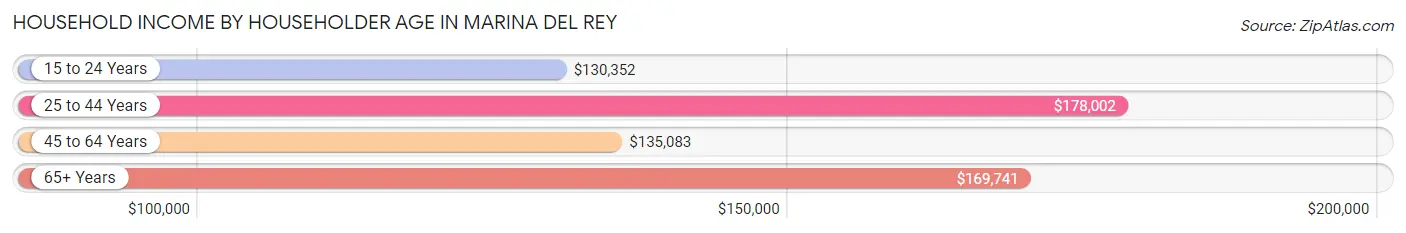
| Income Bracket | # Households | Median Income |
| 15 to 24 Years | 550 (10.0%) | $130,352 |
| 25 to 44 Years | 2,409 (43.7%) | $178,002 |
| 45 to 64 Years | 1,932 (35.1%) | $135,083 |
| 65+ Years | 620 (11.3%) | $169,741 |
| Total | 5,511 (100.0%) | $135,584 |
Poverty in Marina Del Rey
Income Below Poverty by Sex and Age in Marina Del Rey
With 5.0% poverty level for males and 3.1% for females among the residents of Marina Del Rey, under 5 year old males and 55 to 64 year old females are the most vulnerable to poverty, with 87 males (38.3%) and 47 females (34.1%) in their respective age groups living below the poverty level.
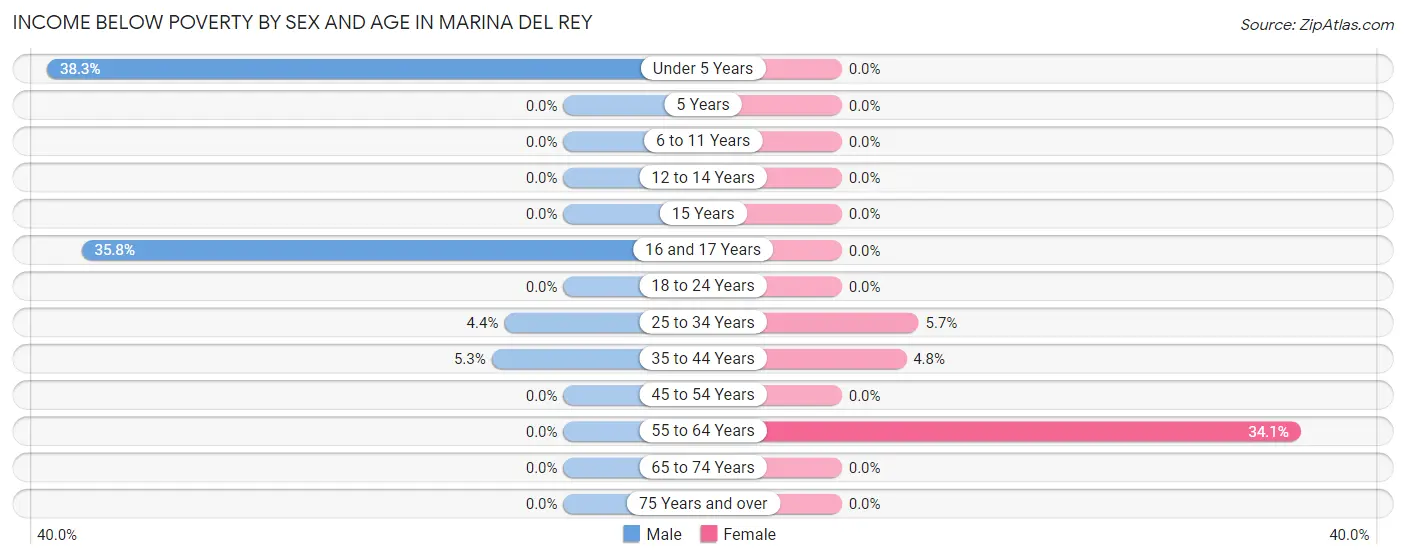
| Age Bracket | Male | Female |
| Under 5 Years | 87 (38.3%) | 0 (0.0%) |
| 5 Years | 0 (0.0%) | 0 (0.0%) |
| 6 to 11 Years | 0 (0.0%) | 0 (0.0%) |
| 12 to 14 Years | 0 (0.0%) | 0 (0.0%) |
| 15 Years | 0 (0.0%) | 0 (0.0%) |
| 16 and 17 Years | 49 (35.8%) | 0 (0.0%) |
| 18 to 24 Years | 0 (0.0%) | 0 (0.0%) |
| 25 to 34 Years | 23 (4.4%) | 52 (5.7%) |
| 35 to 44 Years | 81 (5.3%) | 71 (4.8%) |
| 45 to 54 Years | 0 (0.0%) | 0 (0.0%) |
| 55 to 64 Years | 0 (0.0%) | 47 (34.1%) |
| 65 to 74 Years | 0 (0.0%) | 0 (0.0%) |
| 75 Years and over | 0 (0.0%) | 0 (0.0%) |
| Total | 240 (5.0%) | 170 (3.1%) |
Income Above Poverty by Sex and Age in Marina Del Rey
According to the poverty statistics in Marina Del Rey, males aged 5 years and females aged under 5 years are the age groups that are most secure financially, with 100.0% of males and 100.0% of females in these age groups living above the poverty line.
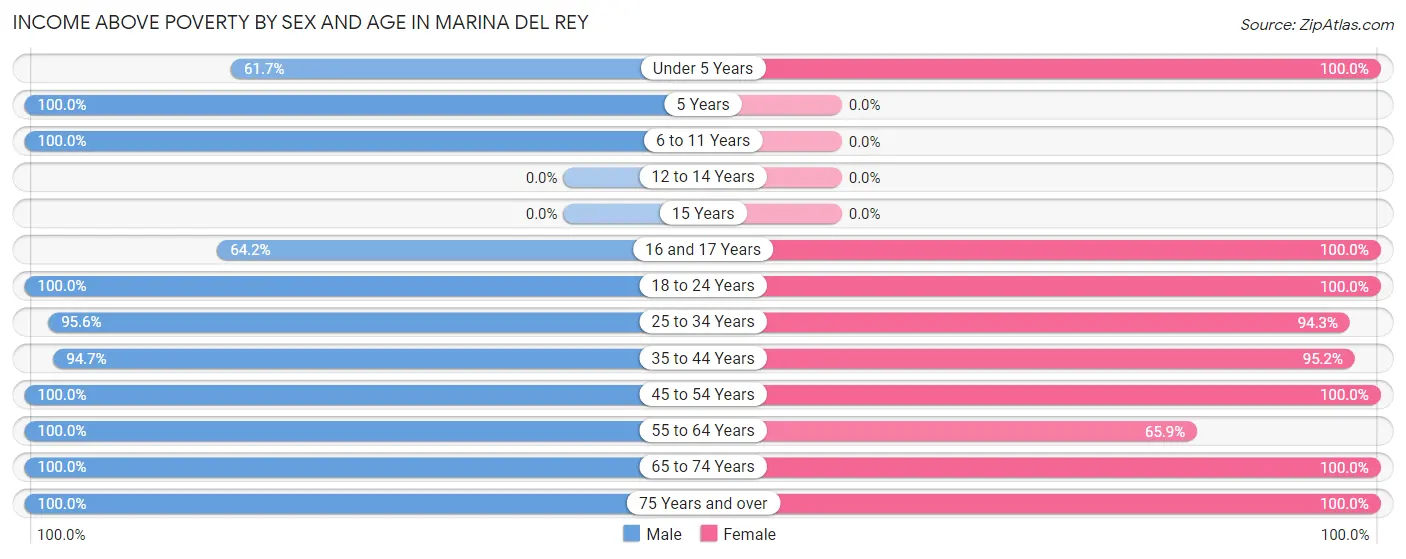
| Age Bracket | Male | Female |
| Under 5 Years | 140 (61.7%) | 707 (100.0%) |
| 5 Years | 33 (100.0%) | 0 (0.0%) |
| 6 to 11 Years | 202 (100.0%) | 0 (0.0%) |
| 12 to 14 Years | 0 (0.0%) | 0 (0.0%) |
| 15 Years | 0 (0.0%) | 0 (0.0%) |
| 16 and 17 Years | 88 (64.2%) | 41 (100.0%) |
| 18 to 24 Years | 326 (100.0%) | 754 (100.0%) |
| 25 to 34 Years | 501 (95.6%) | 861 (94.3%) |
| 35 to 44 Years | 1,440 (94.7%) | 1,415 (95.2%) |
| 45 to 54 Years | 1,191 (100.0%) | 1,016 (100.0%) |
| 55 to 64 Years | 215 (100.0%) | 91 (65.9%) |
| 65 to 74 Years | 241 (100.0%) | 232 (100.0%) |
| 75 Years and over | 141 (100.0%) | 229 (100.0%) |
| Total | 4,518 (95.0%) | 5,346 (96.9%) |
Income Below Poverty Among Married-Couple Families in Marina Del Rey
The poverty statistics for married-couple families in Marina Del Rey show that 3.6% or 71 of the total 1,980 families live below the poverty line. Families with 1 or 2 children have the highest poverty rate of 8.7%, comprising of 71 families. On the other hand, families with no children have the lowest poverty rate of 0.0%, which includes 0 families.
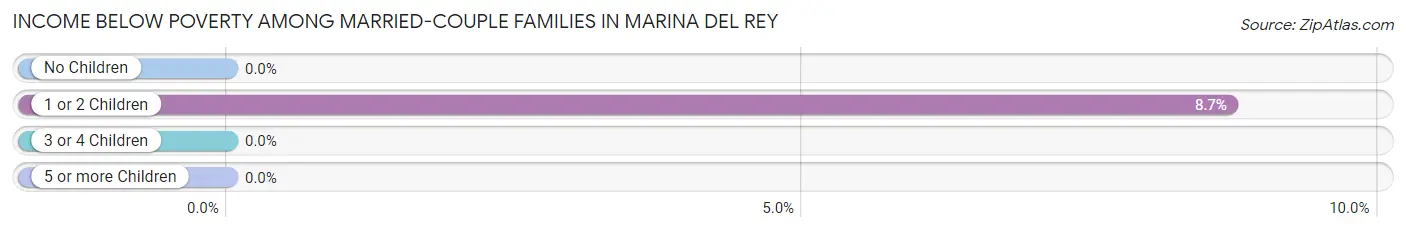
| Children | Above Poverty | Below Poverty |
| No Children | 1,165 (100.0%) | 0 (0.0%) |
| 1 or 2 Children | 744 (91.3%) | 71 (8.7%) |
| 3 or 4 Children | 0 (0.0%) | 0 (0.0%) |
| 5 or more Children | 0 (0.0%) | 0 (0.0%) |
| Total | 1,909 (96.4%) | 71 (3.6%) |
Income Below Poverty Among Single-Parent Households in Marina Del Rey
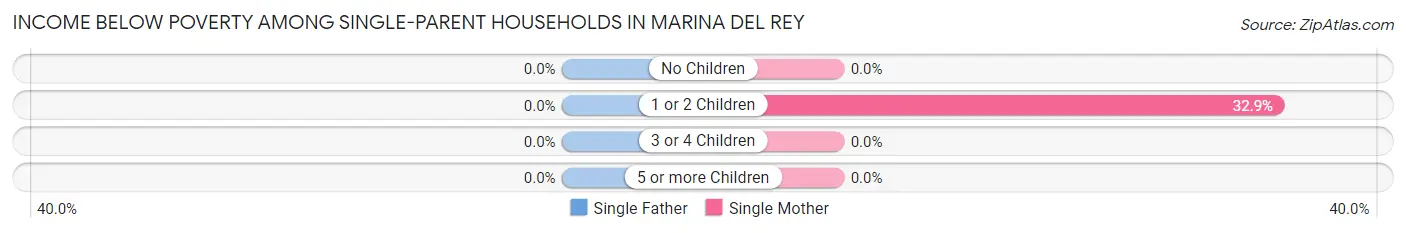
| Children | Single Father | Single Mother |
| No Children | 0 (0.0%) | 0 (0.0%) |
| 1 or 2 Children | 0 (0.0%) | 47 (32.9%) |
| 3 or 4 Children | 0 (0.0%) | 0 (0.0%) |
| 5 or more Children | 0 (0.0%) | 0 (0.0%) |
| Total | 0 (0.0%) | 47 (26.0%) |
Income Below Poverty Among Married-Couple vs Single-Parent Households in Marina Del Rey
The poverty data for Marina Del Rey shows that 71 of the married-couple family households (3.6%) and 47 of the single-parent households (15.0%) are living below the poverty level. Within the married-couple family households, those with 1 or 2 children have the highest poverty rate, with 71 households (8.7%) falling below the poverty line. Among the single-parent households, those with 1 or 2 children have the highest poverty rate, with 47 household (18.4%) living below poverty.
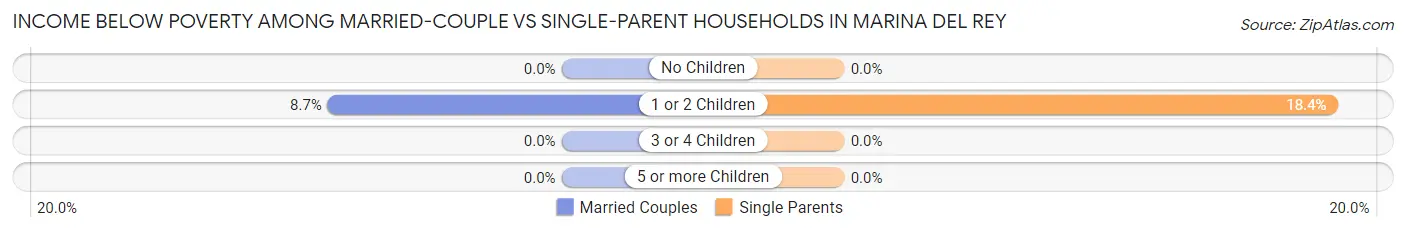
| Children | Married-Couple Families | Single-Parent Households |
| No Children | 0 (0.0%) | 0 (0.0%) |
| 1 or 2 Children | 71 (8.7%) | 47 (18.4%) |
| 3 or 4 Children | 0 (0.0%) | 0 (0.0%) |
| 5 or more Children | 0 (0.0%) | 0 (0.0%) |
| Total | 71 (3.6%) | 47 (15.0%) |
Race in Marina Del Rey
The most populous races in Marina Del Rey are White / Caucasian (7,515 | 73.2%), Asian (1,044 | 10.2%), and Two or more Races (893 | 8.7%).
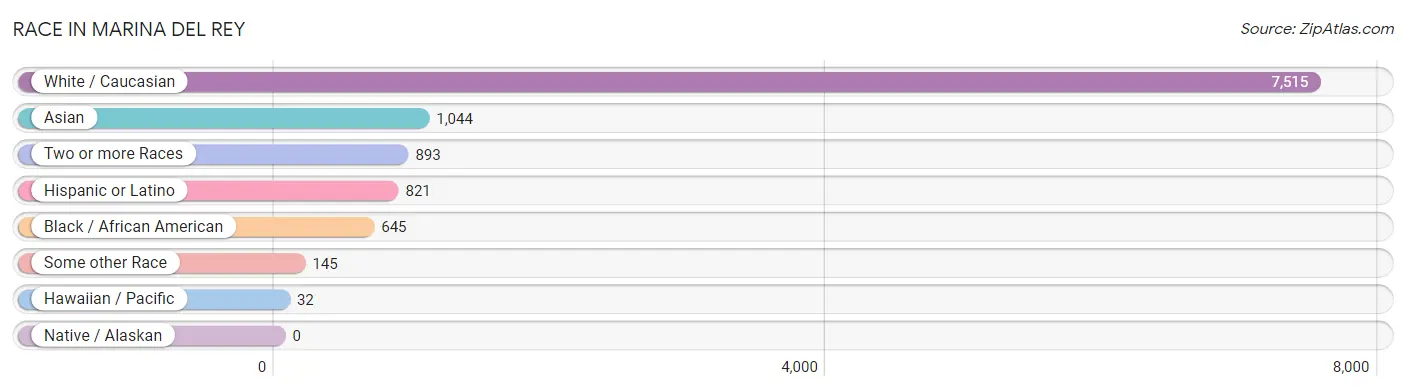
| Race | # Population | % Population |
| Asian | 1,044 | 10.2% |
| Black / African American | 645 | 6.3% |
| Hawaiian / Pacific | 32 | 0.3% |
| Hispanic or Latino | 821 | 8.0% |
| Native / Alaskan | 0 | 0.0% |
| White / Caucasian | 7,515 | 73.2% |
| Two or more Races | 893 | 8.7% |
| Some other Race | 145 | 1.4% |
| Total | 10,274 | 100.0% |
Ancestry in Marina Del Rey
The most populous ancestries reported in Marina Del Rey are Irish (1,301 | 12.7%), American (1,221 | 11.9%), Italian (1,168 | 11.4%), European (1,036 | 10.1%), and English (980 | 9.5%), together accounting for 55.5% of all Marina Del Rey residents.
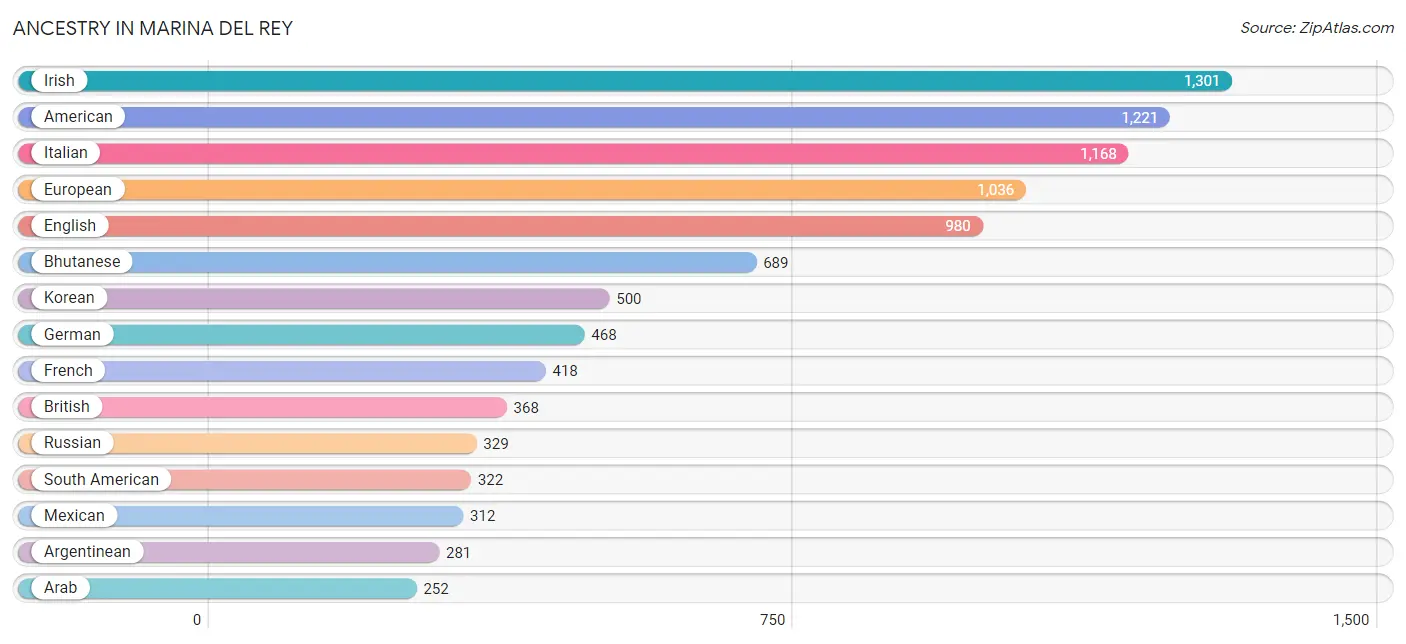
| Ancestry | # Population | % Population |
| African | 37 | 0.4% |
| Albanian | 54 | 0.5% |
| American | 1,221 | 11.9% |
| Arab | 252 | 2.5% |
| Argentinean | 281 | 2.7% |
| Armenian | 29 | 0.3% |
| Assyrian / Chaldean / Syriac | 38 | 0.4% |
| Belgian | 90 | 0.9% |
| Bhutanese | 689 | 6.7% |
| Brazilian | 25 | 0.2% |
| British | 368 | 3.6% |
| British West Indian | 24 | 0.2% |
| Burmese | 60 | 0.6% |
| Canadian | 18 | 0.2% |
| Central American | 23 | 0.2% |
| Chickasaw | 19 | 0.2% |
| Chilean | 41 | 0.4% |
| Costa Rican | 23 | 0.2% |
| Croatian | 21 | 0.2% |
| Danish | 73 | 0.7% |
| Eastern European | 55 | 0.5% |
| English | 980 | 9.5% |
| European | 1,036 | 10.1% |
| Finnish | 30 | 0.3% |
| French | 418 | 4.1% |
| French Canadian | 25 | 0.2% |
| German | 468 | 4.6% |
| Greek | 64 | 0.6% |
| Hungarian | 95 | 0.9% |
| Indian (Asian) | 129 | 1.3% |
| Iranian | 47 | 0.5% |
| Iraqi | 38 | 0.4% |
| Irish | 1,301 | 12.7% |
| Israeli | 85 | 0.8% |
| Italian | 1,168 | 11.4% |
| Korean | 500 | 4.9% |
| Laotian | 47 | 0.5% |
| Lebanese | 214 | 2.1% |
| Mexican | 312 | 3.0% |
| Northern European | 63 | 0.6% |
| Norwegian | 126 | 1.2% |
| Pakistani | 42 | 0.4% |
| Polish | 108 | 1.1% |
| Puerto Rican | 56 | 0.5% |
| Romanian | 44 | 0.4% |
| Russian | 329 | 3.2% |
| Scotch-Irish | 25 | 0.2% |
| Scottish | 172 | 1.7% |
| Slavic | 52 | 0.5% |
| Slovene | 28 | 0.3% |
| South American | 322 | 3.1% |
| Spaniard | 83 | 0.8% |
| Spanish | 25 | 0.2% |
| Subsaharan African | 154 | 1.5% |
| Sudanese | 117 | 1.1% |
| Swedish | 32 | 0.3% |
| Swiss | 241 | 2.4% |
| Thai | 127 | 1.2% |
| Tongan | 32 | 0.3% |
| Ukrainian | 99 | 1.0% |
| Welsh | 62 | 0.6% |
| Yaqui | 30 | 0.3% | View All 62 Rows |
Immigrants in Marina Del Rey
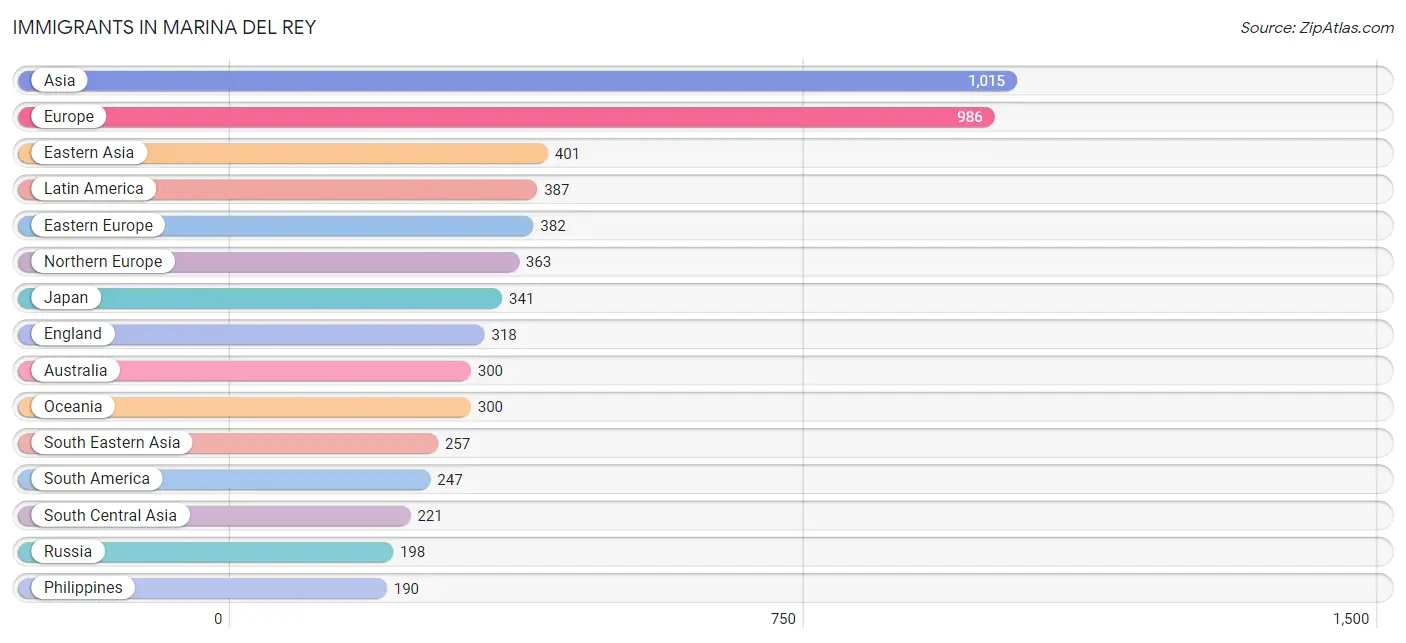
The most numerous immigrant groups reported in Marina Del Rey came from Asia (1,015 | 9.9%), Europe (986 | 9.6%), Eastern Asia (401 | 3.9%), Latin America (387 | 3.8%), and Eastern Europe (382 | 3.7%), together accounting for 30.9% of all Marina Del Rey residents.
| Immigration Origin | # Population | % Population |
| Africa | 24 | 0.2% |
| Albania | 54 | 0.5% |
| Argentina | 152 | 1.5% |
| Armenia | 29 | 0.3% |
| Asia | 1,015 | 9.9% |
| Australia | 300 | 2.9% |
| Belgium | 90 | 0.9% |
| Brazil | 54 | 0.5% |
| Canada | 147 | 1.4% |
| Central America | 140 | 1.4% |
| Chile | 41 | 0.4% |
| Costa Rica | 23 | 0.2% |
| Eastern Africa | 24 | 0.2% |
| Eastern Asia | 401 | 3.9% |
| Eastern Europe | 382 | 3.7% |
| England | 318 | 3.1% |
| Europe | 986 | 9.6% |
| Germany | 53 | 0.5% |
| India | 107 | 1.0% |
| Indonesia | 47 | 0.5% |
| Iran | 94 | 0.9% |
| Ireland | 20 | 0.2% |
| Japan | 341 | 3.3% |
| Kazakhstan | 20 | 0.2% |
| Korea | 60 | 0.6% |
| Latin America | 387 | 3.8% |
| Latvia | 19 | 0.2% |
| Lebanon | 107 | 1.0% |
| Mexico | 117 | 1.1% |
| Northern Europe | 363 | 3.5% |
| Oceania | 300 | 2.9% |
| Philippines | 190 | 1.8% |
| Poland | 31 | 0.3% |
| Russia | 198 | 1.9% |
| South America | 247 | 2.4% |
| South Central Asia | 221 | 2.1% |
| South Eastern Asia | 257 | 2.5% |
| Southern Europe | 63 | 0.6% |
| Spain | 63 | 0.6% |
| Switzerland | 35 | 0.3% |
| Thailand | 20 | 0.2% |
| Ukraine | 80 | 0.8% |
| Western Asia | 136 | 1.3% |
| Western Europe | 178 | 1.7% | View All 44 Rows |
Sex and Age in Marina Del Rey
Sex and Age in Marina Del Rey
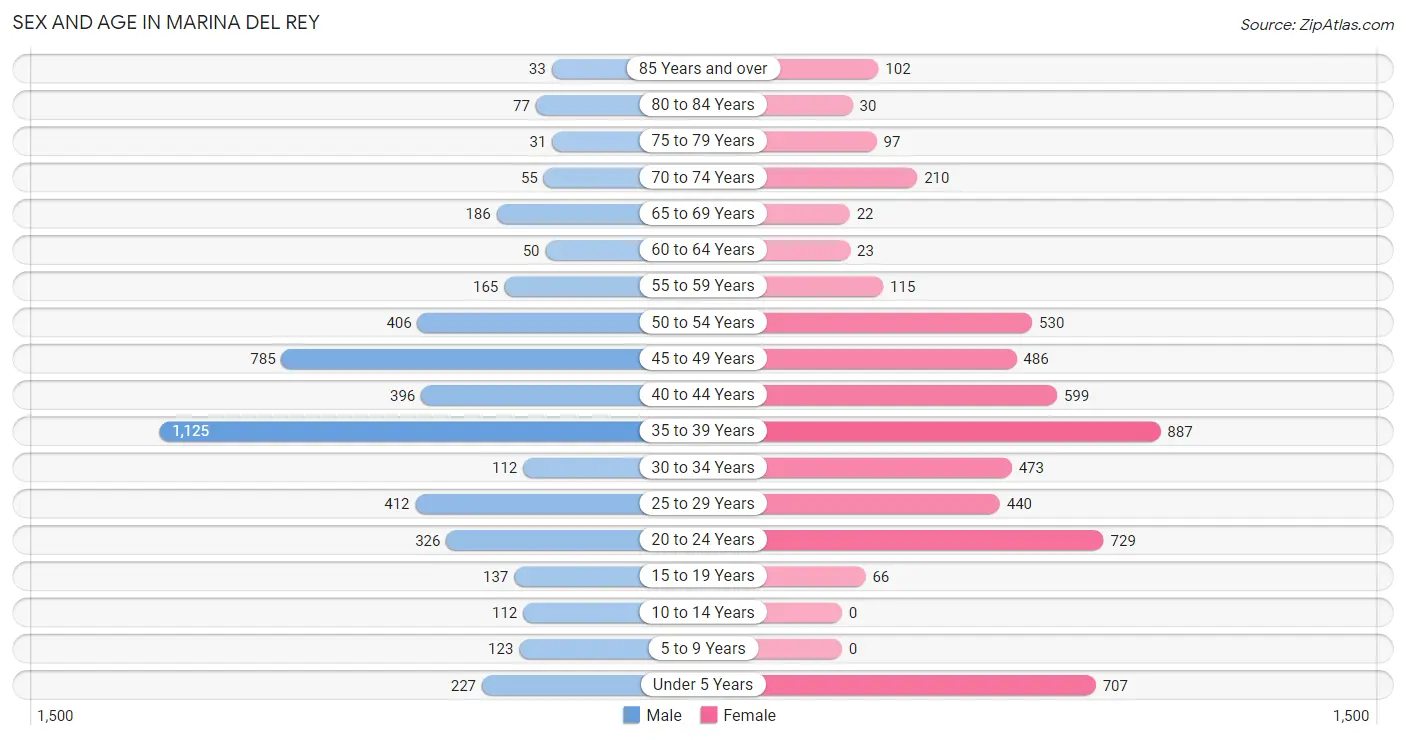
The most populous age groups in Marina Del Rey are 35 to 39 Years (1,125 | 23.6%) for men and 35 to 39 Years (887 | 16.1%) for women.
| Age Bracket | Male | Female |
| Under 5 Years | 227 (4.8%) | 707 (12.8%) |
| 5 to 9 Years | 123 (2.6%) | 0 (0.0%) |
| 10 to 14 Years | 112 (2.4%) | 0 (0.0%) |
| 15 to 19 Years | 137 (2.9%) | 66 (1.2%) |
| 20 to 24 Years | 326 (6.9%) | 729 (13.2%) |
| 25 to 29 Years | 412 (8.7%) | 440 (8.0%) |
| 30 to 34 Years | 112 (2.4%) | 473 (8.6%) |
| 35 to 39 Years | 1,125 (23.6%) | 887 (16.1%) |
| 40 to 44 Years | 396 (8.3%) | 599 (10.9%) |
| 45 to 49 Years | 785 (16.5%) | 486 (8.8%) |
| 50 to 54 Years | 406 (8.5%) | 530 (9.6%) |
| 55 to 59 Years | 165 (3.5%) | 115 (2.1%) |
| 60 to 64 Years | 50 (1.1%) | 23 (0.4%) |
| 65 to 69 Years | 186 (3.9%) | 22 (0.4%) |
| 70 to 74 Years | 55 (1.2%) | 210 (3.8%) |
| 75 to 79 Years | 31 (0.6%) | 97 (1.8%) |
| 80 to 84 Years | 77 (1.6%) | 30 (0.5%) |
| 85 Years and over | 33 (0.7%) | 102 (1.8%) |
| Total | 4,758 (100.0%) | 5,516 (100.0%) |
Families and Households in Marina Del Rey
Median Family Size in Marina Del Rey
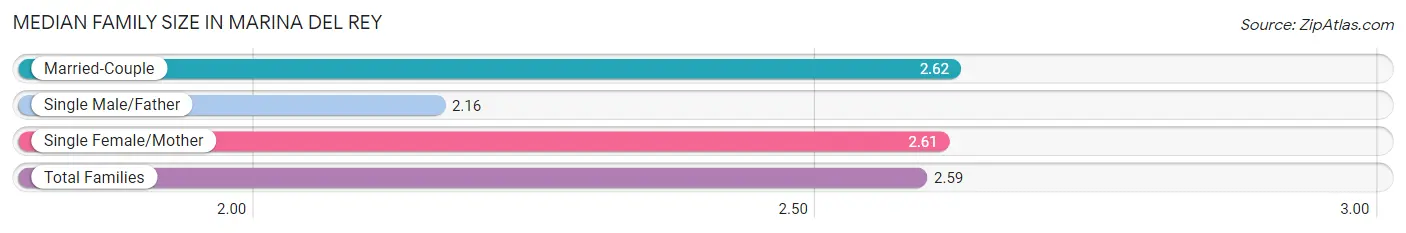
The median family size in Marina Del Rey is 2.59 persons per family, with married-couple families (1,980 | 86.4%) accounting for the largest median family size of 2.62 persons per family. On the other hand, single male/father families (132 | 5.8%) represent the smallest median family size with 2.16 persons per family.
| Family Type | # Families | Family Size |
| Married-Couple | 1,980 (86.4%) | 2.62 |
| Single Male/Father | 132 (5.8%) | 2.16 |
| Single Female/Mother | 181 (7.9%) | 2.61 |
| Total Families | 2,293 (100.0%) | 2.59 |
Median Household Size in Marina Del Rey
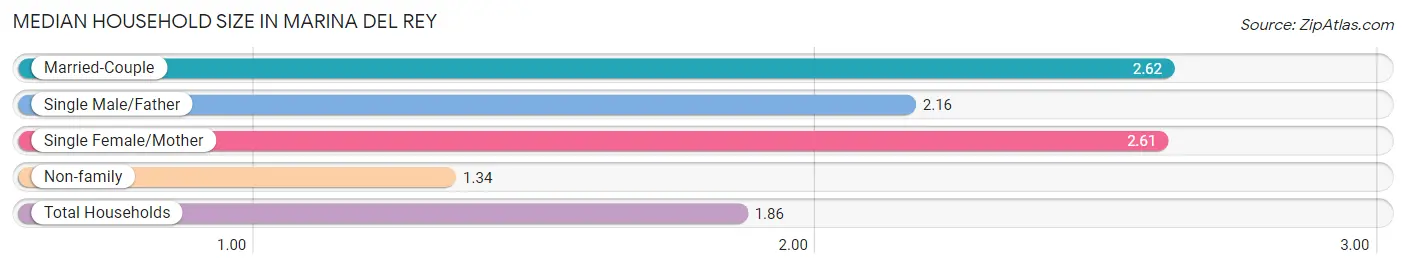
The median household size in Marina Del Rey is 1.86 persons per household, with married-couple households (1,980 | 35.9%) accounting for the largest median household size of 2.62 persons per household. non-family households (3,218 | 58.4%) represent the smallest median household size with 1.34 persons per household.
| Household Type | # Households | Household Size |
| Married-Couple | 1,980 (35.9%) | 2.62 |
| Single Male/Father | 132 (2.4%) | 2.16 |
| Single Female/Mother | 181 (3.3%) | 2.61 |
| Non-family | 3,218 (58.4%) | 1.34 |
| Total Households | 5,511 (100.0%) | 1.86 |
Household Size by Marriage Status in Marina Del Rey
Out of a total of 5,511 households in Marina Del Rey, 2,293 (41.6%) are family households, while 3,218 (58.4%) are nonfamily households. The most numerous type of family households are 2-person households, comprising 1,264, and the most common type of nonfamily households are 1-person households, comprising 2,167.
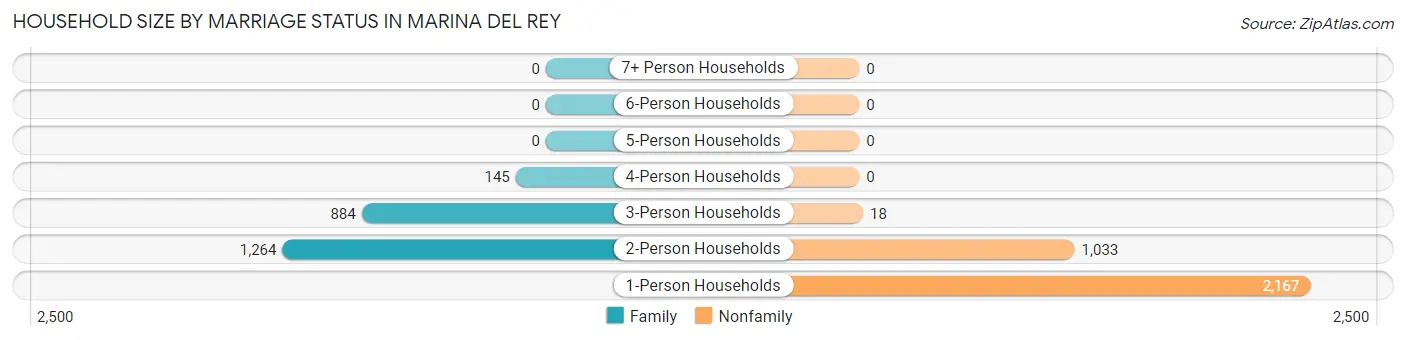
| Household Size | Family Households | Nonfamily Households |
| 1-Person Households | - | 2,167 (39.3%) |
| 2-Person Households | 1,264 (22.9%) | 1,033 (18.7%) |
| 3-Person Households | 884 (16.0%) | 18 (0.3%) |
| 4-Person Households | 145 (2.6%) | 0 (0.0%) |
| 5-Person Households | 0 (0.0%) | 0 (0.0%) |
| 6-Person Households | 0 (0.0%) | 0 (0.0%) |
| 7+ Person Households | 0 (0.0%) | 0 (0.0%) |
| Total | 2,293 (41.6%) | 3,218 (58.4%) |
Female Fertility in Marina Del Rey
Fertility by Age in Marina Del Rey
Average fertility rate in Marina Del Rey is 54.0 births per 1,000 women. Women in the age bracket of 35 to 50 years have the highest fertility rate with 99.0 births per 1,000 women. Women in the age bracket of 35 to 50 years acount for 100.0% of all women with births.
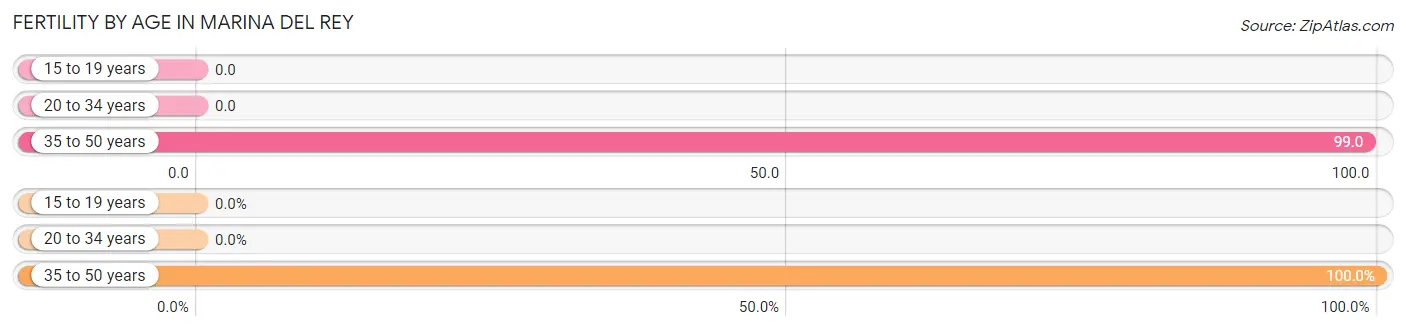
| Age Bracket | Women with Births | Births / 1,000 Women |
| 15 to 19 years | 0 (0.0%) | 0.0 |
| 20 to 34 years | 0 (0.0%) | 0.0 |
| 35 to 50 years | 200 (100.0%) | 99.0 |
| Total | 200 (100.0%) | 54.0 |
Fertility by Age by Marriage Status in Marina Del Rey
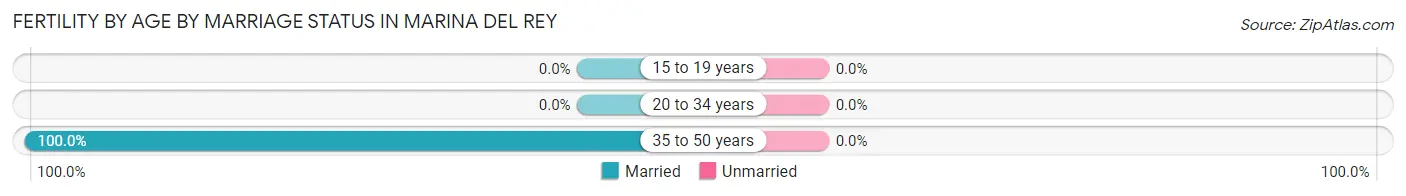
| Age Bracket | Married | Unmarried |
| 15 to 19 years | 0 (0.0%) | 0 (0.0%) |
| 20 to 34 years | 0 (0.0%) | 0 (0.0%) |
| 35 to 50 years | 200 (100.0%) | 0 (0.0%) |
| Total | 200 (100.0%) | 0 (0.0%) |
Fertility by Education in Marina Del Rey
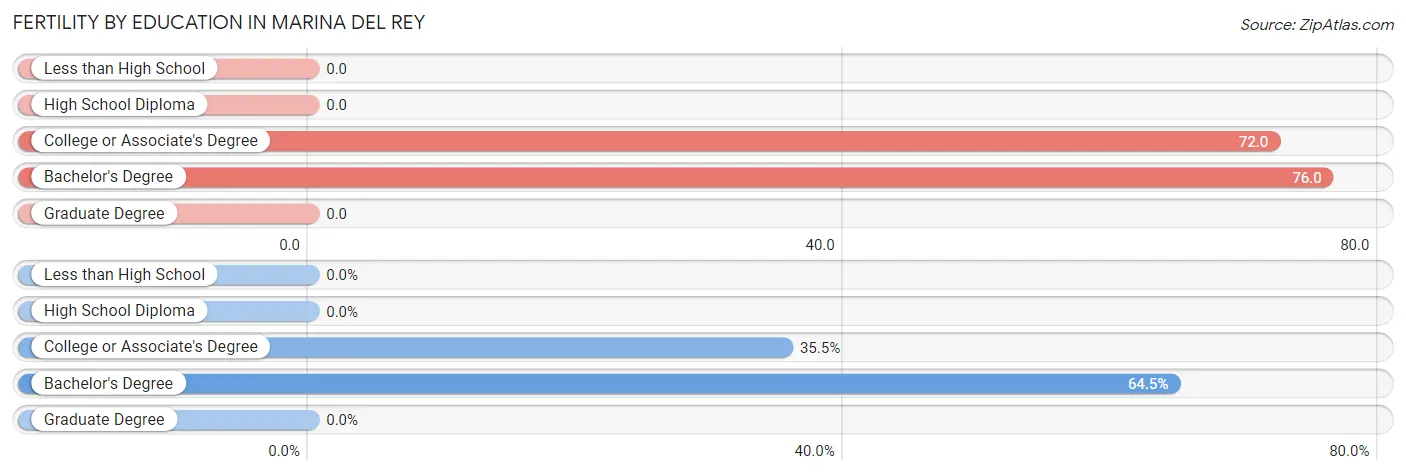
| Educational Attainment | Women with Births | Births / 1,000 Women |
| Less than High School | 0 (0.0%) | 0.0 |
| High School Diploma | 0 (0.0%) | 0.0 |
| College or Associate's Degree | 71 (35.5%) | 72.0 |
| Bachelor's Degree | 129 (64.5%) | 76.0 |
| Graduate Degree | 0 (0.0%) | 0.0 |
| Total | 200 (100.0%) | 54.0 |
Fertility by Education by Marriage Status in Marina Del Rey
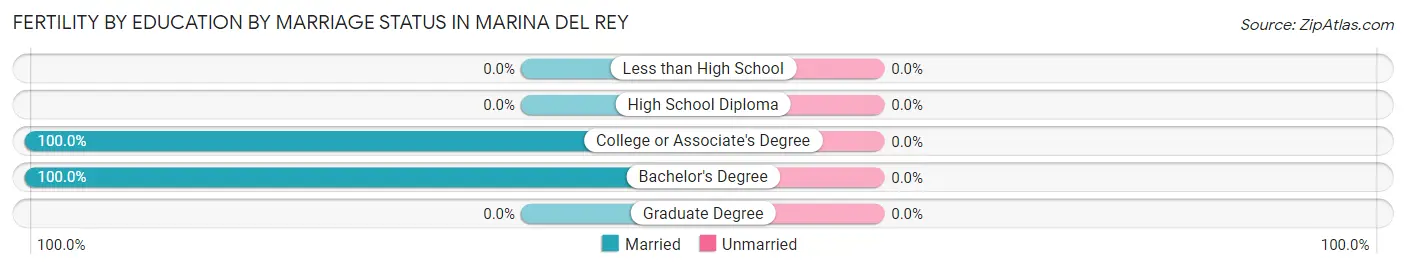
| Educational Attainment | Married | Unmarried |
| Less than High School | 0 (0.0%) | 0 (0.0%) |
| High School Diploma | 0 (0.0%) | 0 (0.0%) |
| College or Associate's Degree | 71 (100.0%) | 0 (0.0%) |
| Bachelor's Degree | 129 (100.0%) | 0 (0.0%) |
| Graduate Degree | 0 (0.0%) | 0 (0.0%) |
| Total | 200 (100.0%) | 0 (0.0%) |
Employment Characteristics in Marina Del Rey
Employment by Class of Employer in Marina Del Rey
Among the 7,082 employed individuals in Marina Del Rey, private company employees (5,071 | 71.6%), self-employed (not incorporated) (898 | 12.7%), and self-employed (incorporated) (441 | 6.2%) make up the most common classes of employment.
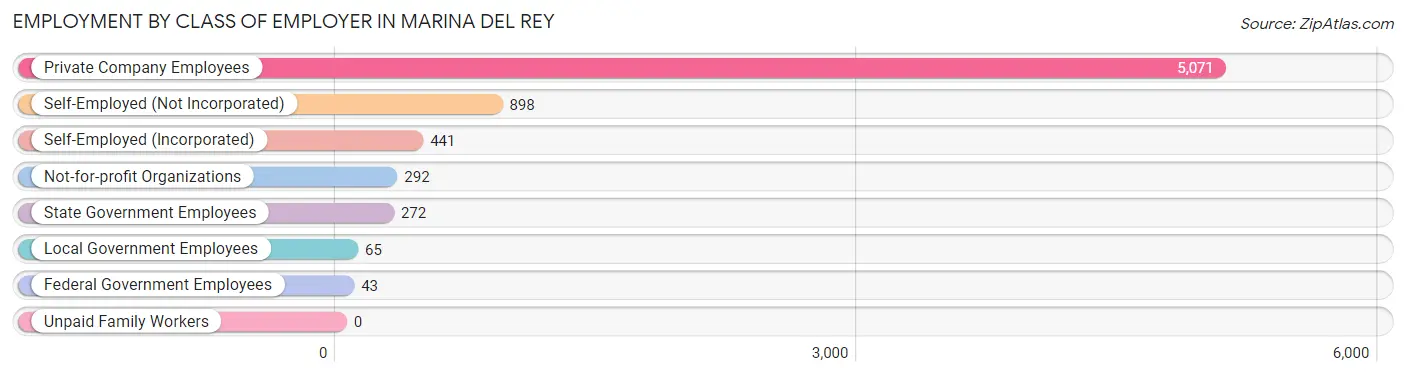
| Employer Class | # Employees | % Employees |
| Private Company Employees | 5,071 | 71.6% |
| Self-Employed (Incorporated) | 441 | 6.2% |
| Self-Employed (Not Incorporated) | 898 | 12.7% |
| Not-for-profit Organizations | 292 | 4.1% |
| Local Government Employees | 65 | 0.9% |
| State Government Employees | 272 | 3.8% |
| Federal Government Employees | 43 | 0.6% |
| Unpaid Family Workers | 0 | 0.0% |
| Total | 7,082 | 100.0% |
Employment Status by Age in Marina Del Rey
According to the labor force statistics for Marina Del Rey, out of the total population over 16 years of age (9,105), 86.4% or 7,867 individuals are in the labor force, with 5.2% or 409 of them unemployed. The age group with the highest labor force participation rate is 55 to 59 years, with 100.0% or 280 individuals in the labor force. Within the labor force, the 30 to 34 years age range has the highest percentage of unemployed individuals, with 11.2% or 63 of them being unemployed.
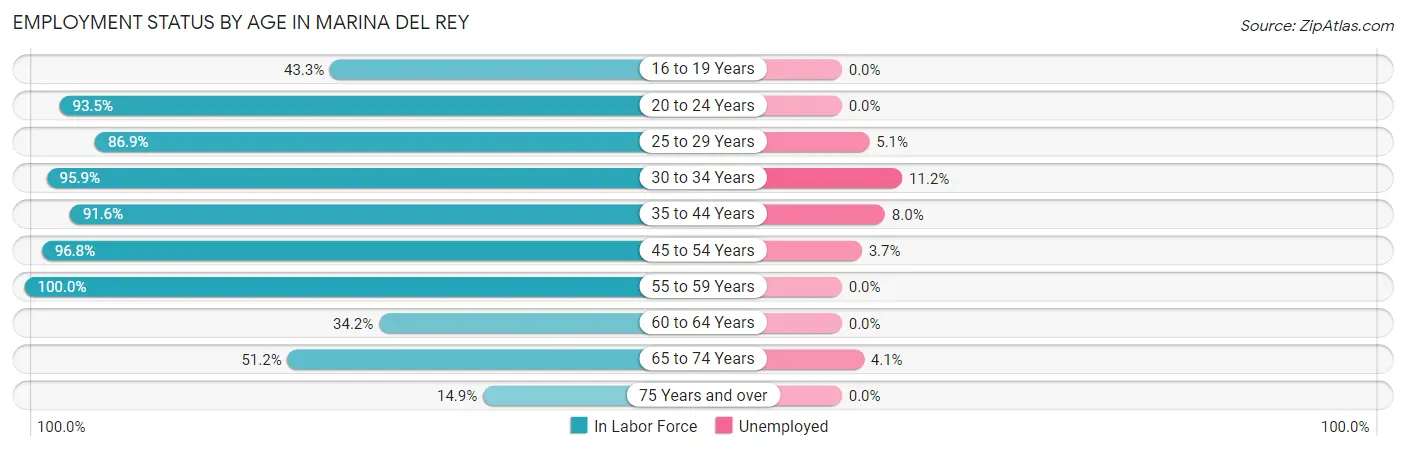
| Age Bracket | In Labor Force | Unemployed |
| 16 to 19 Years | 88 (43.3%) | 0 (0.0%) |
| 20 to 24 Years | 986 (93.5%) | 0 (0.0%) |
| 25 to 29 Years | 740 (86.9%) | 38 (5.1%) |
| 30 to 34 Years | 561 (95.9%) | 63 (11.2%) |
| 35 to 44 Years | 2,754 (91.6%) | 220 (8.0%) |
| 45 to 54 Years | 2,136 (96.8%) | 79 (3.7%) |
| 55 to 59 Years | 280 (100.0%) | 0 (0.0%) |
| 60 to 64 Years | 25 (34.2%) | 0 (0.0%) |
| 65 to 74 Years | 242 (51.2%) | 10 (4.1%) |
| 75 Years and over | 55 (14.9%) | 0 (0.0%) |
| Total | 7,867 (86.4%) | 409 (5.2%) |
Employment Status by Educational Attainment in Marina Del Rey
According to labor force statistics for Marina Del Rey, 92.8% of individuals (6,500) out of the total population between 25 and 64 years of age (7,004) are in the labor force, with 6.1% or 396 of them being unemployed. The group with the highest labor force participation rate are those with the educational attainment of less than high school, with 100.0% or 32 individuals in the labor force. Within the labor force, individuals with college / associate degree education have the highest percentage of unemployment, with 8.0% or 102 of them being unemployed.
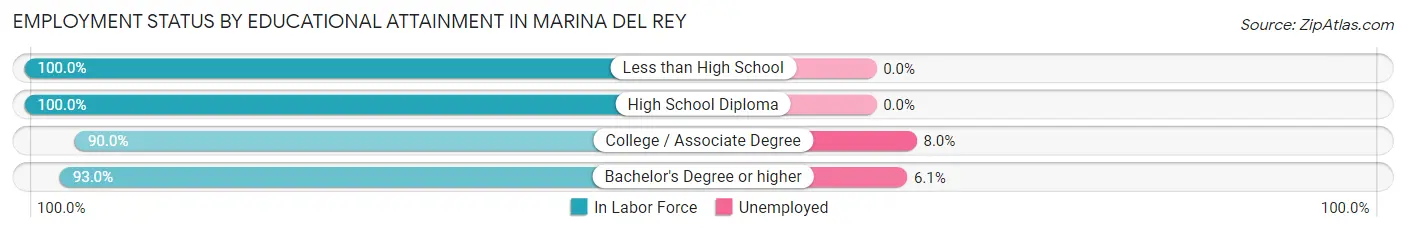
| Educational Attainment | In Labor Force | Unemployed |
| Less than High School | 32 (100.0%) | 0 (0.0%) |
| High School Diploma | 321 (100.0%) | 0 (0.0%) |
| College / Associate Degree | 1,269 (90.0%) | 113 (8.0%) |
| Bachelor's Degree or higher | 4,874 (93.0%) | 320 (6.1%) |
| Total | 6,500 (92.8%) | 427 (6.1%) |
Employment Occupations by Sex in Marina Del Rey
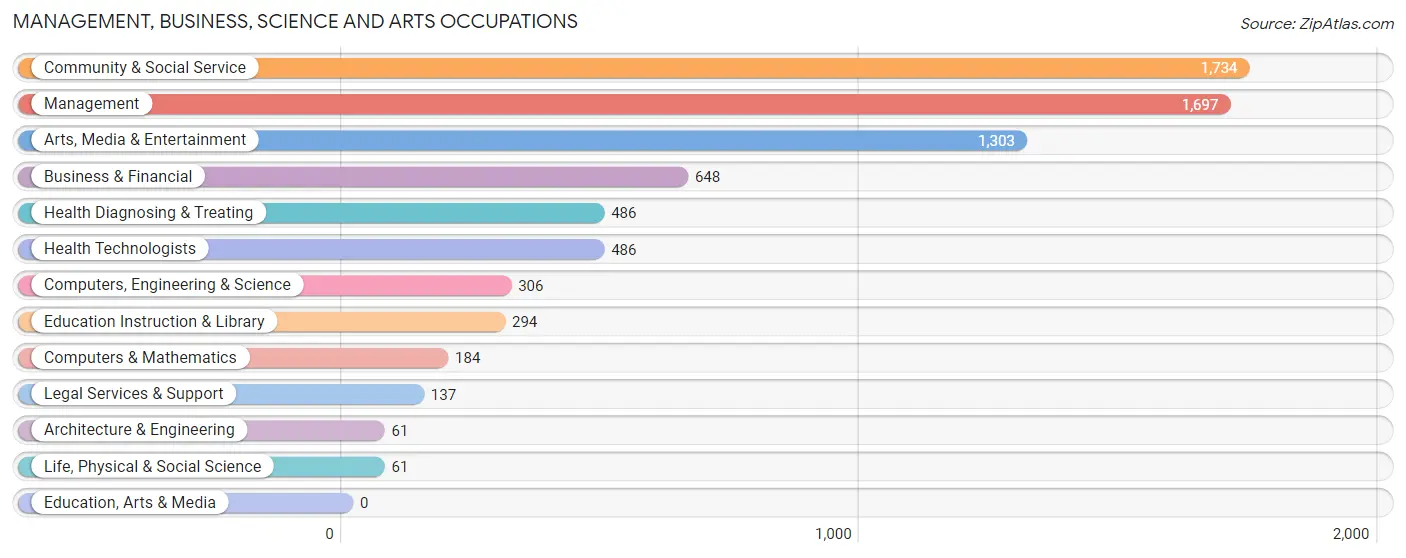
Management, Business, Science and Arts Occupations
The most common Management, Business, Science and Arts occupations in Marina Del Rey are Community & Social Service (1,734 | 23.3%), Management (1,697 | 22.8%), Arts, Media & Entertainment (1,303 | 17.5%), Business & Financial (648 | 8.7%), and Health Diagnosing & Treating (486 | 6.5%).
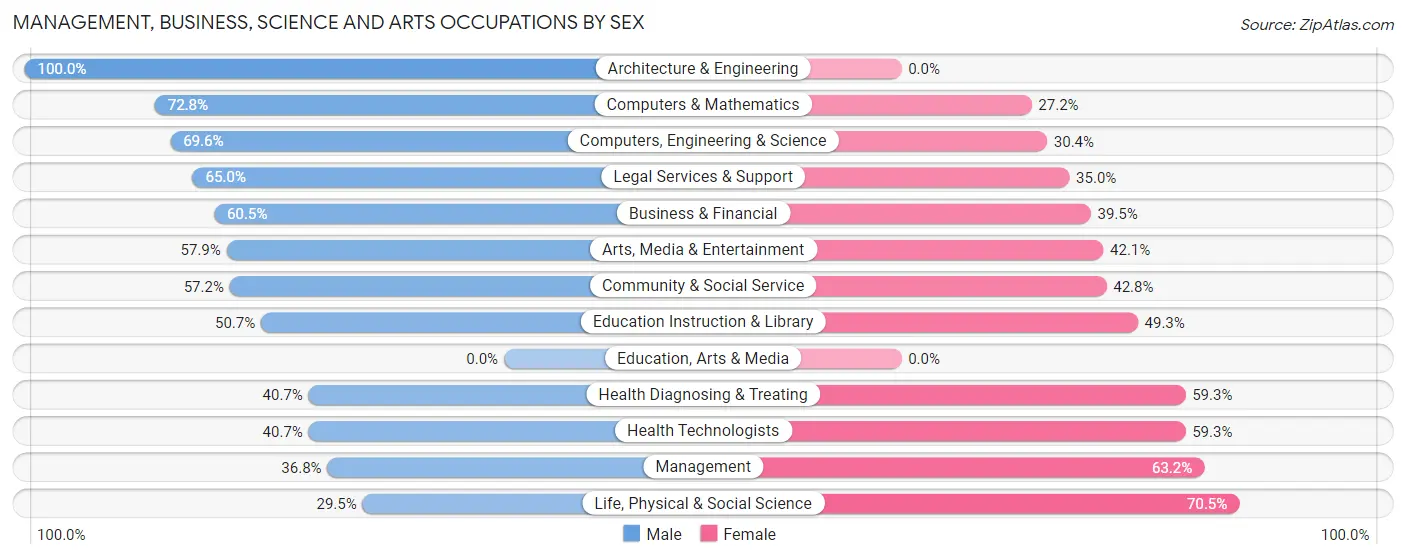
Management, Business, Science and Arts Occupations by Sex
Within the Management, Business, Science and Arts occupations in Marina Del Rey, the most male-oriented occupations are Architecture & Engineering (100.0%), Computers & Mathematics (72.8%), and Computers, Engineering & Science (69.6%), while the most female-oriented occupations are Life, Physical & Social Science (70.5%), Management (63.2%), and Health Diagnosing & Treating (59.3%).
| Occupation | Male | Female |
| Management | 625 (36.8%) | 1,072 (63.2%) |
| Business & Financial | 392 (60.5%) | 256 (39.5%) |
| Computers, Engineering & Science | 213 (69.6%) | 93 (30.4%) |
| Computers & Mathematics | 134 (72.8%) | 50 (27.2%) |
| Architecture & Engineering | 61 (100.0%) | 0 (0.0%) |
| Life, Physical & Social Science | 18 (29.5%) | 43 (70.5%) |
| Community & Social Service | 992 (57.2%) | 742 (42.8%) |
| Education, Arts & Media | 0 (0.0%) | 0 (0.0%) |
| Legal Services & Support | 89 (65.0%) | 48 (35.0%) |
| Education Instruction & Library | 149 (50.7%) | 145 (49.3%) |
| Arts, Media & Entertainment | 754 (57.9%) | 549 (42.1%) |
| Health Diagnosing & Treating | 198 (40.7%) | 288 (59.3%) |
| Health Technologists | 198 (40.7%) | 288 (59.3%) |
| Total (Category) | 2,420 (49.7%) | 2,451 (50.3%) |
| Total (Overall) | 3,750 (50.3%) | 3,709 (49.7%) |
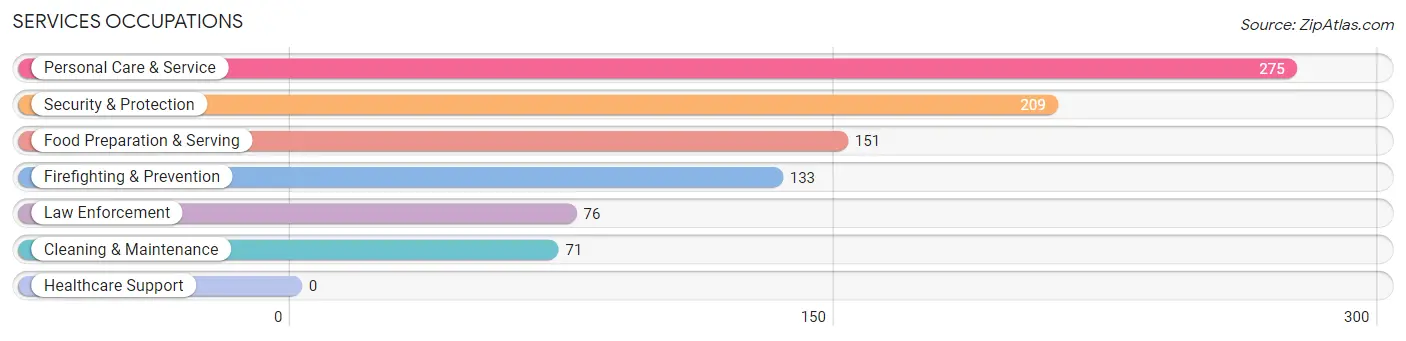
Services Occupations
The most common Services occupations in Marina Del Rey are Personal Care & Service (275 | 3.7%), Security & Protection (209 | 2.8%), Food Preparation & Serving (151 | 2.0%), Firefighting & Prevention (133 | 1.8%), and Law Enforcement (76 | 1.0%).
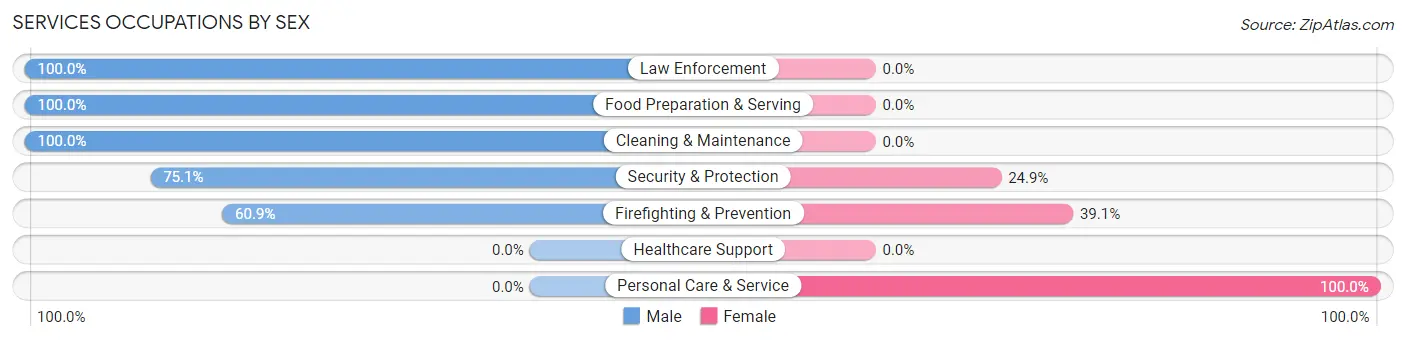
Services Occupations by Sex
Within the Services occupations in Marina Del Rey, the most male-oriented occupations are Law Enforcement (100.0%), Food Preparation & Serving (100.0%), and Cleaning & Maintenance (100.0%), while the most female-oriented occupations are Personal Care & Service (100.0%), Firefighting & Prevention (39.1%), and Security & Protection (24.9%).
| Occupation | Male | Female |
| Healthcare Support | 0 (0.0%) | 0 (0.0%) |
| Security & Protection | 157 (75.1%) | 52 (24.9%) |
| Firefighting & Prevention | 81 (60.9%) | 52 (39.1%) |
| Law Enforcement | 76 (100.0%) | 0 (0.0%) |
| Food Preparation & Serving | 151 (100.0%) | 0 (0.0%) |
| Cleaning & Maintenance | 71 (100.0%) | 0 (0.0%) |
| Personal Care & Service | 0 (0.0%) | 275 (100.0%) |
| Total (Category) | 379 (53.7%) | 327 (46.3%) |
| Total (Overall) | 3,750 (50.3%) | 3,709 (49.7%) |
Sales and Office Occupations
The most common Sales and Office occupations in Marina Del Rey are Office & Administration (761 | 10.2%), and Sales & Related (484 | 6.5%).
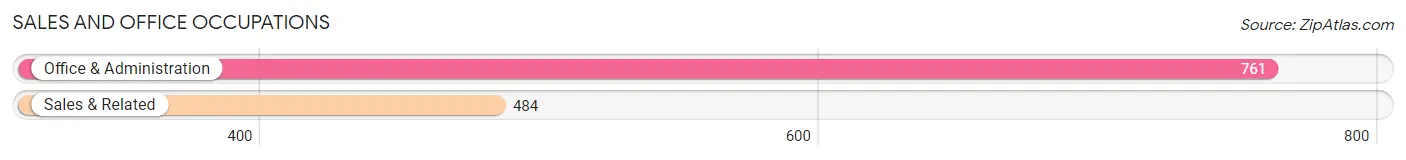
Sales and Office Occupations by Sex
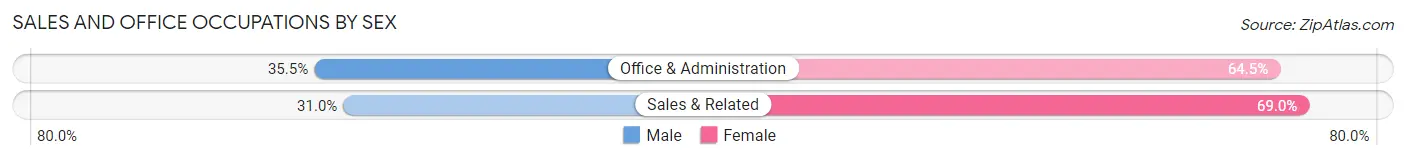
| Occupation | Male | Female |
| Sales & Related | 150 (31.0%) | 334 (69.0%) |
| Office & Administration | 270 (35.5%) | 491 (64.5%) |
| Total (Category) | 420 (33.7%) | 825 (66.3%) |
| Total (Overall) | 3,750 (50.3%) | 3,709 (49.7%) |
Natural Resources, Construction and Maintenance Occupations
The most common Natural Resources, Construction and Maintenance occupations in Marina Del Rey are Installation, Maintenance & Repair (190 | 2.5%), and Construction & Extraction (179 | 2.4%).
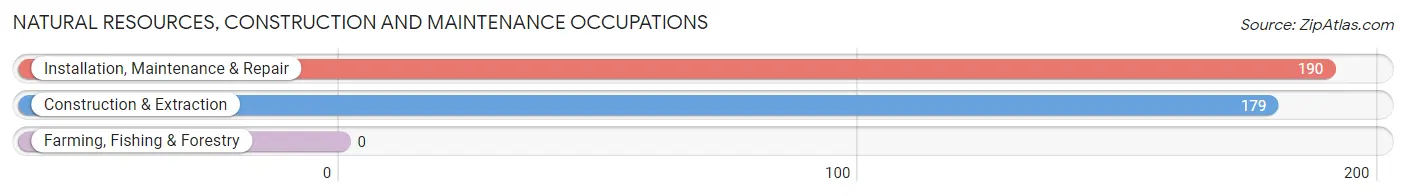
Natural Resources, Construction and Maintenance Occupations by Sex
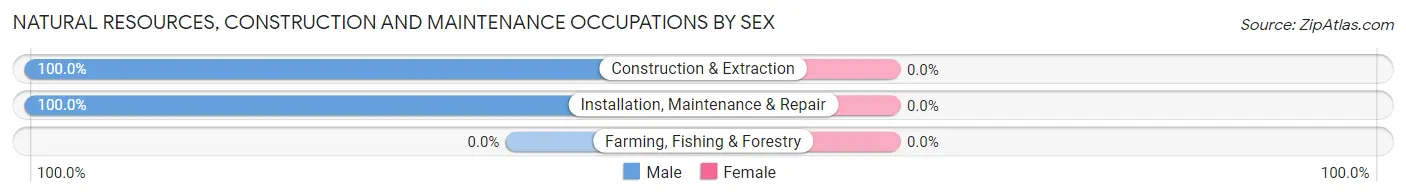
| Occupation | Male | Female |
| Farming, Fishing & Forestry | 0 (0.0%) | 0 (0.0%) |
| Construction & Extraction | 179 (100.0%) | 0 (0.0%) |
| Installation, Maintenance & Repair | 190 (100.0%) | 0 (0.0%) |
| Total (Category) | 369 (100.0%) | 0 (0.0%) |
| Total (Overall) | 3,750 (50.3%) | 3,709 (49.7%) |
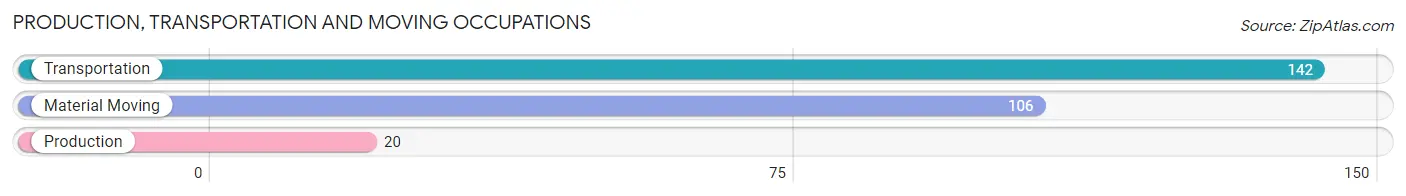
Production, Transportation and Moving Occupations
The most common Production, Transportation and Moving occupations in Marina Del Rey are Transportation (142 | 1.9%), Material Moving (106 | 1.4%), and Production (20 | 0.3%).
Production, Transportation and Moving Occupations by Sex
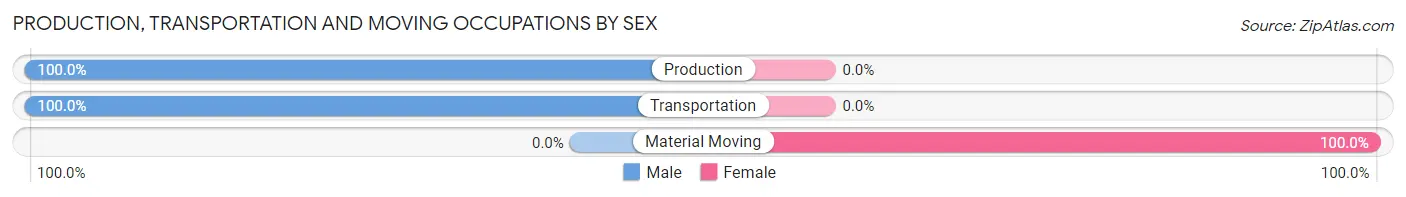
| Occupation | Male | Female |
| Production | 20 (100.0%) | 0 (0.0%) |
| Transportation | 142 (100.0%) | 0 (0.0%) |
| Material Moving | 0 (0.0%) | 106 (100.0%) |
| Total (Category) | 162 (60.5%) | 106 (39.6%) |
| Total (Overall) | 3,750 (50.3%) | 3,709 (49.7%) |
Employment Industries by Sex in Marina Del Rey
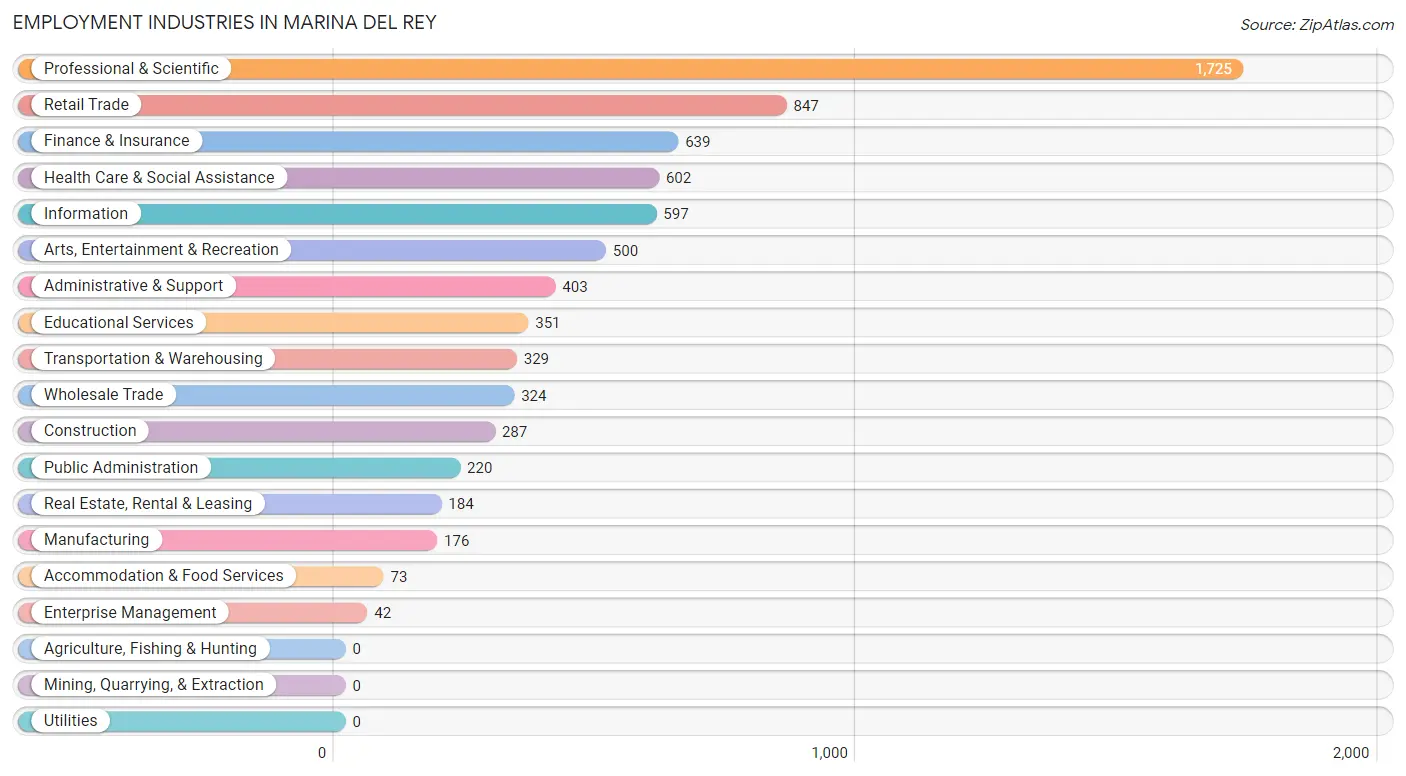
Employment Industries in Marina Del Rey
The major employment industries in Marina Del Rey include Professional & Scientific (1,725 | 23.1%), Retail Trade (847 | 11.4%), Finance & Insurance (639 | 8.6%), Health Care & Social Assistance (602 | 8.1%), and Information (597 | 8.0%).
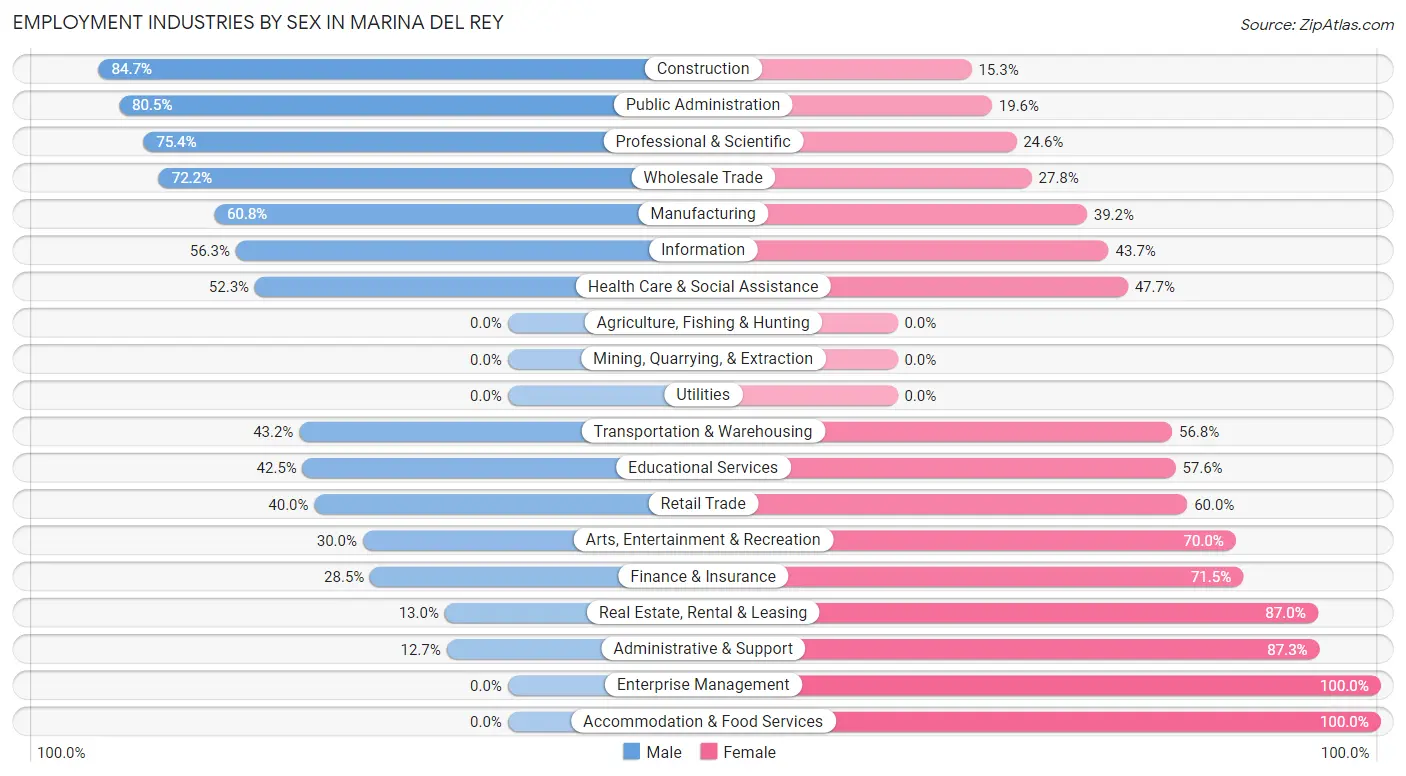
Employment Industries by Sex in Marina Del Rey
The Marina Del Rey industries that see more men than women are Construction (84.7%), Public Administration (80.4%), and Professional & Scientific (75.4%), whereas the industries that tend to have a higher number of women are Enterprise Management (100.0%), Accommodation & Food Services (100.0%), and Administrative & Support (87.3%).
| Industry | Male | Female |
| Agriculture, Fishing & Hunting | 0 (0.0%) | 0 (0.0%) |
| Mining, Quarrying, & Extraction | 0 (0.0%) | 0 (0.0%) |
| Construction | 243 (84.7%) | 44 (15.3%) |
| Manufacturing | 107 (60.8%) | 69 (39.2%) |
| Wholesale Trade | 234 (72.2%) | 90 (27.8%) |
| Retail Trade | 339 (40.0%) | 508 (60.0%) |
| Transportation & Warehousing | 142 (43.2%) | 187 (56.8%) |
| Utilities | 0 (0.0%) | 0 (0.0%) |
| Information | 336 (56.3%) | 261 (43.7%) |
| Finance & Insurance | 182 (28.5%) | 457 (71.5%) |
| Real Estate, Rental & Leasing | 24 (13.0%) | 160 (87.0%) |
| Professional & Scientific | 1,301 (75.4%) | 424 (24.6%) |
| Enterprise Management | 0 (0.0%) | 42 (100.0%) |
| Administrative & Support | 51 (12.7%) | 352 (87.3%) |
| Educational Services | 149 (42.4%) | 202 (57.6%) |
| Health Care & Social Assistance | 315 (52.3%) | 287 (47.7%) |
| Arts, Entertainment & Recreation | 150 (30.0%) | 350 (70.0%) |
| Accommodation & Food Services | 0 (0.0%) | 73 (100.0%) |
| Public Administration | 177 (80.4%) | 43 (19.6%) |
| Total | 3,750 (50.3%) | 3,709 (49.7%) |
Education in Marina Del Rey
School Enrollment in Marina Del Rey
The most common levels of schooling among the 679 students in Marina Del Rey are college / undergraduate (239 | 35.2%), high school (203 | 29.9%), and graduate / professional (114 | 16.8%).
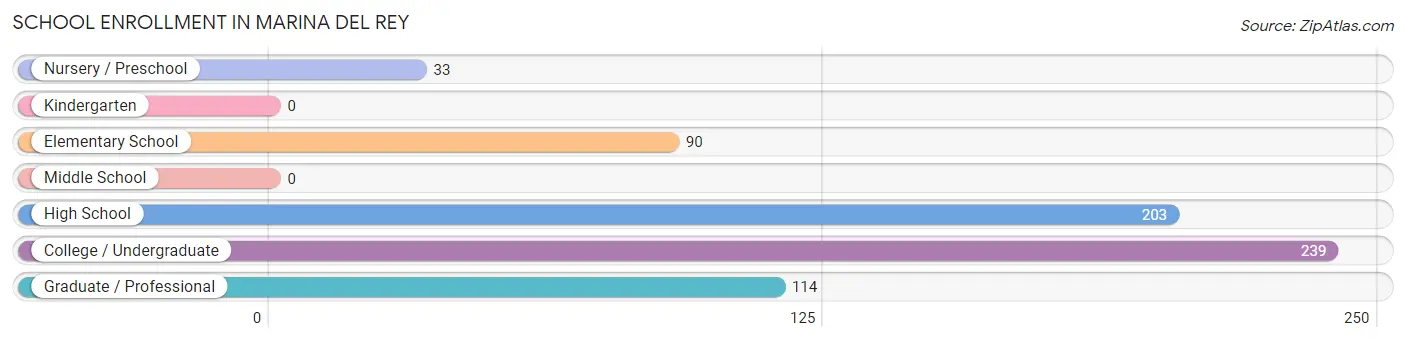
| School Level | # Students | % Students |
| Nursery / Preschool | 33 | 4.9% |
| Kindergarten | 0 | 0.0% |
| Elementary School | 90 | 13.3% |
| Middle School | 0 | 0.0% |
| High School | 203 | 29.9% |
| College / Undergraduate | 239 | 35.2% |
| Graduate / Professional | 114 | 16.8% |
| Total | 679 | 100.0% |
School Enrollment by Age by Funding Source in Marina Del Rey
Out of a total of 679 students who are enrolled in schools in Marina Del Rey, 152 (22.4%) attend a private institution, while the remaining 527 (77.6%) are enrolled in public schools. The age group of 5 to 9 year old has the highest likelihood of being enrolled in private schools, with 90 (73.2% in the age bracket) enrolled. Conversely, the age group of 15 to 17 year olds has the lowest likelihood of being enrolled in a private school, with 178 (100.0% in the age bracket) attending a public institution.
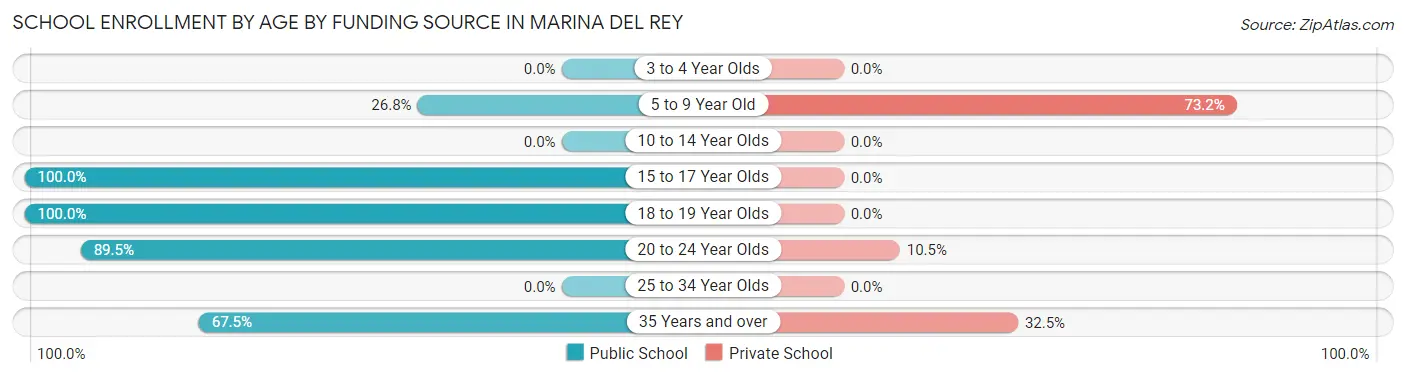
| Age Bracket | Public School | Private School |
| 3 to 4 Year Olds | 0 (0.0%) | 0 (0.0%) |
| 5 to 9 Year Old | 33 (26.8%) | 90 (73.2%) |
| 10 to 14 Year Olds | 0 (0.0%) | 0 (0.0%) |
| 15 to 17 Year Olds | 178 (100.0%) | 0 (0.0%) |
| 18 to 19 Year Olds | 25 (100.0%) | 0 (0.0%) |
| 20 to 24 Year Olds | 214 (89.5%) | 25 (10.5%) |
| 25 to 34 Year Olds | 0 (0.0%) | 0 (0.0%) |
| 35 Years and over | 77 (67.5%) | 37 (32.5%) |
| Total | 527 (77.6%) | 152 (22.4%) |
Educational Attainment by Field of Study in Marina Del Rey
Communications (1,032 | 16.9%), business (990 | 16.2%), social sciences (874 | 14.3%), literature & languages (537 | 8.8%), and visual & performing arts (448 | 7.3%) are the most common fields of study among 6,112 individuals in Marina Del Rey who have obtained a bachelor's degree or higher.
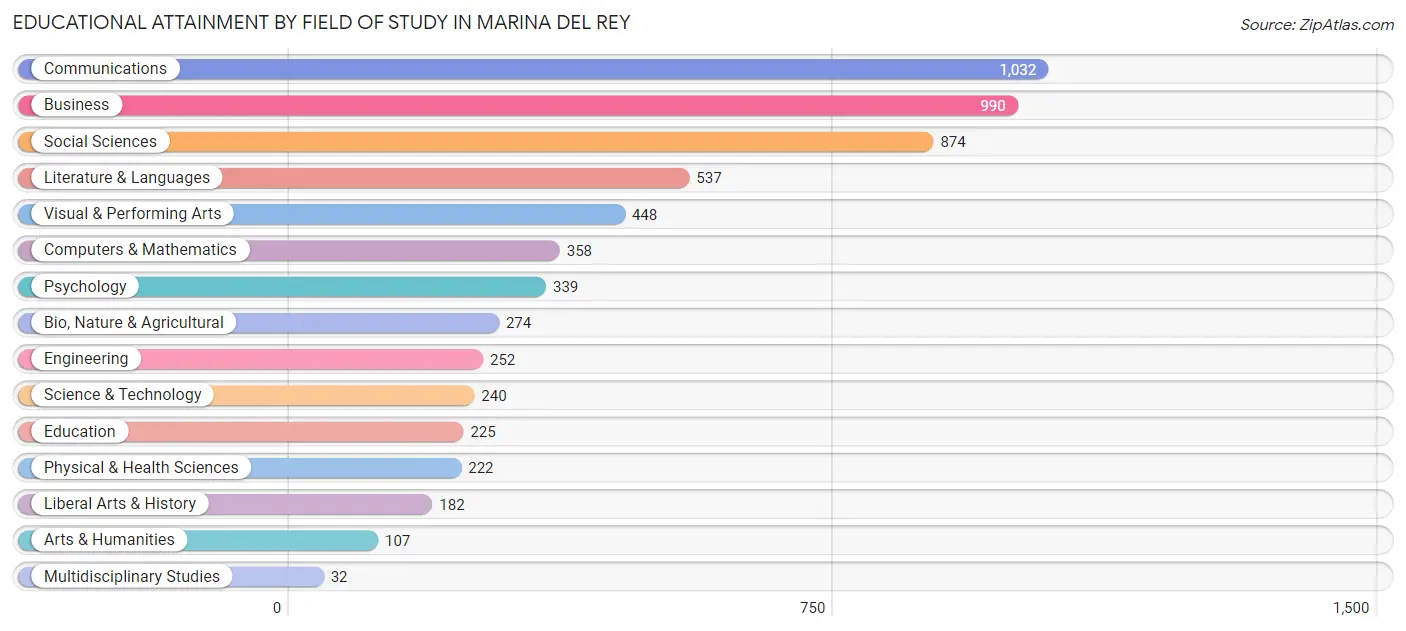
| Field of Study | # Graduates | % Graduates |
| Computers & Mathematics | 358 | 5.9% |
| Bio, Nature & Agricultural | 274 | 4.5% |
| Physical & Health Sciences | 222 | 3.6% |
| Psychology | 339 | 5.6% |
| Social Sciences | 874 | 14.3% |
| Engineering | 252 | 4.1% |
| Multidisciplinary Studies | 32 | 0.5% |
| Science & Technology | 240 | 3.9% |
| Business | 990 | 16.2% |
| Education | 225 | 3.7% |
| Literature & Languages | 537 | 8.8% |
| Liberal Arts & History | 182 | 3.0% |
| Visual & Performing Arts | 448 | 7.3% |
| Communications | 1,032 | 16.9% |
| Arts & Humanities | 107 | 1.8% |
| Total | 6,112 | 100.0% |
Transportation & Commute in Marina Del Rey
Vehicle Availability by Sex in Marina Del Rey
The most prevalent vehicle ownership categories in Marina Del Rey are males with 2 vehicles (1,848, accounting for 53.8%) and females with 2 vehicles (2,538, making up 50.6%).
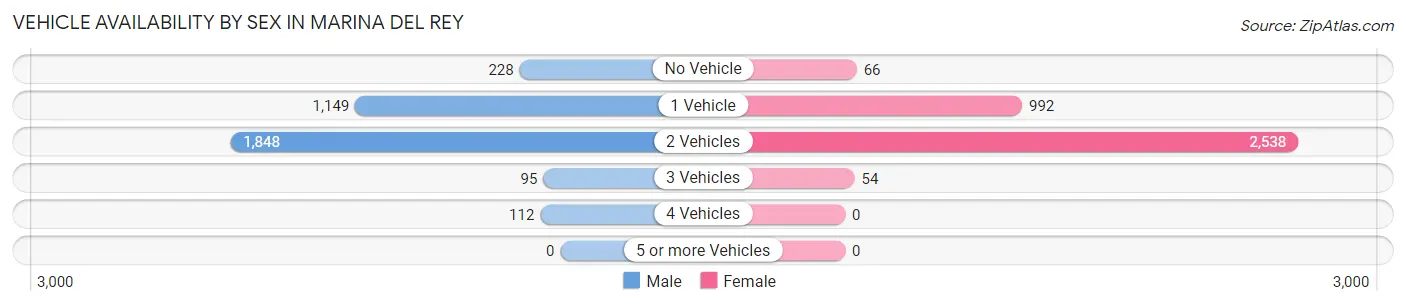
| Vehicles Available | Male | Female |
| No Vehicle | 228 (6.6%) | 66 (1.8%) |
| 1 Vehicle | 1,149 (33.5%) | 992 (27.2%) |
| 2 Vehicles | 1,848 (53.8%) | 2,538 (69.5%) |
| 3 Vehicles | 95 (2.8%) | 54 (1.5%) |
| 4 Vehicles | 112 (3.3%) | 0 (0.0%) |
| 5 or more Vehicles | 0 (0.0%) | 0 (0.0%) |
| Total | 3,432 (100.0%) | 3,650 (100.0%) |
Commute Time in Marina Del Rey
The most frequently occuring commute durations in Marina Del Rey are 20 to 24 minutes (726 commuters, 17.5%), 25 to 29 minutes (654 commuters, 15.8%), and 10 to 14 minutes (612 commuters, 14.8%).
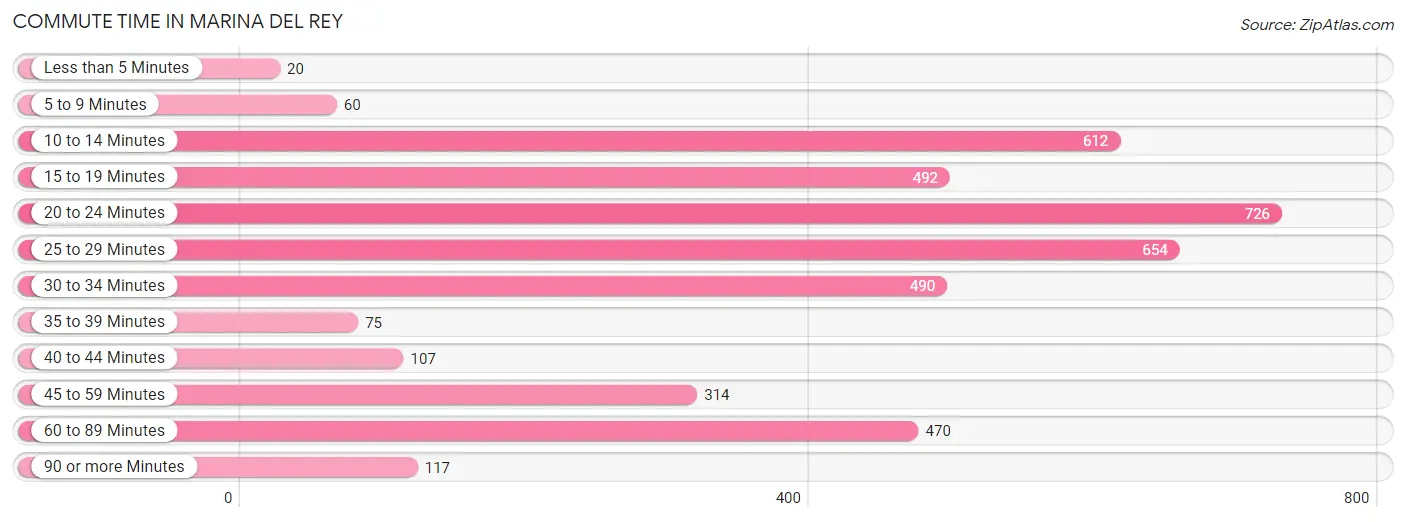
| Commute Time | # Commuters | % Commuters |
| Less than 5 Minutes | 20 | 0.5% |
| 5 to 9 Minutes | 60 | 1.5% |
| 10 to 14 Minutes | 612 | 14.8% |
| 15 to 19 Minutes | 492 | 11.9% |
| 20 to 24 Minutes | 726 | 17.5% |
| 25 to 29 Minutes | 654 | 15.8% |
| 30 to 34 Minutes | 490 | 11.8% |
| 35 to 39 Minutes | 75 | 1.8% |
| 40 to 44 Minutes | 107 | 2.6% |
| 45 to 59 Minutes | 314 | 7.6% |
| 60 to 89 Minutes | 470 | 11.4% |
| 90 or more Minutes | 117 | 2.8% |
Commute Time by Sex in Marina Del Rey
The most common commute times in Marina Del Rey are 25 to 29 minutes (356 commuters, 17.8%) for males and 10 to 14 minutes (511 commuters, 23.9%) for females.
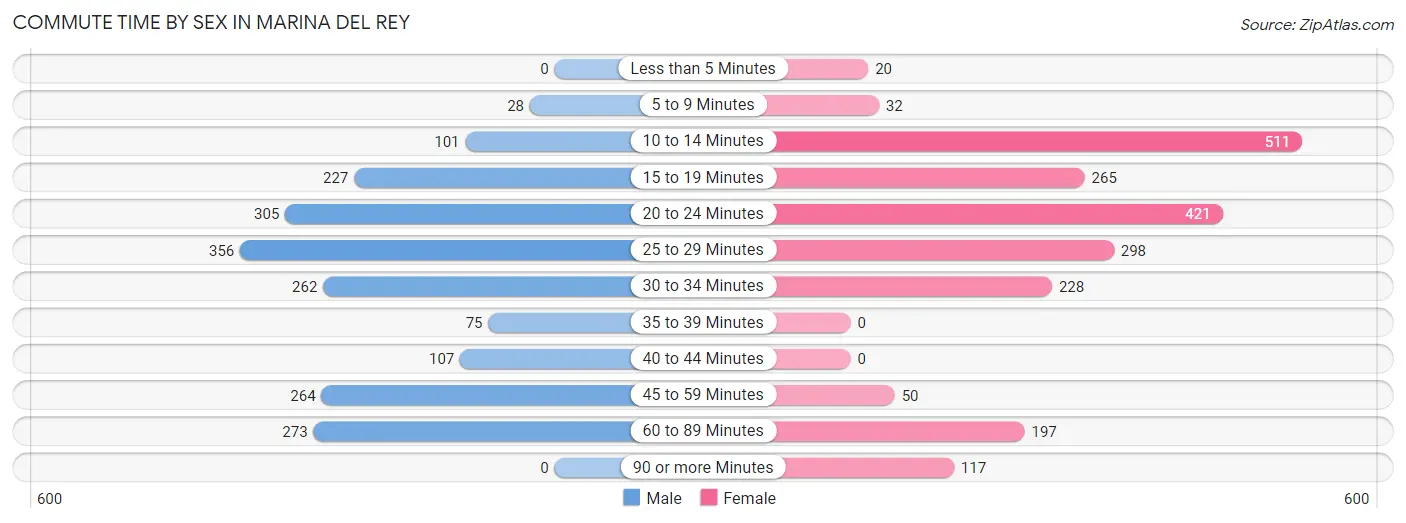
| Commute Time | Male | Female |
| Less than 5 Minutes | 0 (0.0%) | 20 (0.9%) |
| 5 to 9 Minutes | 28 (1.4%) | 32 (1.5%) |
| 10 to 14 Minutes | 101 (5.1%) | 511 (23.9%) |
| 15 to 19 Minutes | 227 (11.4%) | 265 (12.4%) |
| 20 to 24 Minutes | 305 (15.3%) | 421 (19.7%) |
| 25 to 29 Minutes | 356 (17.8%) | 298 (13.9%) |
| 30 to 34 Minutes | 262 (13.1%) | 228 (10.7%) |
| 35 to 39 Minutes | 75 (3.7%) | 0 (0.0%) |
| 40 to 44 Minutes | 107 (5.4%) | 0 (0.0%) |
| 45 to 59 Minutes | 264 (13.2%) | 50 (2.3%) |
| 60 to 89 Minutes | 273 (13.7%) | 197 (9.2%) |
| 90 or more Minutes | 0 (0.0%) | 117 (5.5%) |
Time of Departure to Work by Sex in Marina Del Rey
The most frequent times of departure to work in Marina Del Rey are 8:00 AM to 8:29 AM (490, 24.5%) for males and 7:00 AM to 7:29 AM (611, 28.6%) for females.
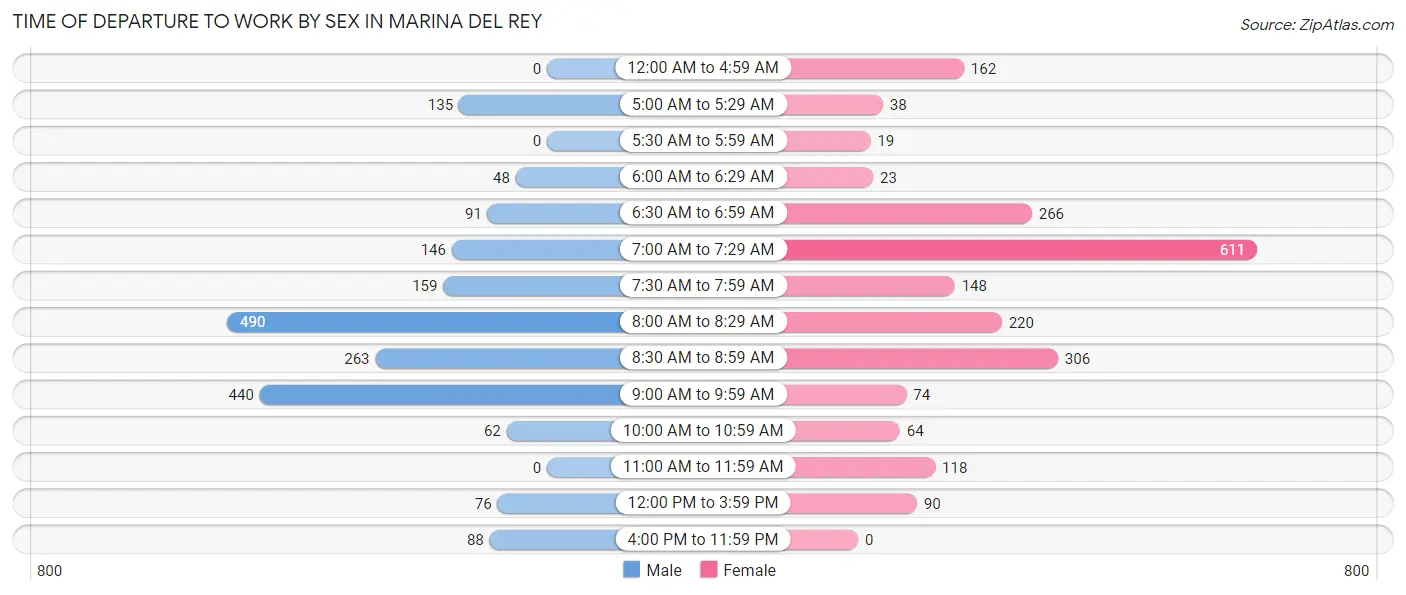
| Time of Departure | Male | Female |
| 12:00 AM to 4:59 AM | 0 (0.0%) | 162 (7.6%) |
| 5:00 AM to 5:29 AM | 135 (6.8%) | 38 (1.8%) |
| 5:30 AM to 5:59 AM | 0 (0.0%) | 19 (0.9%) |
| 6:00 AM to 6:29 AM | 48 (2.4%) | 23 (1.1%) |
| 6:30 AM to 6:59 AM | 91 (4.5%) | 266 (12.4%) |
| 7:00 AM to 7:29 AM | 146 (7.3%) | 611 (28.6%) |
| 7:30 AM to 7:59 AM | 159 (8.0%) | 148 (6.9%) |
| 8:00 AM to 8:29 AM | 490 (24.5%) | 220 (10.3%) |
| 8:30 AM to 8:59 AM | 263 (13.2%) | 306 (14.3%) |
| 9:00 AM to 9:59 AM | 440 (22.0%) | 74 (3.5%) |
| 10:00 AM to 10:59 AM | 62 (3.1%) | 64 (3.0%) |
| 11:00 AM to 11:59 AM | 0 (0.0%) | 118 (5.5%) |
| 12:00 PM to 3:59 PM | 76 (3.8%) | 90 (4.2%) |
| 4:00 PM to 11:59 PM | 88 (4.4%) | 0 (0.0%) |
| Total | 1,998 (100.0%) | 2,139 (100.0%) |
Housing Occupancy in Marina Del Rey
Occupancy by Ownership in Marina Del Rey
Of the total 5,511 dwellings in Marina Del Rey, owner-occupied units account for 385 (7.0%), while renter-occupied units make up 5,126 (93.0%).
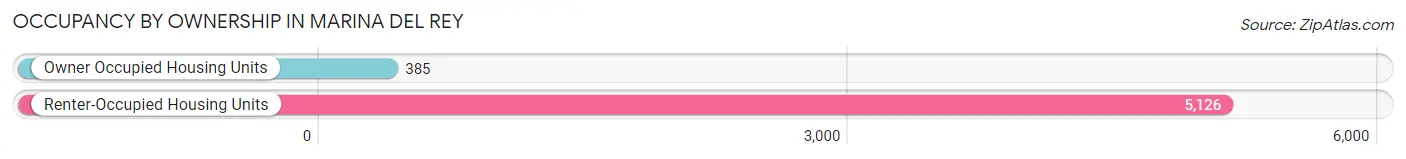
| Occupancy | # Housing Units | % Housing Units |
| Owner Occupied Housing Units | 385 | 7.0% |
| Renter-Occupied Housing Units | 5,126 | 93.0% |
| Total Occupied Housing Units | 5,511 | 100.0% |
Occupancy by Household Size in Marina Del Rey
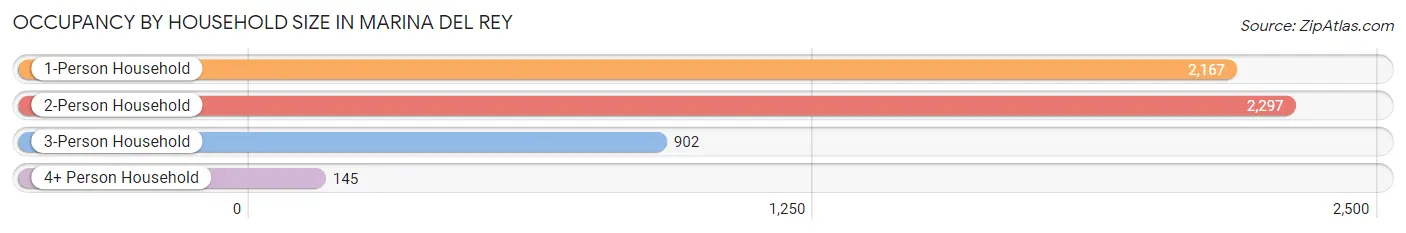
| Household Size | # Housing Units | % Housing Units |
| 1-Person Household | 2,167 | 39.3% |
| 2-Person Household | 2,297 | 41.7% |
| 3-Person Household | 902 | 16.4% |
| 4+ Person Household | 145 | 2.6% |
| Total Housing Units | 5,511 | 100.0% |
Occupancy by Ownership by Household Size in Marina Del Rey
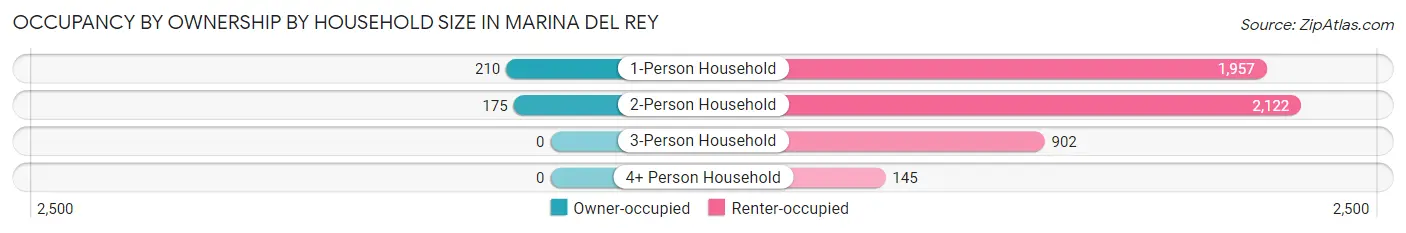
| Household Size | Owner-occupied | Renter-occupied |
| 1-Person Household | 210 (9.7%) | 1,957 (90.3%) |
| 2-Person Household | 175 (7.6%) | 2,122 (92.4%) |
| 3-Person Household | 0 (0.0%) | 902 (100.0%) |
| 4+ Person Household | 0 (0.0%) | 145 (100.0%) |
| Total Housing Units | 385 (7.0%) | 5,126 (93.0%) |
Occupancy by Educational Attainment in Marina Del Rey
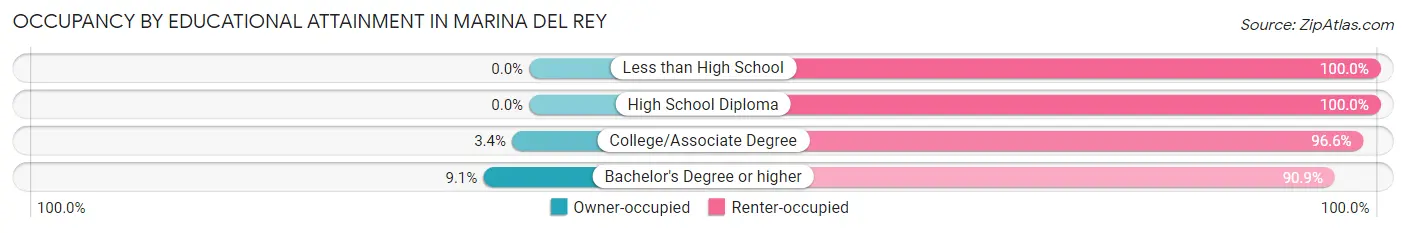
| Household Size | Owner-occupied | Renter-occupied |
| Less than High School | 0 (0.0%) | 32 (100.0%) |
| High School Diploma | 0 (0.0%) | 268 (100.0%) |
| College/Associate Degree | 53 (3.4%) | 1,505 (96.6%) |
| Bachelor's Degree or higher | 332 (9.1%) | 3,321 (90.9%) |
Occupancy by Age of Householder in Marina Del Rey
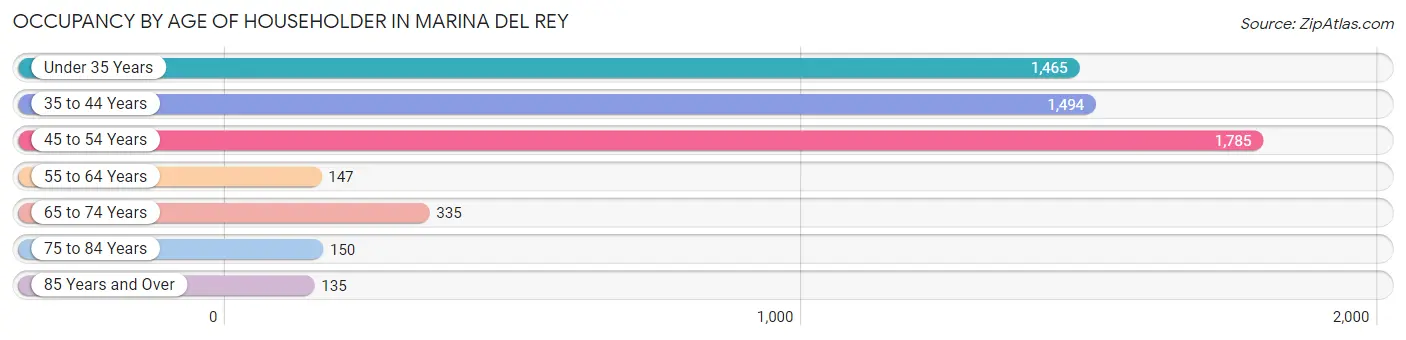
| Age Bracket | # Households | % Households |
| Under 35 Years | 1,465 | 26.6% |
| 35 to 44 Years | 1,494 | 27.1% |
| 45 to 54 Years | 1,785 | 32.4% |
| 55 to 64 Years | 147 | 2.7% |
| 65 to 74 Years | 335 | 6.1% |
| 75 to 84 Years | 150 | 2.7% |
| 85 Years and Over | 135 | 2.5% |
| Total | 5,511 | 100.0% |
Housing Finances in Marina Del Rey
Median Income by Occupancy in Marina Del Rey
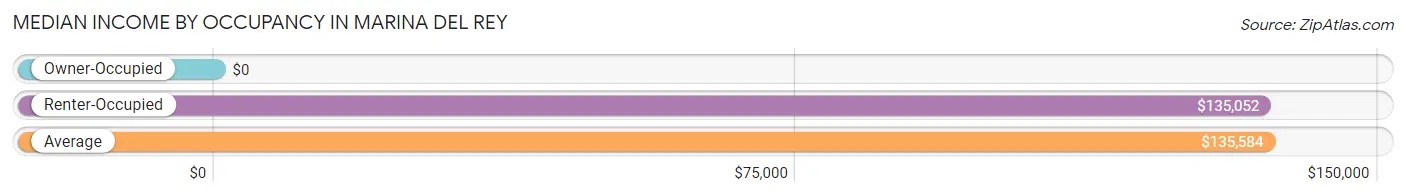
| Occupancy Type | # Households | Median Income |
| Owner-Occupied | 385 (7.0%) | $0 |
| Renter-Occupied | 5,126 (93.0%) | $135,052 |
| Average | 5,511 (100.0%) | $135,584 |
Occupancy by Householder Income Bracket in Marina Del Rey
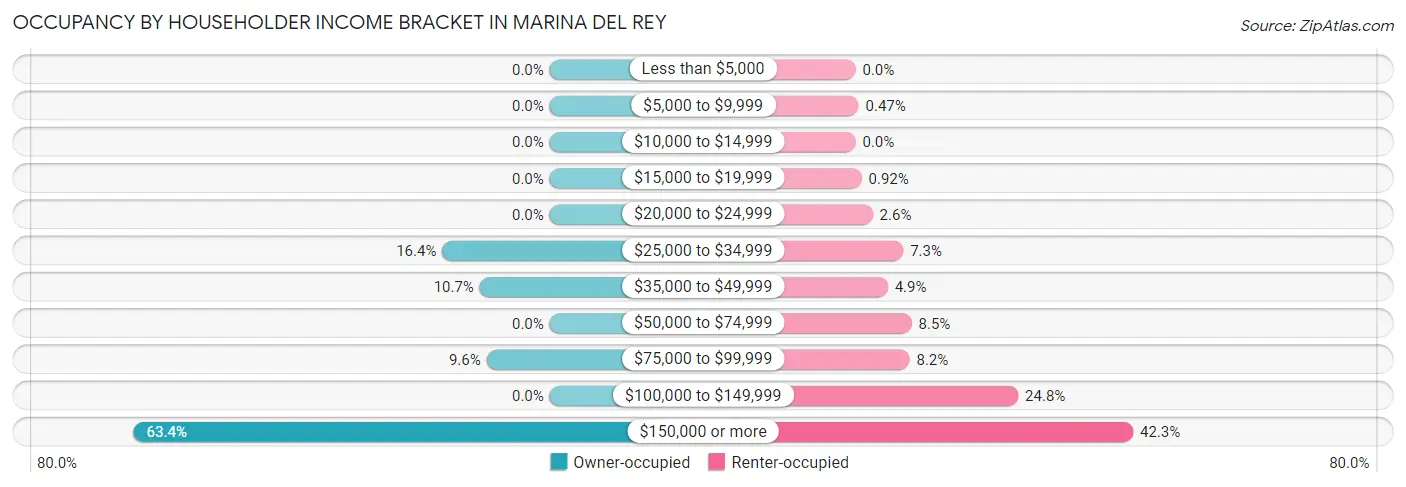
| Income Bracket | Owner-occupied | Renter-occupied |
| Less than $5,000 | 0 (0.0%) | 0 (0.0%) |
| $5,000 to $9,999 | 0 (0.0%) | 24 (0.5%) |
| $10,000 to $14,999 | 0 (0.0%) | 0 (0.0%) |
| $15,000 to $19,999 | 0 (0.0%) | 47 (0.9%) |
| $20,000 to $24,999 | 0 (0.0%) | 134 (2.6%) |
| $25,000 to $34,999 | 63 (16.4%) | 372 (7.3%) |
| $35,000 to $49,999 | 41 (10.6%) | 251 (4.9%) |
| $50,000 to $74,999 | 0 (0.0%) | 438 (8.5%) |
| $75,000 to $99,999 | 37 (9.6%) | 422 (8.2%) |
| $100,000 to $149,999 | 0 (0.0%) | 1,270 (24.8%) |
| $150,000 or more | 244 (63.4%) | 2,168 (42.3%) |
| Total | 385 (100.0%) | 5,126 (100.0%) |
Monthly Housing Cost Tiers in Marina Del Rey
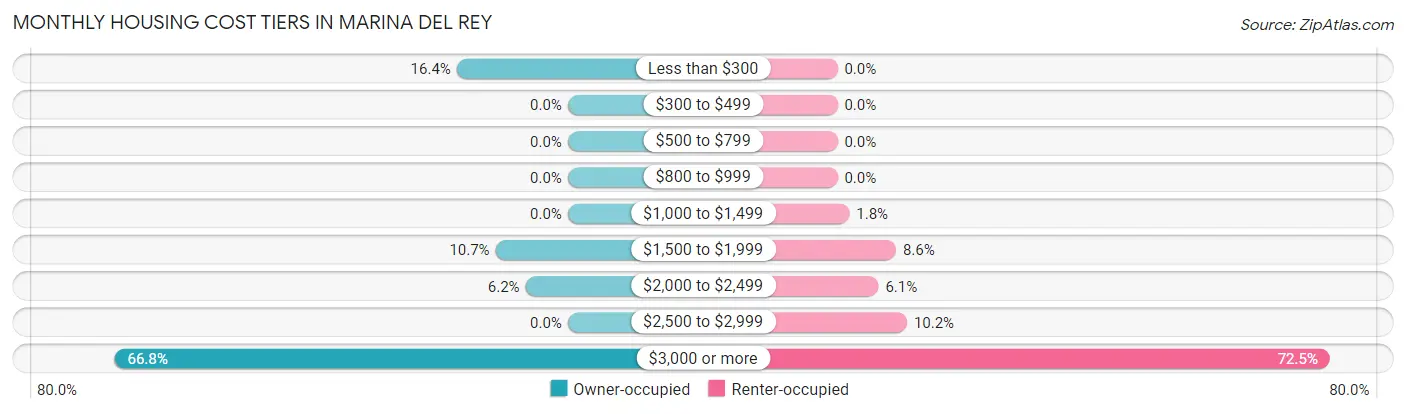
| Monthly Cost | Owner-occupied | Renter-occupied |
| Less than $300 | 63 (16.4%) | 0 (0.0%) |
| $300 to $499 | 0 (0.0%) | 0 (0.0%) |
| $500 to $799 | 0 (0.0%) | 0 (0.0%) |
| $800 to $999 | 0 (0.0%) | 0 (0.0%) |
| $1,000 to $1,499 | 0 (0.0%) | 90 (1.8%) |
| $1,500 to $1,999 | 41 (10.6%) | 442 (8.6%) |
| $2,000 to $2,499 | 24 (6.2%) | 310 (6.0%) |
| $2,500 to $2,999 | 0 (0.0%) | 525 (10.2%) |
| $3,000 or more | 257 (66.7%) | 3,717 (72.5%) |
| Total | 385 (100.0%) | 5,126 (100.0%) |
Physical Housing Characteristics in Marina Del Rey
Housing Structures in Marina Del Rey
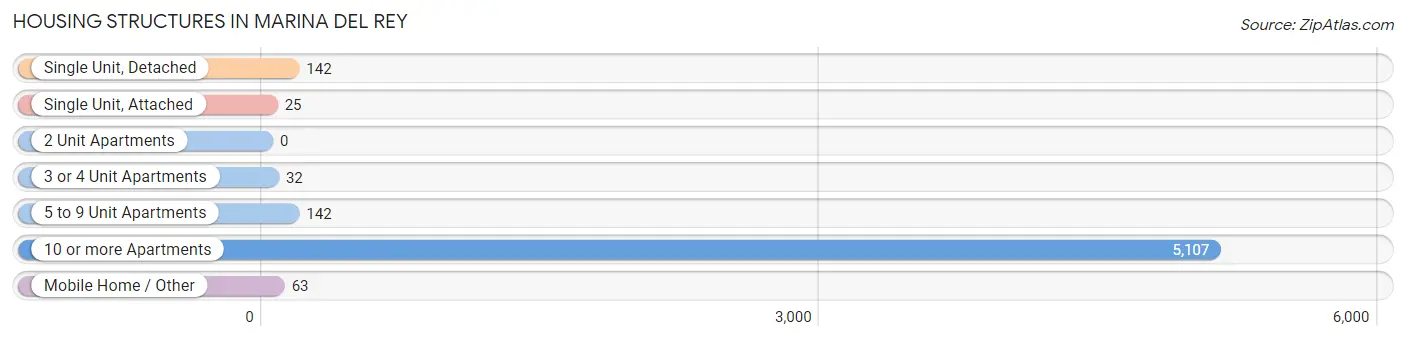
| Structure Type | # Housing Units | % Housing Units |
| Single Unit, Detached | 142 | 2.6% |
| Single Unit, Attached | 25 | 0.4% |
| 2 Unit Apartments | 0 | 0.0% |
| 3 or 4 Unit Apartments | 32 | 0.6% |
| 5 to 9 Unit Apartments | 142 | 2.6% |
| 10 or more Apartments | 5,107 | 92.7% |
| Mobile Home / Other | 63 | 1.1% |
| Total | 5,511 | 100.0% |
Housing Structures by Occupancy in Marina Del Rey
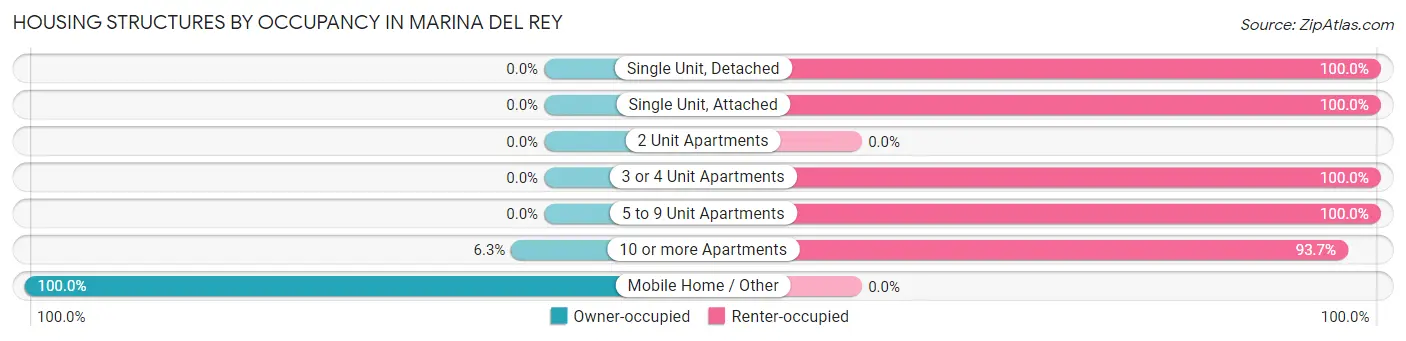
| Structure Type | Owner-occupied | Renter-occupied |
| Single Unit, Detached | 0 (0.0%) | 142 (100.0%) |
| Single Unit, Attached | 0 (0.0%) | 25 (100.0%) |
| 2 Unit Apartments | 0 (0.0%) | 0 (0.0%) |
| 3 or 4 Unit Apartments | 0 (0.0%) | 32 (100.0%) |
| 5 to 9 Unit Apartments | 0 (0.0%) | 142 (100.0%) |
| 10 or more Apartments | 322 (6.3%) | 4,785 (93.7%) |
| Mobile Home / Other | 63 (100.0%) | 0 (0.0%) |
| Total | 385 (7.0%) | 5,126 (93.0%) |
Housing Structures by Number of Rooms in Marina Del Rey
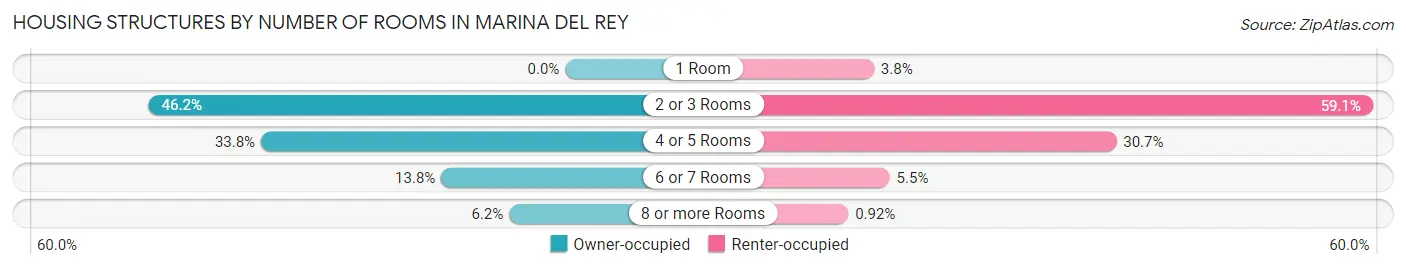
| Number of Rooms | Owner-occupied | Renter-occupied |
| 1 Room | 0 (0.0%) | 193 (3.8%) |
| 2 or 3 Rooms | 178 (46.2%) | 3,031 (59.1%) |
| 4 or 5 Rooms | 130 (33.8%) | 1,572 (30.7%) |
| 6 or 7 Rooms | 53 (13.8%) | 283 (5.5%) |
| 8 or more Rooms | 24 (6.2%) | 47 (0.9%) |
| Total | 385 (100.0%) | 5,126 (100.0%) |
Housing Structure by Heating Type in Marina Del Rey
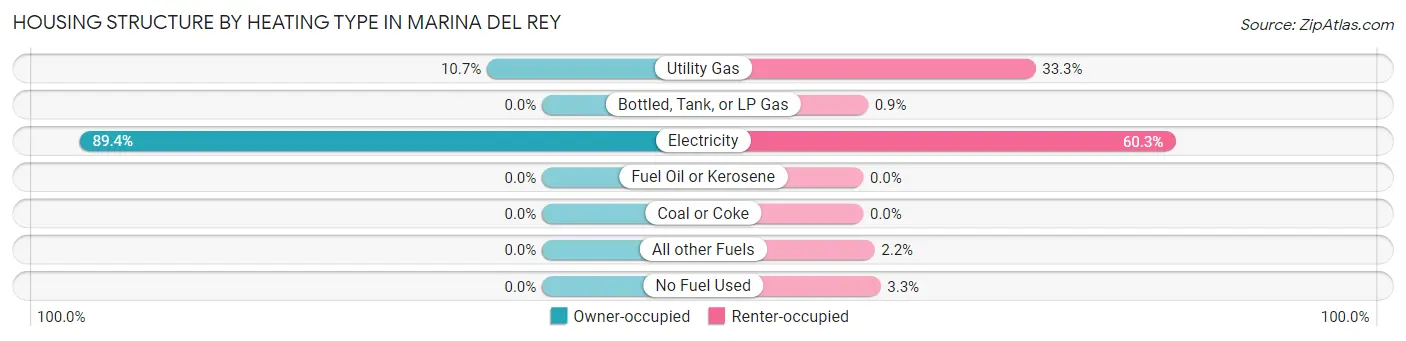
| Heating Type | Owner-occupied | Renter-occupied |
| Utility Gas | 41 (10.6%) | 1,706 (33.3%) |
| Bottled, Tank, or LP Gas | 0 (0.0%) | 46 (0.9%) |
| Electricity | 344 (89.3%) | 3,091 (60.3%) |
| Fuel Oil or Kerosene | 0 (0.0%) | 0 (0.0%) |
| Coal or Coke | 0 (0.0%) | 0 (0.0%) |
| All other Fuels | 0 (0.0%) | 112 (2.2%) |
| No Fuel Used | 0 (0.0%) | 171 (3.3%) |
| Total | 385 (100.0%) | 5,126 (100.0%) |
Household Vehicle Usage in Marina Del Rey
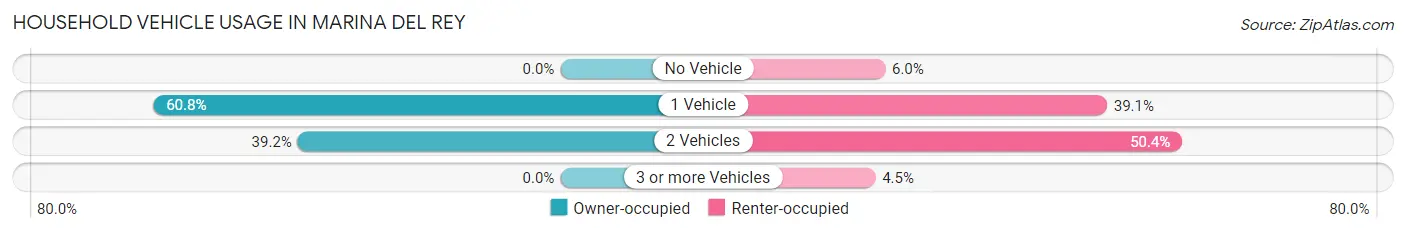
| Vehicles per Household | Owner-occupied | Renter-occupied |
| No Vehicle | 0 (0.0%) | 307 (6.0%) |
| 1 Vehicle | 234 (60.8%) | 2,005 (39.1%) |
| 2 Vehicles | 151 (39.2%) | 2,582 (50.4%) |
| 3 or more Vehicles | 0 (0.0%) | 232 (4.5%) |
| Total | 385 (100.0%) | 5,126 (100.0%) |
Real Estate & Mortgages in Marina Del Rey
Real Estate and Mortgage Overview in Marina Del Rey
| Characteristic | Without Mortgage | With Mortgage |
| Housing Units | 217 | 168 |
| Median Property Value | $1,088,500 | $682,600 |
| Median Household Income | - | - |
| Monthly Housing Costs | $1,501 | $168 |
| Real Estate Taxes | $10,001 | $0 |
Property Value by Mortgage Status in Marina Del Rey
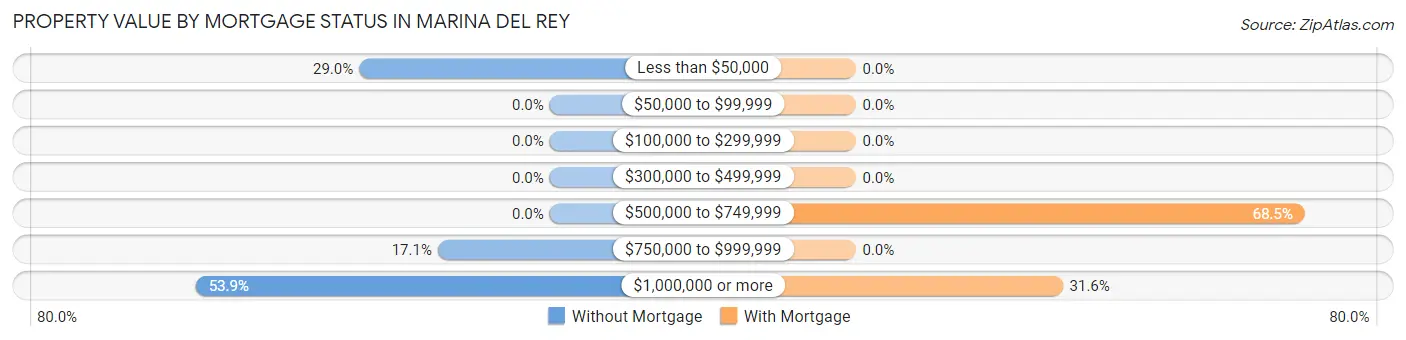
| Property Value | Without Mortgage | With Mortgage |
| Less than $50,000 | 63 (29.0%) | 0 (0.0%) |
| $50,000 to $99,999 | 0 (0.0%) | 0 (0.0%) |
| $100,000 to $299,999 | 0 (0.0%) | 0 (0.0%) |
| $300,000 to $499,999 | 0 (0.0%) | 0 (0.0%) |
| $500,000 to $749,999 | 0 (0.0%) | 115 (68.4%) |
| $750,000 to $999,999 | 37 (17.1%) | 0 (0.0%) |
| $1,000,000 or more | 117 (53.9%) | 53 (31.6%) |
| Total | 217 (100.0%) | 168 (100.0%) |
Household Income by Mortgage Status in Marina Del Rey
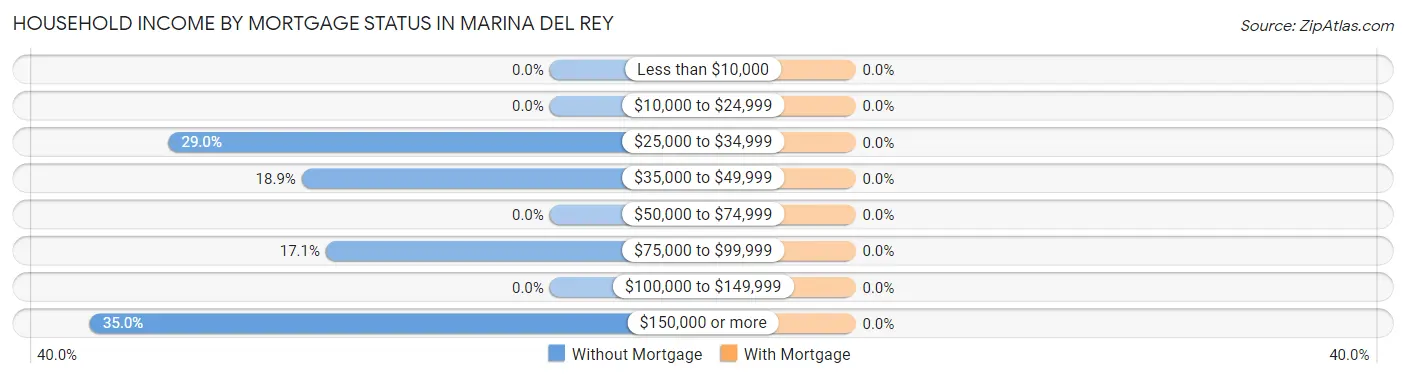
| Household Income | Without Mortgage | With Mortgage |
| Less than $10,000 | 0 (0.0%) | 0 (0.0%) |
| $10,000 to $24,999 | 0 (0.0%) | 0 (0.0%) |
| $25,000 to $34,999 | 63 (29.0%) | 0 (0.0%) |
| $35,000 to $49,999 | 41 (18.9%) | 0 (0.0%) |
| $50,000 to $74,999 | 0 (0.0%) | 0 (0.0%) |
| $75,000 to $99,999 | 37 (17.1%) | 0 (0.0%) |
| $100,000 to $149,999 | 0 (0.0%) | 0 (0.0%) |
| $150,000 or more | 76 (35.0%) | 0 (0.0%) |
| Total | 217 (100.0%) | 168 (100.0%) |
Property Value to Household Income Ratio in Marina Del Rey
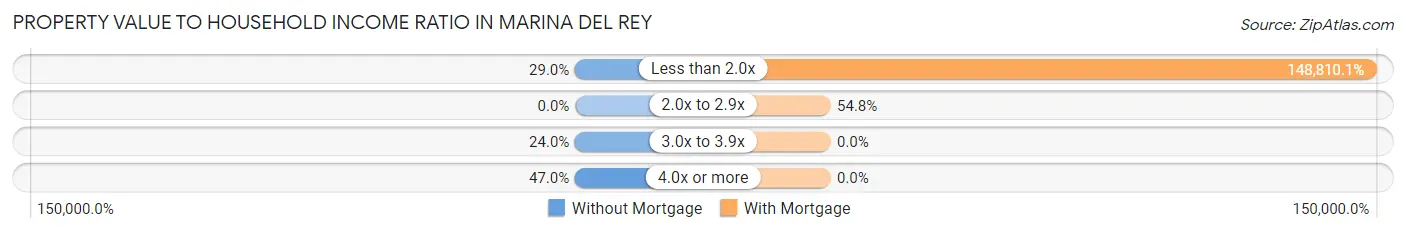
| Value-to-Income Ratio | Without Mortgage | With Mortgage |
| Less than 2.0x | 63 (29.0%) | 250,001 (148,810.1%) |
| 2.0x to 2.9x | 0 (0.0%) | 92 (54.8%) |
| 3.0x to 3.9x | 52 (24.0%) | 0 (0.0%) |
| 4.0x or more | 102 (47.0%) | 0 (0.0%) |
| Total | 217 (100.0%) | 168 (100.0%) |
Real Estate Taxes by Mortgage Status in Marina Del Rey
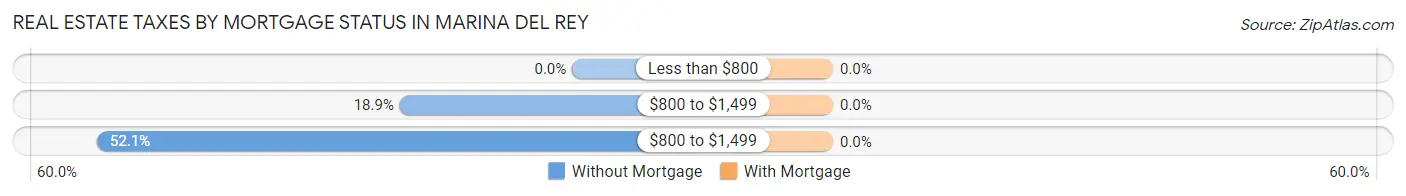
| Property Taxes | Without Mortgage | With Mortgage |
| Less than $800 | 0 (0.0%) | 0 (0.0%) |
| $800 to $1,499 | 41 (18.9%) | 0 (0.0%) |
| $800 to $1,499 | 113 (52.1%) | 0 (0.0%) |
| Total | 217 (100.0%) | 168 (100.0%) |
Health & Disability in Marina Del Rey
Health Insurance Coverage by Age in Marina Del Rey
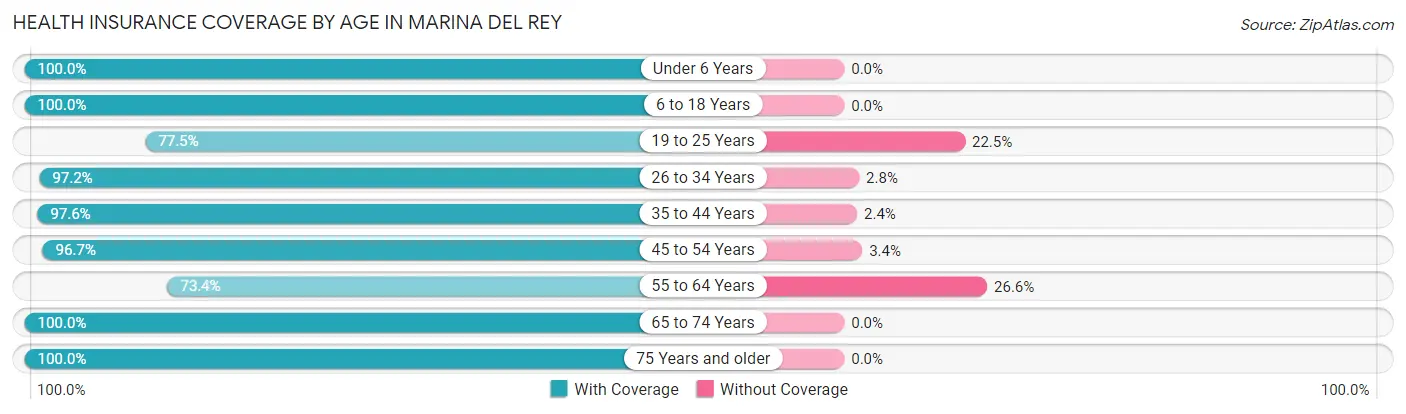
| Age Bracket | With Coverage | Without Coverage |
| Under 6 Years | 967 (100.0%) | 0 (0.0%) |
| 6 to 18 Years | 405 (100.0%) | 0 (0.0%) |
| 19 to 25 Years | 867 (77.5%) | 252 (22.5%) |
| 26 to 34 Years | 1,335 (97.2%) | 38 (2.8%) |
| 35 to 44 Years | 2,935 (97.6%) | 72 (2.4%) |
| 45 to 54 Years | 2,133 (96.7%) | 74 (3.4%) |
| 55 to 64 Years | 259 (73.4%) | 94 (26.6%) |
| 65 to 74 Years | 473 (100.0%) | 0 (0.0%) |
| 75 Years and older | 370 (100.0%) | 0 (0.0%) |
| Total | 9,744 (94.8%) | 530 (5.2%) |
Health Insurance Coverage by Citizenship Status in Marina Del Rey
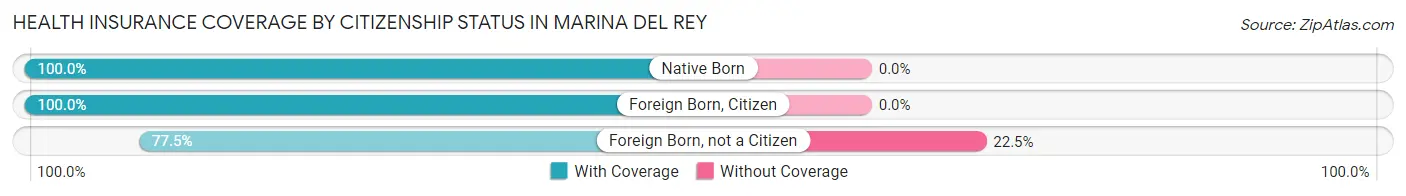
| Citizenship Status | With Coverage | Without Coverage |
| Native Born | 967 (100.0%) | 0 (0.0%) |
| Foreign Born, Citizen | 405 (100.0%) | 0 (0.0%) |
| Foreign Born, not a Citizen | 867 (77.5%) | 252 (22.5%) |
Health Insurance Coverage by Household Income in Marina Del Rey
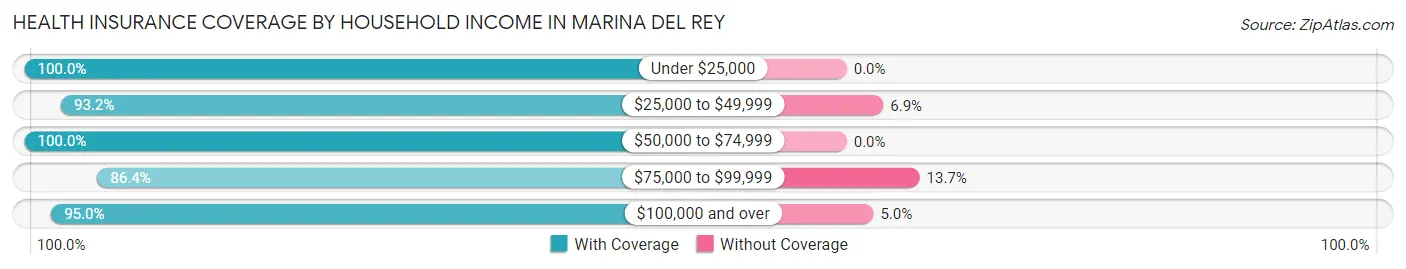
| Household Income | With Coverage | Without Coverage |
| Under $25,000 | 450 (100.0%) | 0 (0.0%) |
| $25,000 to $49,999 | 952 (93.1%) | 70 (6.9%) |
| $50,000 to $74,999 | 686 (100.0%) | 0 (0.0%) |
| $75,000 to $99,999 | 544 (86.4%) | 86 (13.7%) |
| $100,000 and over | 7,112 (95.0%) | 374 (5.0%) |
Public vs Private Health Insurance Coverage by Age in Marina Del Rey
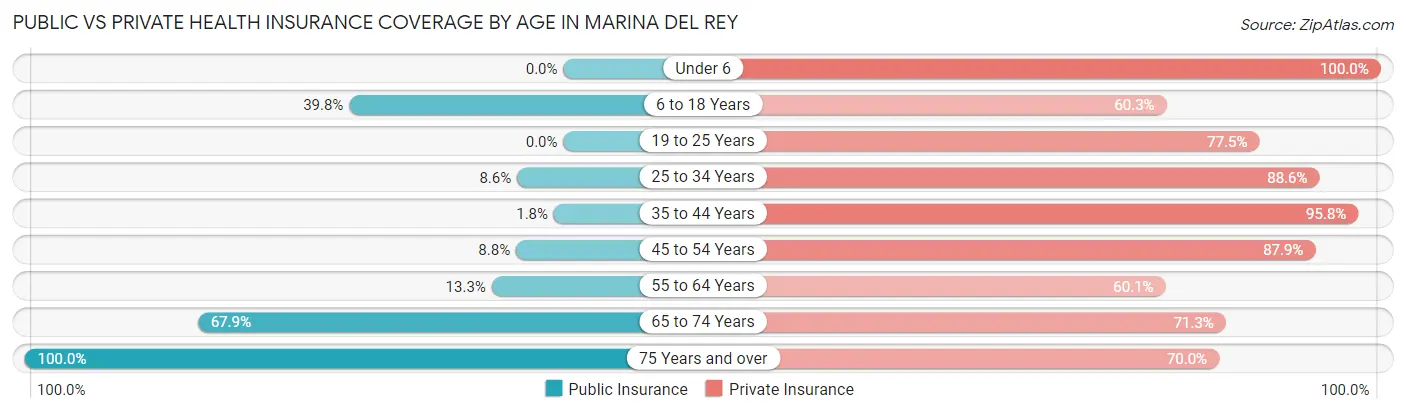
| Age Bracket | Public Insurance | Private Insurance |
| Under 6 | 0 (0.0%) | 967 (100.0%) |
| 6 to 18 Years | 161 (39.8%) | 244 (60.3%) |
| 19 to 25 Years | 0 (0.0%) | 867 (77.5%) |
| 25 to 34 Years | 118 (8.6%) | 1,217 (88.6%) |
| 35 to 44 Years | 53 (1.8%) | 2,882 (95.8%) |
| 45 to 54 Years | 194 (8.8%) | 1,939 (87.9%) |
| 55 to 64 Years | 47 (13.3%) | 212 (60.1%) |
| 65 to 74 Years | 321 (67.9%) | 337 (71.3%) |
| 75 Years and over | 370 (100.0%) | 259 (70.0%) |
| Total | 1,264 (12.3%) | 8,924 (86.9%) |
Disability Status by Sex by Age in Marina Del Rey
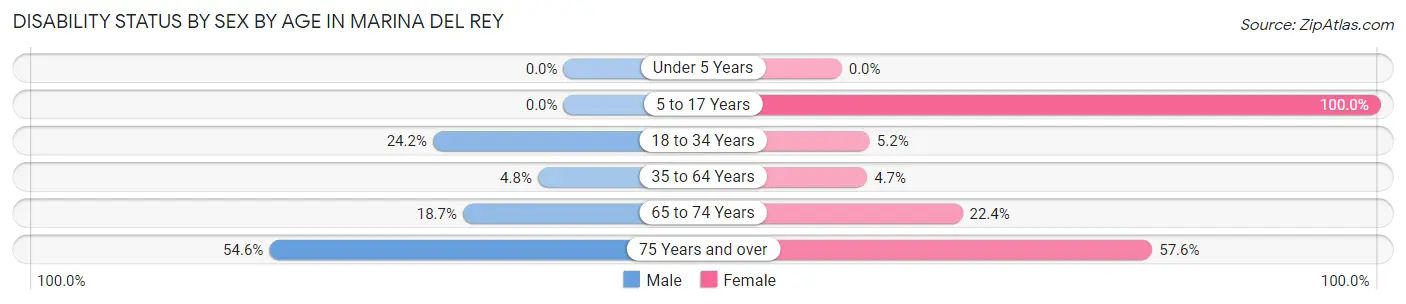
| Age Bracket | Male | Female |
| Under 5 Years | 0 (0.0%) | 0 (0.0%) |
| 5 to 17 Years | 0 (0.0%) | 41 (100.0%) |
| 18 to 34 Years | 206 (24.2%) | 87 (5.2%) |
| 35 to 64 Years | 139 (4.8%) | 125 (4.7%) |
| 65 to 74 Years | 45 (18.7%) | 52 (22.4%) |
| 75 Years and over | 77 (54.6%) | 132 (57.6%) |
Disability Class by Sex by Age in Marina Del Rey
Disability Class: Hearing Difficulty
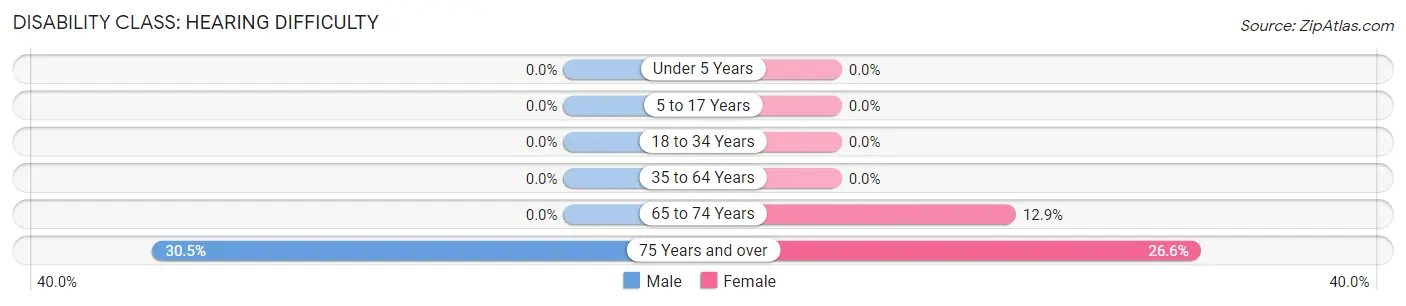
| Age Bracket | Male | Female |
| Under 5 Years | 0 (0.0%) | 0 (0.0%) |
| 5 to 17 Years | 0 (0.0%) | 0 (0.0%) |
| 18 to 34 Years | 0 (0.0%) | 0 (0.0%) |
| 35 to 64 Years | 0 (0.0%) | 0 (0.0%) |
| 65 to 74 Years | 0 (0.0%) | 30 (12.9%) |
| 75 Years and over | 43 (30.5%) | 61 (26.6%) |
Disability Class: Vision Difficulty
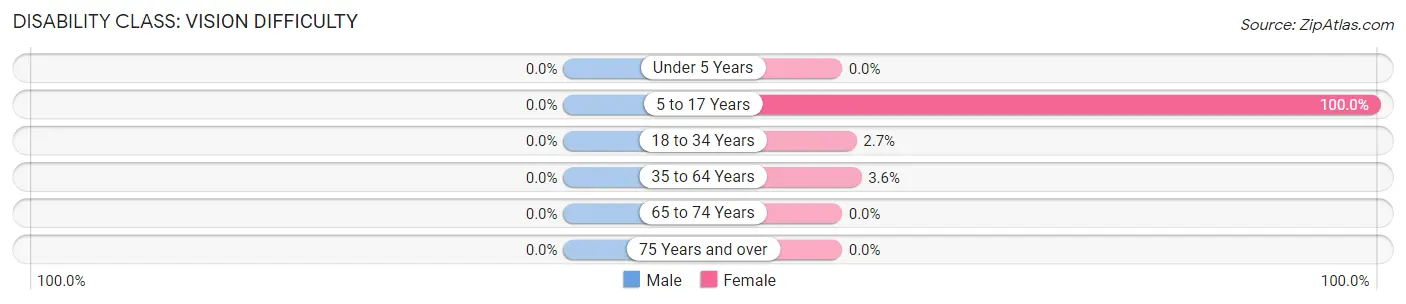
| Age Bracket | Male | Female |
| Under 5 Years | 0 (0.0%) | 0 (0.0%) |
| 5 to 17 Years | 0 (0.0%) | 41 (100.0%) |
| 18 to 34 Years | 0 (0.0%) | 45 (2.7%) |
| 35 to 64 Years | 0 (0.0%) | 95 (3.6%) |
| 65 to 74 Years | 0 (0.0%) | 0 (0.0%) |
| 75 Years and over | 0 (0.0%) | 0 (0.0%) |
Disability Class: Cognitive Difficulty
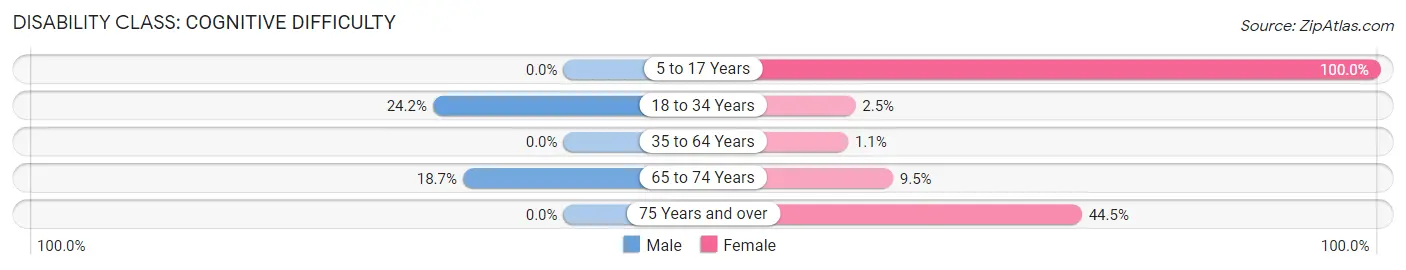
| Age Bracket | Male | Female |
| 5 to 17 Years | 0 (0.0%) | 41 (100.0%) |
| 18 to 34 Years | 206 (24.2%) | 42 (2.5%) |
| 35 to 64 Years | 0 (0.0%) | 30 (1.1%) |
| 65 to 74 Years | 45 (18.7%) | 22 (9.5%) |
| 75 Years and over | 0 (0.0%) | 102 (44.5%) |
Disability Class: Ambulatory Difficulty
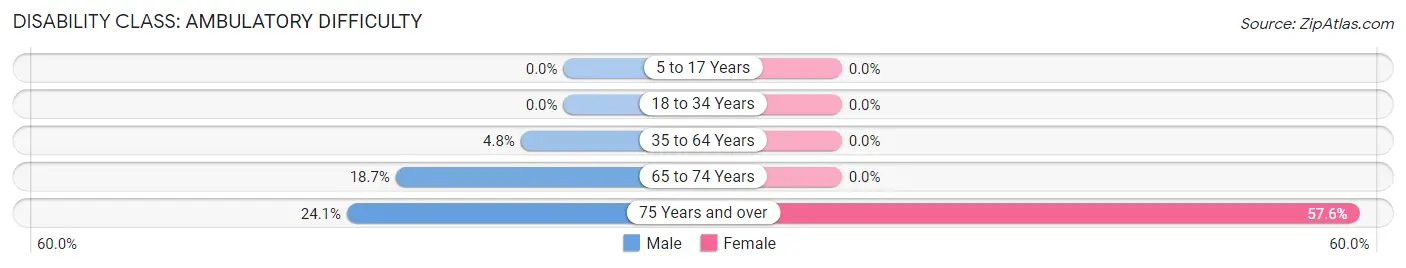
| Age Bracket | Male | Female |
| 5 to 17 Years | 0 (0.0%) | 0 (0.0%) |
| 18 to 34 Years | 0 (0.0%) | 0 (0.0%) |
| 35 to 64 Years | 139 (4.8%) | 0 (0.0%) |
| 65 to 74 Years | 45 (18.7%) | 0 (0.0%) |
| 75 Years and over | 34 (24.1%) | 132 (57.6%) |
Disability Class: Self-Care Difficulty
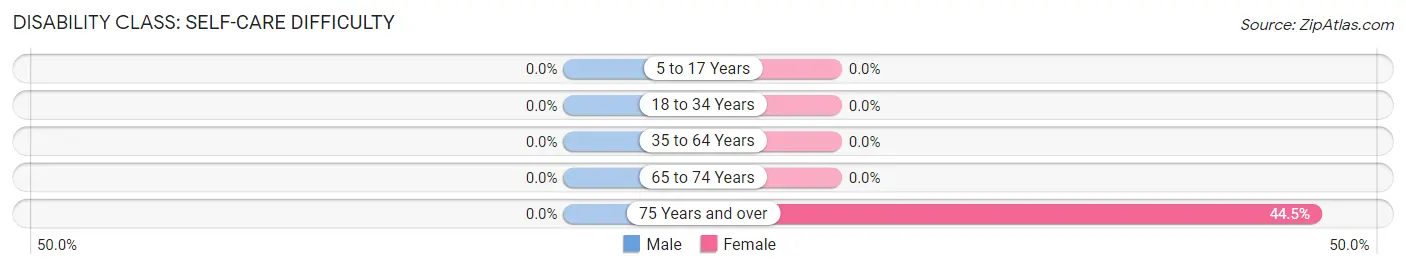
| Age Bracket | Male | Female |
| 5 to 17 Years | 0 (0.0%) | 0 (0.0%) |
| 18 to 34 Years | 0 (0.0%) | 0 (0.0%) |
| 35 to 64 Years | 0 (0.0%) | 0 (0.0%) |
| 65 to 74 Years | 0 (0.0%) | 0 (0.0%) |
| 75 Years and over | 0 (0.0%) | 102 (44.5%) |
Technology Access in Marina Del Rey
Computing Device Access in Marina Del Rey
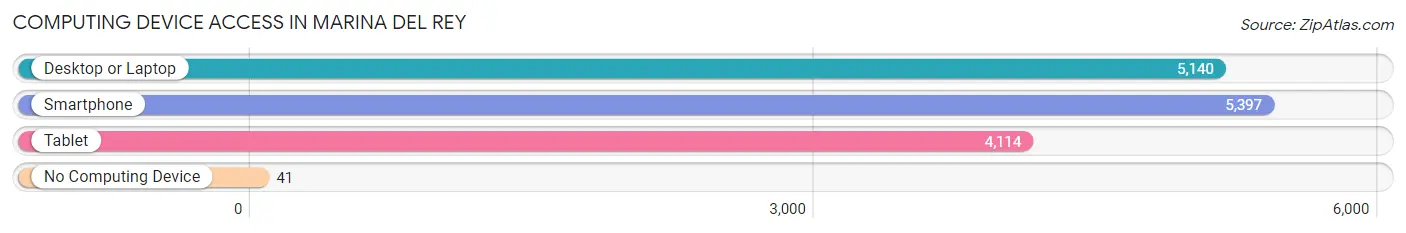
| Device Type | # Households | % Households |
| Desktop or Laptop | 5,140 | 93.3% |
| Smartphone | 5,397 | 97.9% |
| Tablet | 4,114 | 74.7% |
| No Computing Device | 41 | 0.7% |
| Total | 5,511 | 100.0% |
Internet Access in Marina Del Rey
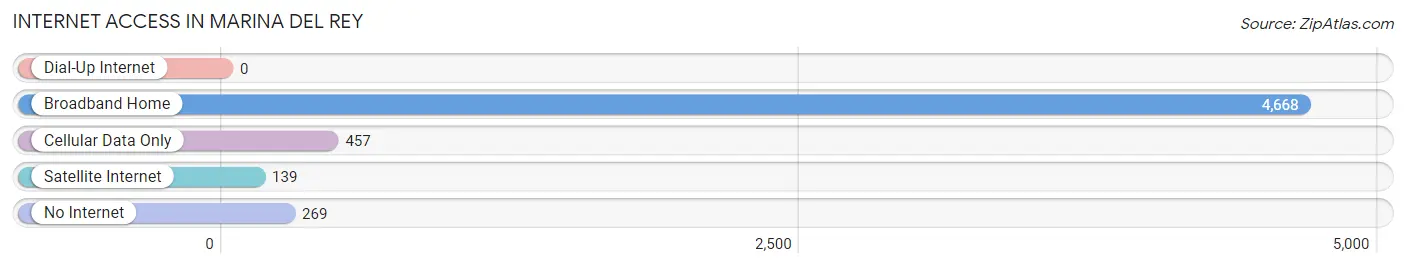
| Internet Type | # Households | % Households |
| Dial-Up Internet | 0 | 0.0% |
| Broadband Home | 4,668 | 84.7% |
| Cellular Data Only | 457 | 8.3% |
| Satellite Internet | 139 | 2.5% |
| No Internet | 269 | 4.9% |
| Total | 5,511 | 100.0% |
Marina Del Rey Summary
Marina Del Rey is a census-designated place located in Los Angeles County, California. It is situated on the coast of the Pacific Ocean, just south of the city of Los Angeles. The area is known for its marinas, boat docks, and canals, and is home to a variety of businesses, restaurants, and recreational activities.
History
Marina Del Rey was originally part of the Ballona Wetlands, a large marshland area that stretched from Playa Del Rey to Santa Monica. The area was home to the Tongva people, who lived in the area for thousands of years before the arrival of Europeans. In the late 19th century, the area was developed by the Ballona Land and Water Company, which built a network of canals and dredged the wetlands to create a harbor. The area was named “Marina Del Rey” in honor of the Spanish explorer, Juan Rodriguez Cabrillo, who explored the area in 1542.
In the early 20th century, the area was used as a military base and a port for the U.S. Navy. In the 1950s, the area was developed into a residential and commercial area, with the construction of the Marina Del Rey Harbor. The harbor was completed in 1965 and is now the largest man-made small-craft harbor in the United States.
Geography
Marina Del Rey is located in the southwestern corner of Los Angeles County, on the coast of the Pacific Ocean. It is bordered by the cities of Los Angeles, Culver City, and Venice. The area is approximately 4.5 square miles in size and is made up of a variety of landforms, including beaches, wetlands, and canals. The area is known for its marinas, boat docks, and canals, which are home to a variety of businesses, restaurants, and recreational activities.
Economy
Marina Del Rey is home to a variety of businesses, including restaurants, hotels, marinas, boat docks, and recreational activities. The area is also home to a number of technology companies, including Google, Microsoft, and Apple. The area is also home to a number of film and television production companies, including Warner Bros., Universal, and Paramount.
Demographics
As of the 2010 census, the population of Marina Del Rey was 8,866. The population is predominantly white (77.2%), with a significant Hispanic population (17.2%). The median household income is $76,817, and the median age is 43. The area is also home to a large number of college-educated residents (44.2%).
Marina Del Rey is a vibrant and diverse community that is home to a variety of businesses, restaurants, and recreational activities. The area is known for its marinas, boat docks, and canals, and is home to a variety of businesses, restaurants, and recreational activities. The area is also home to a number of technology companies, film and television production companies, and a large number of college-educated residents.
Common Questions
What is Per Capita Income in Marina Del Rey?
Per Capita income in Marina Del Rey is $94,583.
What is the Median Family Income in Marina Del Rey?
Median Family Income in Marina Del Rey is $177,703.
What is the Median Household income in Marina Del Rey?
Median Household Income in Marina Del Rey is $135,584.
What is Income or Wage Gap in Marina Del Rey?
Income or Wage Gap in Marina Del Rey is 6.0%.
Women in Marina Del Rey earn 94.0 cents for every dollar earned by a man.
What is Inequality or Gini Index in Marina Del Rey?
Inequality or Gini Index in Marina Del Rey is 0.43.
What is the Total Population of Marina Del Rey?
Total Population of Marina Del Rey is 10,274.
What is the Total Male Population of Marina Del Rey?
Total Male Population of Marina Del Rey is 4,758.
What is the Total Female Population of Marina Del Rey?
Total Female Population of Marina Del Rey is 5,516.
What is the Ratio of Males per 100 Females in Marina Del Rey?
There are 86.26 Males per 100 Females in Marina Del Rey.
What is the Ratio of Females per 100 Males in Marina Del Rey?
There are 115.93 Females per 100 Males in Marina Del Rey.
What is the Median Population Age in Marina Del Rey?
Median Population Age in Marina Del Rey is 37.4 Years.
What is the Average Family Size in Marina Del Rey
Average Family Size in Marina Del Rey is 2.6 People.
What is the Average Household Size in Marina Del Rey
Average Household Size in Marina Del Rey is 1.9 People.
How Large is the Labor Force in Marina Del Rey?
There are 7,867 People in the Labor Forcein in Marina Del Rey.
What is the Percentage of People in the Labor Force in Marina Del Rey?
86.4% of People are in the Labor Force in Marina Del Rey.
What is the Unemployment Rate in Marina Del Rey?
Unemployment Rate in Marina Del Rey is 5.2%.