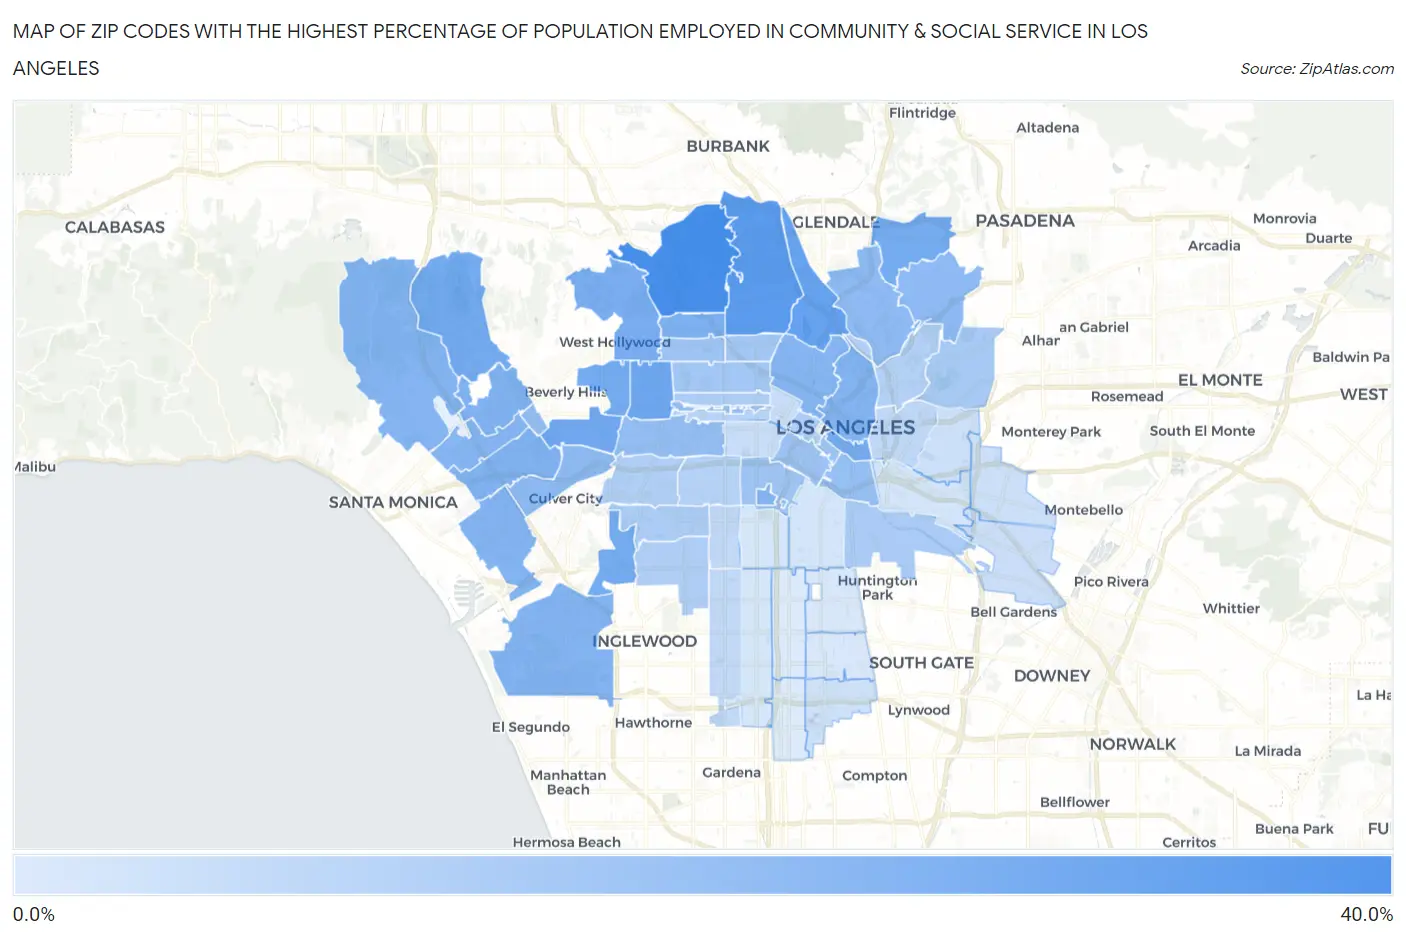
Zip Codes with the Highest Percentage of Population Employed in Community & Social Service in Los Angeles, CA
RELATED REPORTS & OPTIONS
Community & Social Service
Los Angeles
Compare Zip Codes
Map of Zip Codes with the Highest Percentage of Population Employed in Community & Social Service in Los Angeles
4.6%
36.8%
Zip Codes with the Highest Percentage of Population Employed in Community & Social Service in Los Angeles, CA
| Zip Code | % Employed | vs State | vs National | |
| 1. | 90068 | 36.8% | 11.5%(+25.3)#22 | 11.2%(+25.5)#356 |
| 2. | 90027 | 32.4% | 11.5%(+21.0)#35 | 11.2%(+21.2)#470 |
| 3. | 90039 | 29.8% | 11.5%(+18.3)#42 | 11.2%(+18.6)#597 |
| 4. | 90036 | 27.6% | 11.5%(+16.1)#55 | 11.2%(+16.4)#721 |
| 5. | 90035 | 27.1% | 11.5%(+15.6)#59 | 11.2%(+15.9)#760 |
| 6. | 90056 | 26.2% | 11.5%(+14.7)#65 | 11.2%(+15.0)#851 |
| 7. | 90048 | 26.0% | 11.5%(+14.5)#67 | 11.2%(+14.8)#873 |
| 8. | 90013 | 26.0% | 11.5%(+14.5)#68 | 11.2%(+14.7)#875 |
| 9. | 90077 | 25.9% | 11.5%(+14.4)#69 | 11.2%(+14.7)#878 |
| 10. | 90041 | 25.7% | 11.5%(+14.2)#72 | 11.2%(+14.5)#903 |
| 11. | 90046 | 25.0% | 11.5%(+13.5)#81 | 11.2%(+13.7)#989 |
| 12. | 90028 | 24.0% | 11.5%(+12.6)#91 | 11.2%(+12.8)#1,101 |
| 13. | 90064 | 23.4% | 11.5%(+12.0)#97 | 11.2%(+12.2)#1,204 |
| 14. | 90024 | 23.2% | 11.5%(+11.7)#101 | 11.2%(+12.0)#1,243 |
| 15. | 90012 | 22.8% | 11.5%(+11.3)#112 | 11.2%(+11.6)#1,309 |
| 16. | 90066 | 22.8% | 11.5%(+11.3)#113 | 11.2%(+11.5)#1,320 |
| 17. | 90045 | 22.7% | 11.5%(+11.2)#114 | 11.2%(+11.5)#1,329 |
| 18. | 90026 | 22.6% | 11.5%(+11.1)#119 | 11.2%(+11.4)#1,347 |
| 19. | 90089 | 22.5% | 11.5%(+11.0)#122 | 11.2%(+11.3)#1,361 |
| 20. | 90049 | 22.2% | 11.5%(+10.7)#126 | 11.2%(+11.0)#1,433 |
| 21. | 90025 | 22.1% | 11.5%(+10.6)#127 | 11.2%(+10.9)#1,454 |
| 22. | 90065 | 20.3% | 11.5%(+8.85)#158 | 11.2%(+9.12)#1,923 |
| 23. | 90042 | 20.3% | 11.5%(+8.83)#159 | 11.2%(+9.10)#1,926 |
| 24. | 90034 | 20.3% | 11.5%(+8.81)#161 | 11.2%(+9.08)#1,932 |
| 25. | 90067 | 19.5% | 11.5%(+8.05)#178 | 11.2%(+8.32)#2,186 |
| 26. | 90019 | 19.2% | 11.5%(+7.67)#188 | 11.2%(+7.94)#2,330 |
| 27. | 90010 | 19.1% | 11.5%(+7.58)#192 | 11.2%(+7.85)#2,369 |
| 28. | 90021 | 19.0% | 11.5%(+7.50)#196 | 11.2%(+7.77)#2,403 |
| 29. | 90015 | 17.9% | 11.5%(+6.40)#222 | 11.2%(+6.67)#2,880 |
| 30. | 90014 | 17.4% | 11.5%(+5.94)#238 | 11.2%(+6.21)#3,098 |
| 31. | 90038 | 16.9% | 11.5%(+5.46)#261 | 11.2%(+5.73)#3,421 |
| 32. | 90007 | 16.8% | 11.5%(+5.32)#266 | 11.2%(+5.59)#3,511 |
| 33. | 90029 | 16.0% | 11.5%(+4.55)#312 | 11.2%(+4.82)#4,051 |
| 34. | 90004 | 16.0% | 11.5%(+4.49)#315 | 11.2%(+4.76)#4,085 |
| 35. | 90032 | 15.0% | 11.5%(+3.51)#385 | 11.2%(+3.78)#4,973 |
| 36. | 90058 | 14.6% | 11.5%(+3.09)#411 | 11.2%(+3.36)#5,397 |
| 37. | 90008 | 14.0% | 11.5%(+2.50)#456 | 11.2%(+2.77)#6,098 |
| 38. | 90020 | 13.6% | 11.5%(+2.08)#491 | 11.2%(+2.35)#6,660 |
| 39. | 90017 | 13.5% | 11.5%(+2.04)#500 | 11.2%(+2.31)#6,715 |
| 40. | 90043 | 13.5% | 11.5%(+1.99)#504 | 11.2%(+2.26)#6,789 |
| 41. | 90016 | 13.2% | 11.5%(+1.68)#542 | 11.2%(+1.95)#7,292 |
| 42. | 90031 | 12.8% | 11.5%(+1.32)#575 | 11.2%(+1.59)#7,872 |
| 43. | 90018 | 12.3% | 11.5%(+0.851)#615 | 11.2%(+1.12)#8,725 |
| 44. | 90005 | 11.6% | 11.5%(+0.125)#713 | 11.2%(+0.395)#10,211 |
| 45. | 90033 | 10.2% | 11.5%(-1.28)#896 | 11.2%(-1.01)#13,593 |
| 46. | 90047 | 9.9% | 11.5%(-1.56)#934 | 11.2%(-1.29)#14,323 |
| 47. | 90062 | 9.8% | 11.5%(-1.72)#951 | 11.2%(-1.45)#14,713 |
| 48. | 90006 | 8.8% | 11.5%(-2.72)#1,077 | 11.2%(-2.45)#17,457 |
| 49. | 90057 | 8.2% | 11.5%(-3.29)#1,137 | 11.2%(-3.02)#19,022 |
| 50. | 90040 | 8.1% | 11.5%(-3.39)#1,151 | 11.2%(-3.12)#19,305 |
| 51. | 90063 | 7.9% | 11.5%(-3.61)#1,176 | 11.2%(-3.34)#19,954 |
| 52. | 90022 | 7.7% | 11.5%(-3.80)#1,201 | 11.2%(-3.53)#20,431 |
| 53. | 90059 | 7.4% | 11.5%(-4.11)#1,236 | 11.2%(-3.84)#21,224 |
| 54. | 90011 | 6.3% | 11.5%(-5.19)#1,374 | 11.2%(-4.92)#23,728 |
| 55. | 90023 | 6.3% | 11.5%(-5.21)#1,376 | 11.2%(-4.94)#23,768 |
| 56. | 90037 | 5.9% | 11.5%(-5.58)#1,417 | 11.2%(-5.31)#24,551 |
| 57. | 90044 | 5.9% | 11.5%(-5.62)#1,420 | 11.2%(-5.35)#24,642 |
| 58. | 90002 | 5.6% | 11.5%(-5.92)#1,435 | 11.2%(-5.65)#25,206 |
| 59. | 90001 | 5.4% | 11.5%(-6.13)#1,445 | 11.2%(-5.86)#25,609 |
| 60. | 90061 | 4.7% | 11.5%(-6.74)#1,486 | 11.2%(-6.47)#26,601 |
| 61. | 90003 | 4.6% | 11.5%(-6.89)#1,494 | 11.2%(-6.62)#26,812 |
1
Common Questions
What are the Top 10 Zip Codes with the Highest Percentage of Population Employed in Community & Social Service in Los Angeles, CA?
Top 10 Zip Codes with the Highest Percentage of Population Employed in Community & Social Service in Los Angeles, CA are:
What zip code has the Highest Percentage of Population Employed in Community & Social Service in Los Angeles, CA?
90068 has the Highest Percentage of Population Employed in Community & Social Service in Los Angeles, CA with 36.8%.
What is the Percentage of Population Employed in Community & Social Service in Los Angeles, CA?
Percentage of Population Employed in Community & Social Service in Los Angeles is 15.7%.
What is the Percentage of Population Employed in Community & Social Service in California?
Percentage of Population Employed in Community & Social Service in California is 11.5%.
What is the Percentage of Population Employed in Community & Social Service in the United States?
Percentage of Population Employed in Community & Social Service in the United States is 11.2%.