Cities with the Highest Percentage of Population Employed in Community & Social Service in South Carolina
RELATED REPORTS & OPTIONS
Community & Social Service
South Carolina
Compare Cities
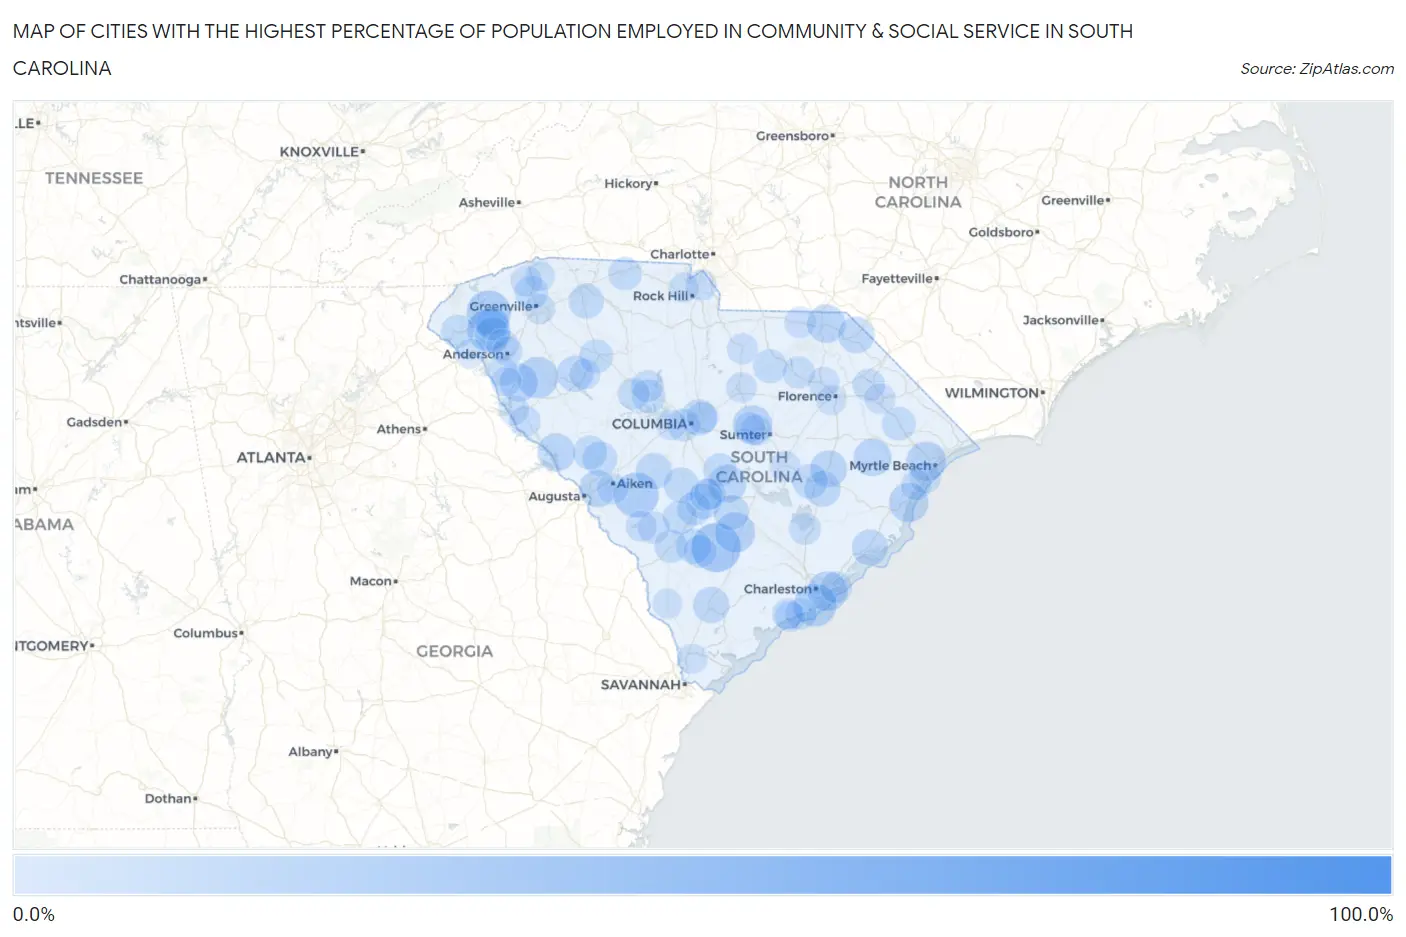
Map of Cities with the Highest Percentage of Population Employed in Community & Social Service in South Carolina
0.0%
100.0%
Cities with the Highest Percentage of Population Employed in Community & Social Service in South Carolina
| City | % Employed | vs State | vs National | |
| 1. | Caesars Head | 100.0% | 10.4%(+89.6)#1 | 11.2%(+88.8)#25 |
| 2. | Smoaks | 37.0% | 10.4%(+26.6)#2 | 11.2%(+25.8)#432 |
| 3. | Zion | 34.5% | 10.4%(+24.1)#3 | 11.2%(+23.3)#523 |
| 4. | Windsor | 31.6% | 10.4%(+21.2)#4 | 11.2%(+20.4)#654 |
| 5. | Adams Run | 31.2% | 10.4%(+20.8)#5 | 11.2%(+20.0)#674 |
| 6. | Six Mile | 30.8% | 10.4%(+20.4)#6 | 11.2%(+19.5)#706 |
| 7. | Foreston | 30.0% | 10.4%(+19.6)#7 | 11.2%(+18.8)#754 |
| 8. | Folly Beach | 29.4% | 10.4%(+19.0)#8 | 11.2%(+18.2)#802 |
| 9. | Clemson | 29.1% | 10.4%(+18.7)#9 | 11.2%(+17.9)#821 |
| 10. | Due West | 27.2% | 10.4%(+16.8)#10 | 11.2%(+15.9)#989 |
| 11. | Buford | 26.0% | 10.4%(+15.6)#11 | 11.2%(+14.8)#1,103 |
| 12. | Reevesville | 25.9% | 10.4%(+15.5)#12 | 11.2%(+14.6)#1,114 |
| 13. | Sullivan S Island | 25.5% | 10.4%(+15.1)#13 | 11.2%(+14.3)#1,144 |
| 14. | Forestbrook | 25.1% | 10.4%(+14.7)#14 | 11.2%(+13.9)#1,191 |
| 15. | Oakland | 25.0% | 10.4%(+14.6)#15 | 11.2%(+13.8)#1,210 |
| 16. | Pawleys Island | 25.0% | 10.4%(+14.6)#16 | 11.2%(+13.8)#1,224 |
| 17. | South Union | 24.8% | 10.4%(+14.4)#17 | 11.2%(+13.6)#1,262 |
| 18. | Wallace | 23.7% | 10.4%(+13.3)#18 | 11.2%(+12.5)#1,457 |
| 19. | Antreville | 23.7% | 10.4%(+13.3)#19 | 11.2%(+12.5)#1,458 |
| 20. | Cameron | 23.2% | 10.4%(+12.8)#20 | 11.2%(+12.0)#1,549 |
| 21. | Parksville | 23.1% | 10.4%(+12.7)#21 | 11.2%(+11.9)#1,586 |
| 22. | Hemingway | 22.7% | 10.4%(+12.3)#22 | 11.2%(+11.5)#1,662 |
| 23. | Burnettown | 22.0% | 10.4%(+11.6)#23 | 11.2%(+10.8)#1,819 |
| 24. | Kingstree | 21.8% | 10.4%(+11.4)#24 | 11.2%(+10.6)#1,861 |
| 25. | Tatum | 21.4% | 10.4%(+11.0)#25 | 11.2%(+10.2)#1,953 |
| 26. | Wagener | 21.3% | 10.4%(+10.9)#26 | 11.2%(+10.1)#1,971 |
| 27. | Waterloo | 21.2% | 10.4%(+10.8)#27 | 11.2%(+10.0)#1,995 |
| 28. | Yemassee | 21.2% | 10.4%(+10.8)#28 | 11.2%(+10.0)#2,002 |
| 29. | East Camden | 21.0% | 10.4%(+10.6)#29 | 11.2%(+9.81)#2,057 |
| 30. | Forest Acres | 21.0% | 10.4%(+10.6)#30 | 11.2%(+9.80)#2,059 |
| 31. | Mcclellanville | 20.9% | 10.4%(+10.5)#31 | 11.2%(+9.69)#2,092 |
| 32. | Lane | 20.7% | 10.4%(+10.3)#32 | 11.2%(+9.50)#2,140 |
| 33. | La France | 20.6% | 10.4%(+10.2)#33 | 11.2%(+9.40)#2,168 |
| 34. | Pendleton | 20.4% | 10.4%(+10.0)#34 | 11.2%(+9.23)#2,231 |
| 35. | Cordova | 20.2% | 10.4%(+9.84)#35 | 11.2%(+9.02)#2,306 |
| 36. | Greeleyville | 20.0% | 10.4%(+9.60)#36 | 11.2%(+8.79)#2,391 |
| 37. | Bowman | 19.9% | 10.4%(+9.50)#37 | 11.2%(+8.68)#2,450 |
| 38. | Roebuck | 19.8% | 10.4%(+9.38)#38 | 11.2%(+8.56)#2,487 |
| 39. | Clemson University | 19.7% | 10.4%(+9.30)#39 | 11.2%(+8.48)#2,517 |
| 40. | Livingston | 19.6% | 10.4%(+9.21)#40 | 11.2%(+8.39)#2,556 |
| 41. | Ehrhardt | 19.3% | 10.4%(+8.88)#41 | 11.2%(+8.06)#2,690 |
| 42. | Trenton | 19.0% | 10.4%(+8.65)#42 | 11.2%(+7.83)#2,767 |
| 43. | Denmark | 18.6% | 10.4%(+8.17)#43 | 11.2%(+7.36)#2,975 |
| 44. | Edgefield | 18.5% | 10.4%(+8.07)#44 | 11.2%(+7.26)#3,020 |
| 45. | Bethune | 18.2% | 10.4%(+7.84)#45 | 11.2%(+7.03)#3,135 |
| 46. | Cope | 18.2% | 10.4%(+7.78)#46 | 11.2%(+6.97)#3,175 |
| 47. | Aynor | 18.1% | 10.4%(+7.74)#47 | 11.2%(+6.93)#3,187 |
| 48. | Clinton | 18.1% | 10.4%(+7.70)#48 | 11.2%(+6.89)#3,207 |
| 49. | Little Mountain | 18.1% | 10.4%(+7.66)#49 | 11.2%(+6.84)#3,225 |
| 50. | St Matthews | 17.9% | 10.4%(+7.53)#50 | 11.2%(+6.71)#3,282 |
| 51. | Travelers Rest | 17.7% | 10.4%(+7.26)#51 | 11.2%(+6.44)#3,422 |
| 52. | Ulmer | 17.5% | 10.4%(+7.14)#52 | 11.2%(+6.33)#3,497 |
| 53. | East Gaffney | 17.5% | 10.4%(+7.11)#53 | 11.2%(+6.30)#3,518 |
| 54. | Central | 17.5% | 10.4%(+7.06)#54 | 11.2%(+6.25)#3,550 |
| 55. | Westminster | 17.4% | 10.4%(+6.96)#55 | 11.2%(+6.14)#3,612 |
| 56. | Dacusville | 17.1% | 10.4%(+6.74)#56 | 11.2%(+5.93)#3,737 |
| 57. | Lodge | 17.1% | 10.4%(+6.74)#57 | 11.2%(+5.93)#3,739 |
| 58. | Sellers | 16.7% | 10.4%(+6.27)#58 | 11.2%(+5.45)#4,013 |
| 59. | West Columbia | 16.6% | 10.4%(+6.22)#59 | 11.2%(+5.40)#4,052 |
| 60. | Edisto | 16.6% | 10.4%(+6.15)#60 | 11.2%(+5.34)#4,102 |
| 61. | Hartsville | 16.4% | 10.4%(+6.02)#61 | 11.2%(+5.21)#4,186 |
| 62. | Barnwell | 16.4% | 10.4%(+5.97)#62 | 11.2%(+5.15)#4,222 |
| 63. | Pomaria | 16.3% | 10.4%(+5.88)#63 | 11.2%(+5.06)#4,283 |
| 64. | Pinopolis | 16.0% | 10.4%(+5.60)#64 | 11.2%(+4.79)#4,475 |
| 65. | Prosperity | 15.9% | 10.4%(+5.53)#65 | 11.2%(+4.72)#4,522 |
| 66. | Isle Of Palms | 15.8% | 10.4%(+5.43)#66 | 11.2%(+4.61)#4,608 |
| 67. | Columbia | 15.7% | 10.4%(+5.26)#67 | 11.2%(+4.44)#4,753 |
| 68. | Northlake | 15.6% | 10.4%(+5.18)#68 | 11.2%(+4.37)#4,811 |
| 69. | Orangeburg | 15.5% | 10.4%(+5.14)#69 | 11.2%(+4.33)#4,841 |
| 70. | Surfside Beach | 15.3% | 10.4%(+4.95)#70 | 11.2%(+4.13)#5,016 |
| 71. | Chesterfield | 15.3% | 10.4%(+4.87)#71 | 11.2%(+4.05)#5,079 |
| 72. | Kiawah Island | 15.1% | 10.4%(+4.71)#72 | 11.2%(+3.89)#5,233 |
| 73. | Mount Carmel | 15.1% | 10.4%(+4.69)#73 | 11.2%(+3.88)#5,239 |
| 74. | Cherryvale | 15.1% | 10.4%(+4.68)#74 | 11.2%(+3.86)#5,256 |
| 75. | Slater Marietta | 15.1% | 10.4%(+4.66)#75 | 11.2%(+3.85)#5,268 |
| 76. | Snelling | 15.0% | 10.4%(+4.64)#76 | 11.2%(+3.82)#5,295 |
| 77. | Aiken | 14.9% | 10.4%(+4.51)#77 | 11.2%(+3.70)#5,416 |
| 78. | Darlington | 14.8% | 10.4%(+4.43)#78 | 11.2%(+3.62)#5,494 |
| 79. | Marion | 14.8% | 10.4%(+4.40)#79 | 11.2%(+3.58)#5,536 |
| 80. | Kershaw | 14.8% | 10.4%(+4.36)#80 | 11.2%(+3.54)#5,568 |
| 81. | Fort Mill | 14.7% | 10.4%(+4.25)#81 | 11.2%(+3.44)#5,685 |
| 82. | Rockville | 14.6% | 10.4%(+4.23)#82 | 11.2%(+3.42)#5,712 |
| 83. | Manning | 14.5% | 10.4%(+4.14)#83 | 11.2%(+3.33)#5,809 |
| 84. | Stateburg | 14.5% | 10.4%(+4.13)#84 | 11.2%(+3.31)#5,821 |
| 85. | Seabrook Island | 14.5% | 10.4%(+4.10)#85 | 11.2%(+3.29)#5,842 |
| 86. | Mountville | 14.4% | 10.4%(+4.03)#86 | 11.2%(+3.22)#5,915 |
| 87. | Camden | 14.4% | 10.4%(+3.96)#87 | 11.2%(+3.15)#5,988 |
| 88. | Murrells Inlet | 14.3% | 10.4%(+3.87)#88 | 11.2%(+3.05)#6,121 |
| 89. | Greenville | 14.1% | 10.4%(+3.70)#89 | 11.2%(+2.89)#6,275 |
| 90. | Starr | 14.1% | 10.4%(+3.68)#90 | 11.2%(+2.87)#6,296 |
| 91. | Calhoun Falls | 14.1% | 10.4%(+3.66)#91 | 11.2%(+2.85)#6,320 |
| 92. | Lexington | 14.0% | 10.4%(+3.56)#92 | 11.2%(+2.74)#6,442 |
| 93. | Florence | 13.9% | 10.4%(+3.54)#93 | 11.2%(+2.72)#6,468 |
| 94. | Iva | 13.8% | 10.4%(+3.44)#94 | 11.2%(+2.62)#6,589 |
| 95. | Newport | 13.8% | 10.4%(+3.41)#95 | 11.2%(+2.60)#6,615 |
| 96. | Fair Play | 13.7% | 10.4%(+3.33)#96 | 11.2%(+2.52)#6,722 |
| 97. | Scotia | 13.6% | 10.4%(+3.24)#97 | 11.2%(+2.42)#6,837 |
| 98. | Hardeeville | 13.6% | 10.4%(+3.23)#98 | 11.2%(+2.42)#6,846 |
| 99. | Anderson | 13.6% | 10.4%(+3.19)#99 | 11.2%(+2.38)#6,887 |
| 100. | Tigerville | 13.6% | 10.4%(+3.18)#100 | 11.2%(+2.37)#6,896 |
Common Questions
What are the Top 10 Cities with the Highest Percentage of Population Employed in Community & Social Service in South Carolina?
Top 10 Cities with the Highest Percentage of Population Employed in Community & Social Service in South Carolina are:
#1
37.0%
#2
31.6%
#3
30.8%
#4
29.4%
#5
29.1%
#6
27.2%
#7
25.9%
#8
25.5%
#9
25.1%
#10
25.0%
What city has the Highest Percentage of Population Employed in Community & Social Service in South Carolina?
Smoaks has the Highest Percentage of Population Employed in Community & Social Service in South Carolina with 37.0%.
What is the Percentage of Population Employed in Community & Social Service in the State of South Carolina?
Percentage of Population Employed in Community & Social Service in South Carolina is 10.4%.
What is the Percentage of Population Employed in Community & Social Service in the United States?
Percentage of Population Employed in Community & Social Service in the United States is 11.2%.