Cities with the Highest Percentage of Population Employed in Community & Social Service in Oklahoma
RELATED REPORTS & OPTIONS
Community & Social Service
Oklahoma
Compare Cities
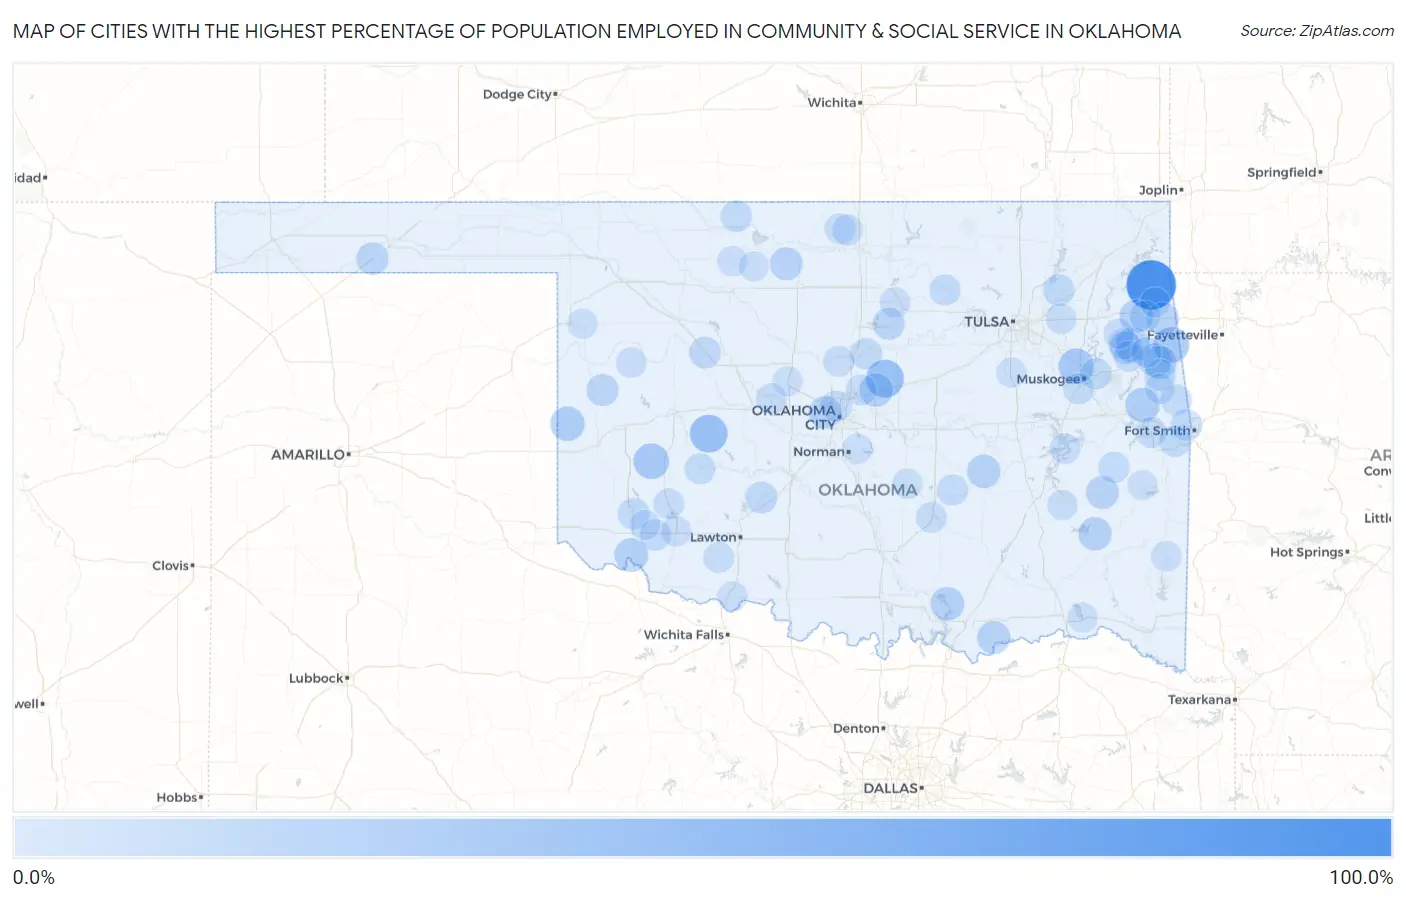
Map of Cities with the Highest Percentage of Population Employed in Community & Social Service in Oklahoma
0.0%
100.0%
Cities with the Highest Percentage of Population Employed in Community & Social Service in Oklahoma
| City | % Employed | vs State | vs National | |
| 1. | Brush Creek | 100.0% | 10.6%(+89.4)#1 | 11.2%(+88.8)#8 |
| 2. | Caney Ridge | 51.3% | 10.6%(+40.7)#2 | 11.2%(+40.1)#178 |
| 3. | Fallis | 48.4% | 10.6%(+37.8)#3 | 11.2%(+37.2)#217 |
| 4. | Colony | 47.7% | 10.6%(+37.1)#4 | 11.2%(+36.5)#231 |
| 5. | Cave Spring | 47.6% | 10.6%(+37.0)#5 | 11.2%(+36.4)#235 |
| 6. | Old Green | 39.1% | 10.6%(+28.5)#6 | 11.2%(+27.9)#370 |
| 7. | Sentinel | 38.6% | 10.6%(+28.0)#7 | 11.2%(+27.4)#385 |
| 8. | Tullahassee | 37.5% | 10.6%(+26.9)#8 | 11.2%(+26.3)#409 |
| 9. | Reagan | 36.4% | 10.6%(+25.8)#9 | 11.2%(+25.1)#454 |
| 10. | Sand Point | 36.0% | 10.6%(+25.4)#10 | 11.2%(+24.8)#464 |
| 11. | Scipio | 35.5% | 10.6%(+24.9)#11 | 11.2%(+24.3)#479 |
| 12. | Enterprise | 33.9% | 10.6%(+23.3)#12 | 11.2%(+22.7)#545 |
| 13. | Sweetwater | 33.3% | 10.6%(+22.7)#13 | 11.2%(+22.1)#561 |
| 14. | Dwight Mission | 33.3% | 10.6%(+22.7)#14 | 11.2%(+22.1)#570 |
| 15. | Steely Hollow | 32.9% | 10.6%(+22.3)#15 | 11.2%(+21.7)#591 |
| 16. | Mcbride | 32.1% | 10.6%(+21.5)#16 | 11.2%(+20.9)#630 |
| 17. | Titanic | 30.0% | 10.6%(+19.4)#17 | 11.2%(+18.8)#752 |
| 18. | Elmer | 30.0% | 10.6%(+19.4)#18 | 11.2%(+18.8)#757 |
| 19. | Luther | 29.7% | 10.6%(+19.1)#19 | 11.2%(+18.5)#774 |
| 20. | Bee | 29.4% | 10.6%(+18.8)#20 | 11.2%(+18.2)#799 |
| 21. | Mulberry | 29.2% | 10.6%(+18.6)#21 | 11.2%(+18.0)#817 |
| 22. | Leach | 29.1% | 10.6%(+18.5)#22 | 11.2%(+17.9)#823 |
| 23. | Horntown | 28.9% | 10.6%(+18.3)#23 | 11.2%(+17.7)#835 |
| 24. | Tuskahoma | 28.6% | 10.6%(+18.0)#24 | 11.2%(+17.4)#863 |
| 25. | Albany | 28.0% | 10.6%(+17.4)#25 | 11.2%(+16.8)#910 |
| 26. | Bug Tussle | 27.8% | 10.6%(+17.2)#26 | 11.2%(+16.6)#924 |
| 27. | Panola | 27.3% | 10.6%(+16.7)#27 | 11.2%(+16.1)#977 |
| 28. | Hillsdale | 27.0% | 10.6%(+16.4)#28 | 11.2%(+15.8)#1,004 |
| 29. | Grandview | 26.5% | 10.6%(+15.9)#29 | 11.2%(+15.3)#1,056 |
| 30. | Woodlawn Park | 26.4% | 10.6%(+15.8)#30 | 11.2%(+15.2)#1,063 |
| 31. | Dripping Springs | 26.1% | 10.6%(+15.5)#31 | 11.2%(+14.9)#1,098 |
| 32. | Preston | 25.4% | 10.6%(+14.8)#32 | 11.2%(+14.2)#1,163 |
| 33. | Emet | 25.0% | 10.6%(+14.4)#33 | 11.2%(+13.8)#1,230 |
| 34. | Goodwell | 24.6% | 10.6%(+14.0)#34 | 11.2%(+13.4)#1,282 |
| 35. | Sparrowhawk | 24.6% | 10.6%(+14.0)#35 | 11.2%(+13.4)#1,293 |
| 36. | Milfay | 24.5% | 10.6%(+13.9)#36 | 11.2%(+13.3)#1,311 |
| 37. | Strong City | 23.8% | 10.6%(+13.2)#37 | 11.2%(+12.6)#1,433 |
| 38. | Stillwater | 23.5% | 10.6%(+12.9)#38 | 11.2%(+12.2)#1,502 |
| 39. | Cyril | 23.3% | 10.6%(+12.7)#39 | 11.2%(+12.1)#1,533 |
| 40. | Oakwood | 22.9% | 10.6%(+12.3)#40 | 11.2%(+11.6)#1,630 |
| 41. | Oak Hill-Piney | 22.6% | 10.6%(+12.0)#41 | 11.2%(+11.4)#1,688 |
| 42. | Bache | 22.2% | 10.6%(+11.6)#42 | 11.2%(+11.0)#1,774 |
| 43. | Barber | 21.9% | 10.6%(+11.3)#43 | 11.2%(+10.7)#1,841 |
| 44. | Sequoyah | 21.9% | 10.6%(+11.3)#44 | 11.2%(+10.7)#1,850 |
| 45. | Lyons Switch | 21.8% | 10.6%(+11.2)#45 | 11.2%(+10.6)#1,864 |
| 46. | Blair | 21.8% | 10.6%(+11.2)#46 | 11.2%(+10.6)#1,875 |
| 47. | Briartown | 21.7% | 10.6%(+11.1)#47 | 11.2%(+10.5)#1,880 |
| 48. | Langston | 21.5% | 10.6%(+10.9)#48 | 11.2%(+10.2)#1,944 |
| 49. | Fort Gibson | 21.1% | 10.6%(+10.5)#49 | 11.2%(+9.92)#2,026 |
| 50. | Moffett | 21.1% | 10.6%(+10.4)#50 | 11.2%(+9.84)#2,051 |
| 51. | Burlington | 21.0% | 10.6%(+10.3)#51 | 11.2%(+9.74)#2,078 |
| 52. | Twin Oaks | 20.7% | 10.6%(+10.1)#52 | 11.2%(+9.50)#2,137 |
| 53. | Fort Coffee | 20.6% | 10.6%(+9.98)#53 | 11.2%(+9.37)#2,173 |
| 54. | Headrick | 20.6% | 10.6%(+9.98)#54 | 11.2%(+9.37)#2,176 |
| 55. | Nichols Hills | 20.2% | 10.6%(+9.59)#55 | 11.2%(+8.99)#2,323 |
| 56. | Lequire | 20.0% | 10.6%(+9.40)#56 | 11.2%(+8.79)#2,403 |
| 57. | Summit | 20.0% | 10.6%(+9.40)#57 | 11.2%(+8.79)#2,410 |
| 58. | Sasakwa | 20.0% | 10.6%(+9.40)#58 | 11.2%(+8.79)#2,415 |
| 59. | Nicut | 19.8% | 10.6%(+9.21)#59 | 11.2%(+8.60)#2,478 |
| 60. | Brent | 19.5% | 10.6%(+8.88)#60 | 11.2%(+8.27)#2,610 |
| 61. | Mountain View | 19.4% | 10.6%(+8.77)#61 | 11.2%(+8.16)#2,649 |
| 62. | Blackburn | 19.4% | 10.6%(+8.75)#62 | 11.2%(+8.14)#2,663 |
| 63. | Cookson | 19.3% | 10.6%(+8.67)#63 | 11.2%(+8.06)#2,692 |
| 64. | Hough | 19.2% | 10.6%(+8.63)#64 | 11.2%(+8.02)#2,711 |
| 65. | Cumberland | 19.0% | 10.6%(+8.44)#65 | 11.2%(+7.83)#2,766 |
| 66. | Arcadia | 19.0% | 10.6%(+8.44)#66 | 11.2%(+7.83)#2,772 |
| 67. | Roosevelt | 19.0% | 10.6%(+8.40)#67 | 11.2%(+7.79)#2,794 |
| 68. | Deer Creek | 18.9% | 10.6%(+8.31)#68 | 11.2%(+7.70)#2,826 |
| 69. | Gideon | 18.9% | 10.6%(+8.26)#69 | 11.2%(+7.65)#2,848 |
| 70. | Cedar Valley | 18.8% | 10.6%(+8.18)#70 | 11.2%(+7.57)#2,887 |
| 71. | Faxon | 18.5% | 10.6%(+7.91)#71 | 11.2%(+7.30)#2,999 |
| 72. | Tahlequah | 18.5% | 10.6%(+7.87)#72 | 11.2%(+7.26)#3,019 |
| 73. | Nardin | 18.5% | 10.6%(+7.86)#73 | 11.2%(+7.25)#3,026 |
| 74. | Chance | 18.4% | 10.6%(+7.80)#74 | 11.2%(+7.19)#3,056 |
| 75. | Latta | 18.4% | 10.6%(+7.79)#75 | 11.2%(+7.18)#3,059 |
| 76. | Calumet | 17.8% | 10.6%(+7.17)#76 | 11.2%(+6.56)#3,360 |
| 77. | Smithville | 17.3% | 10.6%(+6.70)#77 | 11.2%(+6.09)#3,647 |
| 78. | Morrison | 17.3% | 10.6%(+6.65)#78 | 11.2%(+6.04)#3,666 |
| 79. | Longtown | 17.2% | 10.6%(+6.56)#79 | 11.2%(+5.95)#3,715 |
| 80. | Gregory | 17.1% | 10.6%(+6.54)#80 | 11.2%(+5.93)#3,735 |
| 81. | Carmen | 17.1% | 10.6%(+6.45)#81 | 11.2%(+5.84)#3,789 |
| 82. | Peggs | 16.9% | 10.6%(+6.28)#82 | 11.2%(+5.67)#3,873 |
| 83. | Leedey | 16.9% | 10.6%(+6.28)#83 | 11.2%(+5.67)#3,877 |
| 84. | Snyder | 16.8% | 10.6%(+6.16)#84 | 11.2%(+5.55)#3,933 |
| 85. | Hartshorne | 16.7% | 10.6%(+6.06)#85 | 11.2%(+5.45)#3,982 |
| 86. | Asher | 16.7% | 10.6%(+6.06)#86 | 11.2%(+5.45)#3,986 |
| 87. | Eldon | 16.7% | 10.6%(+6.06)#87 | 11.2%(+5.45)#3,991 |
| 88. | Cloud Creek | 16.7% | 10.6%(+6.06)#88 | 11.2%(+5.45)#4,003 |
| 89. | Friendship | 16.7% | 10.6%(+6.06)#90 | 11.2%(+5.45)#4,033 |
| 90. | Avard | 16.7% | 10.6%(+6.06)#91 | 11.2%(+5.45)#4,034 |
| 91. | Arnett | 16.3% | 10.6%(+5.70)#92 | 11.2%(+5.09)#4,257 |
| 92. | Okarche | 16.3% | 10.6%(+5.68)#93 | 11.2%(+5.07)#4,276 |
| 93. | Greasy | 16.3% | 10.6%(+5.67)#94 | 11.2%(+5.06)#4,280 |
| 94. | Beggs | 16.1% | 10.6%(+5.52)#95 | 11.2%(+4.91)#4,387 |
| 95. | Lowrey | 16.0% | 10.6%(+5.35)#96 | 11.2%(+4.74)#4,506 |
| 96. | Helena | 15.9% | 10.6%(+5.27)#97 | 11.2%(+4.66)#4,568 |
| 97. | Fanshawe | 15.8% | 10.6%(+5.24)#98 | 11.2%(+4.63)#4,595 |
| 98. | Norman | 15.8% | 10.6%(+5.20)#99 | 11.2%(+4.60)#4,620 |
| 99. | Sawyer | 15.7% | 10.6%(+5.11)#100 | 11.2%(+4.50)#4,703 |
| 100. | Randlett | 15.6% | 10.6%(+5.04)#101 | 11.2%(+4.43)#4,762 |
Common Questions
What are the Top 10 Cities with the Highest Percentage of Population Employed in Community & Social Service in Oklahoma?
Top 10 Cities with the Highest Percentage of Population Employed in Community & Social Service in Oklahoma are:
#1
100.0%
#2
48.4%
#3
47.7%
#4
39.1%
#5
38.6%
#6
37.5%
#7
33.3%
#8
33.3%
#9
32.9%
#10
30.0%
What city has the Highest Percentage of Population Employed in Community & Social Service in Oklahoma?
Brush Creek has the Highest Percentage of Population Employed in Community & Social Service in Oklahoma with 100.0%.
What is the Percentage of Population Employed in Community & Social Service in the State of Oklahoma?
Percentage of Population Employed in Community & Social Service in Oklahoma is 10.6%.
What is the Percentage of Population Employed in Community & Social Service in the United States?
Percentage of Population Employed in Community & Social Service in the United States is 11.2%.