Zip Codes with the Highest Percentage of Population Employed in Community & Social Service in Santa Barbara, CA
RELATED REPORTS & OPTIONS
Community & Social Service
Santa Barbara
Compare Zip Codes
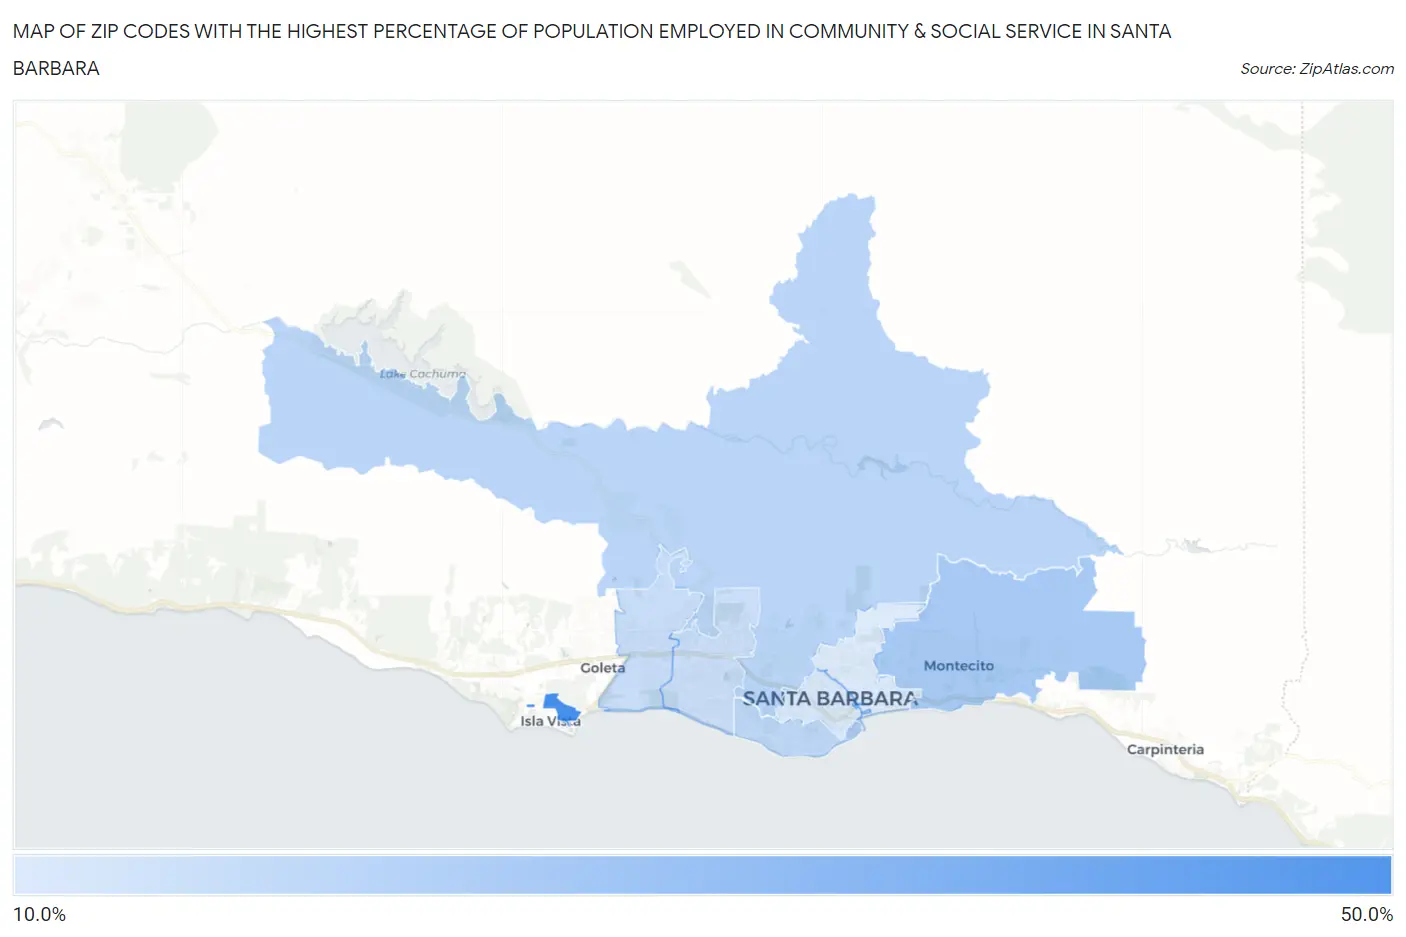
Map of Zip Codes with the Highest Percentage of Population Employed in Community & Social Service in Santa Barbara
10.2%
45.9%
Zip Codes with the Highest Percentage of Population Employed in Community & Social Service in Santa Barbara, CA
| Zip Code | % Employed | vs State | vs National | |
| 1. | 93106 | 45.9% | 11.5%(+34.4)#13 | 11.2%(+34.7)#210 |
| 2. | 93108 | 21.4% | 11.5%(+9.92)#142 | 11.2%(+10.2)#1,614 |
| 3. | 93105 | 17.3% | 11.5%(+5.79)#248 | 11.2%(+6.06)#3,199 |
| 4. | 93109 | 16.3% | 11.5%(+4.82)#295 | 11.2%(+5.09)#3,840 |
| 5. | 93111 | 14.8% | 11.5%(+3.28)#396 | 11.2%(+3.55)#5,198 |
| 6. | 93110 | 14.0% | 11.5%(+2.55)#453 | 11.2%(+2.82)#6,058 |
| 7. | 93101 | 11.2% | 11.5%(-0.281)#771 | 11.2%(-0.011)#11,117 |
| 8. | 93103 | 10.2% | 11.5%(-1.33)#906 | 11.2%(-1.06)#13,729 |
1
Common Questions
What are the Top 5 Zip Codes with the Highest Percentage of Population Employed in Community & Social Service in Santa Barbara, CA?
Top 5 Zip Codes with the Highest Percentage of Population Employed in Community & Social Service in Santa Barbara, CA are:
What zip code has the Highest Percentage of Population Employed in Community & Social Service in Santa Barbara, CA?
93106 has the Highest Percentage of Population Employed in Community & Social Service in Santa Barbara, CA with 45.9%.
What is the Percentage of Population Employed in Community & Social Service in Santa Barbara, CA?
Percentage of Population Employed in Community & Social Service in Santa Barbara is 13.0%.
What is the Percentage of Population Employed in Community & Social Service in California?
Percentage of Population Employed in Community & Social Service in California is 11.5%.
What is the Percentage of Population Employed in Community & Social Service in the United States?
Percentage of Population Employed in Community & Social Service in the United States is 11.2%.