Zip Codes with the Highest Percentage of Population Employed in Community & Social Service in Yuba City, CA
RELATED REPORTS & OPTIONS
Community & Social Service
Yuba City
Compare Zip Codes
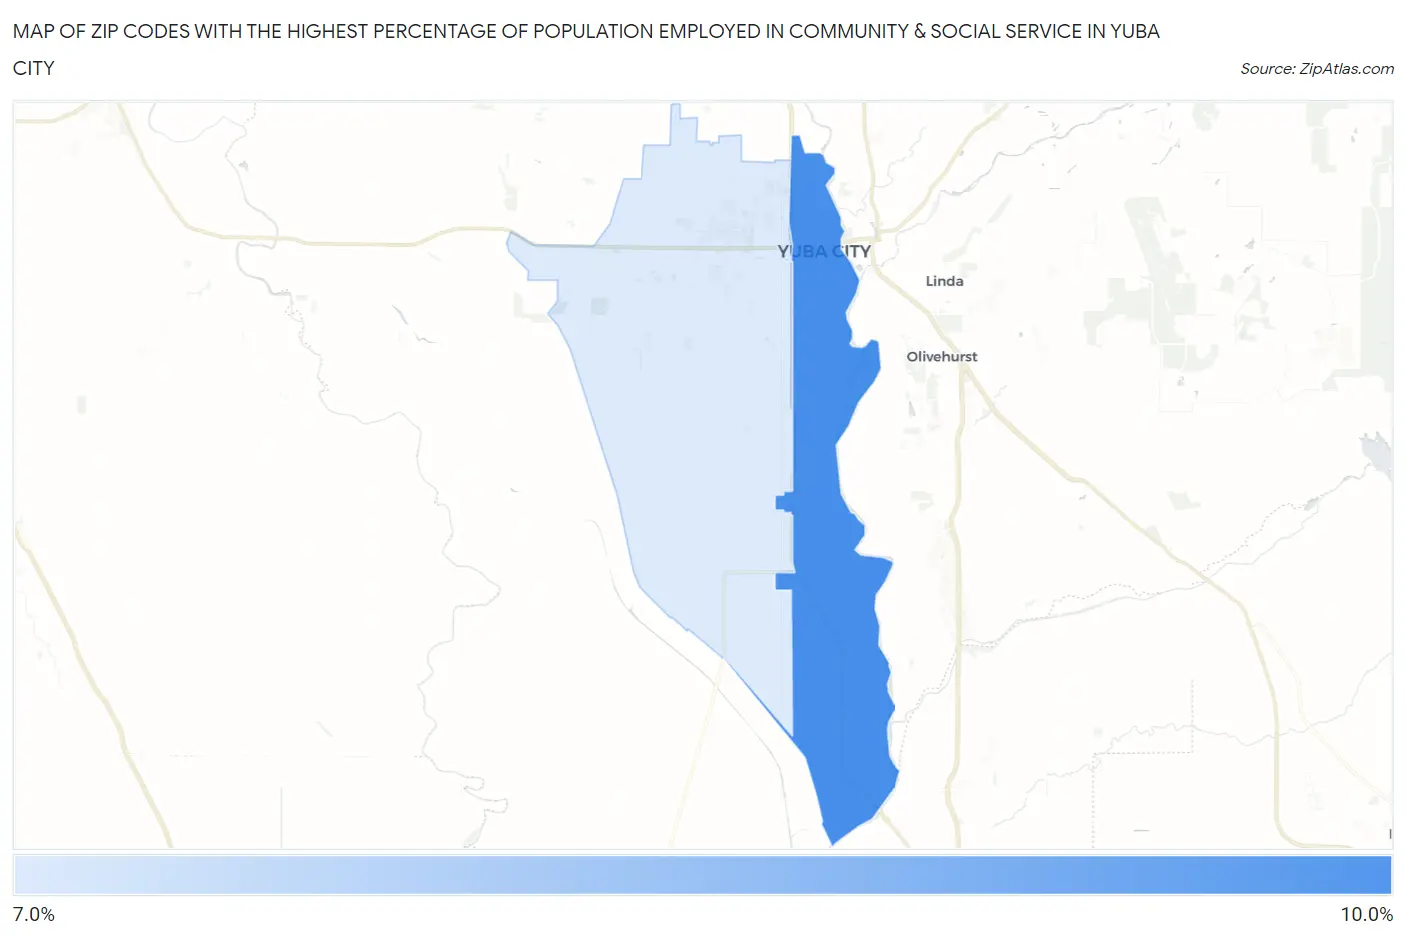
Map of Zip Codes with the Highest Percentage of Population Employed in Community & Social Service in Yuba City
7.6%
8.5%
Zip Codes with the Highest Percentage of Population Employed in Community & Social Service in Yuba City, CA
| Zip Code | % Employed | vs State | vs National | |
| 1. | 95991 | 8.5% | 11.5%(-2.96)#1,103 | 11.2%(-2.69)#18,097 |
| 2. | 95993 | 7.6% | 11.5%(-3.91)#1,214 | 11.2%(-3.64)#20,708 |
1
Common Questions
What are the Top Zip Codes with the Highest Percentage of Population Employed in Community & Social Service in Yuba City, CA?
Top Zip Codes with the Highest Percentage of Population Employed in Community & Social Service in Yuba City, CA are:
What zip code has the Highest Percentage of Population Employed in Community & Social Service in Yuba City, CA?
95991 has the Highest Percentage of Population Employed in Community & Social Service in Yuba City, CA with 8.5%.
What is the Percentage of Population Employed in Community & Social Service in Yuba City, CA?
Percentage of Population Employed in Community & Social Service in Yuba City is 8.3%.
What is the Percentage of Population Employed in Community & Social Service in California?
Percentage of Population Employed in Community & Social Service in California is 11.5%.
What is the Percentage of Population Employed in Community & Social Service in the United States?
Percentage of Population Employed in Community & Social Service in the United States is 11.2%.