Cities with the Highest Percentage of Population Employed in Community & Social Service in Tennessee
RELATED REPORTS & OPTIONS
Community & Social Service
Tennessee
Compare Cities
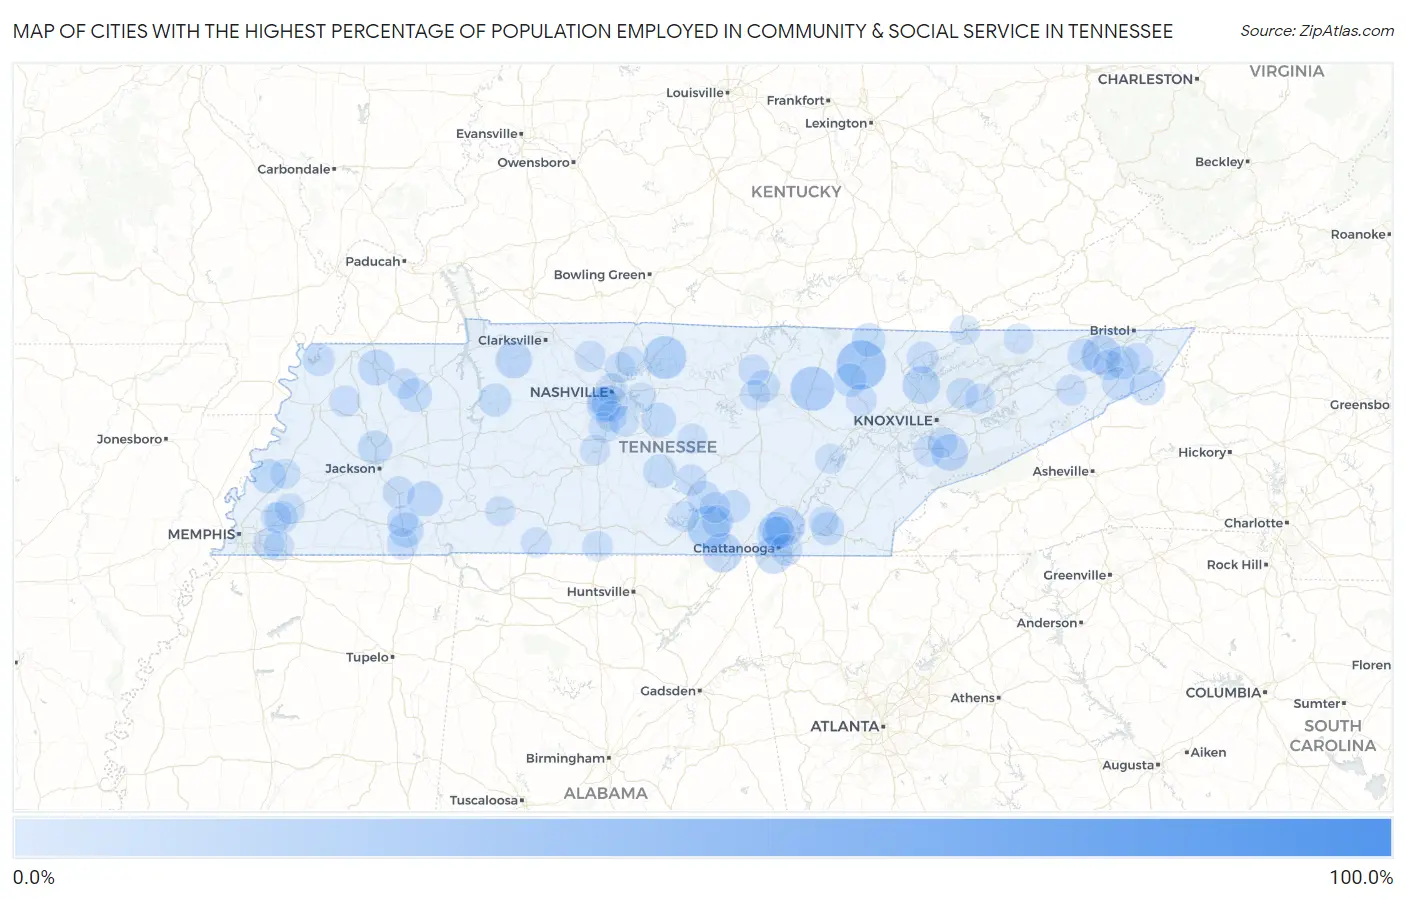
Map of Cities with the Highest Percentage of Population Employed in Community & Social Service in Tennessee
0.0%
100.0%
Cities with the Highest Percentage of Population Employed in Community & Social Service in Tennessee
| City | % Employed | vs State | vs National | |
| 1. | Buchanan | 100.0% | 10.4%(+89.6)#1 | 11.2%(+88.8)#14 |
| 2. | Mercer | 100.0% | 10.4%(+89.6)#2 | 11.2%(+88.8)#21 |
| 3. | Morris Chapel | 91.6% | 10.4%(+81.2)#3 | 11.2%(+80.4)#51 |
| 4. | Pocahontas | 42.3% | 10.4%(+31.9)#4 | 11.2%(+31.1)#322 |
| 5. | Robbins | 37.5% | 10.4%(+27.1)#5 | 11.2%(+26.3)#411 |
| 6. | Lenox | 34.3% | 10.4%(+23.9)#6 | 11.2%(+23.1)#530 |
| 7. | Clarkrange | 30.6% | 10.4%(+20.2)#7 | 11.2%(+19.4)#716 |
| 8. | Delano | 30.5% | 10.4%(+20.1)#8 | 11.2%(+19.3)#724 |
| 9. | Sewanee | 29.3% | 10.4%(+18.9)#9 | 11.2%(+18.1)#807 |
| 10. | Holladay | 29.0% | 10.4%(+18.6)#10 | 11.2%(+17.8)#825 |
| 11. | Castalian Springs | 28.9% | 10.4%(+18.5)#11 | 11.2%(+17.7)#833 |
| 12. | Luray | 28.2% | 10.4%(+17.8)#12 | 11.2%(+17.0)#887 |
| 13. | Blanche | 25.7% | 10.4%(+15.3)#13 | 11.2%(+14.5)#1,131 |
| 14. | Orme | 25.0% | 10.4%(+14.6)#14 | 11.2%(+13.8)#1,233 |
| 15. | Gray | 24.9% | 10.4%(+14.5)#15 | 11.2%(+13.7)#1,246 |
| 16. | Embreeville | 24.9% | 10.4%(+14.5)#16 | 11.2%(+13.7)#1,255 |
| 17. | Wildersville | 24.6% | 10.4%(+14.2)#17 | 11.2%(+13.4)#1,284 |
| 18. | Falling Water | 24.5% | 10.4%(+14.1)#18 | 11.2%(+13.2)#1,314 |
| 19. | Biltmore | 22.5% | 10.4%(+12.1)#19 | 11.2%(+11.3)#1,711 |
| 20. | Norris | 22.2% | 10.4%(+11.8)#20 | 11.2%(+11.0)#1,787 |
| 21. | Lookout Mountain | 22.1% | 10.4%(+11.7)#21 | 11.2%(+10.8)#1,812 |
| 22. | Walland | 21.2% | 10.4%(+10.8)#22 | 11.2%(+10.0)#2,005 |
| 23. | Cumberland City | 21.2% | 10.4%(+10.8)#23 | 11.2%(+9.94)#2,020 |
| 24. | Oak Hill | 20.7% | 10.4%(+10.3)#24 | 11.2%(+9.52)#2,133 |
| 25. | Martin | 20.4% | 10.4%(+9.98)#25 | 11.2%(+9.17)#2,251 |
| 26. | Oak Grove Cdp Sumner County | 20.3% | 10.4%(+9.87)#26 | 11.2%(+9.06)#2,284 |
| 27. | Leoma | 20.0% | 10.4%(+9.60)#27 | 11.2%(+8.79)#2,397 |
| 28. | Taft | 20.0% | 10.4%(+9.60)#28 | 11.2%(+8.79)#2,399 |
| 29. | Enville | 19.4% | 10.4%(+9.05)#29 | 11.2%(+8.23)#2,626 |
| 30. | Roan Mountain | 19.3% | 10.4%(+8.93)#30 | 11.2%(+8.11)#2,673 |
| 31. | Selmer | 18.9% | 10.4%(+8.54)#31 | 11.2%(+7.72)#2,817 |
| 32. | Walterhill | 18.4% | 10.4%(+8.05)#32 | 11.2%(+7.23)#3,031 |
| 33. | Burlison | 18.3% | 10.4%(+7.94)#33 | 11.2%(+7.12)#3,097 |
| 34. | Forest Hills | 18.3% | 10.4%(+7.87)#34 | 11.2%(+7.06)#3,122 |
| 35. | Palmersville | 18.0% | 10.4%(+7.60)#35 | 11.2%(+6.79)#3,255 |
| 36. | Three Way | 17.9% | 10.4%(+7.49)#36 | 11.2%(+6.67)#3,306 |
| 37. | Mckenzie | 17.8% | 10.4%(+7.39)#37 | 11.2%(+6.57)#3,357 |
| 38. | Bell Buckle | 17.8% | 10.4%(+7.36)#38 | 11.2%(+6.54)#3,375 |
| 39. | Signal Mountain | 17.7% | 10.4%(+7.29)#39 | 11.2%(+6.48)#3,401 |
| 40. | Fairmount | 17.5% | 10.4%(+7.12)#40 | 11.2%(+6.30)#3,514 |
| 41. | Oneida | 17.3% | 10.4%(+6.92)#41 | 11.2%(+6.10)#3,639 |
| 42. | Watauga | 17.0% | 10.4%(+6.62)#42 | 11.2%(+5.81)#3,801 |
| 43. | Hillsboro | 17.0% | 10.4%(+6.58)#43 | 11.2%(+5.77)#3,822 |
| 44. | Waverly | 16.8% | 10.4%(+6.41)#44 | 11.2%(+5.59)#3,910 |
| 45. | Arlington | 16.7% | 10.4%(+6.31)#45 | 11.2%(+5.49)#3,960 |
| 46. | Sunbright | 16.5% | 10.4%(+6.14)#46 | 11.2%(+5.32)#4,115 |
| 47. | Cleveland | 16.4% | 10.4%(+5.98)#47 | 11.2%(+5.16)#4,218 |
| 48. | Unicoi | 16.3% | 10.4%(+5.95)#48 | 11.2%(+5.13)#4,240 |
| 49. | Walden | 16.1% | 10.4%(+5.74)#49 | 11.2%(+4.92)#4,375 |
| 50. | Fall Branch | 16.0% | 10.4%(+5.59)#50 | 11.2%(+4.77)#4,490 |
| 51. | Yuma | 15.9% | 10.4%(+5.51)#51 | 11.2%(+4.69)#4,542 |
| 52. | Coalmont | 15.6% | 10.4%(+5.23)#52 | 11.2%(+4.41)#4,770 |
| 53. | Samburg | 15.5% | 10.4%(+5.08)#53 | 11.2%(+4.26)#4,901 |
| 54. | Algood | 15.4% | 10.4%(+5.00)#54 | 11.2%(+4.18)#4,961 |
| 55. | Henderson | 15.2% | 10.4%(+4.82)#55 | 11.2%(+4.00)#5,127 |
| 56. | Monteagle | 15.2% | 10.4%(+4.75)#56 | 11.2%(+3.94)#5,181 |
| 57. | Blaine | 15.1% | 10.4%(+4.73)#57 | 11.2%(+3.91)#5,215 |
| 58. | Farner | 15.0% | 10.4%(+4.60)#58 | 11.2%(+3.79)#5,339 |
| 59. | Kahite | 14.9% | 10.4%(+4.47)#59 | 11.2%(+3.65)#5,455 |
| 60. | Ridgeside | 14.8% | 10.4%(+4.43)#60 | 11.2%(+3.61)#5,501 |
| 61. | Ramer | 14.8% | 10.4%(+4.42)#61 | 11.2%(+3.60)#5,514 |
| 62. | Fincastle | 14.8% | 10.4%(+4.38)#62 | 11.2%(+3.56)#5,554 |
| 63. | Bethel Springs | 14.7% | 10.4%(+4.30)#63 | 11.2%(+3.48)#5,639 |
| 64. | Yorkville | 14.6% | 10.4%(+4.24)#64 | 11.2%(+3.42)#5,705 |
| 65. | Wartburg | 14.6% | 10.4%(+4.16)#65 | 11.2%(+3.35)#5,785 |
| 66. | Hunter | 14.5% | 10.4%(+4.12)#66 | 11.2%(+3.30)#5,832 |
| 67. | New Union | 14.4% | 10.4%(+4.00)#67 | 11.2%(+3.18)#5,949 |
| 68. | Germantown | 14.4% | 10.4%(+3.99)#68 | 11.2%(+3.18)#5,955 |
| 69. | Nashville | 14.1% | 10.4%(+3.69)#69 | 11.2%(+2.87)#6,299 |
| 70. | Coopertown | 14.0% | 10.4%(+3.64)#70 | 11.2%(+2.82)#6,352 |
| 71. | Tusculum | 13.9% | 10.4%(+3.50)#71 | 11.2%(+2.68)#6,506 |
| 72. | Pelham | 13.8% | 10.4%(+3.44)#72 | 11.2%(+2.63)#6,584 |
| 73. | Maryville | 13.8% | 10.4%(+3.41)#73 | 11.2%(+2.59)#6,624 |
| 74. | Dodson Branch | 13.8% | 10.4%(+3.37)#74 | 11.2%(+2.56)#6,665 |
| 75. | Wildwood | 13.7% | 10.4%(+3.32)#75 | 11.2%(+2.51)#6,732 |
| 76. | Brentwood | 13.7% | 10.4%(+3.28)#76 | 11.2%(+2.47)#6,769 |
| 77. | Gleason | 13.6% | 10.4%(+3.23)#77 | 11.2%(+2.41)#6,851 |
| 78. | Johnson City | 13.6% | 10.4%(+3.23)#78 | 11.2%(+2.41)#6,855 |
| 79. | Loretto | 13.4% | 10.4%(+3.05)#79 | 11.2%(+2.23)#7,066 |
| 80. | Elkton | 13.4% | 10.4%(+3.03)#80 | 11.2%(+2.21)#7,101 |
| 81. | Gallaway | 13.4% | 10.4%(+3.02)#81 | 11.2%(+2.20)#7,121 |
| 82. | Franklin | 13.4% | 10.4%(+2.99)#82 | 11.2%(+2.18)#7,155 |
| 83. | Spring Hill | 13.4% | 10.4%(+2.97)#83 | 11.2%(+2.16)#7,180 |
| 84. | Lakeland | 13.4% | 10.4%(+2.97)#84 | 11.2%(+2.16)#7,181 |
| 85. | Nolensville | 13.3% | 10.4%(+2.90)#85 | 11.2%(+2.08)#7,298 |
| 86. | Goodlettsville | 13.3% | 10.4%(+2.90)#86 | 11.2%(+2.08)#7,299 |
| 87. | Estill Springs | 13.3% | 10.4%(+2.89)#87 | 11.2%(+2.08)#7,305 |
| 88. | New Market | 13.1% | 10.4%(+2.66)#88 | 11.2%(+1.85)#7,605 |
| 89. | Collierville | 13.1% | 10.4%(+2.66)#89 | 11.2%(+1.84)#7,612 |
| 90. | Cookeville | 13.0% | 10.4%(+2.61)#90 | 11.2%(+1.80)#7,682 |
| 91. | Woodbury | 13.0% | 10.4%(+2.60)#91 | 11.2%(+1.78)#7,708 |
| 92. | Waynesboro | 13.0% | 10.4%(+2.58)#92 | 11.2%(+1.76)#7,737 |
| 93. | Sneedville | 12.9% | 10.4%(+2.54)#93 | 11.2%(+1.72)#7,794 |
| 94. | Belle Meade | 12.9% | 10.4%(+2.52)#94 | 11.2%(+1.71)#7,814 |
| 95. | Cumberland Gap | 12.9% | 10.4%(+2.46)#95 | 11.2%(+1.64)#7,895 |
| 96. | Covington | 12.9% | 10.4%(+2.45)#96 | 11.2%(+1.64)#7,904 |
| 97. | Shackle Island | 12.8% | 10.4%(+2.44)#97 | 11.2%(+1.63)#7,912 |
| 98. | Hopewell | 12.8% | 10.4%(+2.36)#98 | 11.2%(+1.55)#8,031 |
| 99. | Spring City | 12.8% | 10.4%(+2.36)#99 | 11.2%(+1.54)#8,036 |
| 100. | Rural Hill | 12.7% | 10.4%(+2.32)#100 | 11.2%(+1.51)#8,082 |
Common Questions
What are the Top 10 Cities with the Highest Percentage of Population Employed in Community & Social Service in Tennessee?
Top 10 Cities with the Highest Percentage of Population Employed in Community & Social Service in Tennessee are:
#1
37.5%
#2
30.6%
#3
29.3%
#4
28.9%
#5
25.0%
#6
24.9%
#7
24.5%
#8
22.2%
#9
22.1%
#10
21.2%
What city has the Highest Percentage of Population Employed in Community & Social Service in Tennessee?
Robbins has the Highest Percentage of Population Employed in Community & Social Service in Tennessee with 37.5%.
What is the Percentage of Population Employed in Community & Social Service in the State of Tennessee?
Percentage of Population Employed in Community & Social Service in Tennessee is 10.4%.
What is the Percentage of Population Employed in Community & Social Service in the United States?
Percentage of Population Employed in Community & Social Service in the United States is 11.2%.