Cities with the Highest Percentage of Population Employed in Community & Social Service in New Hampshire
RELATED REPORTS & OPTIONS
Community & Social Service
New Hampshire
Compare Cities
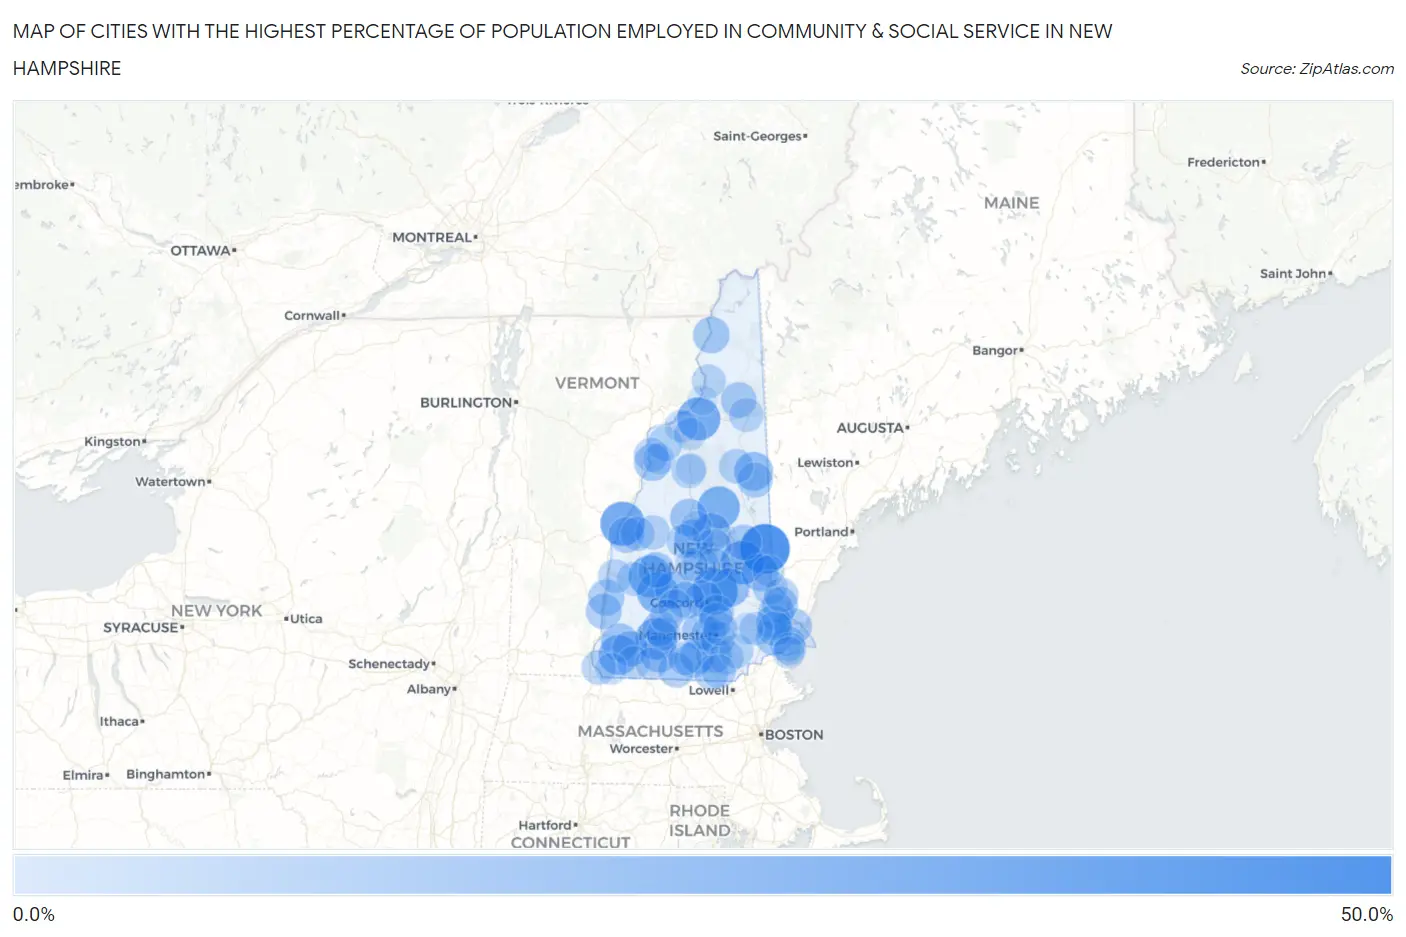
Map of Cities with the Highest Percentage of Population Employed in Community & Social Service in New Hampshire
0.0%
50.0%
Cities with the Highest Percentage of Population Employed in Community & Social Service in New Hampshire
| City | % Employed | vs State | vs National | |
| 1. | Sanbornville | 42.7% | 10.8%(+31.9)#1 | 11.2%(+31.5)#317 |
| 2. | Loudon | 34.0% | 10.8%(+23.3)#2 | 11.2%(+22.8)#541 |
| 3. | Hanover | 30.7% | 10.8%(+19.9)#3 | 11.2%(+19.5)#709 |
| 4. | Alton | 29.2% | 10.8%(+18.4)#4 | 11.2%(+18.0)#813 |
| 5. | Whitefield | 28.3% | 10.8%(+17.5)#5 | 11.2%(+17.1)#885 |
| 6. | Blodgett Landing | 26.7% | 10.8%(+15.9)#6 | 11.2%(+15.5)#1,043 |
| 7. | Center Sandwich | 26.4% | 10.8%(+15.6)#7 | 11.2%(+15.1)#1,067 |
| 8. | Hancock | 25.5% | 10.8%(+14.7)#8 | 11.2%(+14.3)#1,151 |
| 9. | Bradford | 23.8% | 10.8%(+13.1)#9 | 11.2%(+12.6)#1,424 |
| 10. | West Swanzey | 21.6% | 10.8%(+10.8)#10 | 11.2%(+10.4)#1,916 |
| 11. | Francestown | 20.0% | 10.8%(+9.24)#11 | 11.2%(+8.79)#2,405 |
| 12. | New Hampton | 18.5% | 10.8%(+7.78)#12 | 11.2%(+7.33)#2,986 |
| 13. | North Conway | 18.5% | 10.8%(+7.73)#13 | 11.2%(+7.28)#3,009 |
| 14. | Pittsfield | 18.3% | 10.8%(+7.52)#14 | 11.2%(+7.07)#3,119 |
| 15. | Meredith | 17.9% | 10.8%(+7.10)#15 | 11.2%(+6.65)#3,316 |
| 16. | Warner | 16.5% | 10.8%(+5.71)#16 | 11.2%(+5.26)#4,160 |
| 17. | Keene | 16.4% | 10.8%(+5.68)#17 | 11.2%(+5.22)#4,178 |
| 18. | Peterborough | 15.9% | 10.8%(+5.11)#18 | 11.2%(+4.66)#4,573 |
| 19. | Farmington | 15.5% | 10.8%(+4.75)#19 | 11.2%(+4.30)#4,871 |
| 20. | Plymouth | 15.4% | 10.8%(+4.61)#20 | 11.2%(+4.16)#4,992 |
| 21. | Concord | 14.9% | 10.8%(+4.16)#21 | 11.2%(+3.71)#5,401 |
| 22. | North Haverhill | 14.9% | 10.8%(+4.09)#22 | 11.2%(+3.64)#5,464 |
| 23. | Contoocook | 14.6% | 10.8%(+3.88)#23 | 11.2%(+3.43)#5,695 |
| 24. | Tilton Northfield | 14.3% | 10.8%(+3.57)#24 | 11.2%(+3.12)#6,009 |
| 25. | Colebrook | 13.9% | 10.8%(+3.12)#25 | 11.2%(+2.66)#6,533 |
| 26. | Portsmouth | 13.4% | 10.8%(+2.59)#26 | 11.2%(+2.14)#7,202 |
| 27. | Charlestown | 13.3% | 10.8%(+2.55)#27 | 11.2%(+2.10)#7,276 |
| 28. | Goffstown | 13.3% | 10.8%(+2.51)#28 | 11.2%(+2.05)#7,334 |
| 29. | Exeter | 13.2% | 10.8%(+2.39)#29 | 11.2%(+1.94)#7,486 |
| 30. | Durham | 12.8% | 10.8%(+2.08)#30 | 11.2%(+1.63)#7,914 |
| 31. | New London | 12.6% | 10.8%(+1.84)#31 | 11.2%(+1.38)#8,258 |
| 32. | North Walpole | 12.5% | 10.8%(+1.74)#32 | 11.2%(+1.29)#8,401 |
| 33. | Milford | 12.5% | 10.8%(+1.72)#33 | 11.2%(+1.27)#8,461 |
| 34. | Dover | 12.5% | 10.8%(+1.69)#34 | 11.2%(+1.24)#8,495 |
| 35. | Lebanon | 12.4% | 10.8%(+1.62)#35 | 11.2%(+1.16)#8,616 |
| 36. | Wolfeboro | 12.4% | 10.8%(+1.61)#36 | 11.2%(+1.16)#8,622 |
| 37. | Berlin | 12.1% | 10.8%(+1.32)#37 | 11.2%(+0.867)#9,069 |
| 38. | Marlborough | 12.0% | 10.8%(+1.22)#38 | 11.2%(+0.771)#9,223 |
| 39. | Hampton | 11.6% | 10.8%(+0.795)#39 | 11.2%(+0.343)#9,896 |
| 40. | Newmarket | 11.5% | 10.8%(+0.748)#40 | 11.2%(+0.295)#9,979 |
| 41. | Suncook | 11.4% | 10.8%(+0.626)#41 | 11.2%(+0.173)#10,187 |
| 42. | Greenville | 11.4% | 10.8%(+0.612)#42 | 11.2%(+0.159)#10,216 |
| 43. | East Merrimack | 11.3% | 10.8%(+0.494)#43 | 11.2%(+0.041)#10,448 |
| 44. | Amherst | 11.1% | 10.8%(+0.349)#44 | 11.2%(-0.103)#10,699 |
| 45. | Newfields | 11.1% | 10.8%(+0.349)#45 | 11.2%(-0.103)#10,707 |
| 46. | Conway | 11.0% | 10.8%(+0.255)#46 | 11.2%(-0.197)#10,881 |
| 47. | Antrim | 11.0% | 10.8%(+0.232)#47 | 11.2%(-0.220)#10,926 |
| 48. | Laconia | 11.0% | 10.8%(+0.198)#48 | 11.2%(-0.254)#10,990 |
| 49. | Pinardville | 10.5% | 10.8%(-0.213)#49 | 11.2%(-0.666)#11,778 |
| 50. | Manchester | 10.4% | 10.8%(-0.369)#50 | 11.2%(-0.821)#12,108 |
| 51. | Bartlett | 9.8% | 10.8%(-0.926)#51 | 11.2%(-1.38)#13,191 |
| 52. | Lisbon | 9.8% | 10.8%(-1.01)#52 | 11.2%(-1.46)#13,358 |
| 53. | Rochester | 9.6% | 10.8%(-1.20)#53 | 11.2%(-1.66)#13,751 |
| 54. | Somersworth | 9.5% | 10.8%(-1.22)#54 | 11.2%(-1.67)#13,781 |
| 55. | Hinsdale | 9.5% | 10.8%(-1.27)#55 | 11.2%(-1.73)#13,905 |
| 56. | Hooksett | 9.4% | 10.8%(-1.36)#56 | 11.2%(-1.81)#14,085 |
| 57. | Woodsville | 9.4% | 10.8%(-1.41)#57 | 11.2%(-1.86)#14,165 |
| 58. | Canaan | 9.3% | 10.8%(-1.44)#58 | 11.2%(-1.89)#14,238 |
| 59. | Enfield | 9.3% | 10.8%(-1.45)#59 | 11.2%(-1.90)#14,258 |
| 60. | Londonderry | 9.3% | 10.8%(-1.51)#60 | 11.2%(-1.96)#14,381 |
| 61. | Nashua | 9.1% | 10.8%(-1.68)#61 | 11.2%(-2.13)#14,774 |
| 62. | Belmont | 8.9% | 10.8%(-1.88)#62 | 11.2%(-2.33)#15,188 |
| 63. | North Woodstock | 8.9% | 10.8%(-1.90)#63 | 11.2%(-2.35)#15,242 |
| 64. | Gorham | 8.9% | 10.8%(-1.90)#64 | 11.2%(-2.35)#15,254 |
| 65. | South Hooksett | 8.8% | 10.8%(-1.93)#65 | 11.2%(-2.38)#15,295 |
| 66. | Derry | 8.8% | 10.8%(-1.98)#66 | 11.2%(-2.43)#15,414 |
| 67. | Hudson | 8.7% | 10.8%(-2.02)#67 | 11.2%(-2.47)#15,500 |
| 68. | Bristol | 8.6% | 10.8%(-2.18)#68 | 11.2%(-2.64)#15,850 |
| 69. | Claremont | 8.3% | 10.8%(-2.48)#69 | 11.2%(-2.93)#16,517 |
| 70. | Bennington | 8.2% | 10.8%(-2.56)#70 | 11.2%(-3.02)#16,696 |
| 71. | Groveton | 8.1% | 10.8%(-2.66)#71 | 11.2%(-3.11)#16,932 |
| 72. | Newport | 8.1% | 10.8%(-2.67)#72 | 11.2%(-3.12)#16,951 |
| 73. | Epping | 7.9% | 10.8%(-2.89)#73 | 11.2%(-3.35)#17,436 |
| 74. | Henniker | 7.5% | 10.8%(-3.25)#74 | 11.2%(-3.70)#18,140 |
| 75. | Wilton | 7.4% | 10.8%(-3.35)#75 | 11.2%(-3.80)#18,328 |
| 76. | Hillsborough | 7.3% | 10.8%(-3.44)#76 | 11.2%(-3.89)#18,487 |
| 77. | Troy | 7.3% | 10.8%(-3.50)#77 | 11.2%(-3.95)#18,618 |
| 78. | Littleton | 6.8% | 10.8%(-4.00)#78 | 11.2%(-4.46)#19,625 |
| 79. | Bethlehem | 6.0% | 10.8%(-4.80)#79 | 11.2%(-5.25)#21,124 |
| 80. | Franklin | 5.9% | 10.8%(-4.87)#80 | 11.2%(-5.32)#21,229 |
| 81. | Hampton Beach | 5.2% | 10.8%(-5.61)#81 | 11.2%(-6.06)#22,464 |
| 82. | Jaffrey | 5.1% | 10.8%(-5.64)#82 | 11.2%(-6.09)#22,511 |
| 83. | Seabrook Beach | 4.9% | 10.8%(-5.84)#83 | 11.2%(-6.29)#22,757 |
| 84. | Milton | 4.4% | 10.8%(-6.39)#84 | 11.2%(-6.85)#23,560 |
| 85. | Winchester | 4.2% | 10.8%(-6.60)#85 | 11.2%(-7.05)#23,810 |
| 86. | Mountain Lakes | 4.1% | 10.8%(-6.71)#86 | 11.2%(-7.16)#23,995 |
| 87. | Raymond | 3.7% | 10.8%(-7.06)#87 | 11.2%(-7.51)#24,473 |
| 88. | Lincoln | 2.5% | 10.8%(-8.27)#88 | 11.2%(-8.72)#25,741 |
| 89. | Ashland | 1.9% | 10.8%(-8.91)#89 | 11.2%(-9.36)#26,264 |
| 90. | Lancaster | 0.90% | 10.8%(-9.86)#90 | 11.2%(-10.3)#26,831 |
1
Common Questions
What are the Top 10 Cities with the Highest Percentage of Population Employed in Community & Social Service in New Hampshire?
Top 10 Cities with the Highest Percentage of Population Employed in Community & Social Service in New Hampshire are:
#1
42.7%
#2
34.0%
#3
30.7%
#4
29.2%
#5
28.3%
#6
26.7%
#7
26.4%
#8
25.5%
#9
23.8%
#10
21.6%
What city has the Highest Percentage of Population Employed in Community & Social Service in New Hampshire?
Sanbornville has the Highest Percentage of Population Employed in Community & Social Service in New Hampshire with 42.7%.
What is the Percentage of Population Employed in Community & Social Service in the State of New Hampshire?
Percentage of Population Employed in Community & Social Service in New Hampshire is 10.8%.
What is the Percentage of Population Employed in Community & Social Service in the United States?
Percentage of Population Employed in Community & Social Service in the United States is 11.2%.