Zip Codes with the Highest Percentage of Population Employed in Community & Social Service in La Puente, CA
RELATED REPORTS & OPTIONS
Community & Social Service
La Puente
Compare Zip Codes
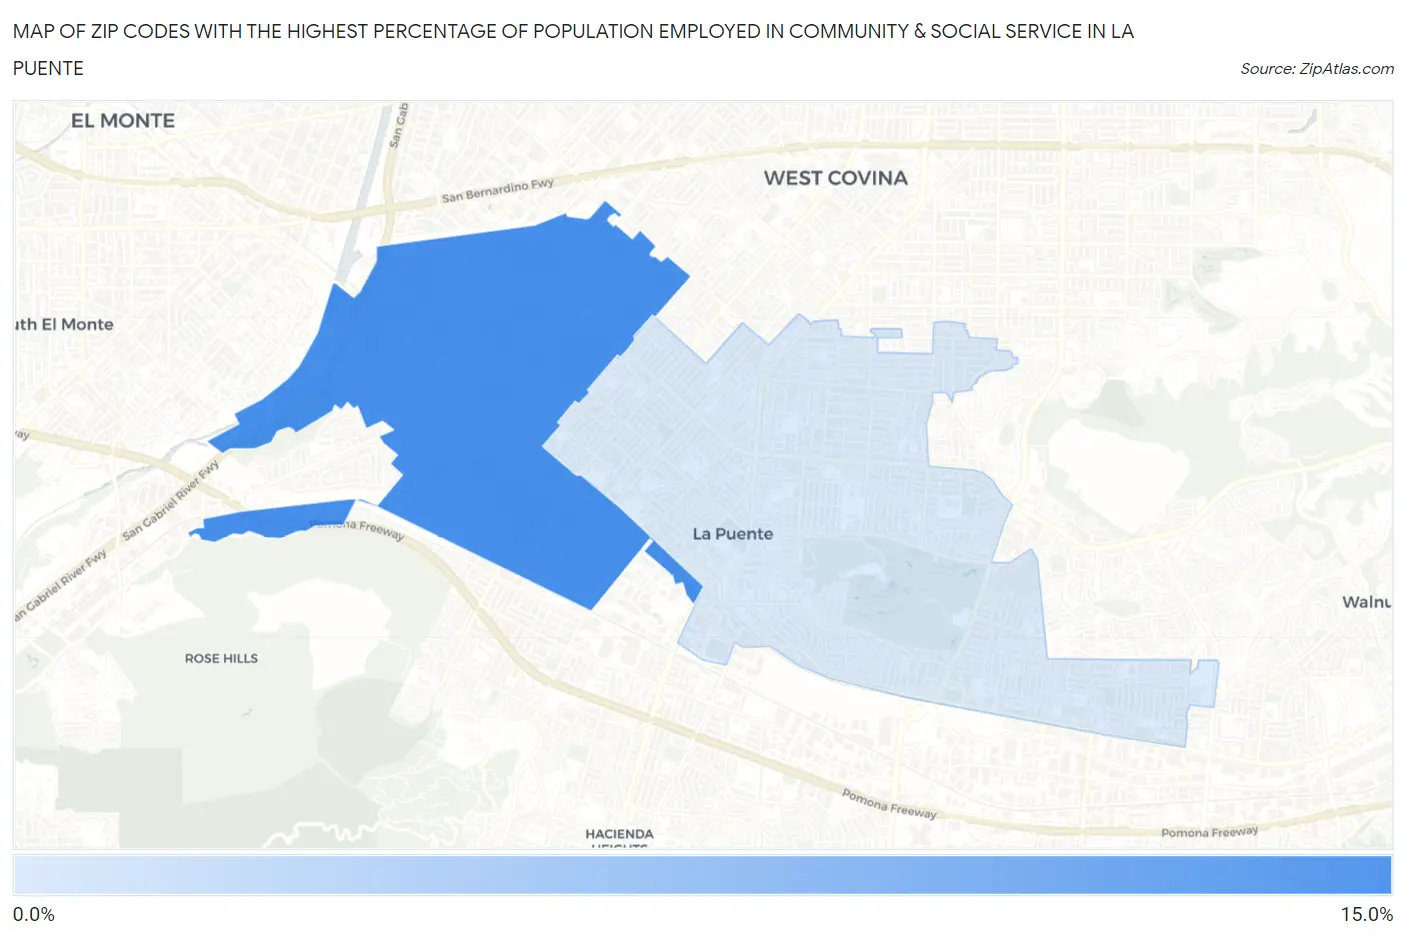
Map of Zip Codes with the Highest Percentage of Population Employed in Community & Social Service in La Puente
5.0%
11.7%
Zip Codes with the Highest Percentage of Population Employed in Community & Social Service in La Puente, CA
| Zip Code | % Employed | vs State | vs National | |
| 1. | 91746 | 11.7% | 11.5%(+0.209)#701 | 11.2%(+0.479)#10,017 |
| 2. | 91744 | 5.0% | 11.5%(-6.53)#1,476 | 11.2%(-6.26)#26,263 |
1
Common Questions
What are the Top Zip Codes with the Highest Percentage of Population Employed in Community & Social Service in La Puente, CA?
Top Zip Codes with the Highest Percentage of Population Employed in Community & Social Service in La Puente, CA are:
What zip code has the Highest Percentage of Population Employed in Community & Social Service in La Puente, CA?
91746 has the Highest Percentage of Population Employed in Community & Social Service in La Puente, CA with 11.7%.
What is the Percentage of Population Employed in Community & Social Service in La Puente, CA?
Percentage of Population Employed in Community & Social Service in La Puente is 5.5%.
What is the Percentage of Population Employed in Community & Social Service in California?
Percentage of Population Employed in Community & Social Service in California is 11.5%.
What is the Percentage of Population Employed in Community & Social Service in the United States?
Percentage of Population Employed in Community & Social Service in the United States is 11.2%.