Nipinnawasee, CA Map & Demographics
Nipinnawasee Map
Nipinnawasee Overview
$41,150
PER CAPITA INCOME
$71,835
AVG FAMILY INCOME
$71,622
AVG HOUSEHOLD INCOME
0.23
INEQUALITY / GINI INDEX
341
TOTAL POPULATION
233
MALE POPULATION
108
FEMALE POPULATION
215.74
MALES / 100 FEMALES
46.35
FEMALES / 100 MALES
56.3
MEDIAN AGE
2.1
AVG FAMILY SIZE
2.0
AVG HOUSEHOLD SIZE
145
LABOR FORCE [ PEOPLE ]
44.9%
PERCENT IN LABOR FORCE
Income in Nipinnawasee
Income Overview in Nipinnawasee
Per Capita Income in Nipinnawasee is $41,150, while median incomes of families and households are $71,835 and $71,622 respectively.
| Characteristic | Number | Measure |
| Per Capita Income | 341 | $41,150 |
| Median Family Income | 156 | $71,835 |
| Mean Family Income | 156 | $88,423 |
| Median Household Income | 172 | $71,622 |
| Mean Household Income | 172 | $81,969 |
| Income Deficit | 156 | $0 |
| Wage / Income Gap (%) | 341 | 0.00% |
| Wage / Income Gap ($) | 341 | 100.00¢ per $1 |
| Gini / Inequality Index | 341 | 0.23 |
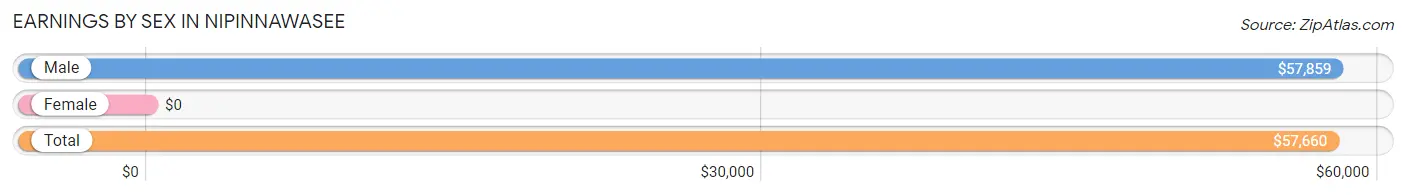
Earnings by Sex in Nipinnawasee
| Sex | Number | Average Earnings |
| Male | 201 (93.1%) | $57,859 |
| Female | 15 (6.9%) | $0 |
| Total | 216 (100.0%) | $57,660 |
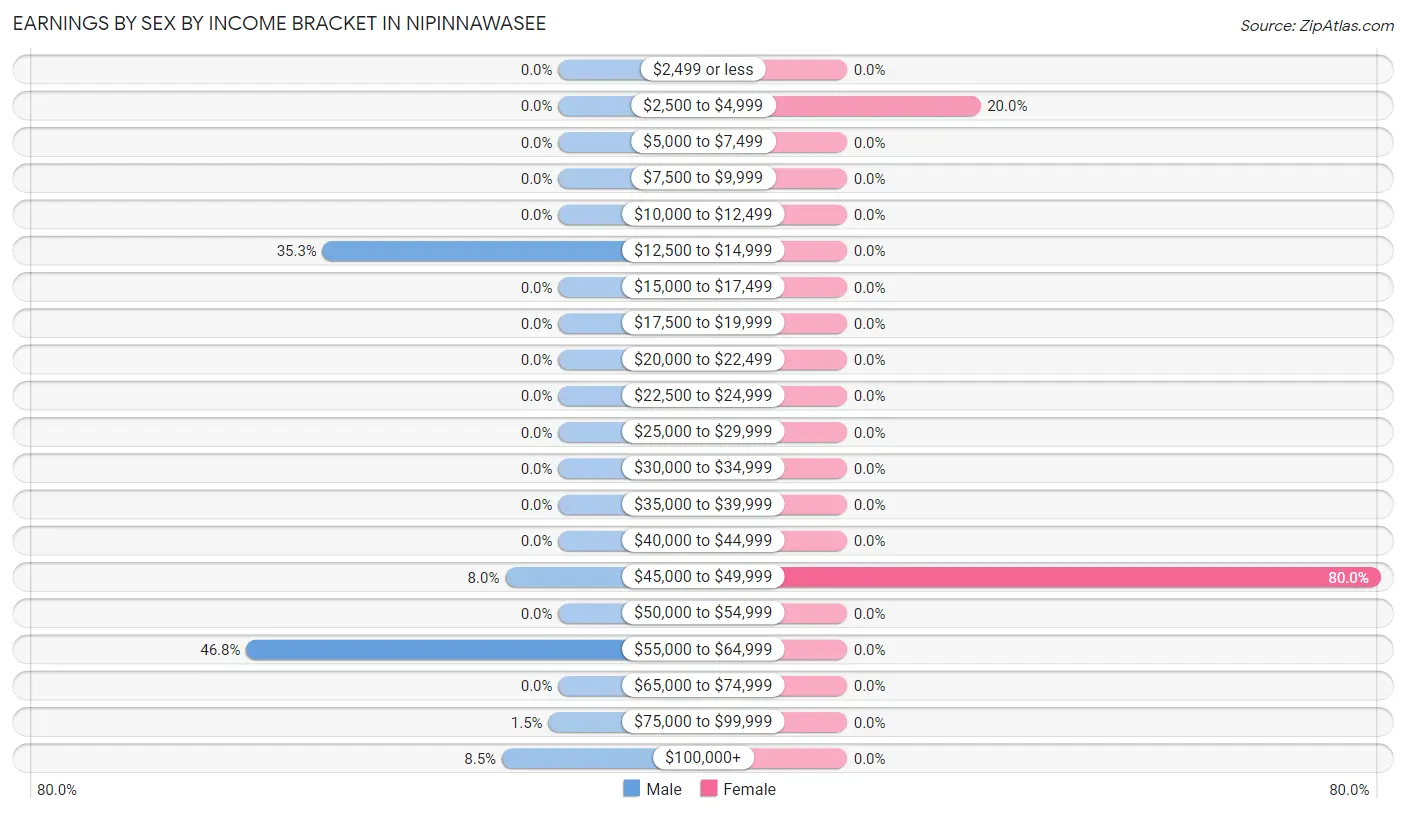
Earnings by Sex by Income Bracket in Nipinnawasee
The most common earnings brackets in Nipinnawasee are $55,000 to $64,999 for men (94 | 46.8%) and $45,000 to $49,999 for women (12 | 80.0%).
| Income | Male | Female |
| $2,499 or less | 0 (0.0%) | 0 (0.0%) |
| $2,500 to $4,999 | 0 (0.0%) | 3 (20.0%) |
| $5,000 to $7,499 | 0 (0.0%) | 0 (0.0%) |
| $7,500 to $9,999 | 0 (0.0%) | 0 (0.0%) |
| $10,000 to $12,499 | 0 (0.0%) | 0 (0.0%) |
| $12,500 to $14,999 | 71 (35.3%) | 0 (0.0%) |
| $15,000 to $17,499 | 0 (0.0%) | 0 (0.0%) |
| $17,500 to $19,999 | 0 (0.0%) | 0 (0.0%) |
| $20,000 to $22,499 | 0 (0.0%) | 0 (0.0%) |
| $22,500 to $24,999 | 0 (0.0%) | 0 (0.0%) |
| $25,000 to $29,999 | 0 (0.0%) | 0 (0.0%) |
| $30,000 to $34,999 | 0 (0.0%) | 0 (0.0%) |
| $35,000 to $39,999 | 0 (0.0%) | 0 (0.0%) |
| $40,000 to $44,999 | 0 (0.0%) | 0 (0.0%) |
| $45,000 to $49,999 | 16 (8.0%) | 12 (80.0%) |
| $50,000 to $54,999 | 0 (0.0%) | 0 (0.0%) |
| $55,000 to $64,999 | 94 (46.8%) | 0 (0.0%) |
| $65,000 to $74,999 | 0 (0.0%) | 0 (0.0%) |
| $75,000 to $99,999 | 3 (1.5%) | 0 (0.0%) |
| $100,000+ | 17 (8.5%) | 0 (0.0%) |
| Total | 201 (100.0%) | 15 (100.0%) |
Earnings by Sex by Educational Attainment in Nipinnawasee
| Educational Attainment | Male Income | Female Income |
| Less than High School | - | - |
| High School Diploma | - | - |
| College or Associate's Degree | - | - |
| Bachelor's Degree | - | - |
| Graduate Degree | - | - |
| Total | $58,803 | $0 |
Family Income in Nipinnawasee
Family Income Brackets in Nipinnawasee
According to the Nipinnawasee family income data, there are 103 families falling into the $50,000 to $74,999 income range, which is the most common income bracket and makes up 66.0% of all families.
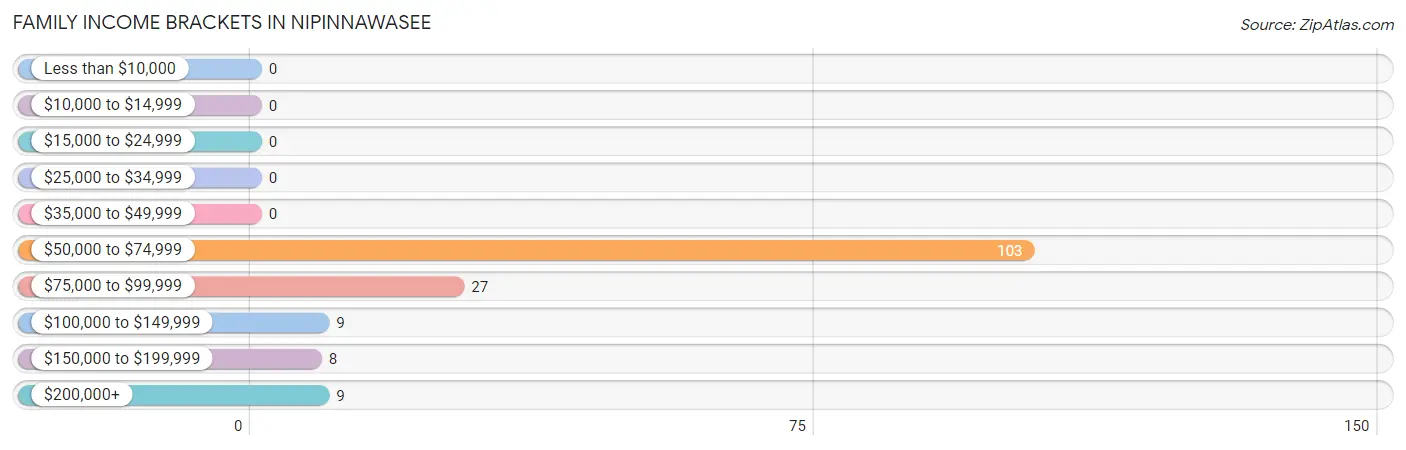
| Income Bracket | # Families | % Families |
| Less than $10,000 | 0 | 0.0% |
| $10,000 to $14,999 | 0 | 0.0% |
| $15,000 to $24,999 | 0 | 0.0% |
| $25,000 to $34,999 | 0 | 0.0% |
| $35,000 to $49,999 | 0 | 0.0% |
| $50,000 to $74,999 | 103 | 66.0% |
| $75,000 to $99,999 | 27 | 17.3% |
| $100,000 to $149,999 | 9 | 5.8% |
| $150,000 to $199,999 | 8 | 5.1% |
| $200,000+ | 9 | 5.8% |
Family Income by Famaliy Size in Nipinnawasee
2-person families (144 | 92.3%) account for the highest median family income in Nipinnawasee with $71,676 per family, while 2-person families (144 | 92.3%) have the highest median income of $35,838 per family member.
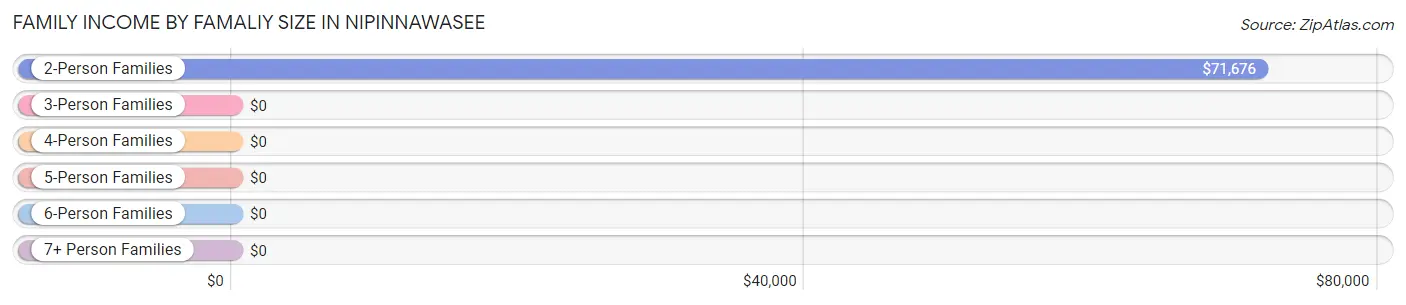
| Income Bracket | # Families | Median Income |
| 2-Person Families | 144 (92.3%) | $71,676 |
| 3-Person Families | 9 (5.8%) | $0 |
| 4-Person Families | 0 (0.0%) | $0 |
| 5-Person Families | 0 (0.0%) | $0 |
| 6-Person Families | 3 (1.9%) | $0 |
| 7+ Person Families | 0 (0.0%) | $0 |
| Total | 156 (100.0%) | $71,835 |
Family Income by Number of Earners in Nipinnawasee
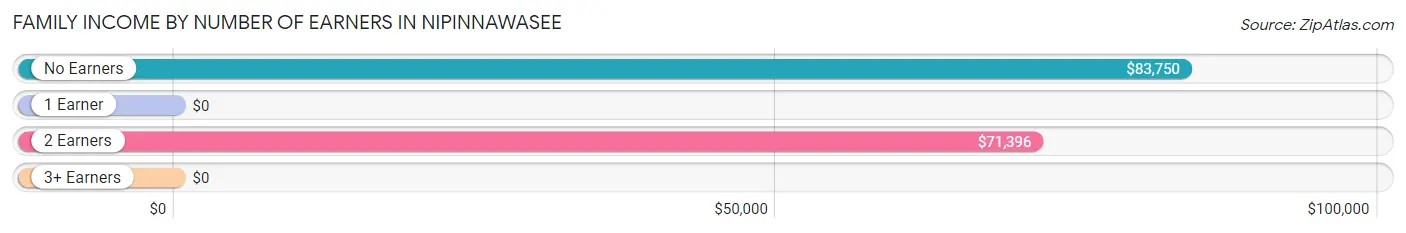
| Number of Earners | # Families | Median Income |
| No Earners | 26 (16.7%) | $83,750 |
| 1 Earner | 25 (16.0%) | $0 |
| 2 Earners | 105 (67.3%) | $71,396 |
| 3+ Earners | 0 (0.0%) | $0 |
| Total | 156 (100.0%) | $71,835 |
Household Income in Nipinnawasee
Household Income Brackets in Nipinnawasee
With 103 households falling in the category, the $50,000 to $74,999 income range is the most frequent in Nipinnawasee, accounting for 59.9% of all households.
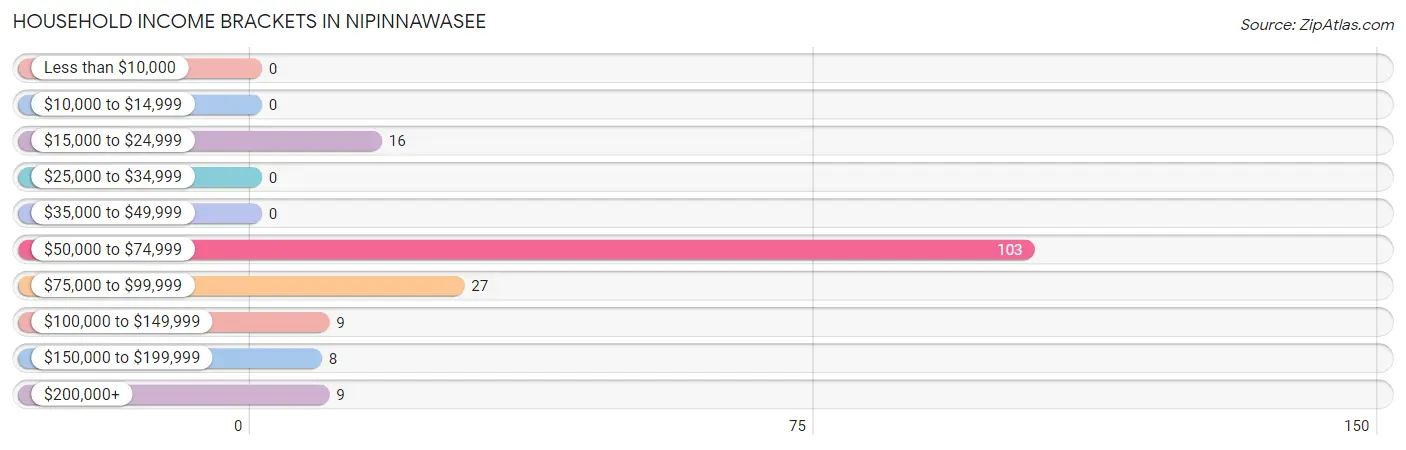
| Income Bracket | # Households | % Households |
| Less than $10,000 | 0 | 0.0% |
| $10,000 to $14,999 | 0 | 0.0% |
| $15,000 to $24,999 | 16 | 9.3% |
| $25,000 to $34,999 | 0 | 0.0% |
| $35,000 to $49,999 | 0 | 0.0% |
| $50,000 to $74,999 | 103 | 59.9% |
| $75,000 to $99,999 | 27 | 15.7% |
| $100,000 to $149,999 | 9 | 5.2% |
| $150,000 to $199,999 | 8 | 4.7% |
| $200,000+ | 9 | 5.2% |
Household Income by Householder Age in Nipinnawasee
The median household income in Nipinnawasee is $71,622, with the highest median household income of $81,328 found in the 65+ years age bracket for the primary householder. A total of 49 households (28.5%) fall into this category.
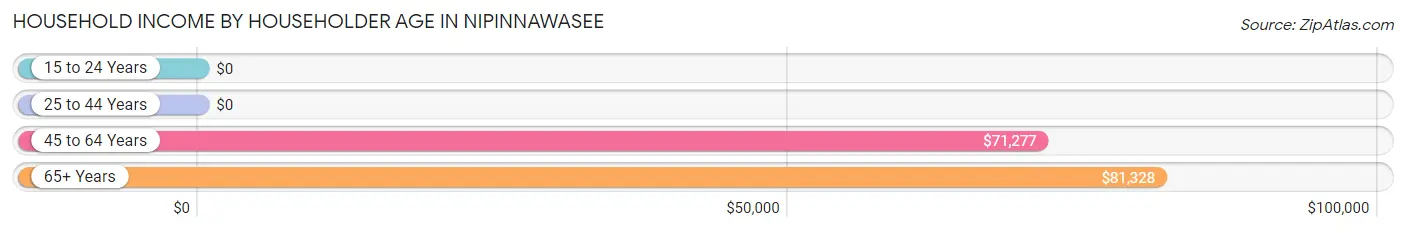
| Income Bracket | # Households | Median Income |
| 15 to 24 Years | 0 (0.0%) | $0 |
| 25 to 44 Years | 9 (5.2%) | $0 |
| 45 to 64 Years | 114 (66.3%) | $71,277 |
| 65+ Years | 49 (28.5%) | $81,328 |
| Total | 172 (100.0%) | $71,622 |
Poverty in Nipinnawasee
Income Below Poverty by Sex and Age in Nipinnawasee
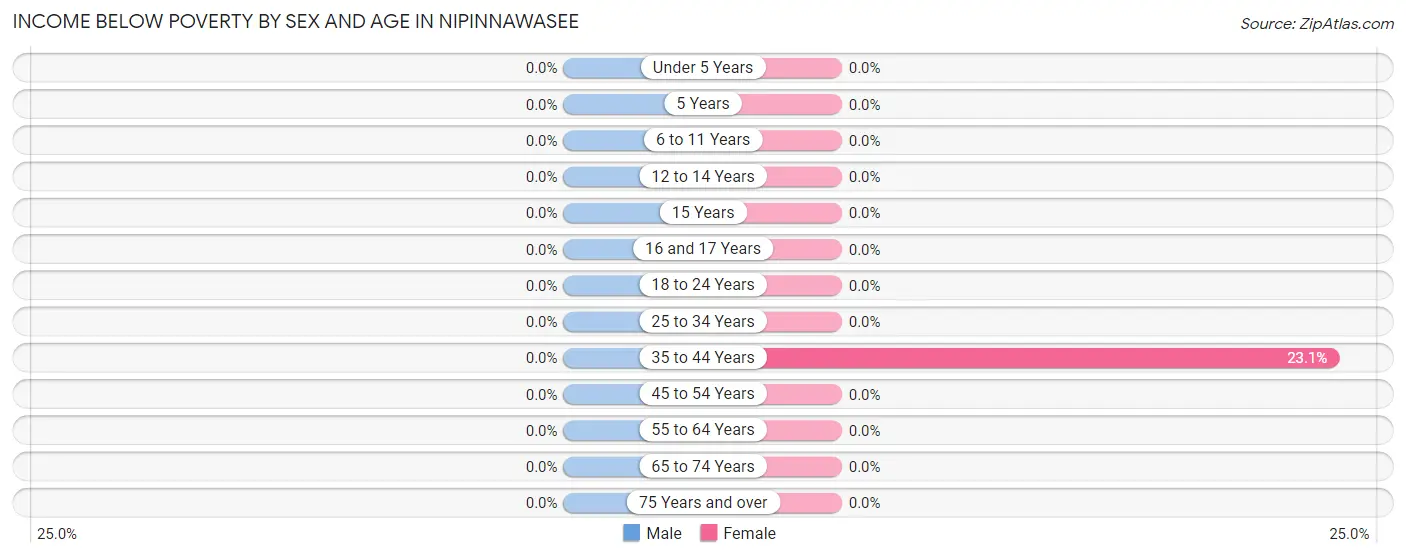
| Age Bracket | Male | Female |
| Under 5 Years | 0 (0.0%) | 0 (0.0%) |
| 5 Years | 0 (0.0%) | 0 (0.0%) |
| 6 to 11 Years | 0 (0.0%) | 0 (0.0%) |
| 12 to 14 Years | 0 (0.0%) | 0 (0.0%) |
| 15 Years | 0 (0.0%) | 0 (0.0%) |
| 16 and 17 Years | 0 (0.0%) | 0 (0.0%) |
| 18 to 24 Years | 0 (0.0%) | 0 (0.0%) |
| 25 to 34 Years | 0 (0.0%) | 0 (0.0%) |
| 35 to 44 Years | 0 (0.0%) | 3 (23.1%) |
| 45 to 54 Years | 0 (0.0%) | 0 (0.0%) |
| 55 to 64 Years | 0 (0.0%) | 0 (0.0%) |
| 65 to 74 Years | 0 (0.0%) | 0 (0.0%) |
| 75 Years and over | 0 (0.0%) | 0 (0.0%) |
| Total | 0 (0.0%) | 3 (2.8%) |
Income Above Poverty by Sex and Age in Nipinnawasee
According to the poverty statistics in Nipinnawasee, males aged 18 to 24 years and females aged 12 to 14 years are the age groups that are most secure financially, with 100.0% of males and 100.0% of females in these age groups living above the poverty line.
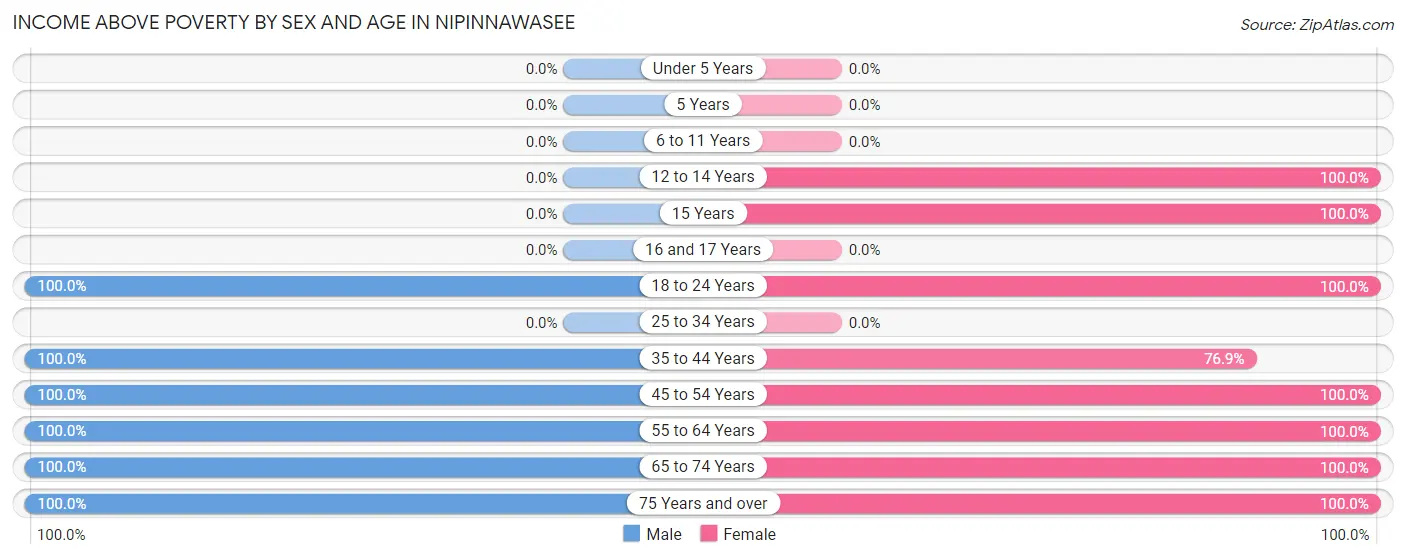
| Age Bracket | Male | Female |
| Under 5 Years | 0 (0.0%) | 0 (0.0%) |
| 5 Years | 0 (0.0%) | 0 (0.0%) |
| 6 to 11 Years | 0 (0.0%) | 0 (0.0%) |
| 12 to 14 Years | 0 (0.0%) | 16 (100.0%) |
| 15 Years | 0 (0.0%) | 2 (100.0%) |
| 16 and 17 Years | 0 (0.0%) | 0 (0.0%) |
| 18 to 24 Years | 75 (100.0%) | 8 (100.0%) |
| 25 to 34 Years | 0 (0.0%) | 0 (0.0%) |
| 35 to 44 Years | 9 (100.0%) | 10 (76.9%) |
| 45 to 54 Years | 3 (100.0%) | 12 (100.0%) |
| 55 to 64 Years | 111 (100.0%) | 10 (100.0%) |
| 65 to 74 Years | 16 (100.0%) | 14 (100.0%) |
| 75 Years and over | 19 (100.0%) | 33 (100.0%) |
| Total | 233 (100.0%) | 105 (97.2%) |
Income Below Poverty Among Married-Couple Families in Nipinnawasee
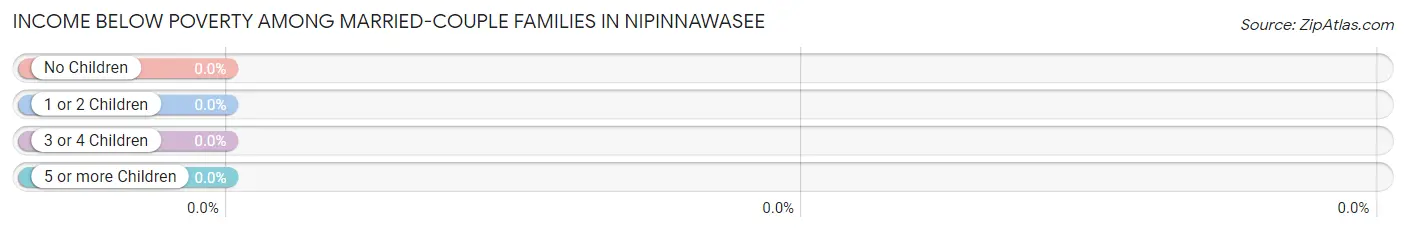
| Children | Above Poverty | Below Poverty |
| No Children | 50 (100.0%) | 0 (0.0%) |
| 1 or 2 Children | 9 (100.0%) | 0 (0.0%) |
| 3 or 4 Children | 0 (0.0%) | 0 (0.0%) |
| 5 or more Children | 0 (0.0%) | 0 (0.0%) |
| Total | 59 (100.0%) | 0 (0.0%) |
Income Below Poverty Among Single-Parent Households in Nipinnawasee
| Children | Single Father | Single Mother |
| No Children | 0 (0.0%) | 0 (0.0%) |
| 1 or 2 Children | 0 (0.0%) | 0 (0.0%) |
| 3 or 4 Children | 0 (0.0%) | 0 (0.0%) |
| 5 or more Children | 0 (0.0%) | 0 (0.0%) |
| Total | 0 (0.0%) | 0 (0.0%) |
Income Below Poverty Among Married-Couple vs Single-Parent Households in Nipinnawasee
| Children | Married-Couple Families | Single-Parent Households |
| No Children | 0 (0.0%) | 0 (0.0%) |
| 1 or 2 Children | 0 (0.0%) | 0 (0.0%) |
| 3 or 4 Children | 0 (0.0%) | 0 (0.0%) |
| 5 or more Children | 0 (0.0%) | 0 (0.0%) |
| Total | 0 (0.0%) | 0 (0.0%) |
Race in Nipinnawasee
The most populous races in Nipinnawasee are White / Caucasian (248 | 72.7%), Two or more Races (83 | 24.3%), and Hispanic or Latino (22 | 6.5%).
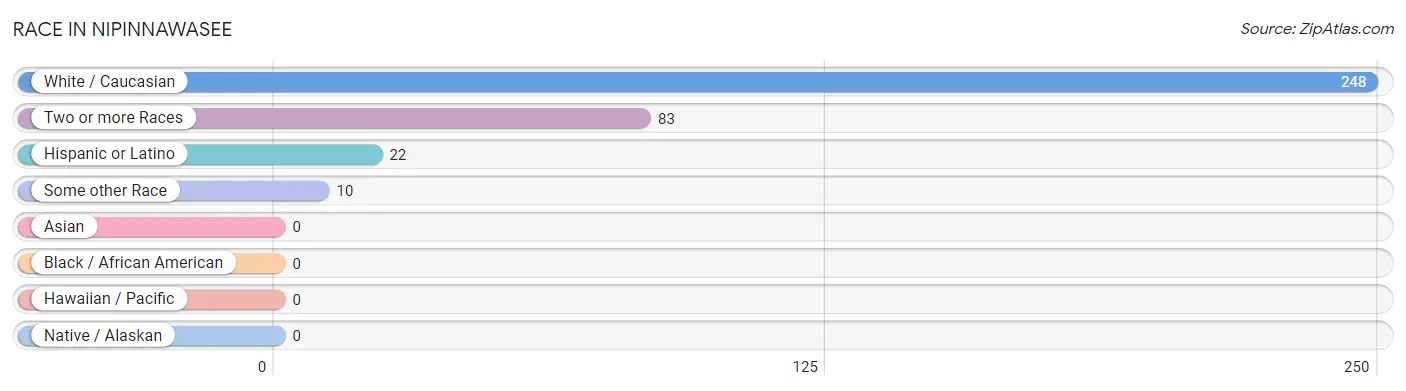
| Race | # Population | % Population |
| Asian | 0 | 0.0% |
| Black / African American | 0 | 0.0% |
| Hawaiian / Pacific | 0 | 0.0% |
| Hispanic or Latino | 22 | 6.5% |
| Native / Alaskan | 0 | 0.0% |
| White / Caucasian | 248 | 72.7% |
| Two or more Races | 83 | 24.3% |
| Some other Race | 10 | 2.9% |
| Total | 341 | 100.0% |
Ancestry in Nipinnawasee
The most populous ancestries reported in Nipinnawasee are American (211 | 61.9%), Native Hawaiian (71 | 20.8%), German (53 | 15.5%), English (50 | 14.7%), and Mexican (22 | 6.5%), together accounting for 119.4% of all Nipinnawasee residents.
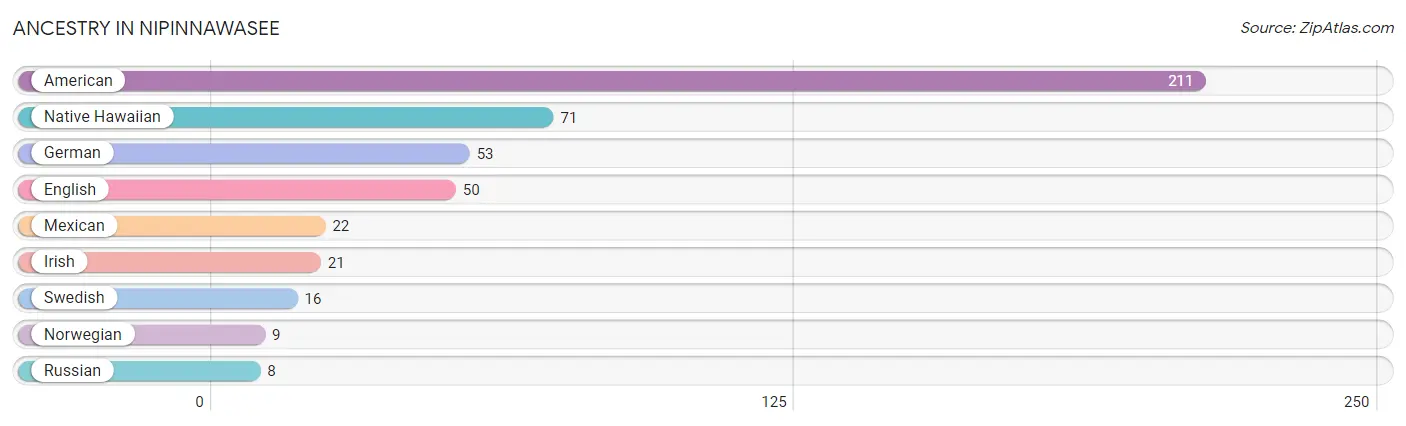
| Ancestry | # Population | % Population |
| American | 211 | 61.9% |
| English | 50 | 14.7% |
| German | 53 | 15.5% |
| Irish | 21 | 6.2% |
| Mexican | 22 | 6.5% |
| Native Hawaiian | 71 | 20.8% |
| Norwegian | 9 | 2.6% |
| Russian | 8 | 2.4% |
| Swedish | 16 | 4.7% | View All 9 Rows |
Immigrants in Nipinnawasee

| Immigration Origin | # Population | % Population | View All 0 Rows |
Sex and Age in Nipinnawasee
Sex and Age in Nipinnawasee
The most populous age groups in Nipinnawasee are 55 to 59 Years (102 | 43.8%) for men and 80 to 84 Years (33 | 30.6%) for women.
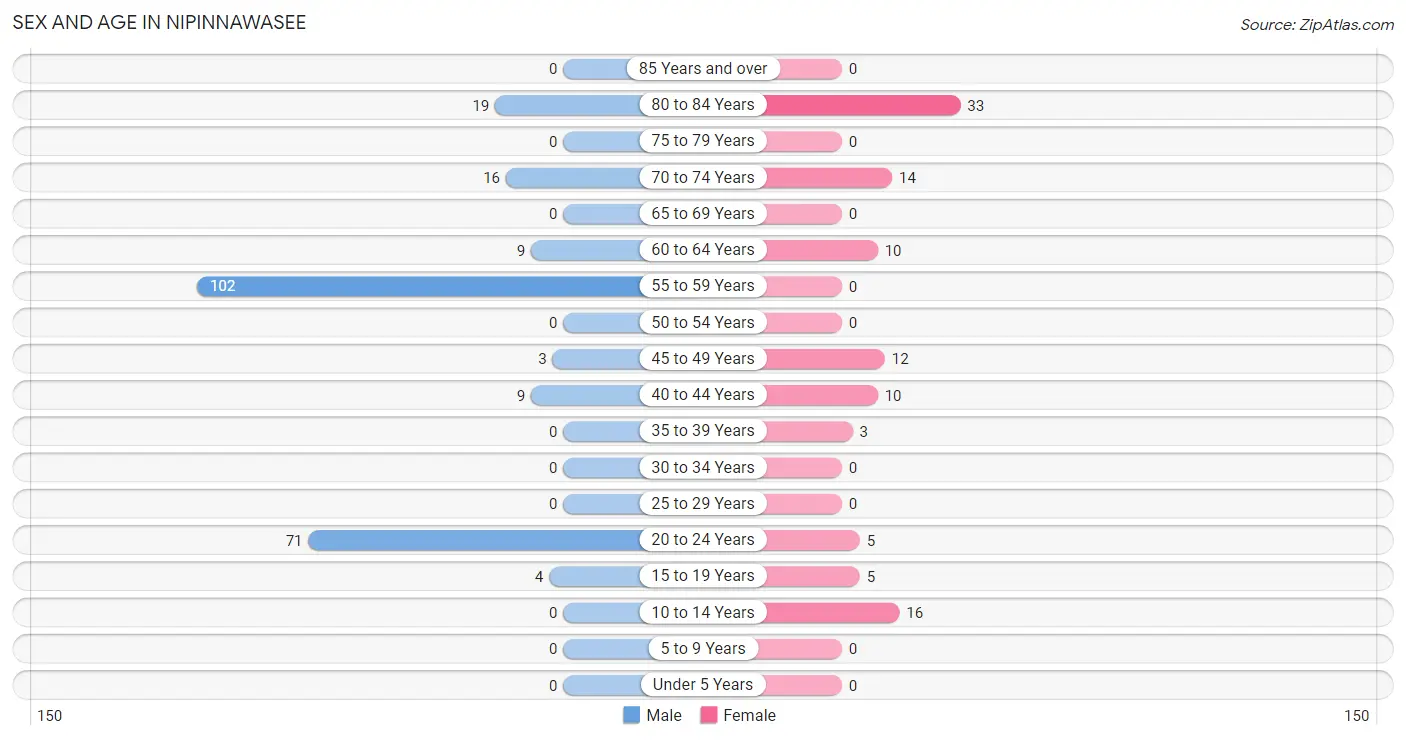
| Age Bracket | Male | Female |
| Under 5 Years | 0 (0.0%) | 0 (0.0%) |
| 5 to 9 Years | 0 (0.0%) | 0 (0.0%) |
| 10 to 14 Years | 0 (0.0%) | 16 (14.8%) |
| 15 to 19 Years | 4 (1.7%) | 5 (4.6%) |
| 20 to 24 Years | 71 (30.5%) | 5 (4.6%) |
| 25 to 29 Years | 0 (0.0%) | 0 (0.0%) |
| 30 to 34 Years | 0 (0.0%) | 0 (0.0%) |
| 35 to 39 Years | 0 (0.0%) | 3 (2.8%) |
| 40 to 44 Years | 9 (3.9%) | 10 (9.3%) |
| 45 to 49 Years | 3 (1.3%) | 12 (11.1%) |
| 50 to 54 Years | 0 (0.0%) | 0 (0.0%) |
| 55 to 59 Years | 102 (43.8%) | 0 (0.0%) |
| 60 to 64 Years | 9 (3.9%) | 10 (9.3%) |
| 65 to 69 Years | 0 (0.0%) | 0 (0.0%) |
| 70 to 74 Years | 16 (6.9%) | 14 (13.0%) |
| 75 to 79 Years | 0 (0.0%) | 0 (0.0%) |
| 80 to 84 Years | 19 (8.2%) | 33 (30.6%) |
| 85 Years and over | 0 (0.0%) | 0 (0.0%) |
| Total | 233 (100.0%) | 108 (100.0%) |
Families and Households in Nipinnawasee
Median Family Size in Nipinnawasee
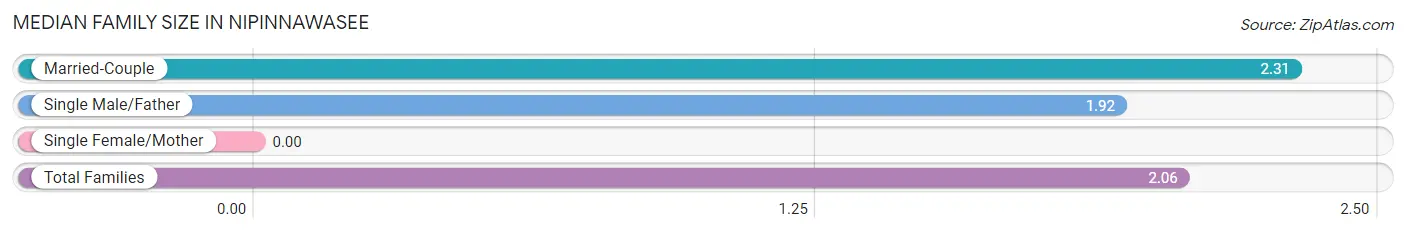
| Family Type | # Families | Family Size |
| Married-Couple | 59 (37.8%) | 2.31 |
| Single Male/Father | 97 (62.2%) | 1.92 |
| Single Female/Mother | 0 (0.0%) | - |
| Total Families | 156 (100.0%) | 2.06 |
Median Household Size in Nipinnawasee
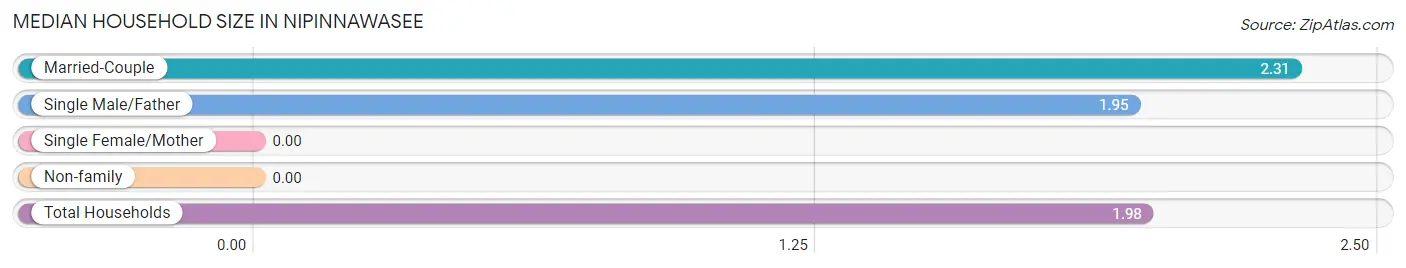
| Household Type | # Households | Household Size |
| Married-Couple | 59 (34.3%) | 2.31 |
| Single Male/Father | 97 (56.4%) | 1.95 |
| Single Female/Mother | 0 (0.0%) | - |
| Non-family | 16 (9.3%) | - |
| Total Households | 172 (100.0%) | 1.98 |
Household Size by Marriage Status in Nipinnawasee
Out of a total of 172 households in Nipinnawasee, 156 (90.7%) are family households, while 16 (9.3%) are nonfamily households. The most numerous type of family households are 2-person households, comprising 144, and the most common type of nonfamily households are 1-person households, comprising 16.
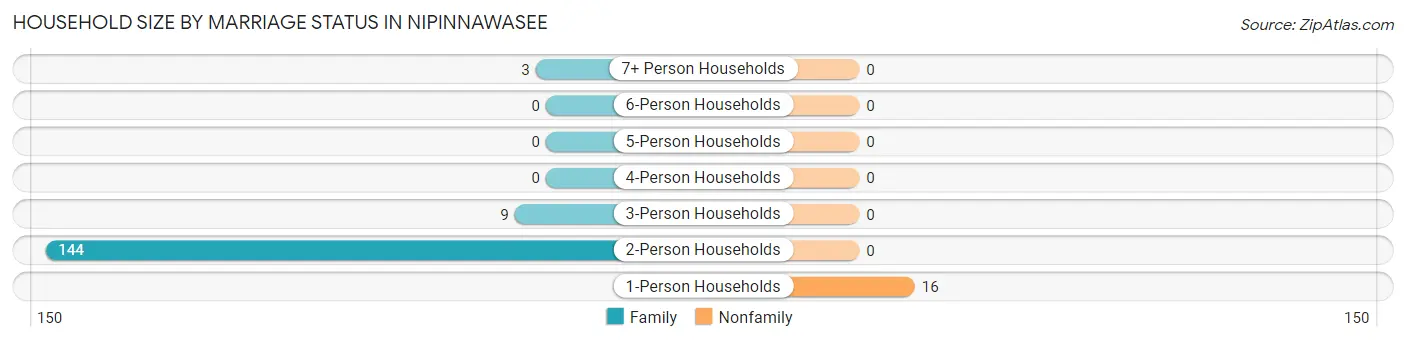
| Household Size | Family Households | Nonfamily Households |
| 1-Person Households | - | 16 (9.3%) |
| 2-Person Households | 144 (83.7%) | 0 (0.0%) |
| 3-Person Households | 9 (5.2%) | 0 (0.0%) |
| 4-Person Households | 0 (0.0%) | 0 (0.0%) |
| 5-Person Households | 0 (0.0%) | 0 (0.0%) |
| 6-Person Households | 0 (0.0%) | 0 (0.0%) |
| 7+ Person Households | 3 (1.7%) | 0 (0.0%) |
| Total | 156 (90.7%) | 16 (9.3%) |
Female Fertility in Nipinnawasee
Fertility by Age in Nipinnawasee
| Age Bracket | Women with Births | Births / 1,000 Women |
| 15 to 19 years | 0 (0.0%) | 0.0 |
| 20 to 34 years | 0 (0.0%) | 0.0 |
| 35 to 50 years | 0 (0.0%) | 0.0 |
| Total | 0 (0.0%) | 0.0 |
Fertility by Age by Marriage Status in Nipinnawasee
| Age Bracket | Married | Unmarried |
| 15 to 19 years | 0 (0.0%) | 0 (0.0%) |
| 20 to 34 years | 0 (0.0%) | 0 (0.0%) |
| 35 to 50 years | 0 (0.0%) | 0 (0.0%) |
| Total | 0 (0.0%) | 0 (0.0%) |
Fertility by Education in Nipinnawasee
| Educational Attainment | Women with Births | Births / 1,000 Women |
| Less than High School | 0 (0.0%) | 0.0 |
| High School Diploma | 0 (0.0%) | 0.0 |
| College or Associate's Degree | 0 (0.0%) | 0.0 |
| Bachelor's Degree | 0 (0.0%) | 0.0 |
| Graduate Degree | 0 (0.0%) | 0.0 |
| Total | 0 (0.0%) | 0.0 |
Fertility by Education by Marriage Status in Nipinnawasee
| Educational Attainment | Married | Unmarried |
| Less than High School | 0 (0.0%) | 0 (0.0%) |
| High School Diploma | 0 (0.0%) | 0 (0.0%) |
| College or Associate's Degree | 0 (0.0%) | 0 (0.0%) |
| Bachelor's Degree | 0 (0.0%) | 0 (0.0%) |
| Graduate Degree | 0 (0.0%) | 0 (0.0%) |
| Total | 0 (0.0%) | 0 (0.0%) |
Employment Characteristics in Nipinnawasee
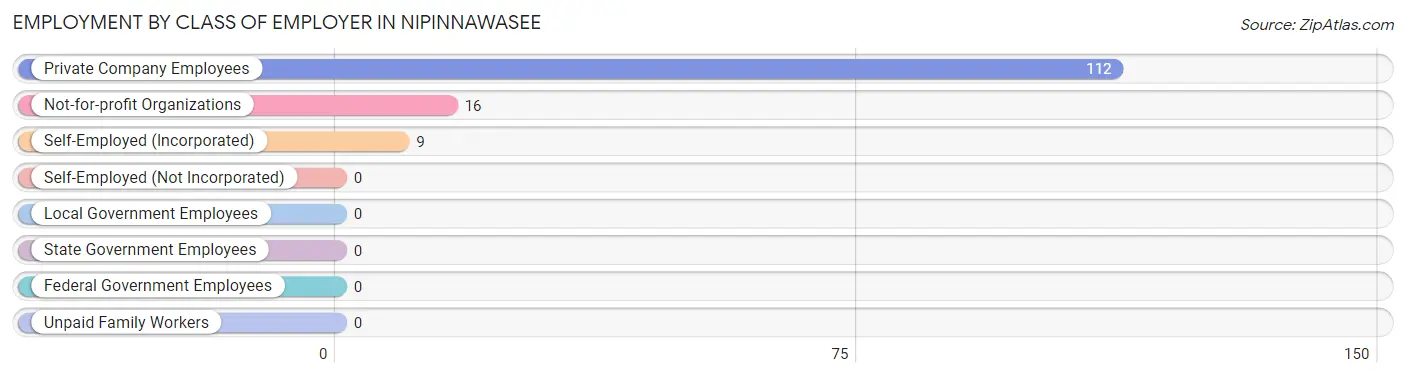
Employment by Class of Employer in Nipinnawasee
Among the 137 employed individuals in Nipinnawasee, private company employees (112 | 81.8%), not-for-profit organizations (16 | 11.7%), and self-employed (incorporated) (9 | 6.6%) make up the most common classes of employment.
| Employer Class | # Employees | % Employees |
| Private Company Employees | 112 | 81.8% |
| Self-Employed (Incorporated) | 9 | 6.6% |
| Self-Employed (Not Incorporated) | 0 | 0.0% |
| Not-for-profit Organizations | 16 | 11.7% |
| Local Government Employees | 0 | 0.0% |
| State Government Employees | 0 | 0.0% |
| Federal Government Employees | 0 | 0.0% |
| Unpaid Family Workers | 0 | 0.0% |
| Total | 137 | 100.0% |
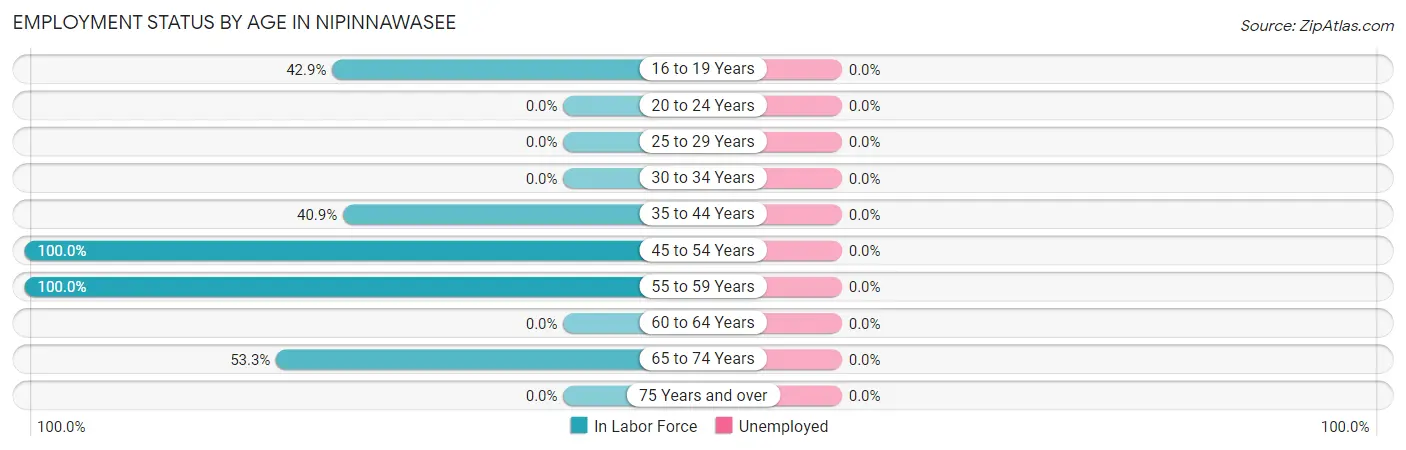
Employment Status by Age in Nipinnawasee
| Age Bracket | In Labor Force | Unemployed |
| 16 to 19 Years | 3 (42.9%) | 0 (0.0%) |
| 20 to 24 Years | 0 (0.0%) | 0 (0.0%) |
| 25 to 29 Years | 0 (0.0%) | 0 (0.0%) |
| 30 to 34 Years | 0 (0.0%) | 0 (0.0%) |
| 35 to 44 Years | 9 (40.9%) | 0 (0.0%) |
| 45 to 54 Years | 15 (100.0%) | 0 (0.0%) |
| 55 to 59 Years | 102 (100.0%) | 0 (0.0%) |
| 60 to 64 Years | 0 (0.0%) | 0 (0.0%) |
| 65 to 74 Years | 16 (53.3%) | 0 (0.0%) |
| 75 Years and over | 0 (0.0%) | 0 (0.0%) |
| Total | 145 (44.9%) | 0 (0.0%) |
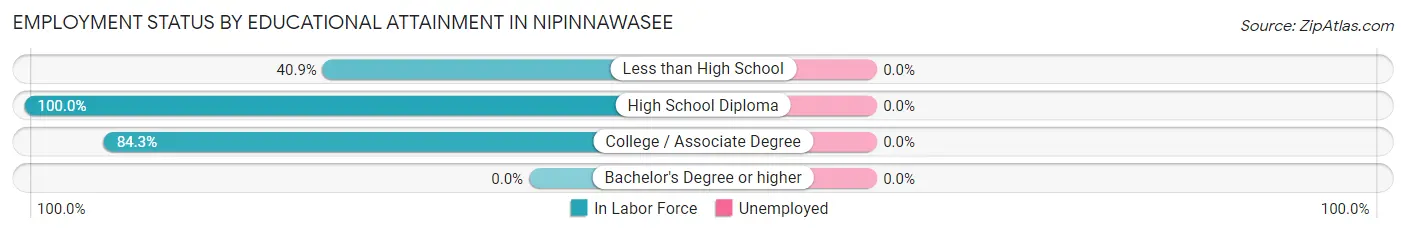
Employment Status by Educational Attainment in Nipinnawasee
| Educational Attainment | In Labor Force | Unemployed |
| Less than High School | 9 (40.9%) | 0 (0.0%) |
| High School Diploma | 15 (100.0%) | 0 (0.0%) |
| College / Associate Degree | 102 (84.3%) | 0 (0.0%) |
| Bachelor's Degree or higher | 0 (0.0%) | 0 (0.0%) |
| Total | 126 (79.7%) | 0 (0.0%) |
Employment Occupations by Sex in Nipinnawasee
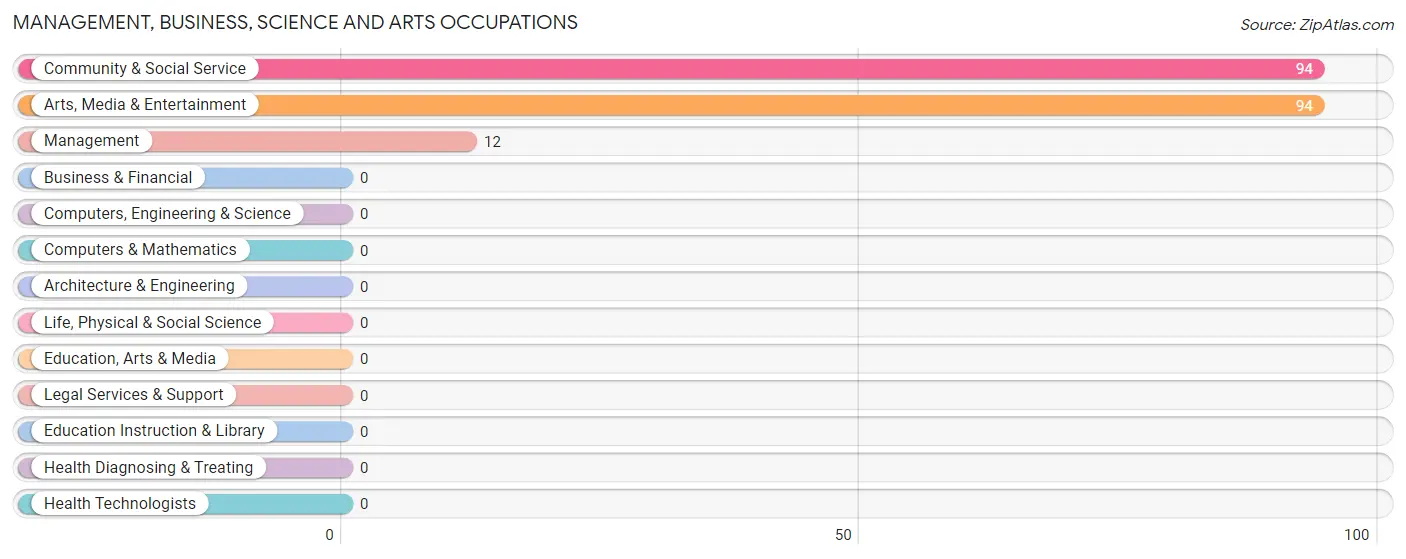
Management, Business, Science and Arts Occupations
The most common Management, Business, Science and Arts occupations in Nipinnawasee are Community & Social Service (94 | 64.8%), Arts, Media & Entertainment (94 | 64.8%), and Management (12 | 8.3%).
Management, Business, Science and Arts Occupations by Sex
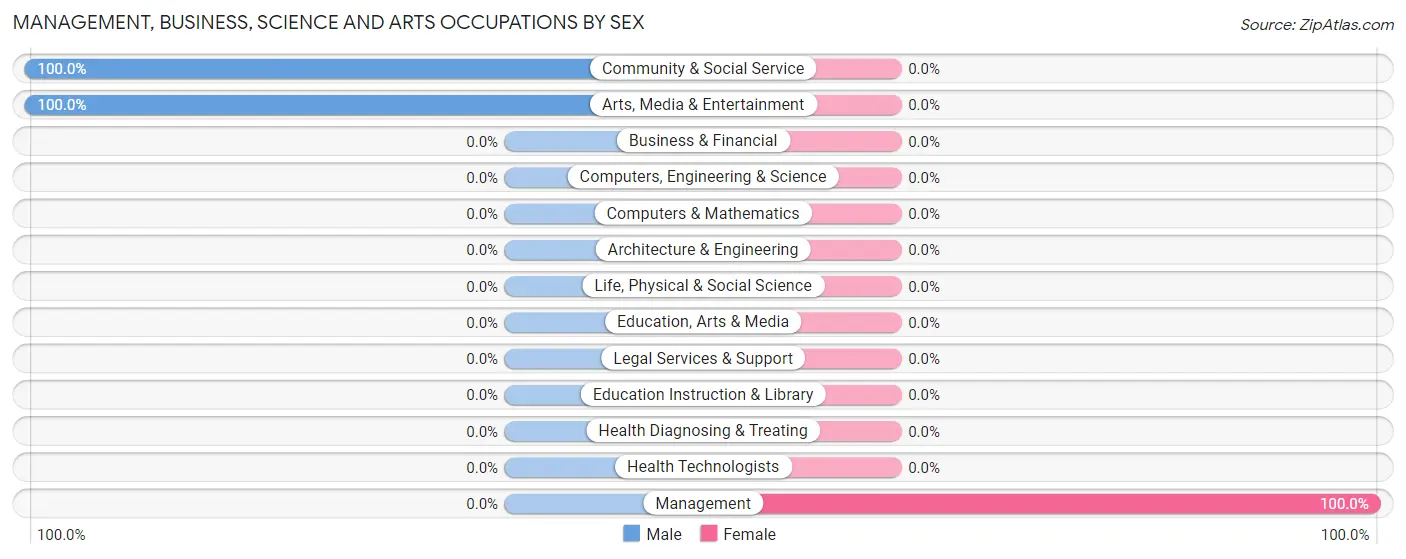
| Occupation | Male | Female |
| Management | 0 (0.0%) | 12 (100.0%) |
| Business & Financial | 0 (0.0%) | 0 (0.0%) |
| Computers, Engineering & Science | 0 (0.0%) | 0 (0.0%) |
| Computers & Mathematics | 0 (0.0%) | 0 (0.0%) |
| Architecture & Engineering | 0 (0.0%) | 0 (0.0%) |
| Life, Physical & Social Science | 0 (0.0%) | 0 (0.0%) |
| Community & Social Service | 94 (100.0%) | 0 (0.0%) |
| Education, Arts & Media | 0 (0.0%) | 0 (0.0%) |
| Legal Services & Support | 0 (0.0%) | 0 (0.0%) |
| Education Instruction & Library | 0 (0.0%) | 0 (0.0%) |
| Arts, Media & Entertainment | 94 (100.0%) | 0 (0.0%) |
| Health Diagnosing & Treating | 0 (0.0%) | 0 (0.0%) |
| Health Technologists | 0 (0.0%) | 0 (0.0%) |
| Total (Category) | 94 (88.7%) | 12 (11.3%) |
| Total (Overall) | 130 (89.7%) | 15 (10.3%) |
Services Occupations
The most common Services occupations in Nipinnawasee are Security & Protection (8 | 5.5%), and Law Enforcement (8 | 5.5%).
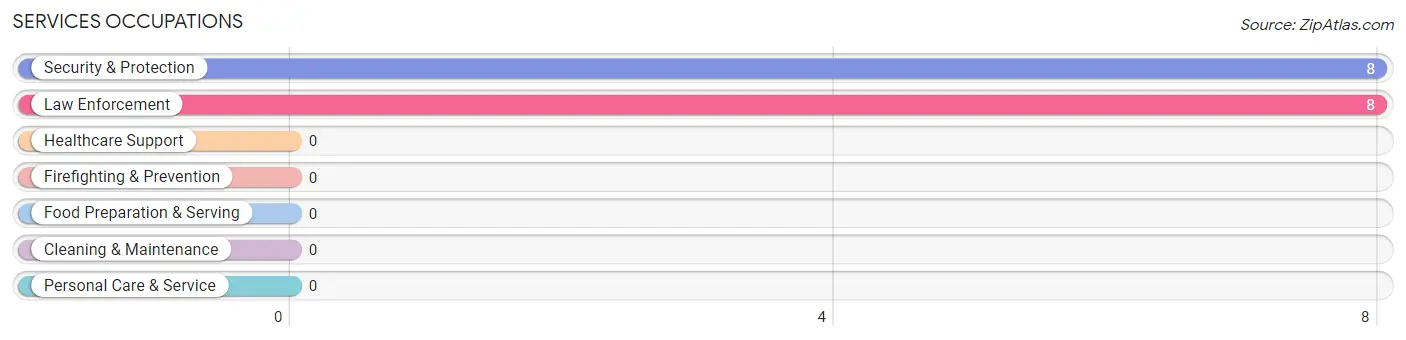
Services Occupations by Sex
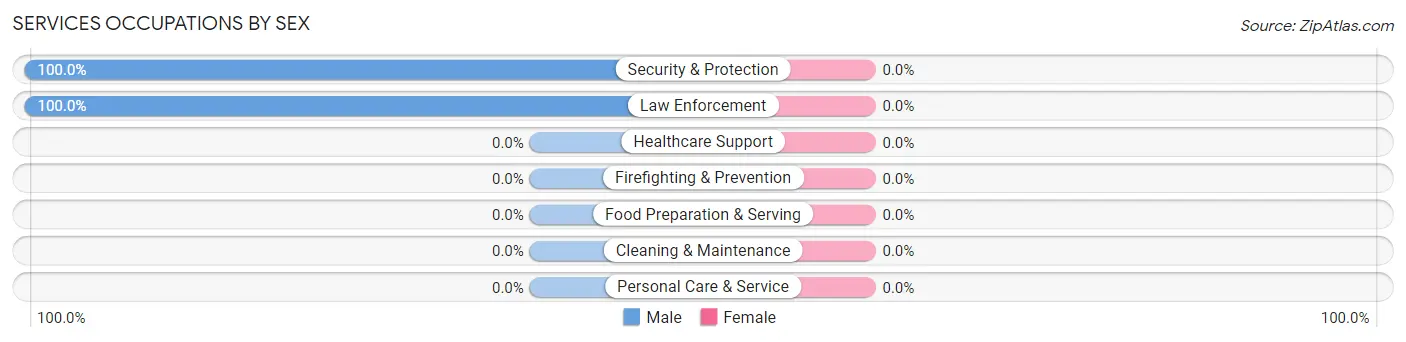
| Occupation | Male | Female |
| Healthcare Support | 0 (0.0%) | 0 (0.0%) |
| Security & Protection | 8 (100.0%) | 0 (0.0%) |
| Firefighting & Prevention | 0 (0.0%) | 0 (0.0%) |
| Law Enforcement | 8 (100.0%) | 0 (0.0%) |
| Food Preparation & Serving | 0 (0.0%) | 0 (0.0%) |
| Cleaning & Maintenance | 0 (0.0%) | 0 (0.0%) |
| Personal Care & Service | 0 (0.0%) | 0 (0.0%) |
| Total (Category) | 8 (100.0%) | 0 (0.0%) |
| Total (Overall) | 130 (89.7%) | 15 (10.3%) |
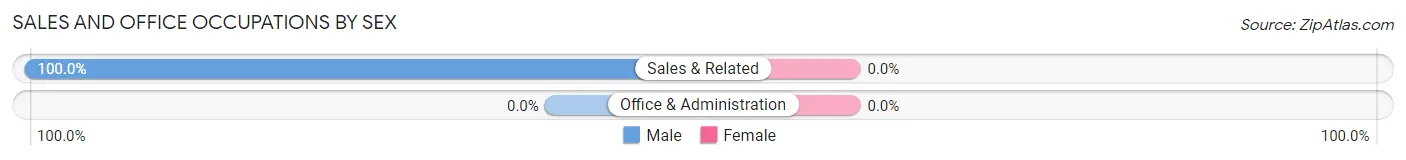
Sales and Office Occupations
The most common Sales and Office occupations in Nipinnawasee are , and Sales & Related (9 | 6.2%).
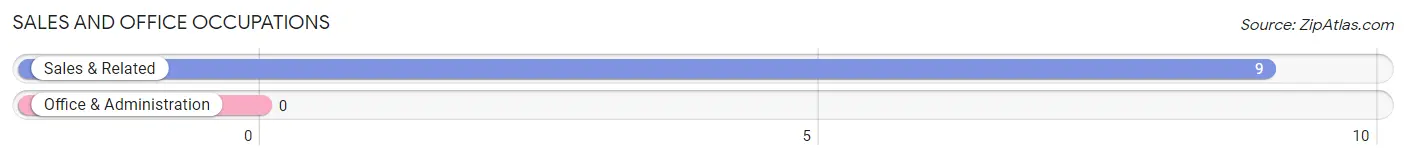
Sales and Office Occupations by Sex
| Occupation | Male | Female |
| Sales & Related | 9 (100.0%) | 0 (0.0%) |
| Office & Administration | 0 (0.0%) | 0 (0.0%) |
| Total (Category) | 9 (100.0%) | 0 (0.0%) |
| Total (Overall) | 130 (89.7%) | 15 (10.3%) |
Natural Resources, Construction and Maintenance Occupations
The most common Natural Resources, Construction and Maintenance occupations in Nipinnawasee are , and Construction & Extraction (3 | 2.1%).
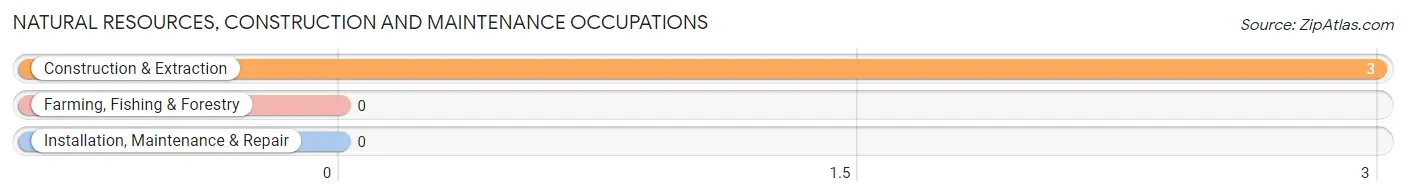
Natural Resources, Construction and Maintenance Occupations by Sex
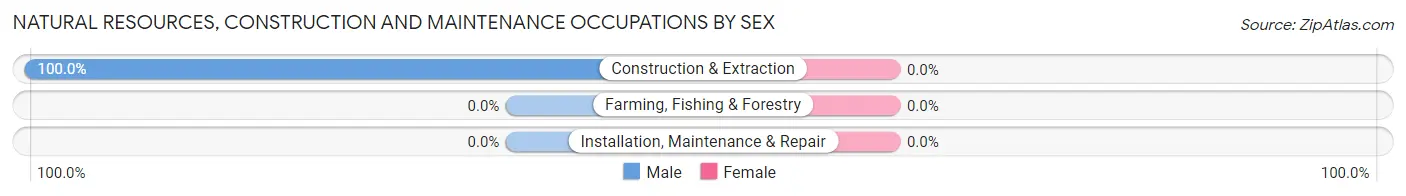
| Occupation | Male | Female |
| Farming, Fishing & Forestry | 0 (0.0%) | 0 (0.0%) |
| Construction & Extraction | 3 (100.0%) | 0 (0.0%) |
| Installation, Maintenance & Repair | 0 (0.0%) | 0 (0.0%) |
| Total (Category) | 3 (100.0%) | 0 (0.0%) |
| Total (Overall) | 130 (89.7%) | 15 (10.3%) |
Production, Transportation and Moving Occupations
The most common Production, Transportation and Moving occupations in Nipinnawasee are Production (16 | 11.0%), and Material Moving (3 | 2.1%).
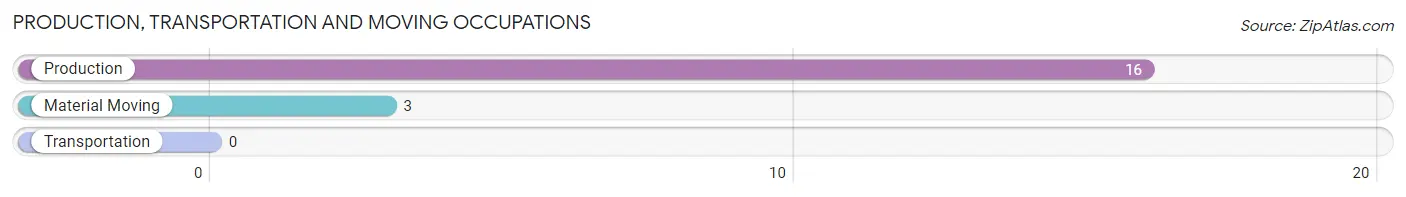
Production, Transportation and Moving Occupations by Sex
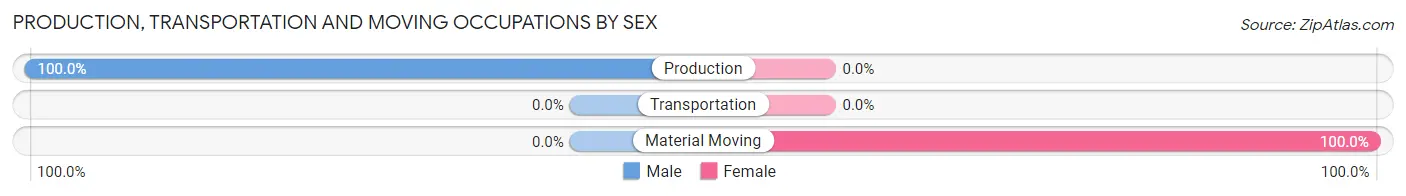
| Occupation | Male | Female |
| Production | 16 (100.0%) | 0 (0.0%) |
| Transportation | 0 (0.0%) | 0 (0.0%) |
| Material Moving | 0 (0.0%) | 3 (100.0%) |
| Total (Category) | 16 (84.2%) | 3 (15.8%) |
| Total (Overall) | 130 (89.7%) | 15 (10.3%) |
Employment Industries by Sex in Nipinnawasee
Employment Industries in Nipinnawasee
The major employment industries in Nipinnawasee include Manufacturing (94 | 64.8%), Information (16 | 11.0%), Accommodation & Food Services (12 | 8.3%), Finance & Insurance (9 | 6.2%), and Administrative & Support (8 | 5.5%).
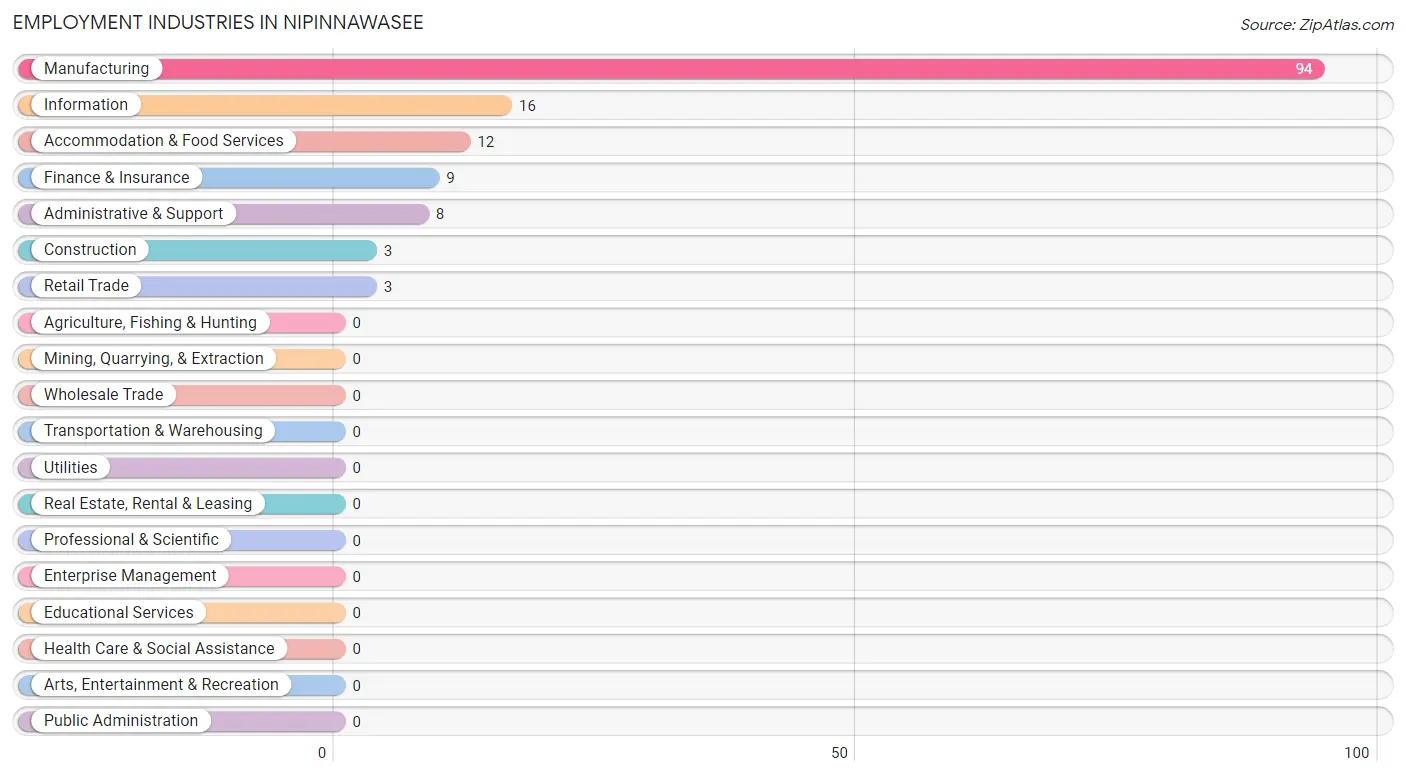
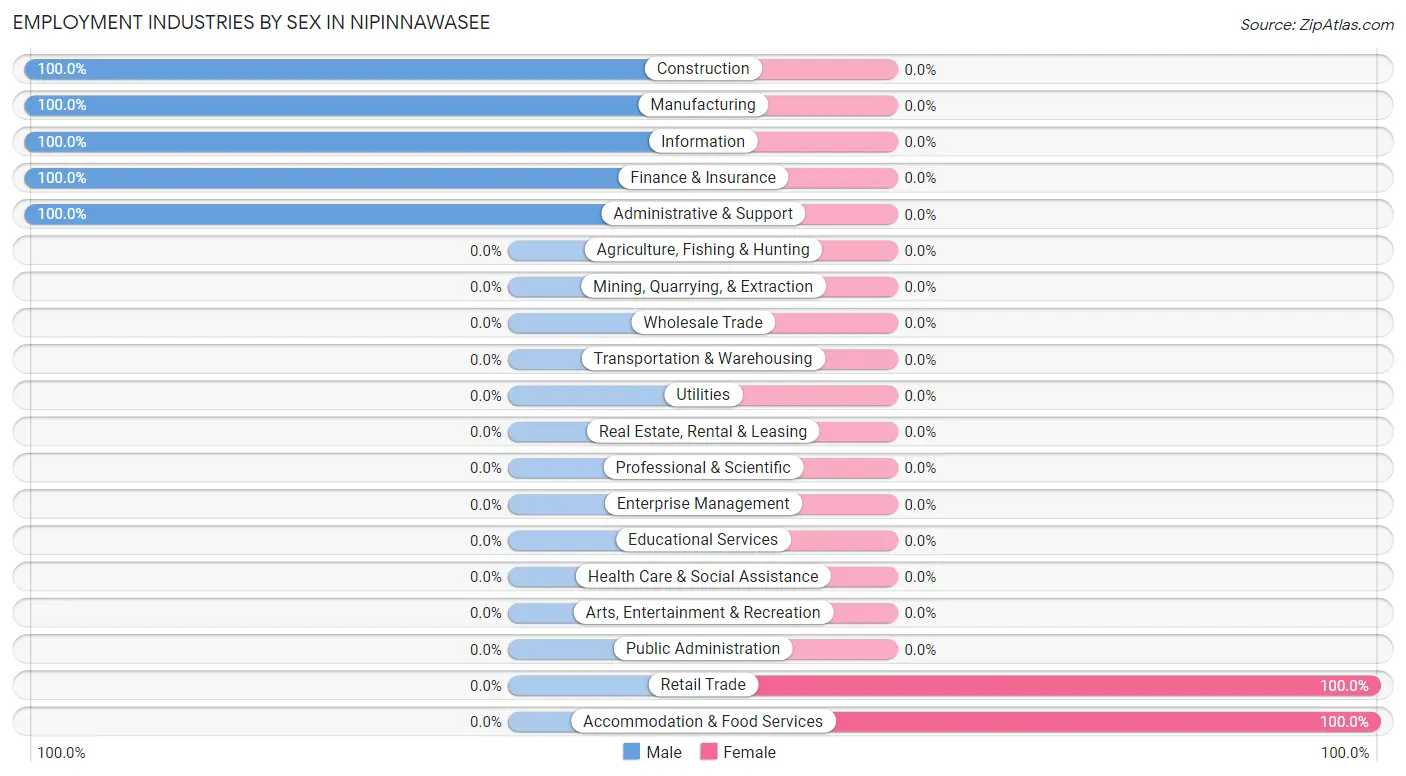
Employment Industries by Sex in Nipinnawasee
The Nipinnawasee industries that see more men than women are Construction (100.0%), Manufacturing (100.0%), and Information (100.0%), whereas the industries that tend to have a higher number of women are Retail Trade (100.0%), and Accommodation & Food Services (100.0%).
| Industry | Male | Female |
| Agriculture, Fishing & Hunting | 0 (0.0%) | 0 (0.0%) |
| Mining, Quarrying, & Extraction | 0 (0.0%) | 0 (0.0%) |
| Construction | 3 (100.0%) | 0 (0.0%) |
| Manufacturing | 94 (100.0%) | 0 (0.0%) |
| Wholesale Trade | 0 (0.0%) | 0 (0.0%) |
| Retail Trade | 0 (0.0%) | 3 (100.0%) |
| Transportation & Warehousing | 0 (0.0%) | 0 (0.0%) |
| Utilities | 0 (0.0%) | 0 (0.0%) |
| Information | 16 (100.0%) | 0 (0.0%) |
| Finance & Insurance | 9 (100.0%) | 0 (0.0%) |
| Real Estate, Rental & Leasing | 0 (0.0%) | 0 (0.0%) |
| Professional & Scientific | 0 (0.0%) | 0 (0.0%) |
| Enterprise Management | 0 (0.0%) | 0 (0.0%) |
| Administrative & Support | 8 (100.0%) | 0 (0.0%) |
| Educational Services | 0 (0.0%) | 0 (0.0%) |
| Health Care & Social Assistance | 0 (0.0%) | 0 (0.0%) |
| Arts, Entertainment & Recreation | 0 (0.0%) | 0 (0.0%) |
| Accommodation & Food Services | 0 (0.0%) | 12 (100.0%) |
| Public Administration | 0 (0.0%) | 0 (0.0%) |
| Total | 130 (89.7%) | 15 (10.3%) |
Education in Nipinnawasee
School Enrollment in Nipinnawasee
The most common levels of schooling among the 94 students in Nipinnawasee are college / undergraduate (76 | 80.8%), middle school (16 | 17.0%), and high school (2 | 2.1%).
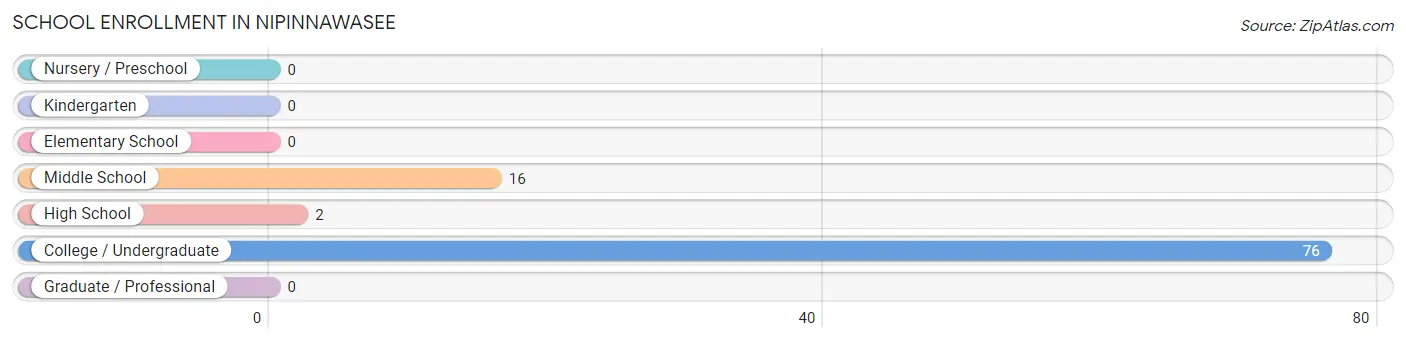
| School Level | # Students | % Students |
| Nursery / Preschool | 0 | 0.0% |
| Kindergarten | 0 | 0.0% |
| Elementary School | 0 | 0.0% |
| Middle School | 16 | 17.0% |
| High School | 2 | 2.1% |
| College / Undergraduate | 76 | 80.8% |
| Graduate / Professional | 0 | 0.0% |
| Total | 94 | 100.0% |
School Enrollment by Age by Funding Source in Nipinnawasee
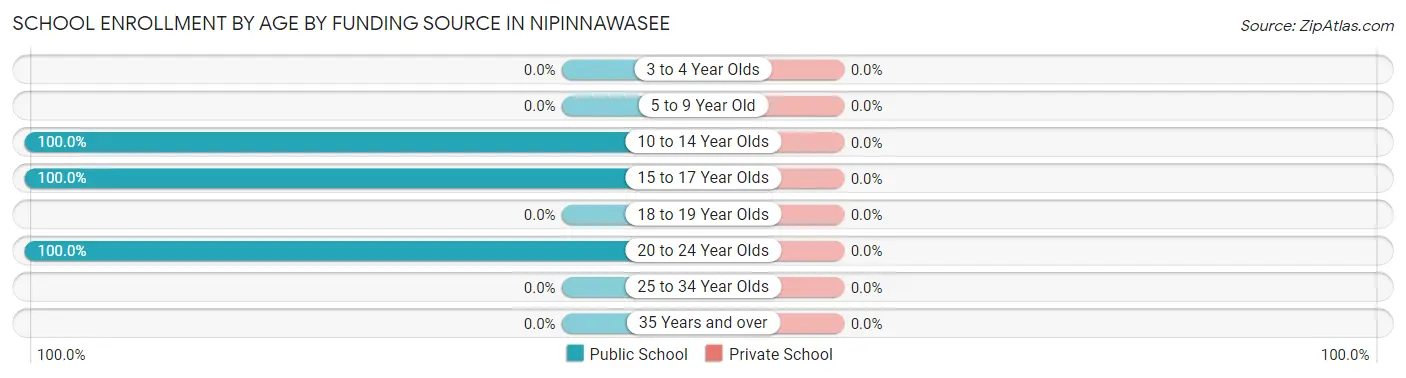
| Age Bracket | Public School | Private School |
| 3 to 4 Year Olds | 0 (0.0%) | 0 (0.0%) |
| 5 to 9 Year Old | 0 (0.0%) | 0 (0.0%) |
| 10 to 14 Year Olds | 16 (100.0%) | 0 (0.0%) |
| 15 to 17 Year Olds | 2 (100.0%) | 0 (0.0%) |
| 18 to 19 Year Olds | 0 (0.0%) | 0 (0.0%) |
| 20 to 24 Year Olds | 76 (100.0%) | 0 (0.0%) |
| 25 to 34 Year Olds | 0 (0.0%) | 0 (0.0%) |
| 35 Years and over | 0 (0.0%) | 0 (0.0%) |
| Total | 94 (100.0%) | 0 (0.0%) |
Educational Attainment by Field of Study in Nipinnawasee
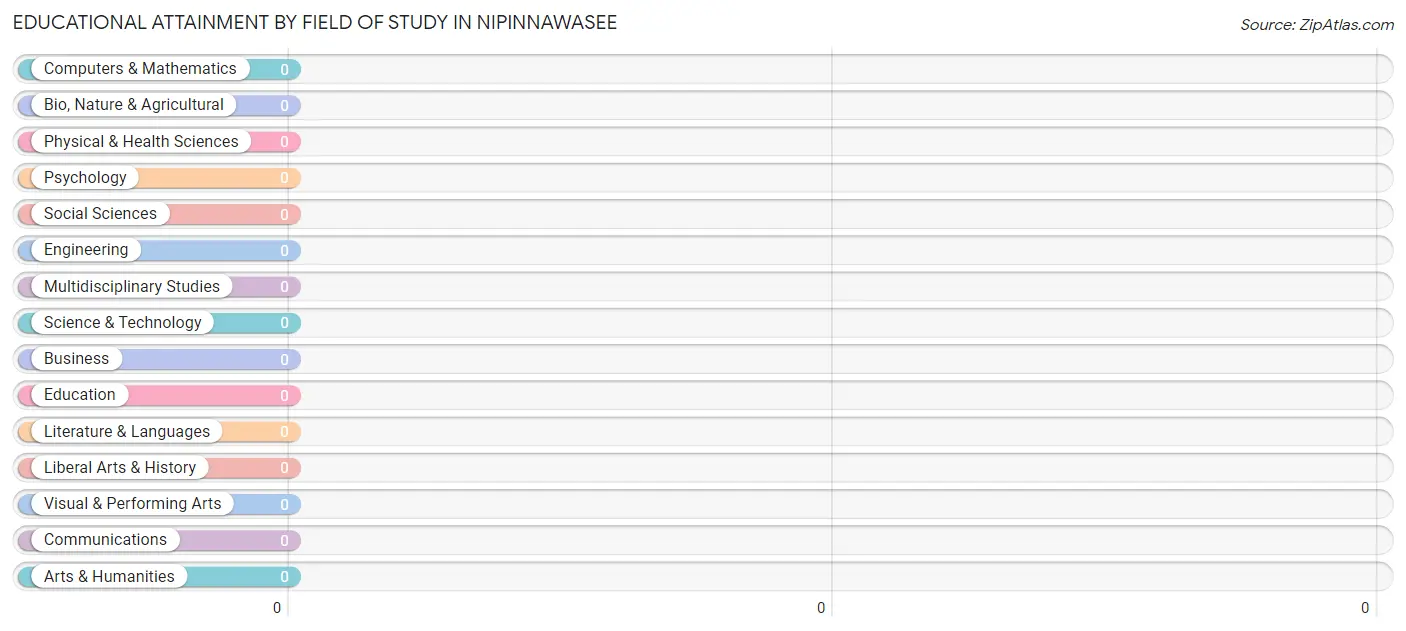
| Field of Study | # Graduates | % Graduates |
| Computers & Mathematics | 0 | 0.0% |
| Bio, Nature & Agricultural | 0 | 0.0% |
| Physical & Health Sciences | 0 | 0.0% |
| Psychology | 0 | 0.0% |
| Social Sciences | 0 | 0.0% |
| Engineering | 0 | 0.0% |
| Multidisciplinary Studies | 0 | 0.0% |
| Science & Technology | 0 | 0.0% |
| Business | 0 | 0.0% |
| Education | 0 | 0.0% |
| Literature & Languages | 0 | 0.0% |
| Liberal Arts & History | 0 | 0.0% |
| Visual & Performing Arts | 0 | 0.0% |
| Communications | 0 | 0.0% |
| Arts & Humanities | 0 | 0.0% |
| Total | 0 | 0.0% |
Transportation & Commute in Nipinnawasee
Vehicle Availability by Sex in Nipinnawasee
The most prevalent vehicle ownership categories in Nipinnawasee are males with 2 vehicles (94, accounting for 77.0%) and females with 2 vehicles (0, making up 626.7%).
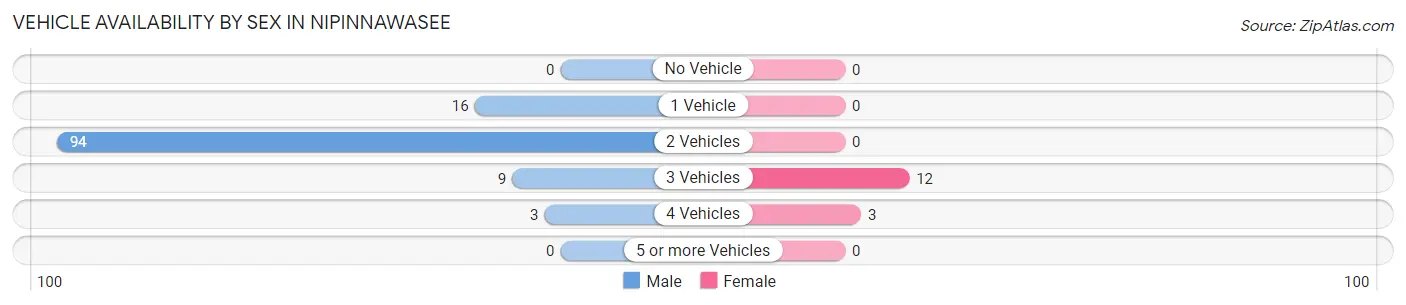
| Vehicles Available | Male | Female |
| No Vehicle | 0 (0.0%) | 0 (0.0%) |
| 1 Vehicle | 16 (13.1%) | 0 (0.0%) |
| 2 Vehicles | 94 (77.0%) | 0 (0.0%) |
| 3 Vehicles | 9 (7.4%) | 12 (80.0%) |
| 4 Vehicles | 3 (2.5%) | 3 (20.0%) |
| 5 or more Vehicles | 0 (0.0%) | 0 (0.0%) |
| Total | 122 (100.0%) | 15 (100.0%) |
Commute Time in Nipinnawasee
The most frequently occuring commute durations in Nipinnawasee are 20 to 24 minutes (103 commuters, 75.2%), 5 to 9 minutes (19 commuters, 13.9%), and 60 to 89 minutes (12 commuters, 8.8%).
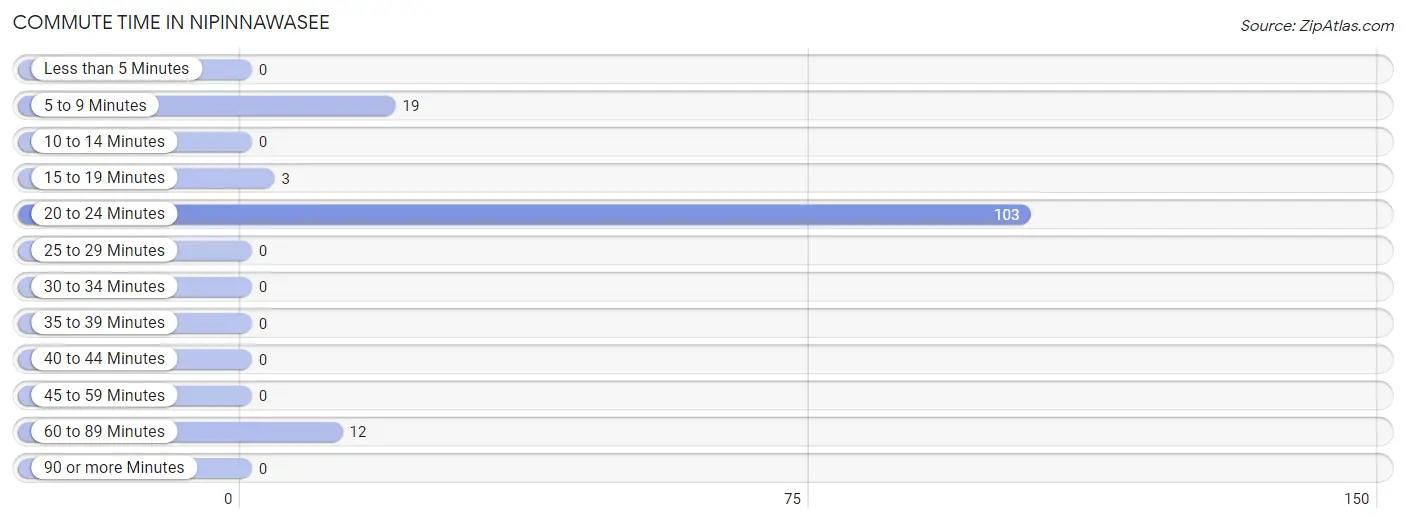
| Commute Time | # Commuters | % Commuters |
| Less than 5 Minutes | 0 | 0.0% |
| 5 to 9 Minutes | 19 | 13.9% |
| 10 to 14 Minutes | 0 | 0.0% |
| 15 to 19 Minutes | 3 | 2.2% |
| 20 to 24 Minutes | 103 | 75.2% |
| 25 to 29 Minutes | 0 | 0.0% |
| 30 to 34 Minutes | 0 | 0.0% |
| 35 to 39 Minutes | 0 | 0.0% |
| 40 to 44 Minutes | 0 | 0.0% |
| 45 to 59 Minutes | 0 | 0.0% |
| 60 to 89 Minutes | 12 | 8.8% |
| 90 or more Minutes | 0 | 0.0% |
Commute Time by Sex in Nipinnawasee
The most common commute times in Nipinnawasee are 20 to 24 minutes (103 commuters, 84.4%) for males and 60 to 89 minutes (12 commuters, 80.0%) for females.
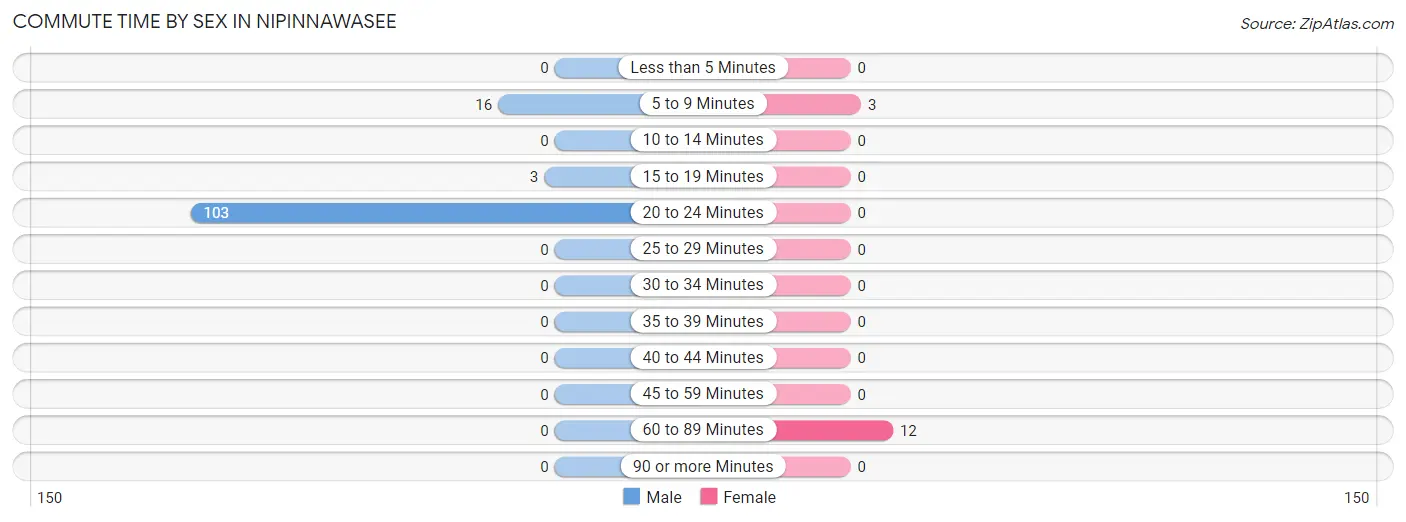
| Commute Time | Male | Female |
| Less than 5 Minutes | 0 (0.0%) | 0 (0.0%) |
| 5 to 9 Minutes | 16 (13.1%) | 3 (20.0%) |
| 10 to 14 Minutes | 0 (0.0%) | 0 (0.0%) |
| 15 to 19 Minutes | 3 (2.5%) | 0 (0.0%) |
| 20 to 24 Minutes | 103 (84.4%) | 0 (0.0%) |
| 25 to 29 Minutes | 0 (0.0%) | 0 (0.0%) |
| 30 to 34 Minutes | 0 (0.0%) | 0 (0.0%) |
| 35 to 39 Minutes | 0 (0.0%) | 0 (0.0%) |
| 40 to 44 Minutes | 0 (0.0%) | 0 (0.0%) |
| 45 to 59 Minutes | 0 (0.0%) | 0 (0.0%) |
| 60 to 89 Minutes | 0 (0.0%) | 12 (80.0%) |
| 90 or more Minutes | 0 (0.0%) | 0 (0.0%) |
Time of Departure to Work by Sex in Nipinnawasee
The most frequent times of departure to work in Nipinnawasee are 7:00 AM to 7:29 AM (94, 77.0%) for males and 7:00 AM to 7:29 AM (12, 80.0%) for females.
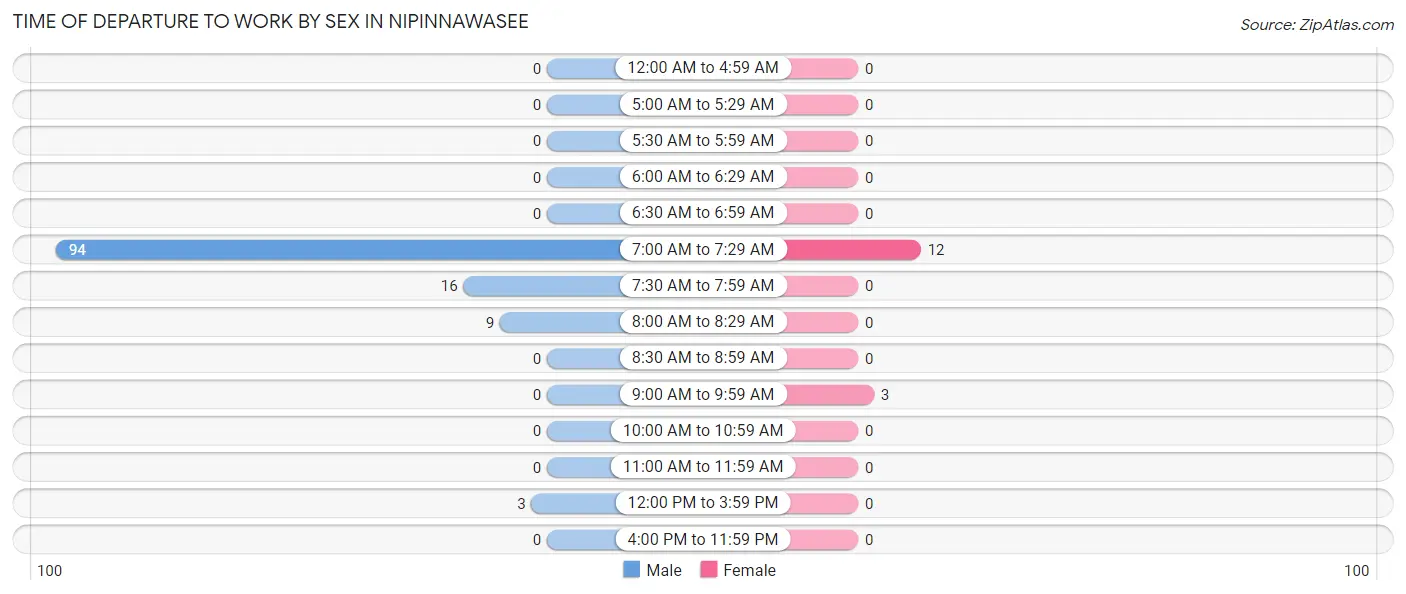
| Time of Departure | Male | Female |
| 12:00 AM to 4:59 AM | 0 (0.0%) | 0 (0.0%) |
| 5:00 AM to 5:29 AM | 0 (0.0%) | 0 (0.0%) |
| 5:30 AM to 5:59 AM | 0 (0.0%) | 0 (0.0%) |
| 6:00 AM to 6:29 AM | 0 (0.0%) | 0 (0.0%) |
| 6:30 AM to 6:59 AM | 0 (0.0%) | 0 (0.0%) |
| 7:00 AM to 7:29 AM | 94 (77.0%) | 12 (80.0%) |
| 7:30 AM to 7:59 AM | 16 (13.1%) | 0 (0.0%) |
| 8:00 AM to 8:29 AM | 9 (7.4%) | 0 (0.0%) |
| 8:30 AM to 8:59 AM | 0 (0.0%) | 0 (0.0%) |
| 9:00 AM to 9:59 AM | 0 (0.0%) | 3 (20.0%) |
| 10:00 AM to 10:59 AM | 0 (0.0%) | 0 (0.0%) |
| 11:00 AM to 11:59 AM | 0 (0.0%) | 0 (0.0%) |
| 12:00 PM to 3:59 PM | 3 (2.5%) | 0 (0.0%) |
| 4:00 PM to 11:59 PM | 0 (0.0%) | 0 (0.0%) |
| Total | 122 (100.0%) | 15 (100.0%) |
Housing Occupancy in Nipinnawasee
Occupancy by Ownership in Nipinnawasee
Of the total 172 dwellings in Nipinnawasee, owner-occupied units account for 172 (100.0%), while renter-occupied units make up 0 (0.0%).
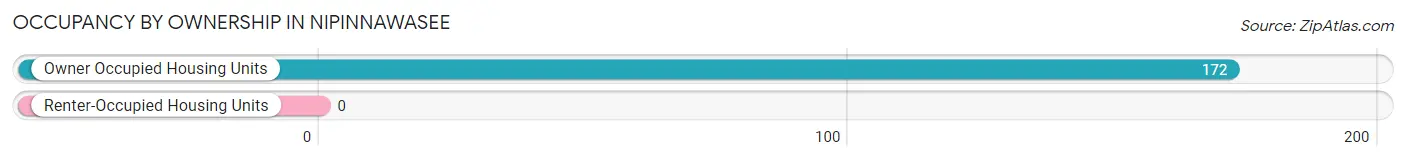
| Occupancy | # Housing Units | % Housing Units |
| Owner Occupied Housing Units | 172 | 100.0% |
| Renter-Occupied Housing Units | 0 | 0.0% |
| Total Occupied Housing Units | 172 | 100.0% |
Occupancy by Household Size in Nipinnawasee
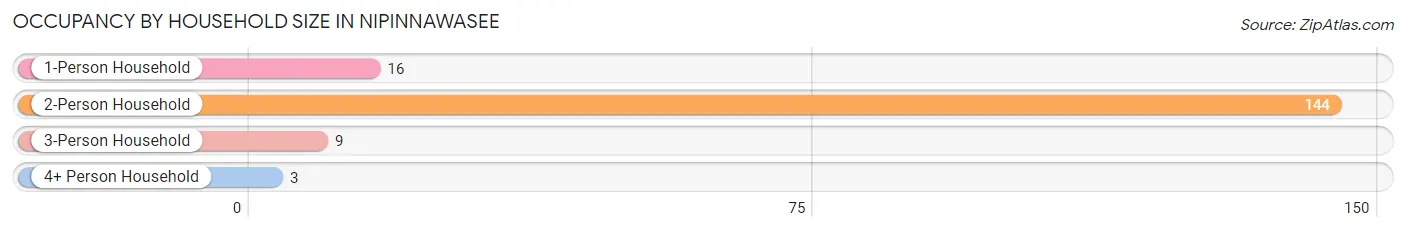
| Household Size | # Housing Units | % Housing Units |
| 1-Person Household | 16 | 9.3% |
| 2-Person Household | 144 | 83.7% |
| 3-Person Household | 9 | 5.2% |
| 4+ Person Household | 3 | 1.7% |
| Total Housing Units | 172 | 100.0% |
Occupancy by Ownership by Household Size in Nipinnawasee
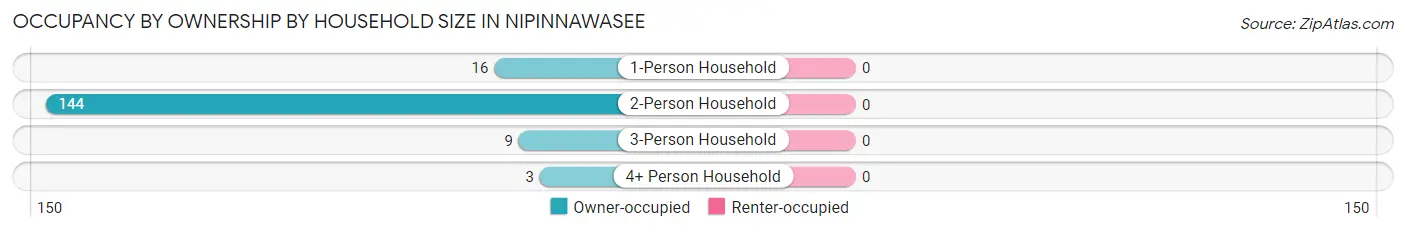
| Household Size | Owner-occupied | Renter-occupied |
| 1-Person Household | 16 (100.0%) | 0 (0.0%) |
| 2-Person Household | 144 (100.0%) | 0 (0.0%) |
| 3-Person Household | 9 (100.0%) | 0 (0.0%) |
| 4+ Person Household | 3 (100.0%) | 0 (0.0%) |
| Total Housing Units | 172 (100.0%) | 0 (0.0%) |
Occupancy by Educational Attainment in Nipinnawasee
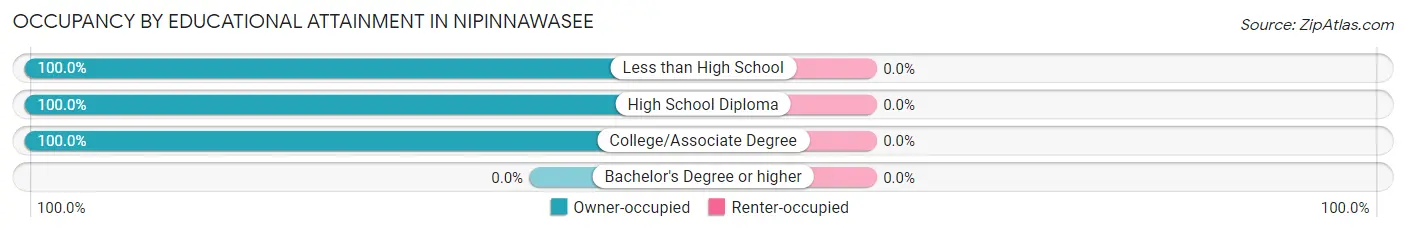
| Household Size | Owner-occupied | Renter-occupied |
| Less than High School | 9 (100.0%) | 0 (0.0%) |
| High School Diploma | 35 (100.0%) | 0 (0.0%) |
| College/Associate Degree | 128 (100.0%) | 0 (0.0%) |
| Bachelor's Degree or higher | 0 (0.0%) | 0 (0.0%) |
Occupancy by Age of Householder in Nipinnawasee
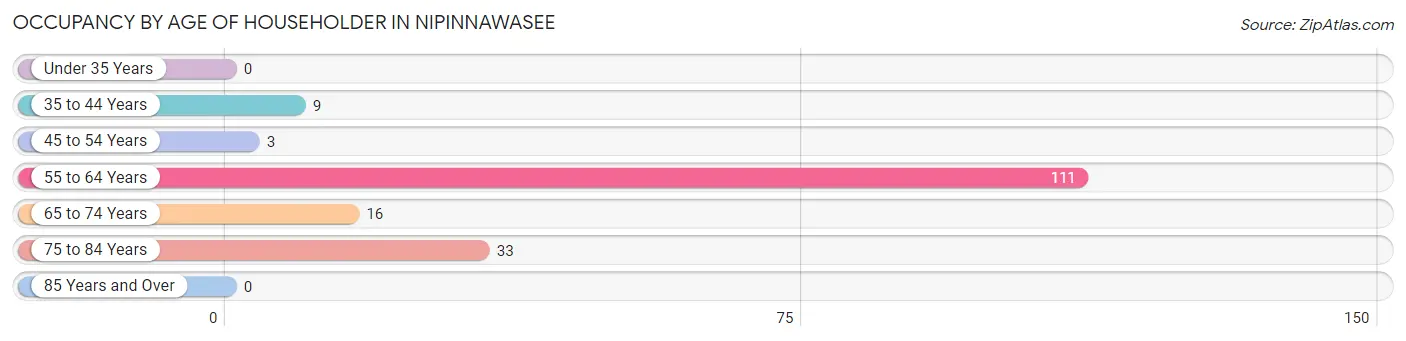
| Age Bracket | # Households | % Households |
| Under 35 Years | 0 | 0.0% |
| 35 to 44 Years | 9 | 5.2% |
| 45 to 54 Years | 3 | 1.7% |
| 55 to 64 Years | 111 | 64.5% |
| 65 to 74 Years | 16 | 9.3% |
| 75 to 84 Years | 33 | 19.2% |
| 85 Years and Over | 0 | 0.0% |
| Total | 172 | 100.0% |
Housing Finances in Nipinnawasee
Median Income by Occupancy in Nipinnawasee
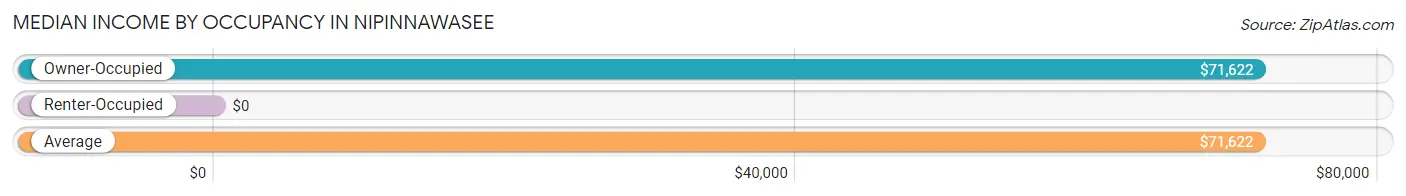
| Occupancy Type | # Households | Median Income |
| Owner-Occupied | 172 (100.0%) | $71,622 |
| Renter-Occupied | 0 (0.0%) | $0 |
| Average | 172 (100.0%) | $71,622 |
Occupancy by Householder Income Bracket in Nipinnawasee
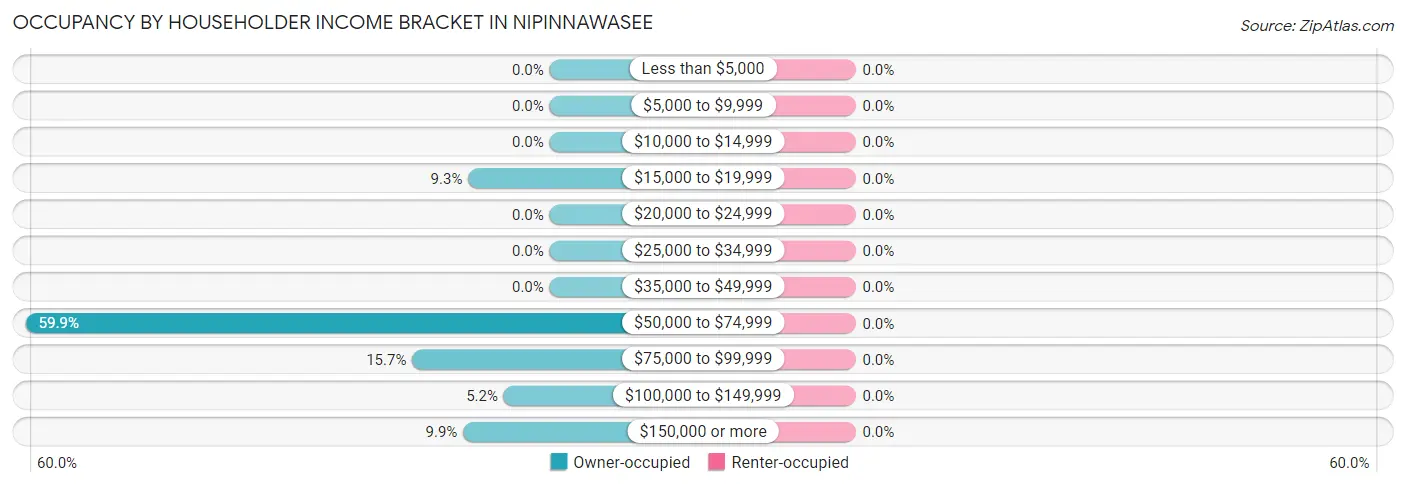
| Income Bracket | Owner-occupied | Renter-occupied |
| Less than $5,000 | 0 (0.0%) | 0 (0.0%) |
| $5,000 to $9,999 | 0 (0.0%) | 0 (0.0%) |
| $10,000 to $14,999 | 0 (0.0%) | 0 (0.0%) |
| $15,000 to $19,999 | 16 (9.3%) | 0 (0.0%) |
| $20,000 to $24,999 | 0 (0.0%) | 0 (0.0%) |
| $25,000 to $34,999 | 0 (0.0%) | 0 (0.0%) |
| $35,000 to $49,999 | 0 (0.0%) | 0 (0.0%) |
| $50,000 to $74,999 | 103 (59.9%) | 0 (0.0%) |
| $75,000 to $99,999 | 27 (15.7%) | 0 (0.0%) |
| $100,000 to $149,999 | 9 (5.2%) | 0 (0.0%) |
| $150,000 or more | 17 (9.9%) | 0 (0.0%) |
| Total | 172 (100.0%) | 0 (0.0%) |
Monthly Housing Cost Tiers in Nipinnawasee
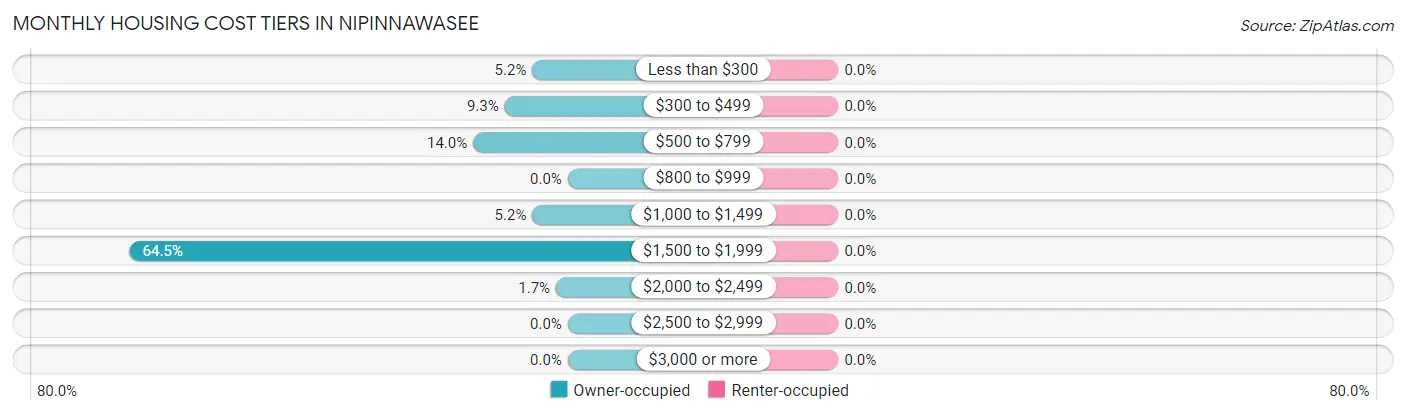
| Monthly Cost | Owner-occupied | Renter-occupied |
| Less than $300 | 9 (5.2%) | 0 (0.0%) |
| $300 to $499 | 16 (9.3%) | 0 (0.0%) |
| $500 to $799 | 24 (14.0%) | 0 (0.0%) |
| $800 to $999 | 0 (0.0%) | 0 (0.0%) |
| $1,000 to $1,499 | 9 (5.2%) | 0 (0.0%) |
| $1,500 to $1,999 | 111 (64.5%) | 0 (0.0%) |
| $2,000 to $2,499 | 3 (1.7%) | 0 (0.0%) |
| $2,500 to $2,999 | 0 (0.0%) | 0 (0.0%) |
| $3,000 or more | 0 (0.0%) | 0 (0.0%) |
| Total | 172 (100.0%) | 0 (0.0%) |
Physical Housing Characteristics in Nipinnawasee
Housing Structures in Nipinnawasee
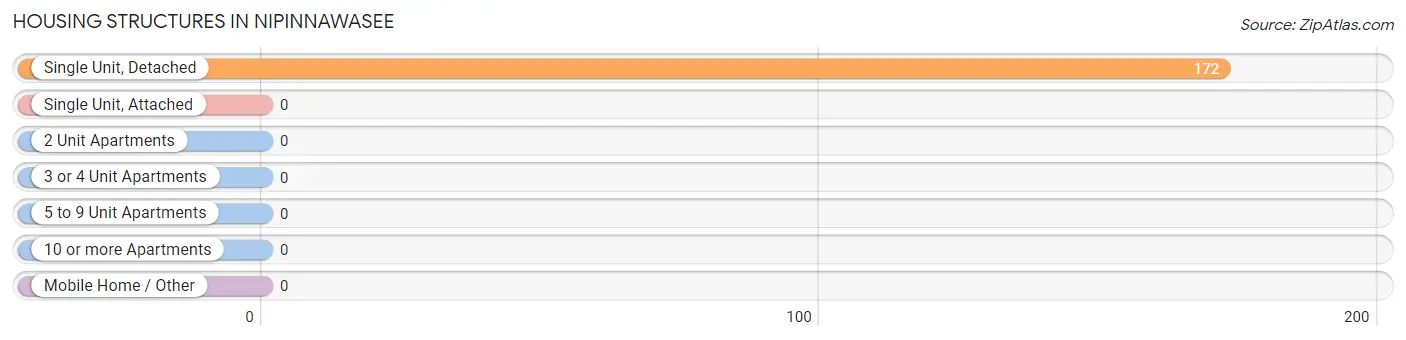
| Structure Type | # Housing Units | % Housing Units |
| Single Unit, Detached | 172 | 100.0% |
| Single Unit, Attached | 0 | 0.0% |
| 2 Unit Apartments | 0 | 0.0% |
| 3 or 4 Unit Apartments | 0 | 0.0% |
| 5 to 9 Unit Apartments | 0 | 0.0% |
| 10 or more Apartments | 0 | 0.0% |
| Mobile Home / Other | 0 | 0.0% |
| Total | 172 | 100.0% |
Housing Structures by Occupancy in Nipinnawasee
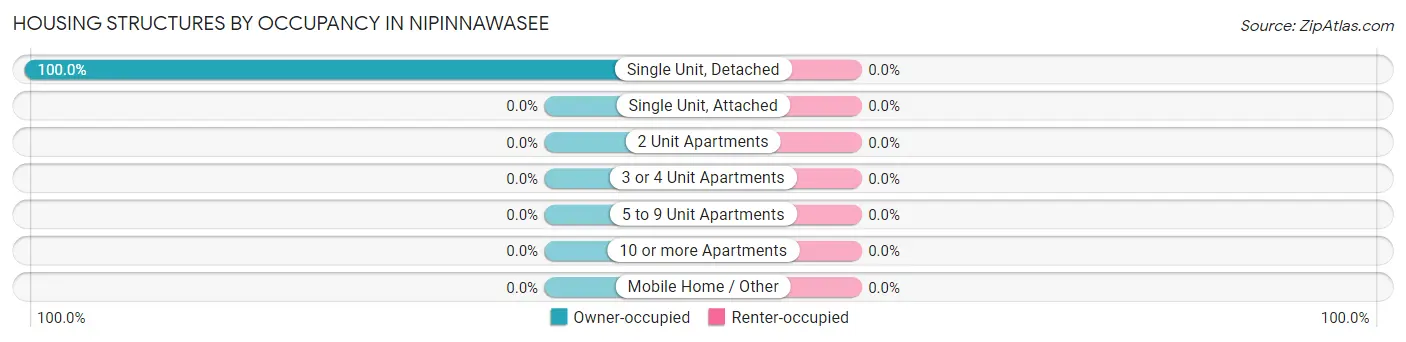
| Structure Type | Owner-occupied | Renter-occupied |
| Single Unit, Detached | 172 (100.0%) | 0 (0.0%) |
| Single Unit, Attached | 0 (0.0%) | 0 (0.0%) |
| 2 Unit Apartments | 0 (0.0%) | 0 (0.0%) |
| 3 or 4 Unit Apartments | 0 (0.0%) | 0 (0.0%) |
| 5 to 9 Unit Apartments | 0 (0.0%) | 0 (0.0%) |
| 10 or more Apartments | 0 (0.0%) | 0 (0.0%) |
| Mobile Home / Other | 0 (0.0%) | 0 (0.0%) |
| Total | 172 (100.0%) | 0 (0.0%) |
Housing Structures by Number of Rooms in Nipinnawasee
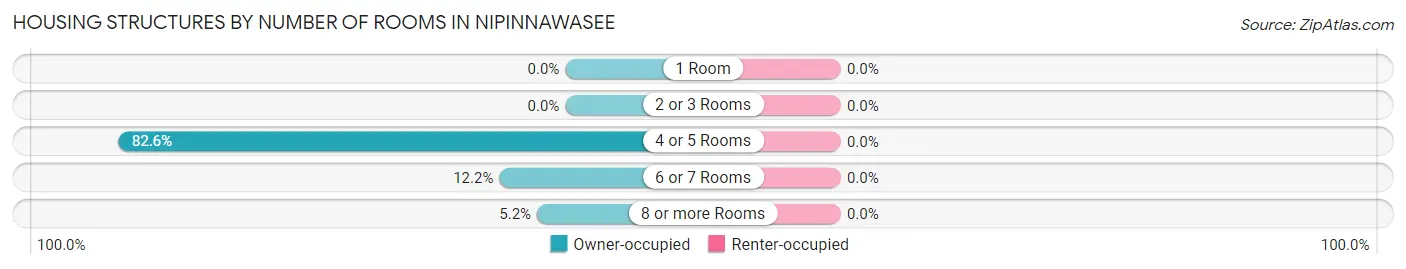
| Number of Rooms | Owner-occupied | Renter-occupied |
| 1 Room | 0 (0.0%) | 0 (0.0%) |
| 2 or 3 Rooms | 0 (0.0%) | 0 (0.0%) |
| 4 or 5 Rooms | 142 (82.6%) | 0 (0.0%) |
| 6 or 7 Rooms | 21 (12.2%) | 0 (0.0%) |
| 8 or more Rooms | 9 (5.2%) | 0 (0.0%) |
| Total | 172 (100.0%) | 0 (0.0%) |
Housing Structure by Heating Type in Nipinnawasee
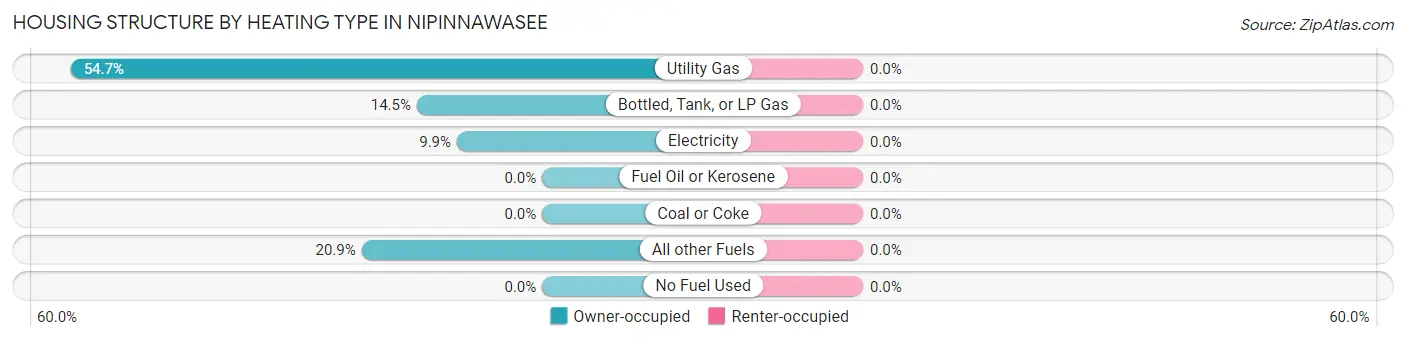
| Heating Type | Owner-occupied | Renter-occupied |
| Utility Gas | 94 (54.6%) | 0 (0.0%) |
| Bottled, Tank, or LP Gas | 25 (14.5%) | 0 (0.0%) |
| Electricity | 17 (9.9%) | 0 (0.0%) |
| Fuel Oil or Kerosene | 0 (0.0%) | 0 (0.0%) |
| Coal or Coke | 0 (0.0%) | 0 (0.0%) |
| All other Fuels | 36 (20.9%) | 0 (0.0%) |
| No Fuel Used | 0 (0.0%) | 0 (0.0%) |
| Total | 172 (100.0%) | 0 (0.0%) |
Household Vehicle Usage in Nipinnawasee
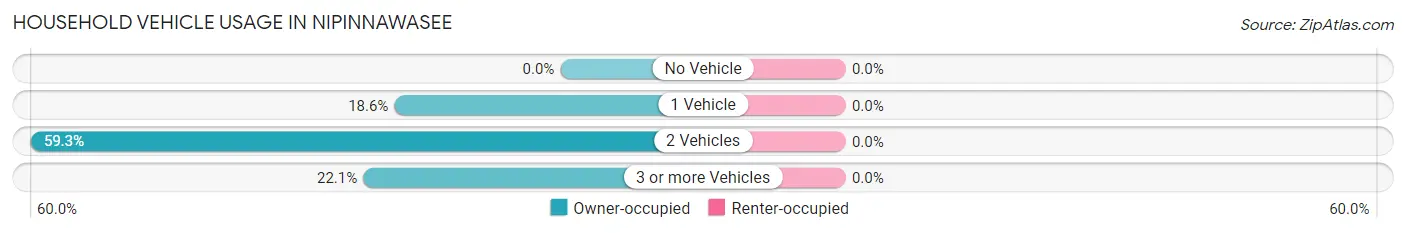
| Vehicles per Household | Owner-occupied | Renter-occupied |
| No Vehicle | 0 (0.0%) | 0 (0.0%) |
| 1 Vehicle | 32 (18.6%) | 0 (0.0%) |
| 2 Vehicles | 102 (59.3%) | 0 (0.0%) |
| 3 or more Vehicles | 38 (22.1%) | 0 (0.0%) |
| Total | 172 (100.0%) | 0 (0.0%) |
Real Estate & Mortgages in Nipinnawasee
Real Estate and Mortgage Overview in Nipinnawasee
| Characteristic | Without Mortgage | With Mortgage |
| Housing Units | 58 | 114 |
| Median Property Value | - | - |
| Median Household Income | $80,625 | $17 |
| Monthly Housing Costs | $550 | $0 |
| Real Estate Taxes | $1,583 | $0 |
Property Value by Mortgage Status in Nipinnawasee
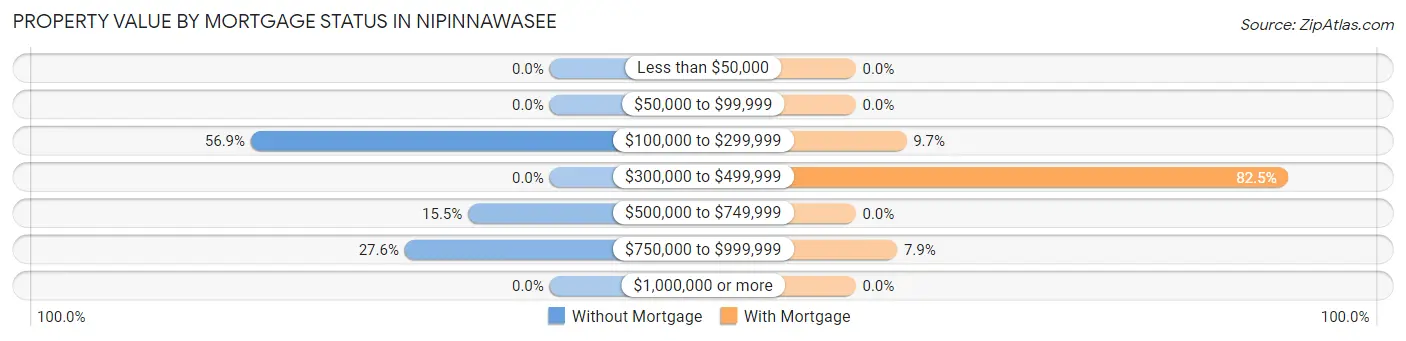
| Property Value | Without Mortgage | With Mortgage |
| Less than $50,000 | 0 (0.0%) | 0 (0.0%) |
| $50,000 to $99,999 | 0 (0.0%) | 0 (0.0%) |
| $100,000 to $299,999 | 33 (56.9%) | 11 (9.7%) |
| $300,000 to $499,999 | 0 (0.0%) | 94 (82.5%) |
| $500,000 to $749,999 | 9 (15.5%) | 0 (0.0%) |
| $750,000 to $999,999 | 16 (27.6%) | 9 (7.9%) |
| $1,000,000 or more | 0 (0.0%) | 0 (0.0%) |
| Total | 58 (100.0%) | 114 (100.0%) |
Household Income by Mortgage Status in Nipinnawasee
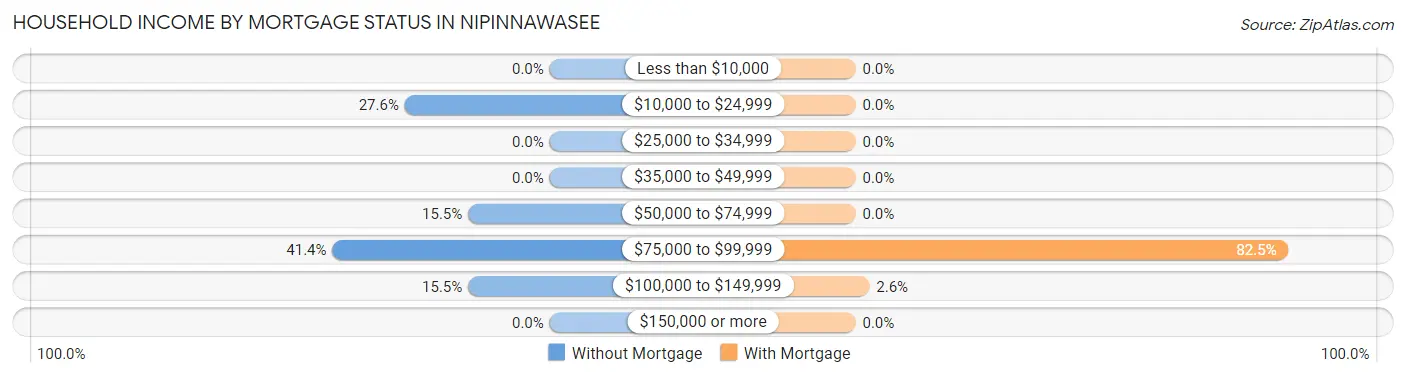
| Household Income | Without Mortgage | With Mortgage |
| Less than $10,000 | 0 (0.0%) | 0 (0.0%) |
| $10,000 to $24,999 | 16 (27.6%) | 0 (0.0%) |
| $25,000 to $34,999 | 0 (0.0%) | 0 (0.0%) |
| $35,000 to $49,999 | 0 (0.0%) | 0 (0.0%) |
| $50,000 to $74,999 | 9 (15.5%) | 0 (0.0%) |
| $75,000 to $99,999 | 24 (41.4%) | 94 (82.5%) |
| $100,000 to $149,999 | 9 (15.5%) | 3 (2.6%) |
| $150,000 or more | 0 (0.0%) | 0 (0.0%) |
| Total | 58 (100.0%) | 114 (100.0%) |
Property Value to Household Income Ratio in Nipinnawasee
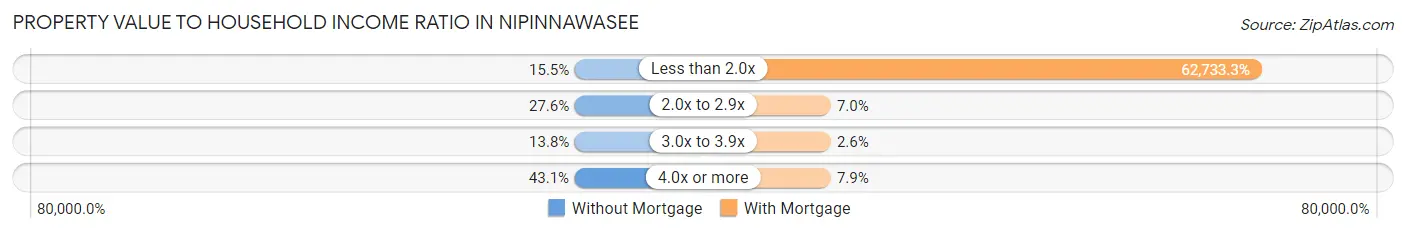
| Value-to-Income Ratio | Without Mortgage | With Mortgage |
| Less than 2.0x | 9 (15.5%) | 71,516 (62,733.3%) |
| 2.0x to 2.9x | 16 (27.6%) | 8 (7.0%) |
| 3.0x to 3.9x | 8 (13.8%) | 3 (2.6%) |
| 4.0x or more | 25 (43.1%) | 9 (7.9%) |
| Total | 58 (100.0%) | 114 (100.0%) |
Real Estate Taxes by Mortgage Status in Nipinnawasee
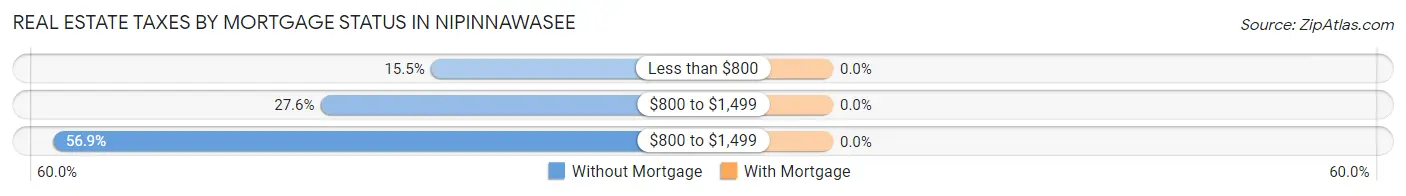
| Property Taxes | Without Mortgage | With Mortgage |
| Less than $800 | 9 (15.5%) | 0 (0.0%) |
| $800 to $1,499 | 16 (27.6%) | 0 (0.0%) |
| $800 to $1,499 | 33 (56.9%) | 0 (0.0%) |
| Total | 58 (100.0%) | 114 (100.0%) |
Health & Disability in Nipinnawasee
Health Insurance Coverage by Age in Nipinnawasee
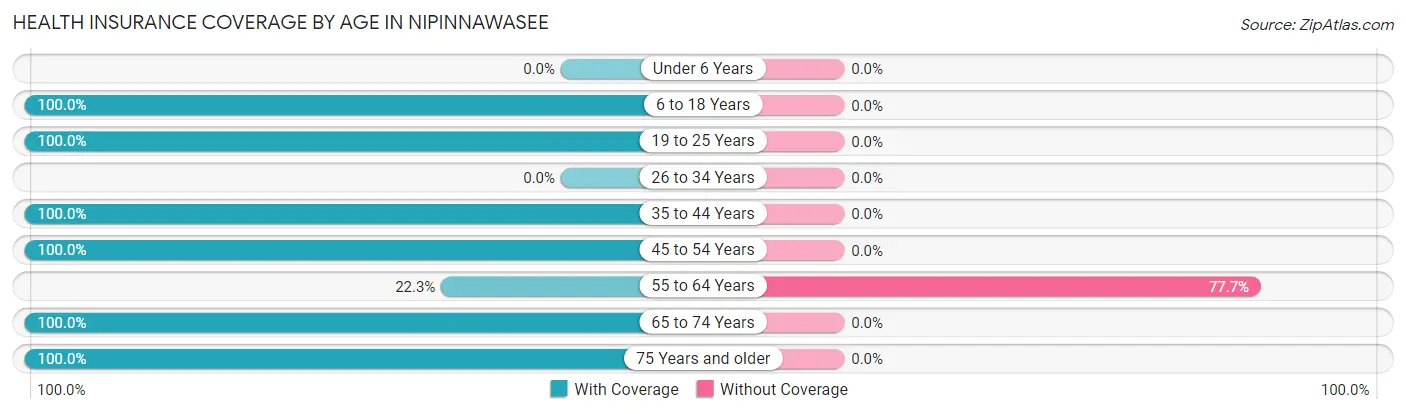
| Age Bracket | With Coverage | Without Coverage |
| Under 6 Years | 0 (0.0%) | 0 (0.0%) |
| 6 to 18 Years | 25 (100.0%) | 0 (0.0%) |
| 19 to 25 Years | 76 (100.0%) | 0 (0.0%) |
| 26 to 34 Years | 0 (0.0%) | 0 (0.0%) |
| 35 to 44 Years | 22 (100.0%) | 0 (0.0%) |
| 45 to 54 Years | 15 (100.0%) | 0 (0.0%) |
| 55 to 64 Years | 27 (22.3%) | 94 (77.7%) |
| 65 to 74 Years | 30 (100.0%) | 0 (0.0%) |
| 75 Years and older | 52 (100.0%) | 0 (0.0%) |
| Total | 247 (72.4%) | 94 (27.6%) |
Health Insurance Coverage by Citizenship Status in Nipinnawasee
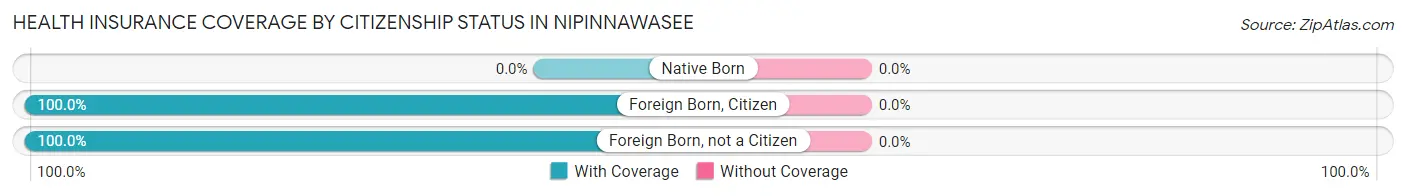
| Citizenship Status | With Coverage | Without Coverage |
| Native Born | 0 (0.0%) | 0 (0.0%) |
| Foreign Born, Citizen | 25 (100.0%) | 0 (0.0%) |
| Foreign Born, not a Citizen | 76 (100.0%) | 0 (0.0%) |
Health Insurance Coverage by Household Income in Nipinnawasee
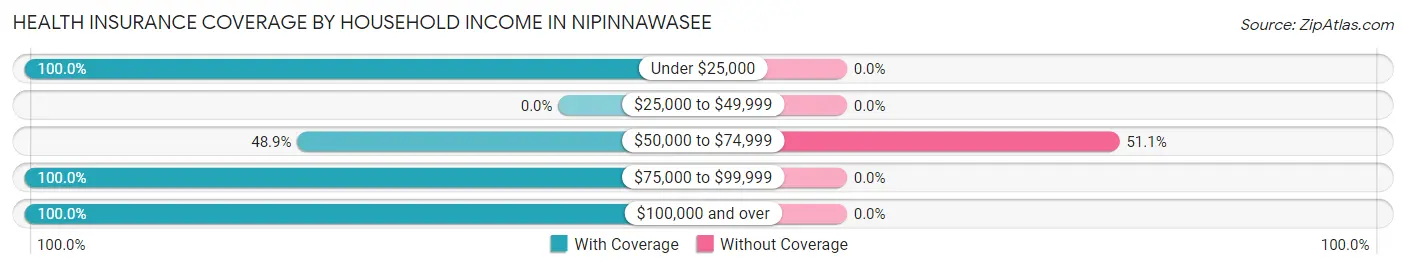
| Household Income | With Coverage | Without Coverage |
| Under $25,000 | 16 (100.0%) | 0 (0.0%) |
| $25,000 to $49,999 | 0 (0.0%) | 0 (0.0%) |
| $50,000 to $74,999 | 90 (48.9%) | 94 (51.1%) |
| $75,000 to $99,999 | 70 (100.0%) | 0 (0.0%) |
| $100,000 and over | 71 (100.0%) | 0 (0.0%) |
Public vs Private Health Insurance Coverage by Age in Nipinnawasee

| Age Bracket | Public Insurance | Private Insurance |
| Under 6 | 0 (0.0%) | 0 (0.0%) |
| 6 to 18 Years | 7 (28.0%) | 18 (72.0%) |
| 19 to 25 Years | 5 (6.6%) | 76 (100.0%) |
| 25 to 34 Years | 0 (0.0%) | 0 (0.0%) |
| 35 to 44 Years | 3 (13.6%) | 19 (86.4%) |
| 45 to 54 Years | 0 (0.0%) | 15 (100.0%) |
| 55 to 64 Years | 0 (0.0%) | 27 (22.3%) |
| 65 to 74 Years | 30 (100.0%) | 0 (0.0%) |
| 75 Years and over | 52 (100.0%) | 36 (69.2%) |
| Total | 97 (28.4%) | 191 (56.0%) |
Disability Status by Sex by Age in Nipinnawasee
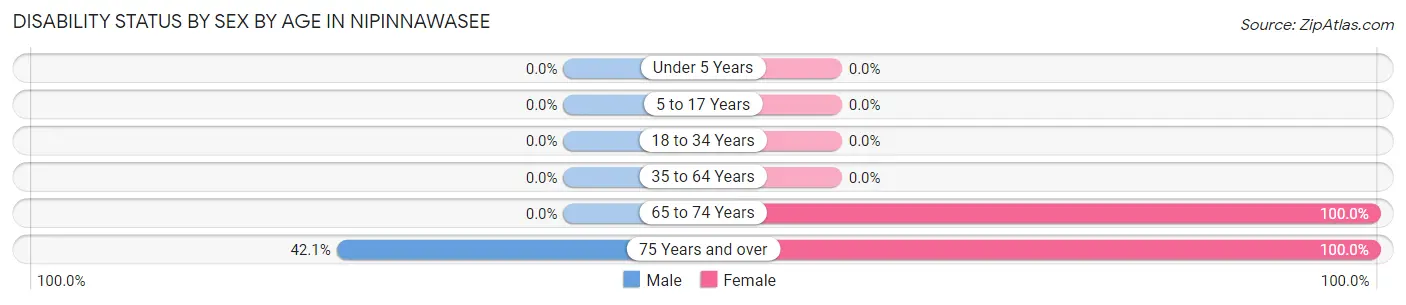
| Age Bracket | Male | Female |
| Under 5 Years | 0 (0.0%) | 0 (0.0%) |
| 5 to 17 Years | 0 (0.0%) | 0 (0.0%) |
| 18 to 34 Years | 0 (0.0%) | 0 (0.0%) |
| 35 to 64 Years | 0 (0.0%) | 0 (0.0%) |
| 65 to 74 Years | 0 (0.0%) | 14 (100.0%) |
| 75 Years and over | 8 (42.1%) | 33 (100.0%) |
Disability Class by Sex by Age in Nipinnawasee
Disability Class: Hearing Difficulty
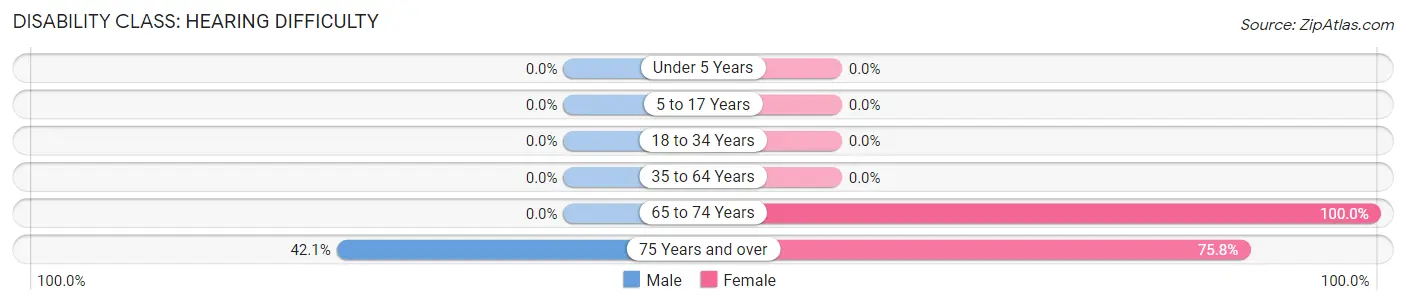
| Age Bracket | Male | Female |
| Under 5 Years | 0 (0.0%) | 0 (0.0%) |
| 5 to 17 Years | 0 (0.0%) | 0 (0.0%) |
| 18 to 34 Years | 0 (0.0%) | 0 (0.0%) |
| 35 to 64 Years | 0 (0.0%) | 0 (0.0%) |
| 65 to 74 Years | 0 (0.0%) | 14 (100.0%) |
| 75 Years and over | 8 (42.1%) | 25 (75.8%) |
Disability Class: Vision Difficulty
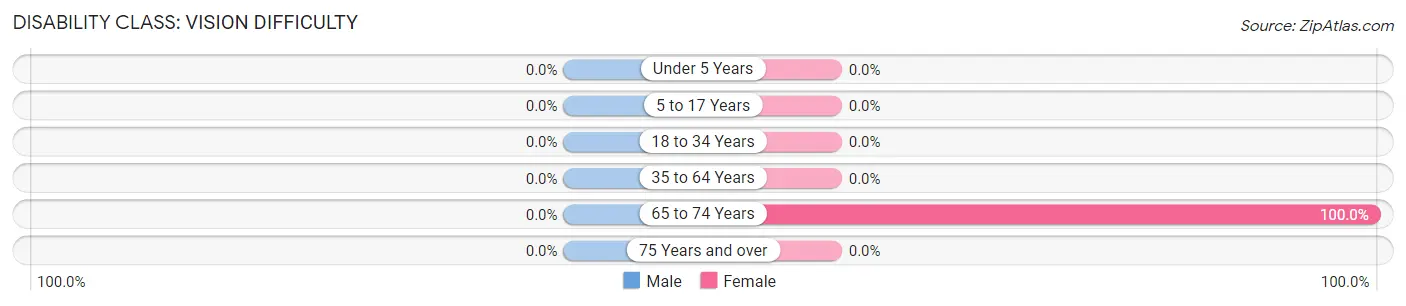
| Age Bracket | Male | Female |
| Under 5 Years | 0 (0.0%) | 0 (0.0%) |
| 5 to 17 Years | 0 (0.0%) | 0 (0.0%) |
| 18 to 34 Years | 0 (0.0%) | 0 (0.0%) |
| 35 to 64 Years | 0 (0.0%) | 0 (0.0%) |
| 65 to 74 Years | 0 (0.0%) | 14 (100.0%) |
| 75 Years and over | 0 (0.0%) | 0 (0.0%) |
Disability Class: Cognitive Difficulty
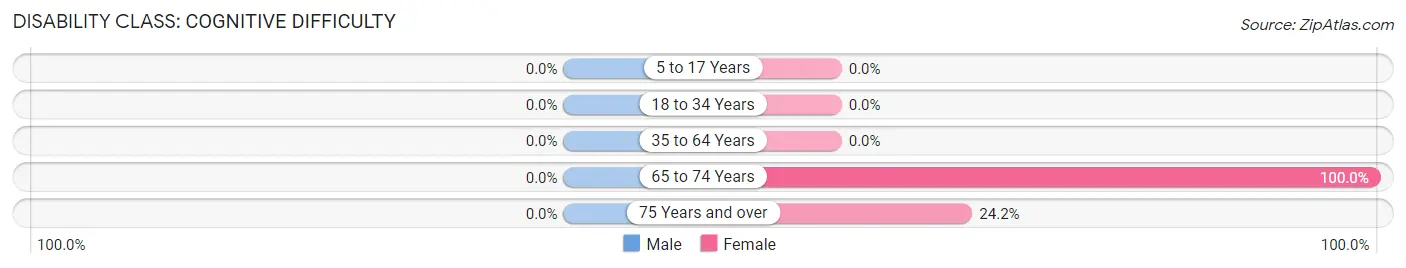
| Age Bracket | Male | Female |
| 5 to 17 Years | 0 (0.0%) | 0 (0.0%) |
| 18 to 34 Years | 0 (0.0%) | 0 (0.0%) |
| 35 to 64 Years | 0 (0.0%) | 0 (0.0%) |
| 65 to 74 Years | 0 (0.0%) | 14 (100.0%) |
| 75 Years and over | 0 (0.0%) | 8 (24.2%) |
Disability Class: Ambulatory Difficulty
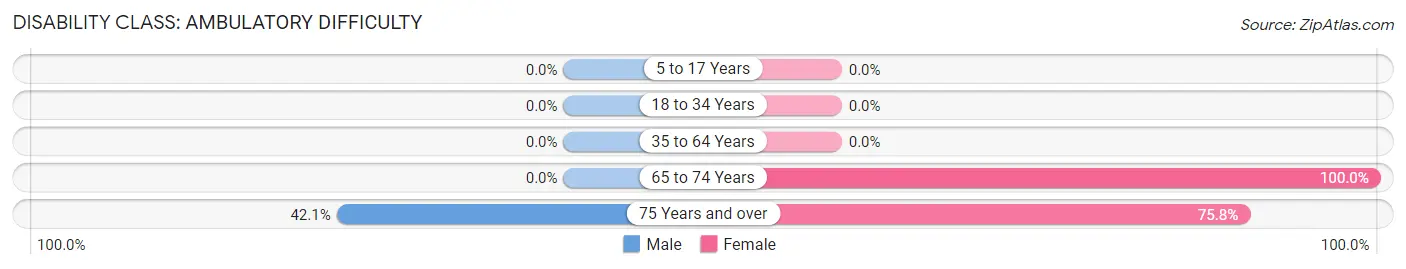
| Age Bracket | Male | Female |
| 5 to 17 Years | 0 (0.0%) | 0 (0.0%) |
| 18 to 34 Years | 0 (0.0%) | 0 (0.0%) |
| 35 to 64 Years | 0 (0.0%) | 0 (0.0%) |
| 65 to 74 Years | 0 (0.0%) | 14 (100.0%) |
| 75 Years and over | 8 (42.1%) | 25 (75.8%) |
Disability Class: Self-Care Difficulty
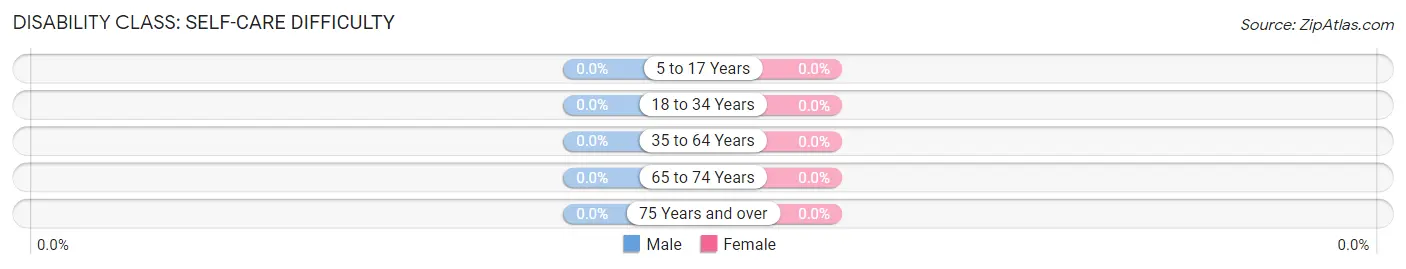
| Age Bracket | Male | Female |
| 5 to 17 Years | 0 (0.0%) | 0 (0.0%) |
| 18 to 34 Years | 0 (0.0%) | 0 (0.0%) |
| 35 to 64 Years | 0 (0.0%) | 0 (0.0%) |
| 65 to 74 Years | 0 (0.0%) | 0 (0.0%) |
| 75 Years and over | 0 (0.0%) | 0 (0.0%) |
Technology Access in Nipinnawasee
Computing Device Access in Nipinnawasee
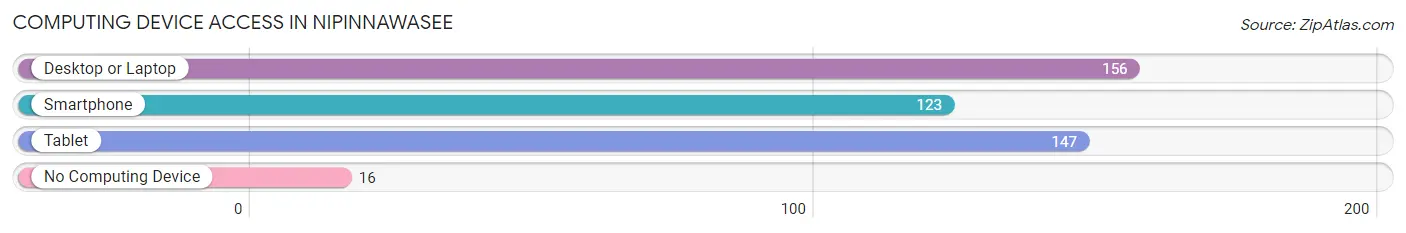
| Device Type | # Households | % Households |
| Desktop or Laptop | 156 | 90.7% |
| Smartphone | 123 | 71.5% |
| Tablet | 147 | 85.5% |
| No Computing Device | 16 | 9.3% |
| Total | 172 | 100.0% |
Internet Access in Nipinnawasee
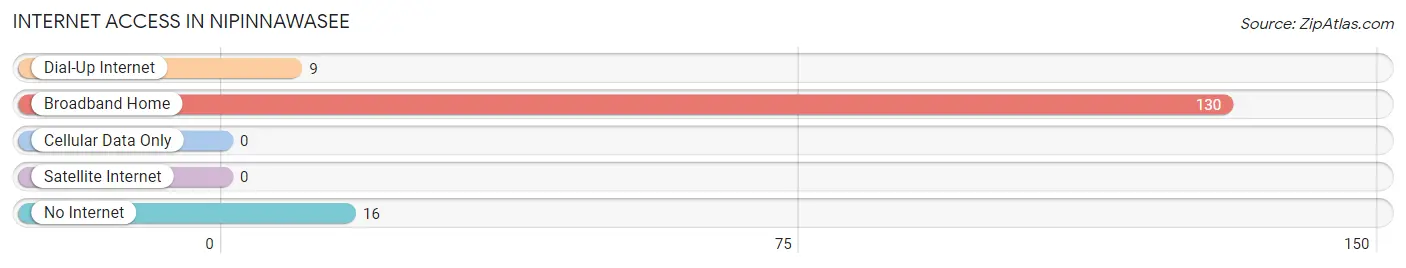
| Internet Type | # Households | % Households |
| Dial-Up Internet | 9 | 5.2% |
| Broadband Home | 130 | 75.6% |
| Cellular Data Only | 0 | 0.0% |
| Satellite Internet | 0 | 0.0% |
| No Internet | 16 | 9.3% |
| Total | 172 | 100.0% |
Nipinnawasee Summary
Nipinnawasee is a small unincorporated community located in the foothills of the Sierra Nevada Mountains in California. It is situated in the Sierra National Forest, approximately 25 miles east of Fresno. The community is home to a population of approximately 500 people, and is known for its rural lifestyle and scenic beauty.
History
The area that is now Nipinnawasee was first settled by Native Americans, who lived in the area for thousands of years before the arrival of Europeans. The first Europeans to settle in the area were miners, who arrived in the late 19th century in search of gold. The town was officially founded in 1891, and was named after the Nipinnawasee River, which runs through the area.
In the early 20th century, the town was a popular destination for tourists, who came to enjoy the area’s natural beauty and outdoor activities. The town was also home to a number of businesses, including a general store, a post office, and a hotel.
Geography
Nipinnawasee is located in the foothills of the Sierra Nevada Mountains, approximately 25 miles east of Fresno. The town is situated in the Sierra National Forest, and is surrounded by mountains, forests, and meadows. The town is located at an elevation of approximately 4,000 feet, and has a mild climate with warm summers and cool winters.
The town is located near a number of popular outdoor recreation areas, including the Sierra National Forest, Kings Canyon National Park, and Sequoia National Park. The area is also home to a number of lakes, rivers, and streams, which provide opportunities for fishing, swimming, and boating.
Economy
The economy of Nipinnawasee is largely based on tourism and outdoor recreation. The town is home to a number of businesses, including restaurants, hotels, and stores. The town is also home to a number of outdoor recreation companies, which offer guided tours and activities in the area.
The town is also home to a number of small farms, which produce a variety of fruits and vegetables. The area is also home to a number of wineries, which produce a variety of wines.
Demographics
As of the 2010 census, the population of Nipinnawasee was approximately 500 people. The town is predominantly white, with approximately 90% of the population identifying as Caucasian. The town is also home to a small Hispanic population, with approximately 5% of the population identifying as Hispanic or Latino.
The median household income in Nipinnawasee is approximately $50,000, and the median home value is approximately $200,000. The town is home to a number of small businesses, and the unemployment rate is approximately 5%.
Conclusion
Nipinnawasee is a small unincorporated community located in the foothills of the Sierra Nevada Mountains in California. The town is home to a population of approximately 500 people, and is known for its rural lifestyle and scenic beauty. The economy of Nipinnawasee is largely based on tourism and outdoor recreation, and the town is home to a number of businesses, farms, and wineries. The town is predominantly white, with approximately 90% of the population identifying as Caucasian. The median household income in Nipinnawasee is approximately $50,000, and the median home value is approximately $200,000.
Common Questions
What is Per Capita Income in Nipinnawasee?
Per Capita income in Nipinnawasee is $41,150.
What is the Median Family Income in Nipinnawasee?
Median Family Income in Nipinnawasee is $71,835.
What is the Median Household income in Nipinnawasee?
Median Household Income in Nipinnawasee is $71,622.
What is Inequality or Gini Index in Nipinnawasee?
Inequality or Gini Index in Nipinnawasee is 0.23.
What is the Total Population of Nipinnawasee?
Total Population of Nipinnawasee is 341.
What is the Total Male Population of Nipinnawasee?
Total Male Population of Nipinnawasee is 233.
What is the Total Female Population of Nipinnawasee?
Total Female Population of Nipinnawasee is 108.
What is the Ratio of Males per 100 Females in Nipinnawasee?
There are 215.74 Males per 100 Females in Nipinnawasee.
What is the Ratio of Females per 100 Males in Nipinnawasee?
There are 46.35 Females per 100 Males in Nipinnawasee.
What is the Median Population Age in Nipinnawasee?
Median Population Age in Nipinnawasee is 56.3 Years.
What is the Average Family Size in Nipinnawasee
Average Family Size in Nipinnawasee is 2.1 People.
What is the Average Household Size in Nipinnawasee
Average Household Size in Nipinnawasee is 2.0 People.
How Large is the Labor Force in Nipinnawasee?
There are 145 People in the Labor Forcein in Nipinnawasee.
What is the Percentage of People in the Labor Force in Nipinnawasee?
44.9% of People are in the Labor Force in Nipinnawasee.