Zip Codes with the Highest Percentage of Population Employed in Community & Social Service in Bakersfield, CA

RELATED REPORTS & OPTIONS

Community & Social Service
Population
Families and Households
Female Fertility
Female Fertility (Unmarried)
Race (Community Size)
Race (Percentage)
Ancestry (Community Size)
AfghanAfricanAlaska NativeAmericanApacheArabArgentineanArmenianAustralianAustrianBangladeshiBasqueBelgianBelizeanBhutaneseBlackfeetBolivianBrazilianBritishBulgarianBurmeseCanadianCentral AmericanCentral American IndianCherokeeCheyenneChickasawChippewaChoctawColombianComancheCosta RicanCreeCreekCroatianCubanCzechCzechoslovakianDanishDominicanDutchDutch West IndianEastern EuropeanEcuadorianEgyptianEnglishEthiopianEuropeanFilipinoFinnishFrenchFrench American IndianFrench CanadianGermanGhanaianGreekGuamanian / ChamorroGuatemalanHaitianHonduranHopiHungarianIndian (Asian)IndonesianIranianIrishIroquoisItalianJamaicanJapaneseJordanianKiowaKoreanLaotianLatvianLebaneseLithuanianLumbeeLuxembourgerMalaysianMexicanMexican American IndianMongolianMoroccanNative HawaiianNavajoNicaraguanNigerianNorthern EuropeanNorwegianPaiutePakistaniPalestinianPanamanianPeruvianPolishPortuguesePotawatomiPuebloPuerto RicanRomanianRussianSalvadoranSamoanScandinavianScotch-IrishScottishSeminoleSerbianSiouxSlavicSlovakSouth AfricanSouth AmericanSouth American IndianSpaniardSpanishSpanish AmericanSri LankanSubsaharan AfricanSwedishSwissSyrianThaiTonganTurkishUkrainianVenezuelanVietnameseWelshWest IndianYaquiYugoslavian
Ancestry (Percentage)
AfghanAfricanAlaska NativeAmericanApacheArabArgentineanArmenianAustralianAustrianBangladeshiBasqueBelgianBelizeanBhutaneseBlackfeetBolivianBrazilianBritishBulgarianBurmeseCanadianCentral AmericanCentral American IndianCherokeeCheyenneChickasawChippewaChoctawColombianComancheCosta RicanCreeCreekCroatianCubanCzechCzechoslovakianDanishDominicanDutchDutch West IndianEastern EuropeanEcuadorianEgyptianEnglishEthiopianEuropeanFilipinoFinnishFrenchFrench American IndianFrench CanadianGermanGhanaianGreekGuamanian / ChamorroGuatemalanHaitianHonduranHopiHungarianIndian (Asian)IndonesianIranianIrishIroquoisItalianJamaicanJapaneseJordanianKiowaKoreanLaotianLatvianLebaneseLithuanianLumbeeLuxembourgerMalaysianMexicanMexican American IndianMongolianMoroccanNative HawaiianNavajoNicaraguanNigerianNorthern EuropeanNorwegianPaiutePakistaniPalestinianPanamanianPeruvianPolishPortuguesePotawatomiPuebloPuerto RicanRomanianRussianSalvadoranSamoanScandinavianScotch-IrishScottishSeminoleSerbianSiouxSlavicSlovakSouth AfricanSouth AmericanSouth American IndianSpaniardSpanishSpanish AmericanSri LankanSubsaharan AfricanSwedishSwissSyrianThaiTonganTurkishUkrainianVenezuelanVietnameseWelshWest IndianYaquiYugoslavian
Immigrant Origin (Total)
Immigrant Origin (Percentage)
Income
Income (Families)
Income (Households)
Poverty
Poverty (Families)
Unemployment
Employment Occupations
Employment Industries
Employer Class
Commute Time
Commute Means
School Enrollment
Education by Degree Field
Occupancy
Finances
Physical Characteristics
Bakersfield
States
California Cities
AlamedaAlhambraAnaheimAntiochApple ValleyArcadiaAuburnBakersfieldBerkeleyBeverly HillsBreaBuena ParkBurbankCamarilloCanoga ParkCanyon CountryCarlsbadCarsonCastro ValleyChicoChinoChula VistaCitrus HeightsClovisComptonConcordCoronaCosta MesaCovinaCulver CityDaly CityDanvilleDavisDesert Hot SpringsDowneyDuarteEl CajonEl MonteElk GroveEncinoEscondidoEurekaFairfieldFontanaFremontFresnoFullertonGarden GroveGardenaGlendaleGlendoraGrass ValleyHaywardHemetHesperiaHuntington BeachIndioInglewoodIrvineLa JollaLa MesaLa MiradaLa PuenteLake ElsinoreLakewoodLancasterLivermoreLodiLoma LindaLompocLong BeachLos AltosLos AngelesLos GatosMaderaMalibuMantecaMenifeeMercedMission ViejoModestoMonterey ParkMoragaMoreno ValleyMountain ViewMurrietaNapaNewport BeachNorth HollywoodNorthridgeNovatoOaklandOceansideOntarioOrangeOrovilleOxnardPalm DesertPalm SpringsPalmdalePalo AltoPasadenaPerrisPetalumaPleasantonPomonaRancho CordovaRancho CucamongaRancho Santa FeReddingRedlandsRedondo BeachRedwood CityRialtoRichmondRiversideRocklinRosevilleSacramentoSalinasSan BernardinoSan ClementeSan DiegoSan FranciscoSan GabrielSan JacintoSan JoseSan LeandroSan Luis ObispoSan MarcosSan MateoSan PedroSan RafaelSan RamonSanta AnaSanta BarbaraSanta ClaraSanta ClaritaSanta CruzSanta MariaSanta MonicaSanta RosaSherman OaksSimi ValleySpring ValleyStocktonSunnyvaleTemeculaThousand OaksTorranceTrabuco CanyonTracyTurlockTustinUplandVacavilleValenciaVallejoVan NuysVenturaVictorvilleVisaliaVistaWalnut CreekWest CovinaWest SacramentoWhittierWoodlandWoodland HillsYorba LindaYuba City
Compare Zip Codes
Comparison Subject

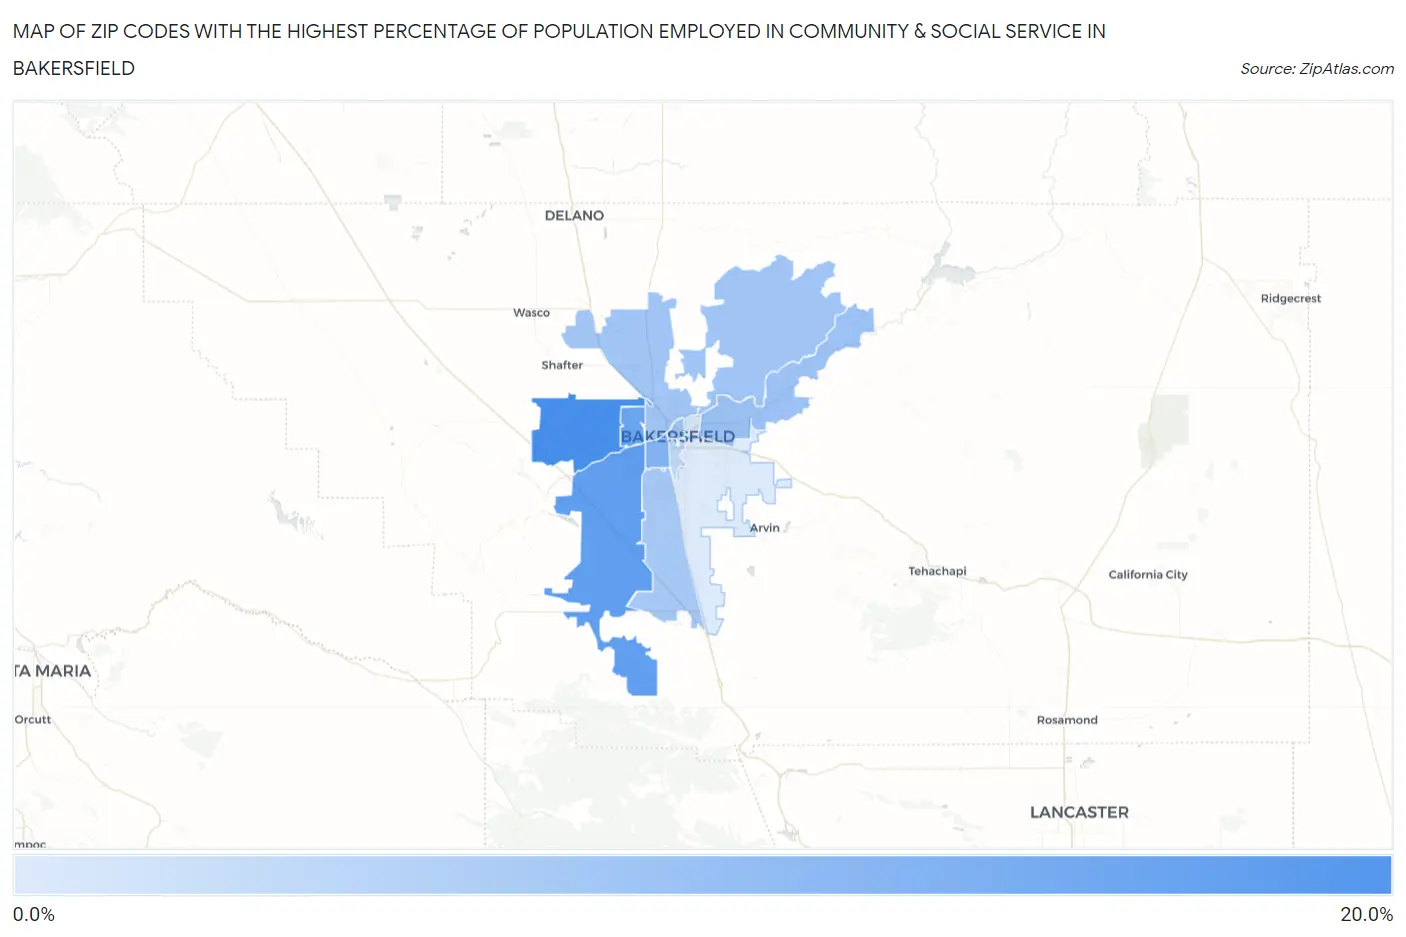
Map of Zip Codes with the Highest Percentage of Population Employed in Community & Social Service in Bakersfield

0.0%
20.0%
Zip Codes with the Highest Percentage of Population Employed in Community & Social Service  in Bakersfield Map

Zip Codes with the Highest Percentage of Population Employed in Community & Social Service in Bakersfield, CA

Zip Code % Employed vs State vs National
1.9331416.7%11.5%(+5.24)#26811.2%(+5.51)#3,553
2.9331114.6%11.5%(+3.07)#41211.2%(+3.35)#5,414
3.9331213.7%11.5%(+2.19)#47811.2%(+2.46)#6,507
4.9330911.6%11.5%(+0.163)#70511.2%(+0.433)#10,121
5.933069.9%11.5%(-1.61)#94111.2%(-1.34)#14,481
6.933019.5%11.5%(-2.01)#98211.2%(-1.74)#15,475
7.933089.5%11.5%(-2.02)#98611.2%(-1.75)#15,513
8.933139.1%11.5%(-2.43)#1,03311.2%(-2.16)#16,670
9.933047.0%11.5%(-4.51)#1,29411.2%(-4.24)#22,215
10.933055.3%11.5%(-6.19)#1,45611.2%(-5.92)#25,717
11.933074.7%11.5%(-6.74)#1,48411.2%(-6.47)#26,589

Common Questions

What are the Top 10 Zip Codes with the Highest Percentage of Population Employed in Community & Social Service in Bakersfield, CA?
Top 10 Zip Codes with the Highest Percentage of Population Employed in Community & Social Service in Bakersfield, CA are:
#1
16.7%
#2
14.6%
#3
13.7%
#4
11.6%
#5
9.9%
#6
9.5%
#7
9.5%
#8
9.1%
#9
7.0%
#10
5.3%
What zip code has the Highest Percentage of Population Employed in Community & Social Service in Bakersfield, CA?
93314 has the Highest Percentage of Population Employed in Community & Social Service in Bakersfield, CA with 16.7%.
What is the Percentage of Population Employed in Community & Social Service in Bakersfield, CA?
Percentage of Population Employed in Community & Social Service in Bakersfield is 10.6%.
What is the Percentage of Population Employed in Community & Social Service in California?
Percentage of Population Employed in Community & Social Service in California is 11.5%.
What is the Percentage of Population Employed in Community & Social Service in the United States?
Percentage of Population Employed in Community & Social Service in the United States is 11.2%.