Cities with the Highest Percentage of Population Employed in Community & Social Service in Connecticut
RELATED REPORTS & OPTIONS
Community & Social Service
Connecticut
Compare Cities
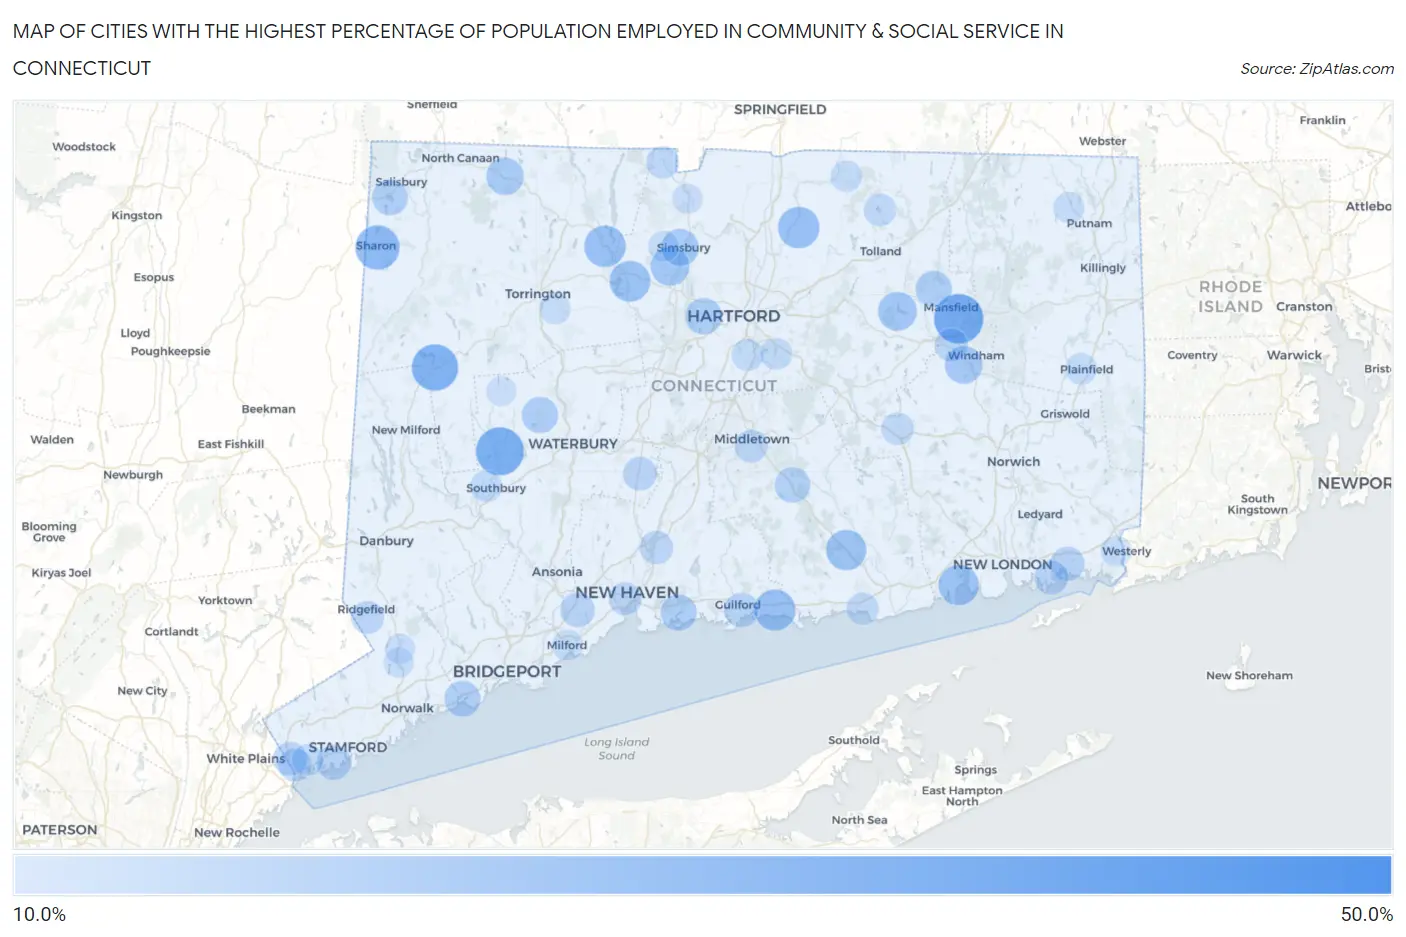
Map of Cities with the Highest Percentage of Population Employed in Community & Social Service in Connecticut
0.0%
50.0%
Cities with the Highest Percentage of Population Employed in Community & Social Service in Connecticut
| City | % Employed | vs State | vs National | |
| 1. | Cornwall | 48.6% | 13.0%(+35.6)#1 | 11.2%(+37.4)#216 |
| 2. | Mamanasco Lake | 41.3% | 13.0%(+28.3)#2 | 11.2%(+30.1)#335 |
| 3. | Mansfield Center | 36.8% | 13.0%(+23.8)#3 | 11.2%(+25.6)#444 |
| 4. | Lakes East | 36.4% | 13.0%(+23.4)#4 | 11.2%(+25.2)#450 |
| 5. | Woodbury Center | 34.8% | 13.0%(+21.8)#5 | 11.2%(+23.6)#503 |
| 6. | New Preston | 32.9% | 13.0%(+19.8)#6 | 11.2%(+21.6)#597 |
| 7. | Sharon | 30.2% | 13.0%(+17.1)#7 | 11.2%(+18.9)#743 |
| 8. | Lake Chaffee | 29.1% | 13.0%(+16.1)#8 | 11.2%(+17.9)#819 |
| 9. | Poplar Plains | 27.3% | 13.0%(+14.3)#9 | 11.2%(+16.1)#972 |
| 10. | Old Hill | 27.0% | 13.0%(+14.0)#10 | 11.2%(+15.8)#1,009 |
| 11. | Broad Brook | 26.9% | 13.0%(+13.9)#11 | 11.2%(+15.7)#1,018 |
| 12. | New Hartford Center | 26.8% | 13.0%(+13.8)#12 | 11.2%(+15.6)#1,029 |
| 13. | Madison Center | 26.3% | 13.0%(+13.3)#13 | 11.2%(+15.1)#1,069 |
| 14. | Collinsville | 25.9% | 13.0%(+12.9)#14 | 11.2%(+14.7)#1,105 |
| 15. | Route 7 Gateway | 25.9% | 13.0%(+12.9)#15 | 11.2%(+14.7)#1,110 |
| 16. | Niantic | 25.5% | 13.0%(+12.5)#16 | 11.2%(+14.3)#1,148 |
| 17. | Deep River Center | 25.3% | 13.0%(+12.3)#17 | 11.2%(+14.1)#1,169 |
| 18. | West Cornwall | 25.0% | 13.0%(+12.0)#18 | 11.2%(+13.8)#1,229 |
| 19. | Coventry Lake | 23.8% | 13.0%(+10.7)#19 | 11.2%(+12.5)#1,447 |
| 20. | Weatogue | 23.5% | 13.0%(+10.5)#20 | 11.2%(+12.3)#1,491 |
| 21. | Quinnipiac University | 23.1% | 13.0%(+10.1)#21 | 11.2%(+11.9)#1,593 |
| 22. | South Windham | 22.3% | 13.0%(+9.25)#22 | 11.2%(+11.0)#1,762 |
| 23. | Norfolk | 21.9% | 13.0%(+8.93)#23 | 11.2%(+10.7)#1,839 |
| 24. | Simsbury Center | 21.7% | 13.0%(+8.68)#24 | 11.2%(+10.5)#1,895 |
| 25. | Mechanicsville | 21.0% | 13.0%(+7.98)#25 | 11.2%(+9.77)#2,066 |
| 26. | West Hartford | 20.7% | 13.0%(+7.69)#26 | 11.2%(+9.49)#2,143 |
| 27. | Ridgebury | 20.5% | 13.0%(+7.53)#27 | 11.2%(+9.32)#2,193 |
| 28. | Storrs | 20.5% | 13.0%(+7.51)#28 | 11.2%(+9.31)#2,198 |
| 29. | Watertown | 20.5% | 13.0%(+7.46)#29 | 11.2%(+9.26)#2,214 |
| 30. | Branford Center | 20.4% | 13.0%(+7.42)#30 | 11.2%(+9.22)#2,235 |
| 31. | Westport | 20.4% | 13.0%(+7.36)#31 | 11.2%(+9.15)#2,259 |
| 32. | Southport | 20.2% | 13.0%(+7.21)#32 | 11.2%(+9.00)#2,316 |
| 33. | Lakeville | 19.9% | 13.0%(+6.91)#33 | 11.2%(+8.71)#2,441 |
| 34. | Staples | 19.8% | 13.0%(+6.80)#34 | 11.2%(+8.60)#2,476 |
| 35. | Higganum | 19.7% | 13.0%(+6.73)#35 | 11.2%(+8.53)#2,499 |
| 36. | East | 19.6% | 13.0%(+6.60)#36 | 11.2%(+8.39)#2,558 |
| 37. | Bigelow Corners | 19.1% | 13.0%(+6.09)#37 | 11.2%(+7.88)#2,754 |
| 38. | Lakes West | 18.9% | 13.0%(+5.85)#38 | 11.2%(+7.64)#2,862 |
| 39. | Old Greenwich | 18.6% | 13.0%(+5.56)#39 | 11.2%(+7.36)#2,973 |
| 40. | Guilford Center | 18.4% | 13.0%(+5.42)#40 | 11.2%(+7.21)#3,035 |
| 41. | Orange | 18.4% | 13.0%(+5.36)#41 | 11.2%(+7.15)#3,079 |
| 42. | Mystic | 18.2% | 13.0%(+5.17)#42 | 11.2%(+6.96)#3,179 |
| 43. | Woodmont Borough | 18.2% | 13.0%(+5.15)#43 | 11.2%(+6.95)#3,182 |
| 44. | New Canaan | 18.1% | 13.0%(+5.12)#44 | 11.2%(+6.91)#3,195 |
| 45. | Litchfield Borough | 18.1% | 13.0%(+5.08)#45 | 11.2%(+6.87)#3,213 |
| 46. | Tashua | 18.0% | 13.0%(+4.95)#46 | 11.2%(+6.74)#3,272 |
| 47. | Taylor Corners | 17.7% | 13.0%(+4.66)#47 | 11.2%(+6.46)#3,412 |
| 48. | Noank | 17.6% | 13.0%(+4.57)#48 | 11.2%(+6.37)#3,468 |
| 49. | Cheshire Village | 17.6% | 13.0%(+4.55)#49 | 11.2%(+6.34)#3,483 |
| 50. | Mill Plain | 17.5% | 13.0%(+4.50)#50 | 11.2%(+6.30)#3,519 |
| 51. | Glenville | 17.5% | 13.0%(+4.46)#51 | 11.2%(+6.25)#3,549 |
| 52. | North Haven | 17.4% | 13.0%(+4.37)#52 | 11.2%(+6.17)#3,595 |
| 53. | Groton Long Point Borough | 17.2% | 13.0%(+4.18)#53 | 11.2%(+5.97)#3,699 |
| 54. | Dayville | 17.1% | 13.0%(+4.08)#54 | 11.2%(+5.87)#3,769 |
| 55. | Pemberwick | 16.9% | 13.0%(+3.93)#55 | 11.2%(+5.72)#3,839 |
| 56. | Willimantic | 16.9% | 13.0%(+3.88)#56 | 11.2%(+5.68)#3,867 |
| 57. | Pleasant Valley | 16.8% | 13.0%(+3.79)#57 | 11.2%(+5.59)#3,918 |
| 58. | Middletown | 16.6% | 13.0%(+3.57)#58 | 11.2%(+5.36)#4,087 |
| 59. | Stratford Downtown | 16.5% | 13.0%(+3.54)#59 | 11.2%(+5.33)#4,109 |
| 60. | Ridgefield | 16.5% | 13.0%(+3.51)#60 | 11.2%(+5.30)#4,134 |
| 61. | Noroton Heights | 16.4% | 13.0%(+3.43)#61 | 11.2%(+5.22)#4,177 |
| 62. | New Haven | 16.4% | 13.0%(+3.41)#62 | 11.2%(+5.21)#4,185 |
| 63. | North Granby | 16.2% | 13.0%(+3.21)#63 | 11.2%(+5.01)#4,332 |
| 64. | Colchester | 16.2% | 13.0%(+3.19)#64 | 11.2%(+4.99)#4,342 |
| 65. | Crystal Lake | 16.1% | 13.0%(+3.14)#65 | 11.2%(+4.93)#4,371 |
| 66. | Trumbull Center | 16.1% | 13.0%(+3.11)#66 | 11.2%(+4.91)#4,388 |
| 67. | Saybrook Manor | 15.8% | 13.0%(+2.77)#67 | 11.2%(+4.56)#4,657 |
| 68. | Newtown Borough | 15.6% | 13.0%(+2.59)#68 | 11.2%(+4.39)#4,795 |
| 69. | Oronoque | 15.5% | 13.0%(+2.44)#69 | 11.2%(+4.24)#4,918 |
| 70. | Northford | 15.4% | 13.0%(+2.43)#70 | 11.2%(+4.23)#4,926 |
| 71. | Greens Farms | 15.4% | 13.0%(+2.36)#71 | 11.2%(+4.16)#4,994 |
| 72. | Wethersfield | 15.4% | 13.0%(+2.35)#72 | 11.2%(+4.14)#5,007 |
| 73. | Plattsville | 15.3% | 13.0%(+2.29)#73 | 11.2%(+4.09)#5,046 |
| 74. | Tokeneke | 15.3% | 13.0%(+2.29)#74 | 11.2%(+4.08)#5,050 |
| 75. | Heritage Village | 15.3% | 13.0%(+2.27)#75 | 11.2%(+4.07)#5,066 |
| 76. | Coleytown | 15.2% | 13.0%(+2.22)#76 | 11.2%(+4.01)#5,110 |
| 77. | Quasset Lake | 15.2% | 13.0%(+2.16)#77 | 11.2%(+3.96)#5,168 |
| 78. | Glastonbury Center | 15.1% | 13.0%(+2.08)#78 | 11.2%(+3.88)#5,243 |
| 79. | Witches Woods | 15.0% | 13.0%(+1.99)#79 | 11.2%(+3.79)#5,331 |
| 80. | Plainfield Village | 14.9% | 13.0%(+1.91)#80 | 11.2%(+3.70)#5,410 |
| 81. | Lordship | 14.9% | 13.0%(+1.91)#81 | 11.2%(+3.70)#5,411 |
| 82. | Somers | 14.8% | 13.0%(+1.77)#82 | 11.2%(+3.57)#5,546 |
| 83. | Greenwich | 14.8% | 13.0%(+1.77)#83 | 11.2%(+3.56)#5,555 |
| 84. | Sandy Hook | 14.6% | 13.0%(+1.57)#84 | 11.2%(+3.36)#5,772 |
| 85. | Hawleyville | 14.5% | 13.0%(+1.47)#85 | 11.2%(+3.26)#5,867 |
| 86. | Northwest Harwinton | 14.4% | 13.0%(+1.36)#86 | 11.2%(+3.15)#5,985 |
| 87. | South Woodstock | 14.3% | 13.0%(+1.29)#87 | 11.2%(+3.09)#6,037 |
| 88. | Pawcatuck | 14.2% | 13.0%(+1.14)#88 | 11.2%(+2.94)#6,218 |
| 89. | Milford City Balance | 14.1% | 13.0%(+1.11)#89 | 11.2%(+2.90)#6,258 |
| 90. | West Simsbury | 13.9% | 13.0%(+0.912)#90 | 11.2%(+2.71)#6,485 |
| 91. | Naugatuck Borough | 13.8% | 13.0%(+0.746)#91 | 11.2%(+2.54)#6,687 |
| 92. | Ball Pond | 13.8% | 13.0%(+0.746)#92 | 11.2%(+2.54)#6,689 |
| 93. | Salmon Brook | 13.6% | 13.0%(+0.567)#93 | 11.2%(+2.36)#6,906 |
| 94. | Inglenook | 13.6% | 13.0%(+0.557)#94 | 11.2%(+2.35)#6,920 |
| 95. | Darien Downtown | 13.5% | 13.0%(+0.457)#95 | 11.2%(+2.25)#7,035 |
| 96. | Cannondale | 13.4% | 13.0%(+0.360)#96 | 11.2%(+2.15)#7,186 |
| 97. | Wilton Center | 13.3% | 13.0%(+0.340)#97 | 11.2%(+2.13)#7,205 |
| 98. | South Wilton | 13.3% | 13.0%(+0.294)#98 | 11.2%(+2.09)#7,288 |
| 99. | Bethlehem Village | 13.2% | 13.0%(+0.167)#99 | 11.2%(+1.96)#7,455 |
| 100. | Lake Bungee | 13.0% | 13.0%(-0.040)#100 | 11.2%(+1.75)#7,750 |
Common Questions
What are the Top 10 Cities with the Highest Percentage of Population Employed in Community & Social Service in Connecticut?
Top 10 Cities with the Highest Percentage of Population Employed in Community & Social Service in Connecticut are:
#1
36.8%
#2
34.8%
#3
32.9%
#4
30.2%
#5
26.9%
#6
26.8%
#7
26.3%
#8
25.9%
#9
25.5%
#10
25.3%
What city has the Highest Percentage of Population Employed in Community & Social Service in Connecticut?
Mansfield Center has the Highest Percentage of Population Employed in Community & Social Service in Connecticut with 36.8%.
What is the Percentage of Population Employed in Community & Social Service in the State of Connecticut?
Percentage of Population Employed in Community & Social Service in Connecticut is 13.0%.
What is the Percentage of Population Employed in Community & Social Service in the United States?
Percentage of Population Employed in Community & Social Service in the United States is 11.2%.