Zip Codes with the Highest Percentage of Population Employed in Community & Social Service in San Jose, CA
RELATED REPORTS & OPTIONS
Community & Social Service
San Jose
Compare Zip Codes
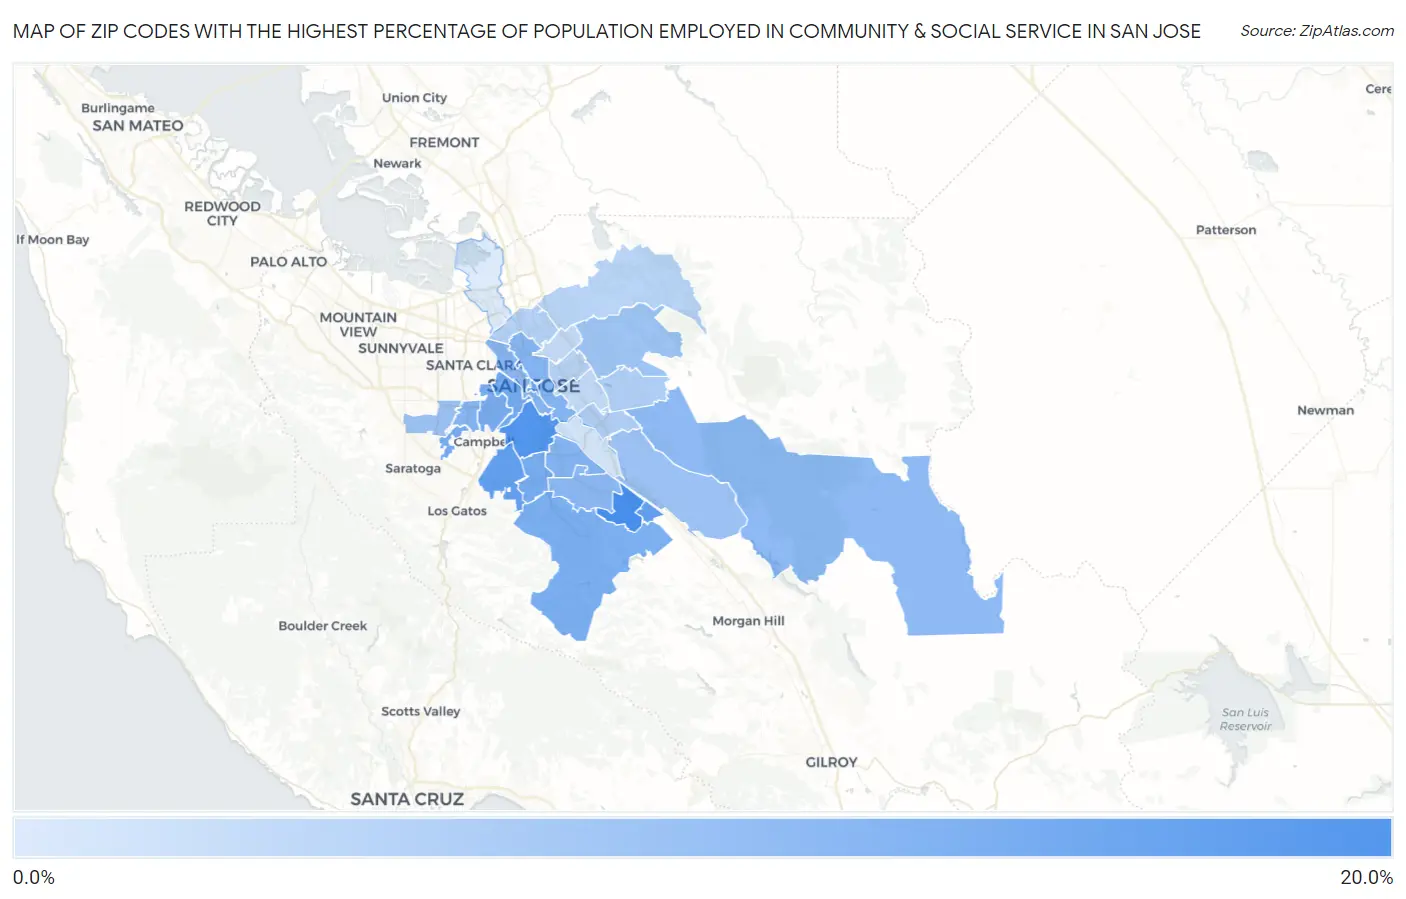
Map of Zip Codes with the Highest Percentage of Population Employed in Community & Social Service in San Jose
4.2%
15.5%
Zip Codes with the Highest Percentage of Population Employed in Community & Social Service in San Jose, CA
| Zip Code | % Employed | vs State | vs National | |
| 1. | 95119 | 15.5% | 11.5%(+3.99)#349 | 11.2%(+4.26)#4,525 |
| 2. | 95125 | 14.6% | 11.5%(+3.12)#407 | 11.2%(+3.39)#5,355 |
| 3. | 95124 | 13.3% | 11.5%(+1.82)#527 | 11.2%(+2.09)#7,071 |
| 4. | 95139 | 13.2% | 11.5%(+1.73)#537 | 11.2%(+2.00)#7,212 |
| 5. | 95113 | 12.6% | 11.5%(+1.11)#596 | 11.2%(+1.38)#8,260 |
| 6. | 95126 | 11.9% | 11.5%(+0.386)#675 | 11.2%(+0.656)#9,624 |
| 7. | 95130 | 11.7% | 11.5%(+0.258)#693 | 11.2%(+0.528)#9,900 |
| 8. | 95118 | 11.7% | 11.5%(+0.228)#698 | 11.2%(+0.498)#9,963 |
| 9. | 95128 | 11.6% | 11.5%(+0.111)#714 | 11.2%(+0.381)#10,237 |
| 10. | 95120 | 11.3% | 11.5%(-0.180)#752 | 11.2%(+0.090)#10,878 |
| 11. | 95136 | 10.7% | 11.5%(-0.776)#830 | 11.2%(-0.506)#12,352 |
| 12. | 95112 | 10.6% | 11.5%(-0.908)#841 | 11.2%(-0.638)#12,692 |
| 13. | 95117 | 10.5% | 11.5%(-0.958)#851 | 11.2%(-0.688)#12,810 |
| 14. | 95110 | 10.3% | 11.5%(-1.18)#881 | 11.2%(-0.907)#13,338 |
| 15. | 95123 | 10.2% | 11.5%(-1.33)#905 | 11.2%(-1.06)#13,723 |
| 16. | 95135 | 9.9% | 11.5%(-1.59)#939 | 11.2%(-1.32)#14,430 |
| 17. | 95129 | 9.2% | 11.5%(-2.32)#1,024 | 11.2%(-2.05)#16,361 |
| 18. | 95138 | 8.8% | 11.5%(-2.64)#1,064 | 11.2%(-2.37)#17,245 |
| 19. | 95127 | 8.7% | 11.5%(-2.81)#1,088 | 11.2%(-2.54)#17,694 |
| 20. | 95121 | 7.4% | 11.5%(-4.04)#1,227 | 11.2%(-3.77)#21,032 |
| 21. | 95148 | 7.4% | 11.5%(-4.06)#1,230 | 11.2%(-3.79)#21,082 |
| 22. | 95131 | 7.1% | 11.5%(-4.42)#1,274 | 11.2%(-4.15)#21,975 |
| 23. | 95116 | 6.9% | 11.5%(-4.61)#1,308 | 11.2%(-4.34)#22,446 |
| 24. | 95132 | 6.7% | 11.5%(-4.75)#1,325 | 11.2%(-4.48)#22,727 |
| 25. | 95133 | 6.0% | 11.5%(-5.46)#1,404 | 11.2%(-5.19)#24,326 |
| 26. | 95122 | 6.0% | 11.5%(-5.47)#1,408 | 11.2%(-5.20)#24,348 |
| 27. | 95111 | 4.9% | 11.5%(-6.62)#1,479 | 11.2%(-6.35)#26,415 |
| 28. | 95134 | 4.2% | 11.5%(-7.29)#1,508 | 11.2%(-7.02)#27,308 |
1
Common Questions
What are the Top 10 Zip Codes with the Highest Percentage of Population Employed in Community & Social Service in San Jose, CA?
Top 10 Zip Codes with the Highest Percentage of Population Employed in Community & Social Service in San Jose, CA are:
What zip code has the Highest Percentage of Population Employed in Community & Social Service in San Jose, CA?
95119 has the Highest Percentage of Population Employed in Community & Social Service in San Jose, CA with 15.5%.
What is the Percentage of Population Employed in Community & Social Service in San Jose, CA?
Percentage of Population Employed in Community & Social Service in San Jose is 9.2%.
What is the Percentage of Population Employed in Community & Social Service in California?
Percentage of Population Employed in Community & Social Service in California is 11.5%.
What is the Percentage of Population Employed in Community & Social Service in the United States?
Percentage of Population Employed in Community & Social Service in the United States is 11.2%.