Zip Codes with the Highest Percentage of Population Employed in Community & Social Service in Eureka, CA
RELATED REPORTS & OPTIONS
Community & Social Service
Eureka
Compare Zip Codes
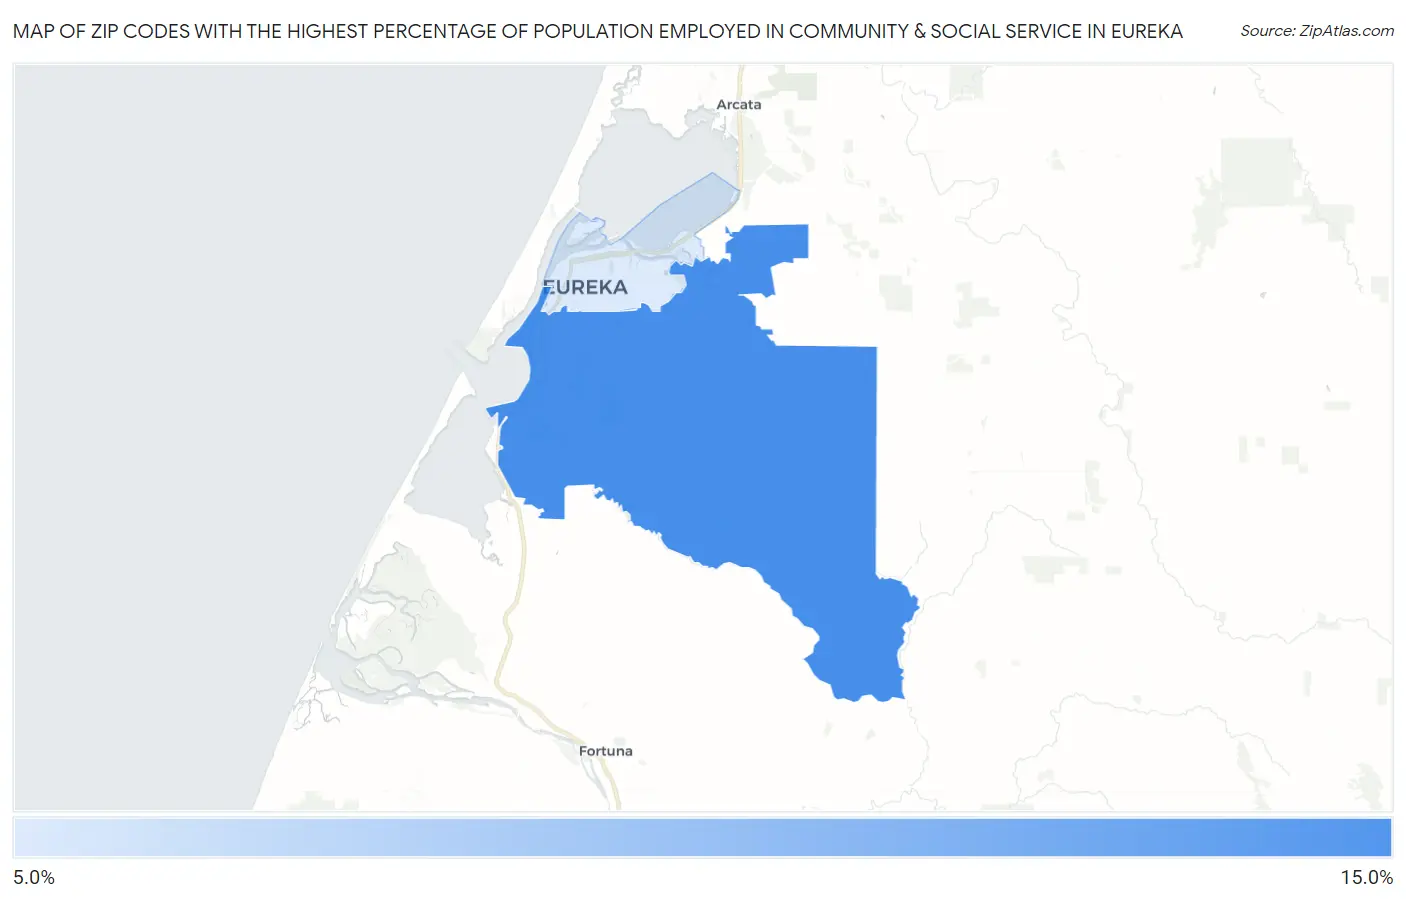
Map of Zip Codes with the Highest Percentage of Population Employed in Community & Social Service in Eureka
10.2%
12.1%
Zip Codes with the Highest Percentage of Population Employed in Community & Social Service in Eureka, CA
| Zip Code | % Employed | vs State | vs National | |
| 1. | 95503 | 12.1% | 11.5%(+0.649)#640 | 11.2%(+0.919)#9,088 |
| 2. | 95501 | 10.2% | 11.5%(-1.30)#900 | 11.2%(-1.03)#13,643 |
1
Common Questions
What are the Top Zip Codes with the Highest Percentage of Population Employed in Community & Social Service in Eureka, CA?
Top Zip Codes with the Highest Percentage of Population Employed in Community & Social Service in Eureka, CA are:
What zip code has the Highest Percentage of Population Employed in Community & Social Service in Eureka, CA?
95503 has the Highest Percentage of Population Employed in Community & Social Service in Eureka, CA with 12.1%.
What is the Percentage of Population Employed in Community & Social Service in Eureka, CA?
Percentage of Population Employed in Community & Social Service in Eureka is 10.8%.
What is the Percentage of Population Employed in Community & Social Service in California?
Percentage of Population Employed in Community & Social Service in California is 11.5%.
What is the Percentage of Population Employed in Community & Social Service in the United States?
Percentage of Population Employed in Community & Social Service in the United States is 11.2%.