Coleville, CA Map & Demographics
Coleville Map
Coleville Overview
$14,891
PER CAPITA INCOME
$42,500
AVG FAMILY INCOME
$42,071
AVG HOUSEHOLD INCOME
0.24
INEQUALITY / GINI INDEX
388
TOTAL POPULATION
180
MALE POPULATION
208
FEMALE POPULATION
86.54
MALES / 100 FEMALES
115.56
FEMALES / 100 MALES
25.7
MEDIAN AGE
3.3
AVG FAMILY SIZE
3.1
AVG HOUSEHOLD SIZE
165
LABOR FORCE [ PEOPLE ]
71.4%
PERCENT IN LABOR FORCE
34.4%
UNEMPLOYMENT RATE
Coleville Zip Codes
Coleville Area Codes
Income in Coleville
Income Overview in Coleville
Per Capita Income in Coleville is $14,891, while median incomes of families and households are $42,500 and $42,071 respectively.
| Characteristic | Number | Measure |
| Per Capita Income | 388 | $14,891 |
| Median Family Income | 114 | $42,500 |
| Mean Family Income | 114 | $49,201 |
| Median Household Income | 126 | $42,071 |
| Mean Household Income | 126 | $45,579 |
| Income Deficit | 114 | $0 |
| Wage / Income Gap (%) | 388 | 0.00% |
| Wage / Income Gap ($) | 388 | 100.00¢ per $1 |
| Gini / Inequality Index | 388 | 0.24 |
Earnings by Sex in Coleville
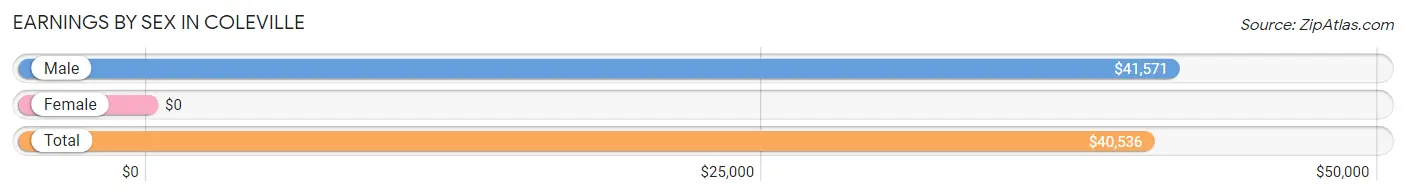
| Sex | Number | Average Earnings |
| Male | 114 (79.7%) | $41,571 |
| Female | 29 (20.3%) | $0 |
| Total | 143 (100.0%) | $40,536 |
Earnings by Sex by Income Bracket in Coleville
The most common earnings brackets in Coleville are $40,000 to $44,999 for men (60 | 52.6%) and $2,499 or less for women (29 | 100.0%).
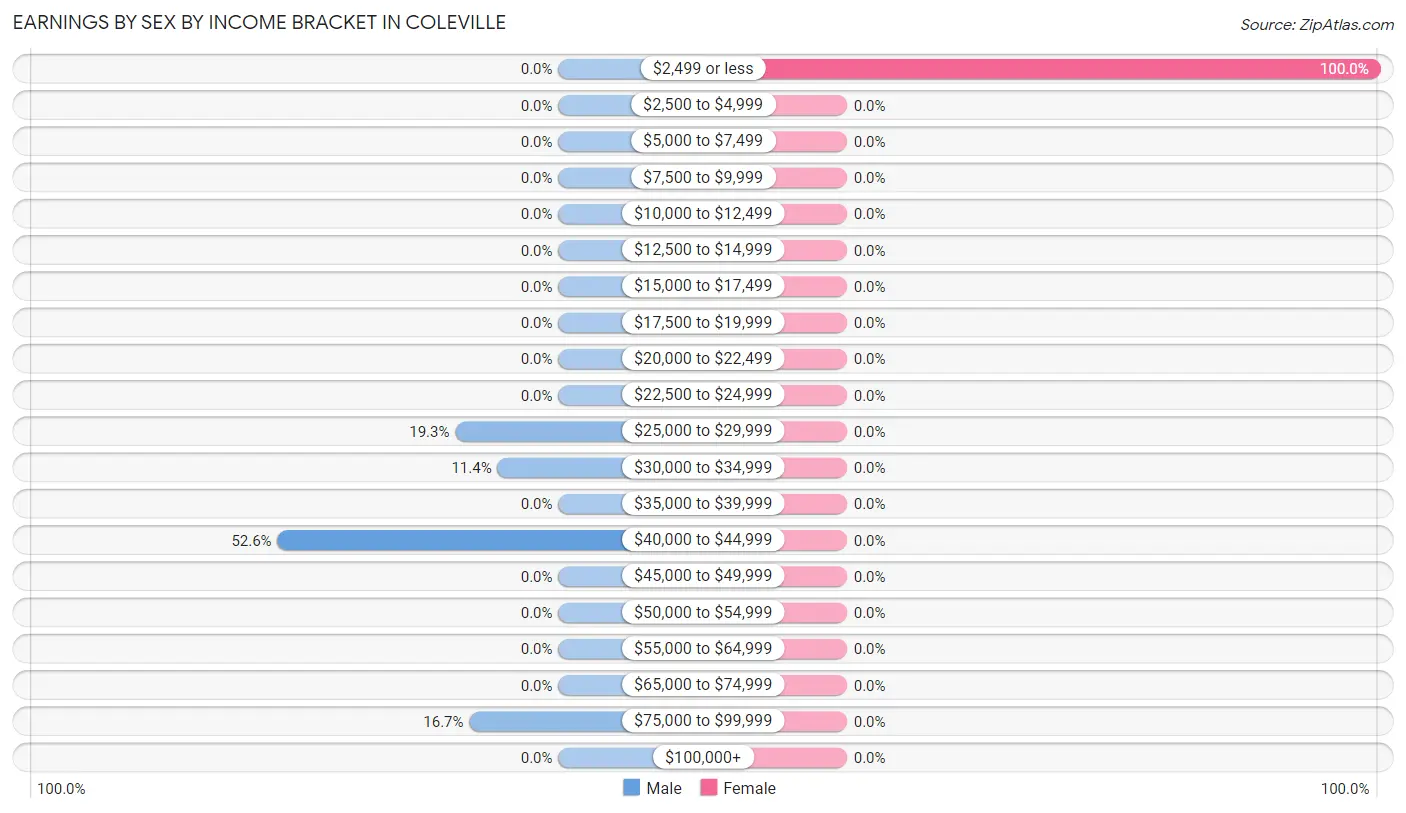
| Income | Male | Female |
| $2,499 or less | 0 (0.0%) | 29 (100.0%) |
| $2,500 to $4,999 | 0 (0.0%) | 0 (0.0%) |
| $5,000 to $7,499 | 0 (0.0%) | 0 (0.0%) |
| $7,500 to $9,999 | 0 (0.0%) | 0 (0.0%) |
| $10,000 to $12,499 | 0 (0.0%) | 0 (0.0%) |
| $12,500 to $14,999 | 0 (0.0%) | 0 (0.0%) |
| $15,000 to $17,499 | 0 (0.0%) | 0 (0.0%) |
| $17,500 to $19,999 | 0 (0.0%) | 0 (0.0%) |
| $20,000 to $22,499 | 0 (0.0%) | 0 (0.0%) |
| $22,500 to $24,999 | 0 (0.0%) | 0 (0.0%) |
| $25,000 to $29,999 | 22 (19.3%) | 0 (0.0%) |
| $30,000 to $34,999 | 13 (11.4%) | 0 (0.0%) |
| $35,000 to $39,999 | 0 (0.0%) | 0 (0.0%) |
| $40,000 to $44,999 | 60 (52.6%) | 0 (0.0%) |
| $45,000 to $49,999 | 0 (0.0%) | 0 (0.0%) |
| $50,000 to $54,999 | 0 (0.0%) | 0 (0.0%) |
| $55,000 to $64,999 | 0 (0.0%) | 0 (0.0%) |
| $65,000 to $74,999 | 0 (0.0%) | 0 (0.0%) |
| $75,000 to $99,999 | 19 (16.7%) | 0 (0.0%) |
| $100,000+ | 0 (0.0%) | 0 (0.0%) |
| Total | 114 (100.0%) | 29 (100.0%) |
Earnings by Sex by Educational Attainment in Coleville
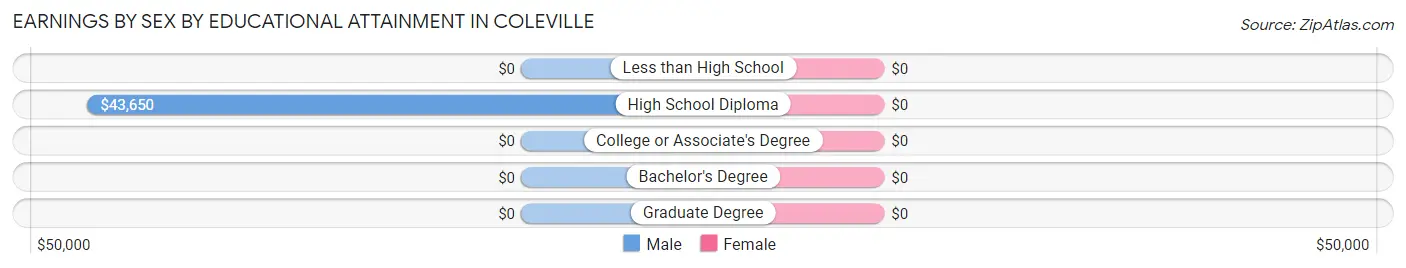
| Educational Attainment | Male Income | Female Income |
| Less than High School | - | - |
| High School Diploma | $43,650 | $0 |
| College or Associate's Degree | - | - |
| Bachelor's Degree | - | - |
| Graduate Degree | - | - |
| Total | $41,571 | $0 |
Family Income in Coleville
Family Income Brackets in Coleville
According to the Coleville family income data, there are 60 families falling into the $35,000 to $49,999 income range, which is the most common income bracket and makes up 52.6% of all families.
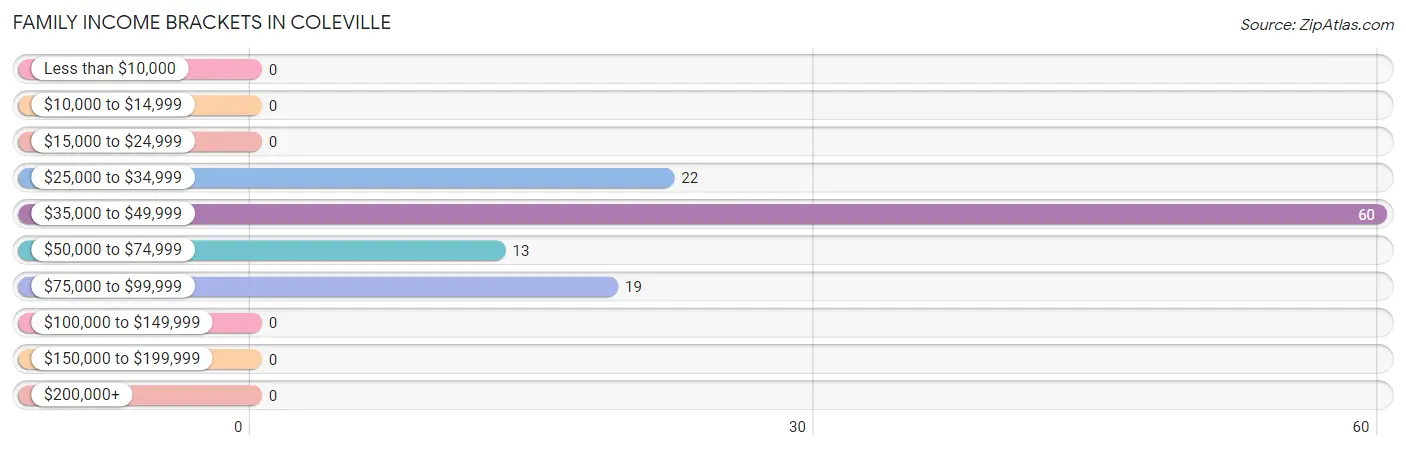
| Income Bracket | # Families | % Families |
| Less than $10,000 | 0 | 0.0% |
| $10,000 to $14,999 | 0 | 0.0% |
| $15,000 to $24,999 | 0 | 0.0% |
| $25,000 to $34,999 | 22 | 19.3% |
| $35,000 to $49,999 | 60 | 52.6% |
| $50,000 to $74,999 | 13 | 11.4% |
| $75,000 to $99,999 | 19 | 16.7% |
| $100,000 to $149,999 | 0 | 0.0% |
| $150,000 to $199,999 | 0 | 0.0% |
| $200,000+ | 0 | 0.0% |
Family Income by Famaliy Size in Coleville
| Income Bracket | # Families | Median Income |
| 2-Person Families | 27 (23.7%) | $0 |
| 3-Person Families | 33 (28.9%) | $0 |
| 4-Person Families | 19 (16.7%) | $0 |
| 5-Person Families | 35 (30.7%) | $0 |
| 6-Person Families | 0 (0.0%) | $0 |
| 7+ Person Families | 0 (0.0%) | $0 |
| Total | 114 (100.0%) | $42,500 |
Family Income by Number of Earners in Coleville
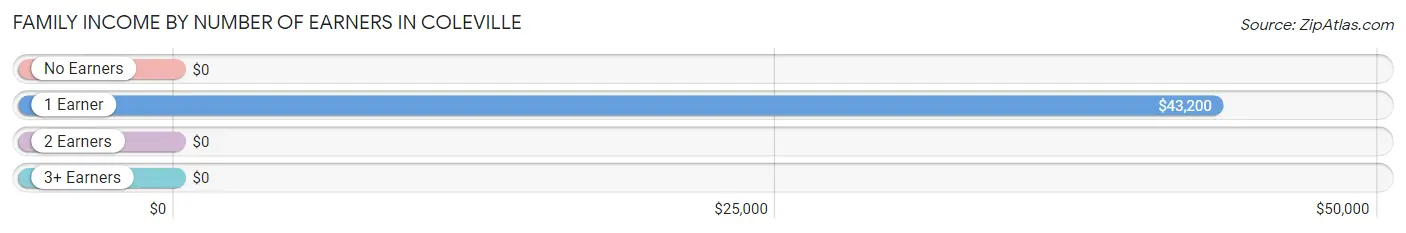
| Number of Earners | # Families | Median Income |
| No Earners | 0 (0.0%) | $0 |
| 1 Earner | 100 (87.7%) | $43,200 |
| 2 Earners | 14 (12.3%) | $0 |
| 3+ Earners | 0 (0.0%) | $0 |
| Total | 114 (100.0%) | $42,500 |
Household Income in Coleville
Household Income Brackets in Coleville
With 60 households falling in the category, the $35,000 to $49,999 income range is the most frequent in Coleville, accounting for 47.6% of all households.
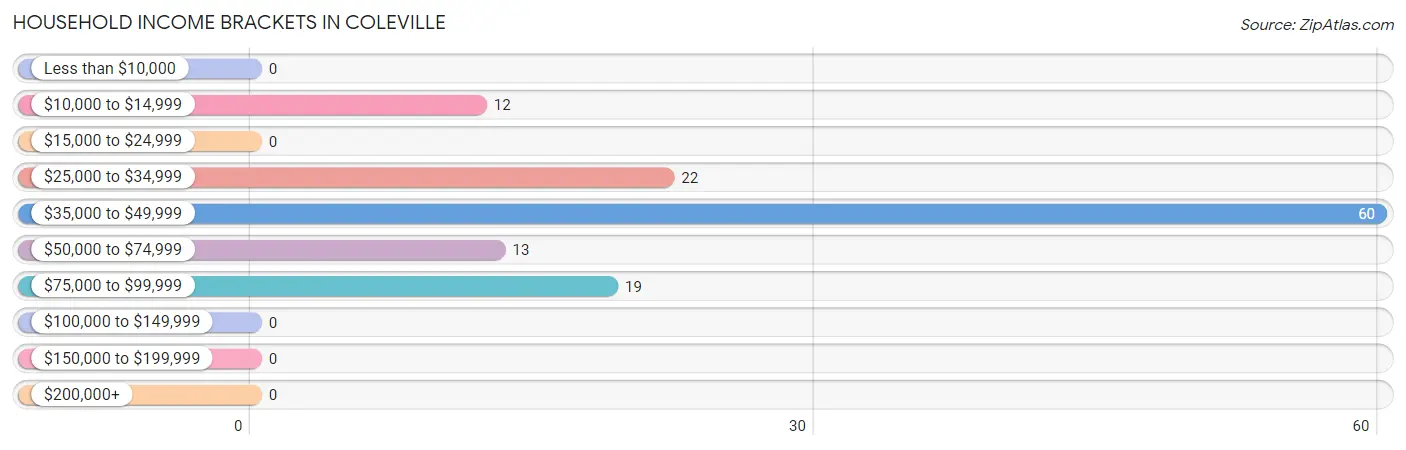
| Income Bracket | # Households | % Households |
| Less than $10,000 | 0 | 0.0% |
| $10,000 to $14,999 | 12 | 9.5% |
| $15,000 to $24,999 | 0 | 0.0% |
| $25,000 to $34,999 | 22 | 17.5% |
| $35,000 to $49,999 | 60 | 47.6% |
| $50,000 to $74,999 | 13 | 10.3% |
| $75,000 to $99,999 | 19 | 15.1% |
| $100,000 to $149,999 | 0 | 0.0% |
| $150,000 to $199,999 | 0 | 0.0% |
| $200,000+ | 0 | 0.0% |
Household Income by Householder Age in Coleville
The median household income in Coleville is $42,071, with the highest median household income of $42,036 found in the 25 to 44 years age bracket for the primary householder. A total of 101 households (80.2%) fall into this category.
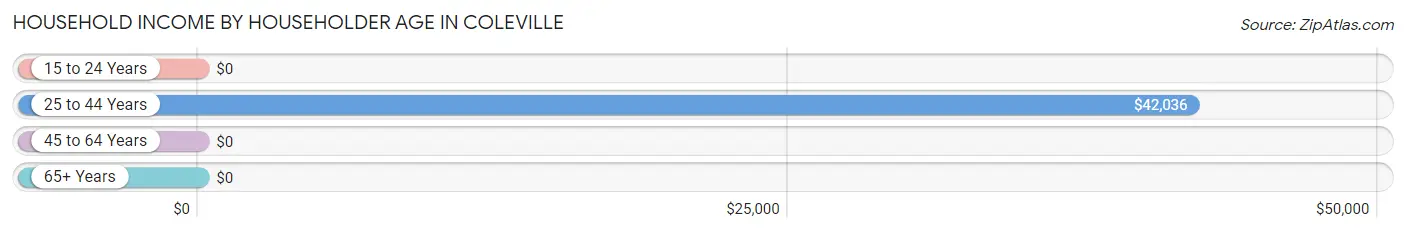
| Income Bracket | # Households | Median Income |
| 15 to 24 Years | 0 (0.0%) | $0 |
| 25 to 44 Years | 101 (80.2%) | $42,036 |
| 45 to 64 Years | 0 (0.0%) | $0 |
| 65+ Years | 25 (19.8%) | $0 |
| Total | 126 (100.0%) | $42,071 |
Poverty in Coleville
Income Below Poverty by Sex and Age in Coleville
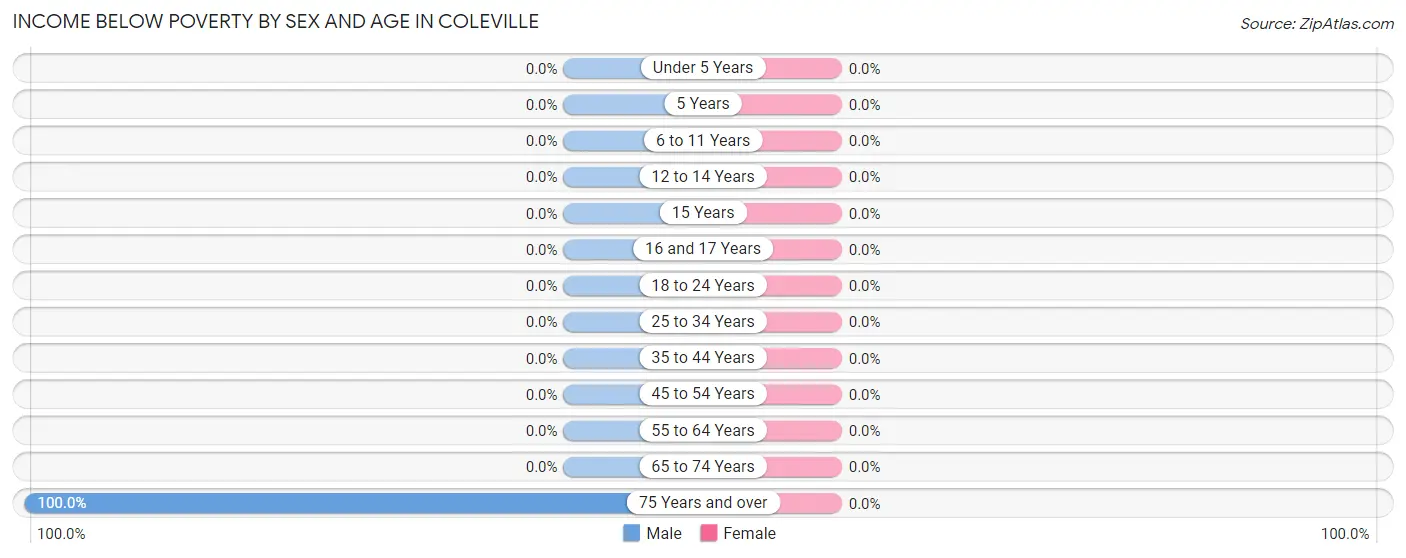
| Age Bracket | Male | Female |
| Under 5 Years | 0 (0.0%) | 0 (0.0%) |
| 5 Years | 0 (0.0%) | 0 (0.0%) |
| 6 to 11 Years | 0 (0.0%) | 0 (0.0%) |
| 12 to 14 Years | 0 (0.0%) | 0 (0.0%) |
| 15 Years | 0 (0.0%) | 0 (0.0%) |
| 16 and 17 Years | 0 (0.0%) | 0 (0.0%) |
| 18 to 24 Years | 0 (0.0%) | 0 (0.0%) |
| 25 to 34 Years | 0 (0.0%) | 0 (0.0%) |
| 35 to 44 Years | 0 (0.0%) | 0 (0.0%) |
| 45 to 54 Years | 0 (0.0%) | 0 (0.0%) |
| 55 to 64 Years | 0 (0.0%) | 0 (0.0%) |
| 65 to 74 Years | 0 (0.0%) | 0 (0.0%) |
| 75 Years and over | 12 (100.0%) | 0 (0.0%) |
| Total | 12 (6.7%) | 0 (0.0%) |
Income Above Poverty by Sex and Age in Coleville
According to the poverty statistics in Coleville, males aged 5 years and females aged under 5 years are the age groups that are most secure financially, with 100.0% of males and 100.0% of females in these age groups living above the poverty line.
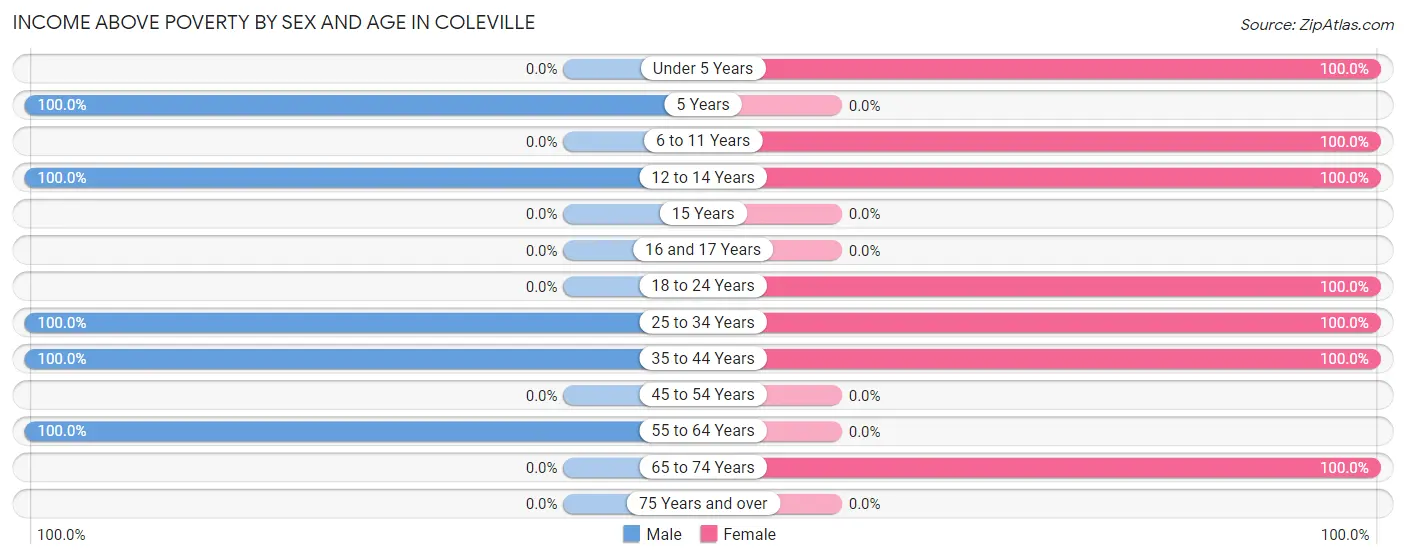
| Age Bracket | Male | Female |
| Under 5 Years | 0 (0.0%) | 14 (100.0%) |
| 5 Years | 42 (100.0%) | 0 (0.0%) |
| 6 to 11 Years | 0 (0.0%) | 48 (100.0%) |
| 12 to 14 Years | 12 (100.0%) | 41 (100.0%) |
| 15 Years | 0 (0.0%) | 0 (0.0%) |
| 16 and 17 Years | 0 (0.0%) | 0 (0.0%) |
| 18 to 24 Years | 0 (0.0%) | 15 (100.0%) |
| 25 to 34 Years | 47 (100.0%) | 62 (100.0%) |
| 35 to 44 Years | 54 (100.0%) | 15 (100.0%) |
| 45 to 54 Years | 0 (0.0%) | 0 (0.0%) |
| 55 to 64 Years | 13 (100.0%) | 0 (0.0%) |
| 65 to 74 Years | 0 (0.0%) | 13 (100.0%) |
| 75 Years and over | 0 (0.0%) | 0 (0.0%) |
| Total | 168 (93.3%) | 208 (100.0%) |
Income Below Poverty Among Married-Couple Families in Coleville
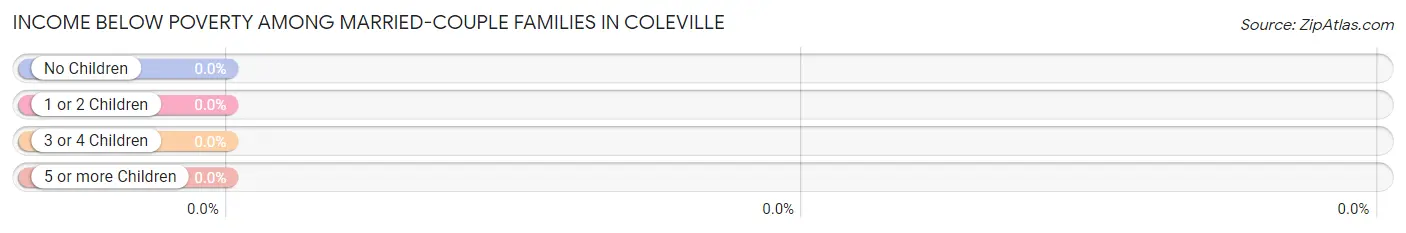
| Children | Above Poverty | Below Poverty |
| No Children | 27 (100.0%) | 0 (0.0%) |
| 1 or 2 Children | 52 (100.0%) | 0 (0.0%) |
| 3 or 4 Children | 35 (100.0%) | 0 (0.0%) |
| 5 or more Children | 0 (0.0%) | 0 (0.0%) |
| Total | 114 (100.0%) | 0 (0.0%) |
Income Below Poverty Among Single-Parent Households in Coleville
| Children | Single Father | Single Mother |
| No Children | 0 (0.0%) | 0 (0.0%) |
| 1 or 2 Children | 0 (0.0%) | 0 (0.0%) |
| 3 or 4 Children | 0 (0.0%) | 0 (0.0%) |
| 5 or more Children | 0 (0.0%) | 0 (0.0%) |
| Total | 0 (0.0%) | 0 (0.0%) |
Income Below Poverty Among Married-Couple vs Single-Parent Households in Coleville
| Children | Married-Couple Families | Single-Parent Households |
| No Children | 0 (0.0%) | 0 (0.0%) |
| 1 or 2 Children | 0 (0.0%) | 0 (0.0%) |
| 3 or 4 Children | 0 (0.0%) | 0 (0.0%) |
| 5 or more Children | 0 (0.0%) | 0 (0.0%) |
| Total | 0 (0.0%) | 0 (0.0%) |
Race in Coleville
The most populous races in Coleville are White / Caucasian (180 | 46.4%), Hispanic or Latino (173 | 44.6%), and Two or more Races (108 | 27.8%).
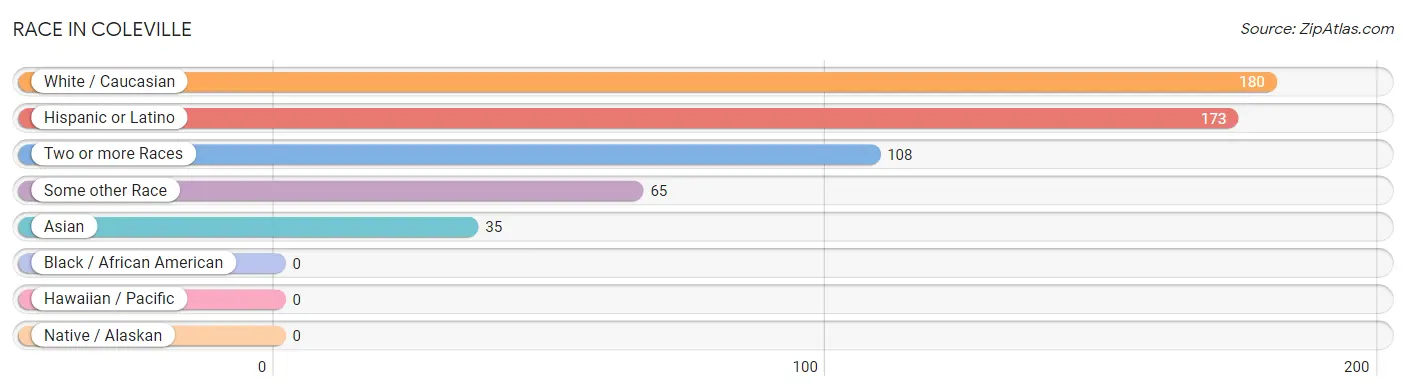
| Race | # Population | % Population |
| Asian | 35 | 9.0% |
| Black / African American | 0 | 0.0% |
| Hawaiian / Pacific | 0 | 0.0% |
| Hispanic or Latino | 173 | 44.6% |
| Native / Alaskan | 0 | 0.0% |
| White / Caucasian | 180 | 46.4% |
| Two or more Races | 108 | 27.8% |
| Some other Race | 65 | 16.8% |
| Total | 388 | 100.0% |
Ancestry in Coleville
The most populous ancestries reported in Coleville are Mexican (159 | 41.0%), Japanese (143 | 36.9%), English (92 | 23.7%), Dominican (14 | 3.6%), and American (13 | 3.4%), together accounting for 108.5% of all Coleville residents.
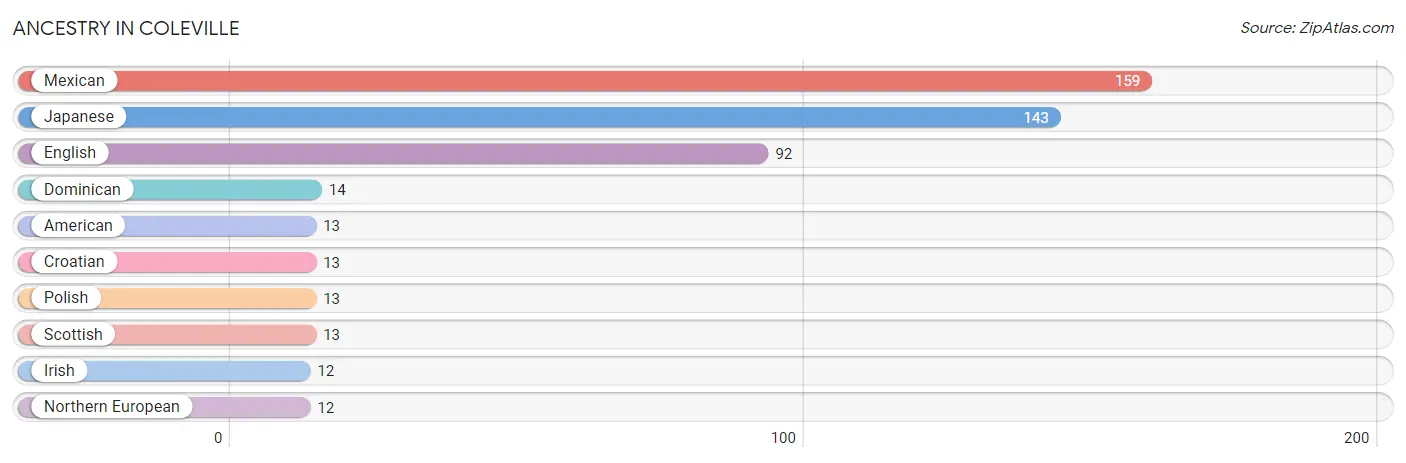
| Ancestry | # Population | % Population |
| American | 13 | 3.4% |
| Croatian | 13 | 3.4% |
| Dominican | 14 | 3.6% |
| English | 92 | 23.7% |
| Irish | 12 | 3.1% |
| Japanese | 143 | 36.9% |
| Mexican | 159 | 41.0% |
| Northern European | 12 | 3.1% |
| Polish | 13 | 3.4% |
| Scottish | 13 | 3.4% | View All 10 Rows |
Immigrants in Coleville
The most numerous immigrant groups reported in Coleville came from Europe (54 | 13.9%), Northern Europe (54 | 13.9%), Central America (22 | 5.7%), Latin America (22 | 5.7%), and Mexico (22 | 5.7%), together accounting for 44.8% of all Coleville residents.
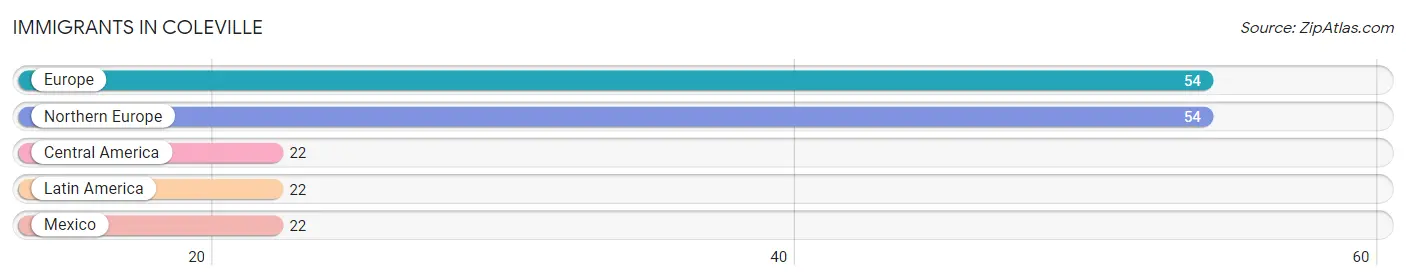
| Immigration Origin | # Population | % Population |
| Central America | 22 | 5.7% |
| Europe | 54 | 13.9% |
| Latin America | 22 | 5.7% |
| Mexico | 22 | 5.7% |
| Northern Europe | 54 | 13.9% | View All 5 Rows |
Sex and Age in Coleville
Sex and Age in Coleville
The most populous age groups in Coleville are 25 to 29 Years (47 | 26.1%) for men and 10 to 14 Years (89 | 42.8%) for women.
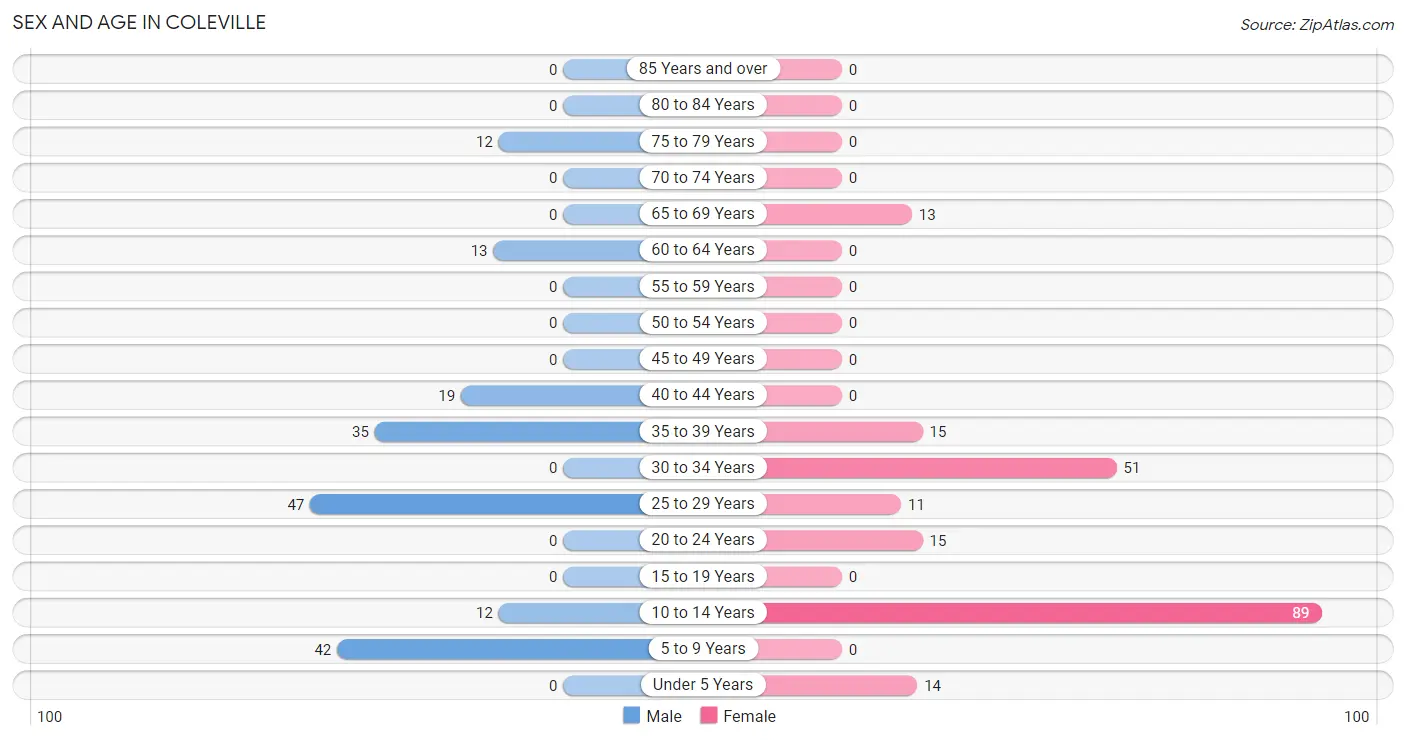
| Age Bracket | Male | Female |
| Under 5 Years | 0 (0.0%) | 14 (6.7%) |
| 5 to 9 Years | 42 (23.3%) | 0 (0.0%) |
| 10 to 14 Years | 12 (6.7%) | 89 (42.8%) |
| 15 to 19 Years | 0 (0.0%) | 0 (0.0%) |
| 20 to 24 Years | 0 (0.0%) | 15 (7.2%) |
| 25 to 29 Years | 47 (26.1%) | 11 (5.3%) |
| 30 to 34 Years | 0 (0.0%) | 51 (24.5%) |
| 35 to 39 Years | 35 (19.4%) | 15 (7.2%) |
| 40 to 44 Years | 19 (10.6%) | 0 (0.0%) |
| 45 to 49 Years | 0 (0.0%) | 0 (0.0%) |
| 50 to 54 Years | 0 (0.0%) | 0 (0.0%) |
| 55 to 59 Years | 0 (0.0%) | 0 (0.0%) |
| 60 to 64 Years | 13 (7.2%) | 0 (0.0%) |
| 65 to 69 Years | 0 (0.0%) | 13 (6.2%) |
| 70 to 74 Years | 0 (0.0%) | 0 (0.0%) |
| 75 to 79 Years | 12 (6.7%) | 0 (0.0%) |
| 80 to 84 Years | 0 (0.0%) | 0 (0.0%) |
| 85 Years and over | 0 (0.0%) | 0 (0.0%) |
| Total | 180 (100.0%) | 208 (100.0%) |
Families and Households in Coleville
Median Family Size in Coleville
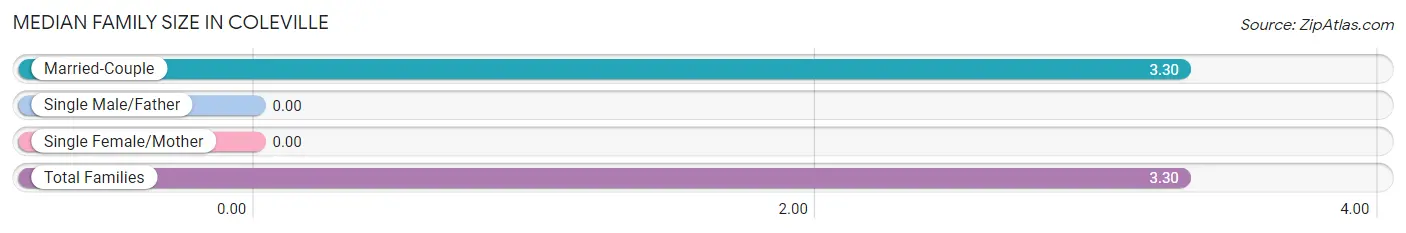
| Family Type | # Families | Family Size |
| Married-Couple | 114 (100.0%) | 3.30 |
| Single Male/Father | 0 (0.0%) | - |
| Single Female/Mother | 0 (0.0%) | - |
| Total Families | 114 (100.0%) | 3.30 |
Median Household Size in Coleville
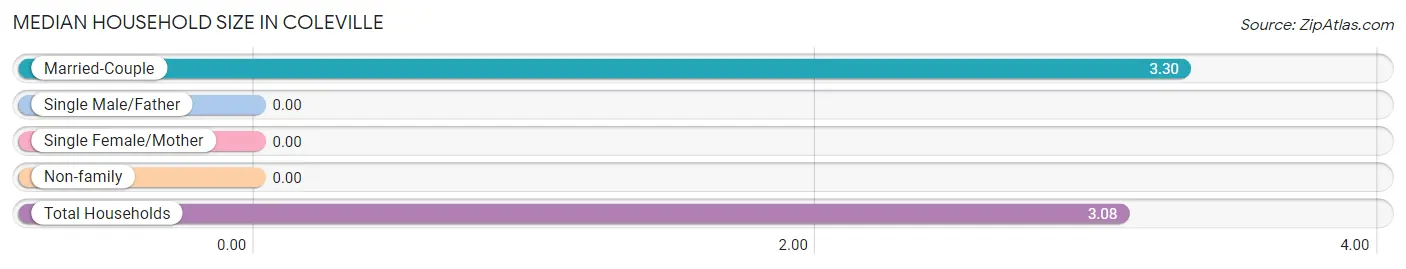
| Household Type | # Households | Household Size |
| Married-Couple | 114 (90.5%) | 3.30 |
| Single Male/Father | 0 (0.0%) | - |
| Single Female/Mother | 0 (0.0%) | - |
| Non-family | 12 (9.5%) | - |
| Total Households | 126 (100.0%) | 3.08 |
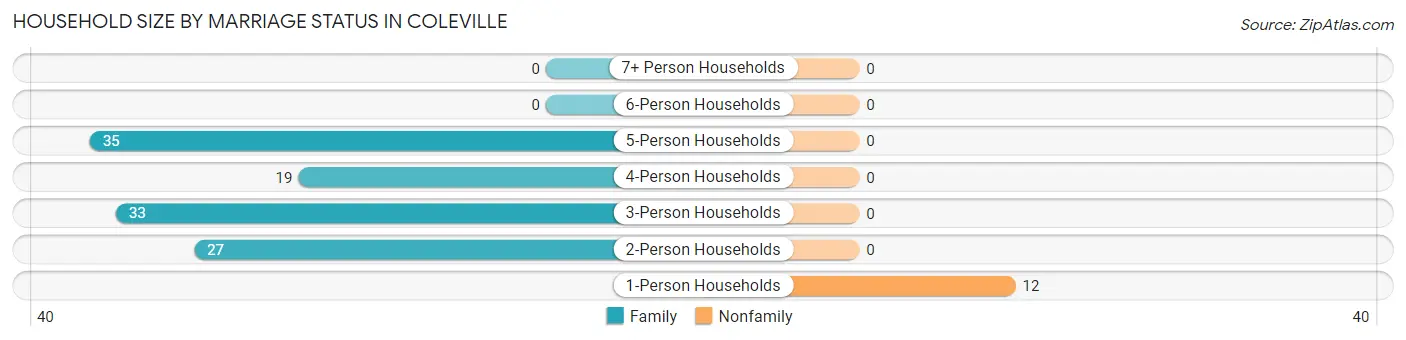
Household Size by Marriage Status in Coleville
Out of a total of 126 households in Coleville, 114 (90.5%) are family households, while 12 (9.5%) are nonfamily households. The most numerous type of family households are 5-person households, comprising 35, and the most common type of nonfamily households are 1-person households, comprising 12.
| Household Size | Family Households | Nonfamily Households |
| 1-Person Households | - | 12 (9.5%) |
| 2-Person Households | 27 (21.4%) | 0 (0.0%) |
| 3-Person Households | 33 (26.2%) | 0 (0.0%) |
| 4-Person Households | 19 (15.1%) | 0 (0.0%) |
| 5-Person Households | 35 (27.8%) | 0 (0.0%) |
| 6-Person Households | 0 (0.0%) | 0 (0.0%) |
| 7+ Person Households | 0 (0.0%) | 0 (0.0%) |
| Total | 114 (90.5%) | 12 (9.5%) |
Female Fertility in Coleville
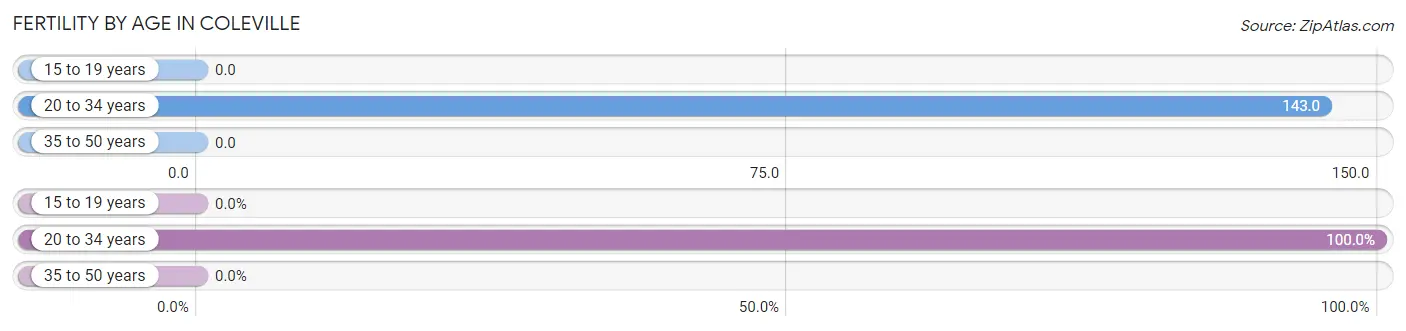
Fertility by Age in Coleville
Average fertility rate in Coleville is 120.0 births per 1,000 women. Women in the age bracket of 20 to 34 years have the highest fertility rate with 143.0 births per 1,000 women. Women in the age bracket of 20 to 34 years acount for 100.0% of all women with births.
| Age Bracket | Women with Births | Births / 1,000 Women |
| 15 to 19 years | 0 (0.0%) | 0.0 |
| 20 to 34 years | 11 (100.0%) | 143.0 |
| 35 to 50 years | 0 (0.0%) | 0.0 |
| Total | 11 (100.0%) | 120.0 |
Fertility by Age by Marriage Status in Coleville
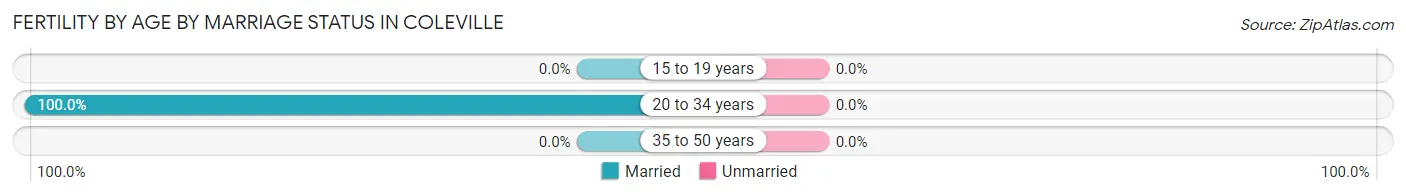
| Age Bracket | Married | Unmarried |
| 15 to 19 years | 0 (0.0%) | 0 (0.0%) |
| 20 to 34 years | 11 (100.0%) | 0 (0.0%) |
| 35 to 50 years | 0 (0.0%) | 0 (0.0%) |
| Total | 11 (100.0%) | 0 (0.0%) |
Fertility by Education in Coleville
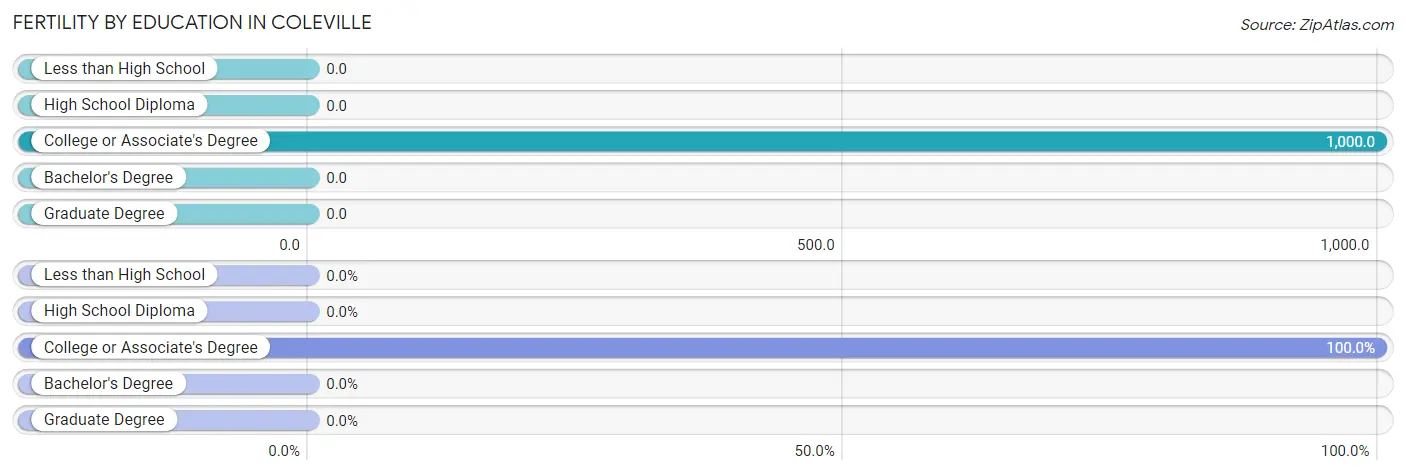
| Educational Attainment | Women with Births | Births / 1,000 Women |
| Less than High School | 0 (0.0%) | 0.0 |
| High School Diploma | 0 (0.0%) | 0.0 |
| College or Associate's Degree | 11 (100.0%) | 1,000.0 |
| Bachelor's Degree | 0 (0.0%) | 0.0 |
| Graduate Degree | 0 (0.0%) | 0.0 |
| Total | 11 (100.0%) | 120.0 |
Fertility by Education by Marriage Status in Coleville
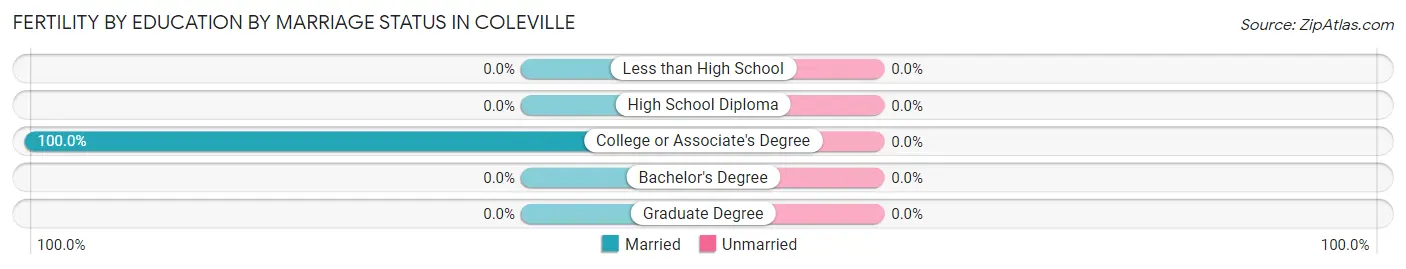
| Educational Attainment | Married | Unmarried |
| Less than High School | 0 (0.0%) | 0 (0.0%) |
| High School Diploma | 0 (0.0%) | 0 (0.0%) |
| College or Associate's Degree | 11 (100.0%) | 0 (0.0%) |
| Bachelor's Degree | 0 (0.0%) | 0 (0.0%) |
| Graduate Degree | 0 (0.0%) | 0 (0.0%) |
| Total | 11 (100.0%) | 0 (0.0%) |
Employment Characteristics in Coleville
Employment by Class of Employer in Coleville
Among the 143 employed individuals in Coleville, federal government employees (130 | 90.9%), and self-employed (not incorporated) (13 | 9.1%) make up the most common classes of employment.
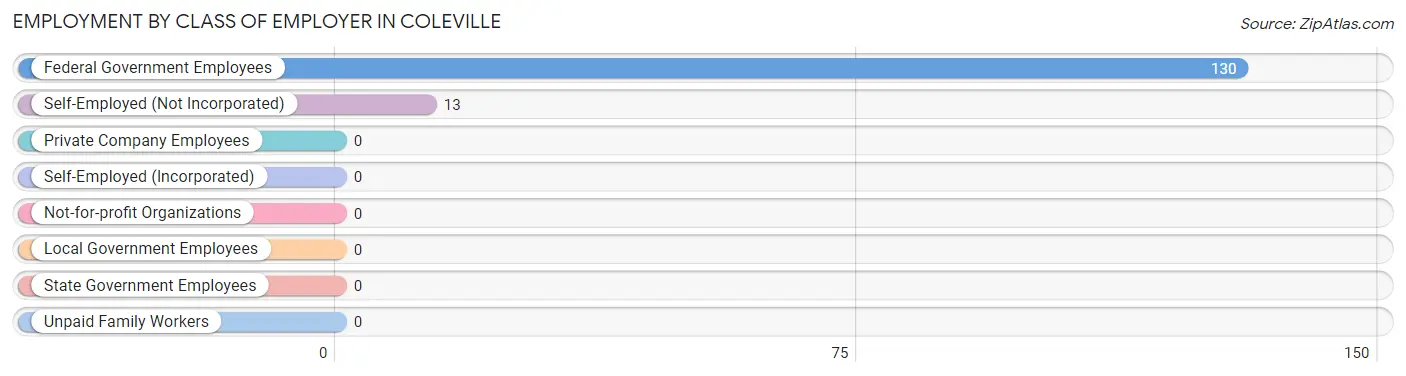
| Employer Class | # Employees | % Employees |
| Private Company Employees | 0 | 0.0% |
| Self-Employed (Incorporated) | 0 | 0.0% |
| Self-Employed (Not Incorporated) | 13 | 9.1% |
| Not-for-profit Organizations | 0 | 0.0% |
| Local Government Employees | 0 | 0.0% |
| State Government Employees | 0 | 0.0% |
| Federal Government Employees | 130 | 90.9% |
| Unpaid Family Workers | 0 | 0.0% |
| Total | 143 | 100.0% |
Employment Status by Age in Coleville
According to the labor force statistics for Coleville, out of the total population over 16 years of age (231), 71.4% or 165 individuals are in the labor force, with 34.4% or 57 of them unemployed. The age group with the highest labor force participation rate is 30 to 34 years, with 100.0% or 51 individuals in the labor force. Within the labor force, the 30 to 34 years age range has the highest percentage of unemployed individuals, with 43.1% or 22 of them being unemployed.
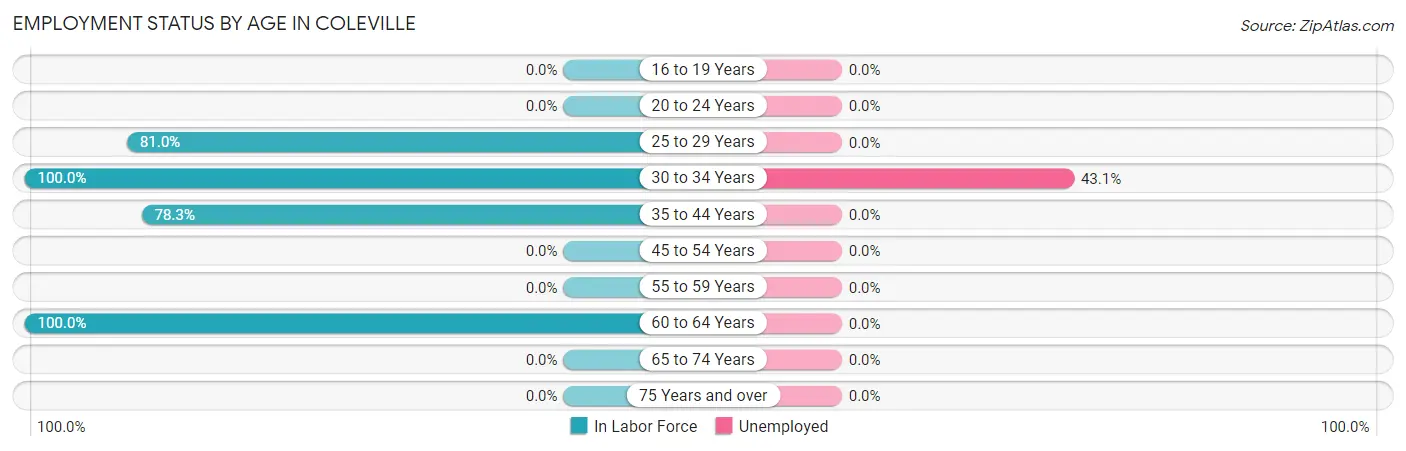
| Age Bracket | In Labor Force | Unemployed |
| 16 to 19 Years | 0 (0.0%) | 0 (0.0%) |
| 20 to 24 Years | 0 (0.0%) | 0 (0.0%) |
| 25 to 29 Years | 47 (81.0%) | 0 (0.0%) |
| 30 to 34 Years | 51 (100.0%) | 22 (43.1%) |
| 35 to 44 Years | 54 (78.3%) | 0 (0.0%) |
| 45 to 54 Years | 0 (0.0%) | 0 (0.0%) |
| 55 to 59 Years | 0 (0.0%) | 0 (0.0%) |
| 60 to 64 Years | 13 (100.0%) | 0 (0.0%) |
| 65 to 74 Years | 0 (0.0%) | 0 (0.0%) |
| 75 Years and over | 0 (0.0%) | 0 (0.0%) |
| Total | 165 (71.4%) | 57 (34.4%) |
Employment Status by Educational Attainment in Coleville
According to labor force statistics for Coleville, 86.4% of individuals (165) out of the total population between 25 and 64 years of age (191) are in the labor force, with 34.4% or 57 of them being unemployed. The group with the highest labor force participation rate are those with the educational attainment of high school diploma, with 100.0% or 87 individuals in the labor force. Within the labor force, individuals with high school diploma education have the highest percentage of unemployment, with 62.9% or 55 of them being unemployed.
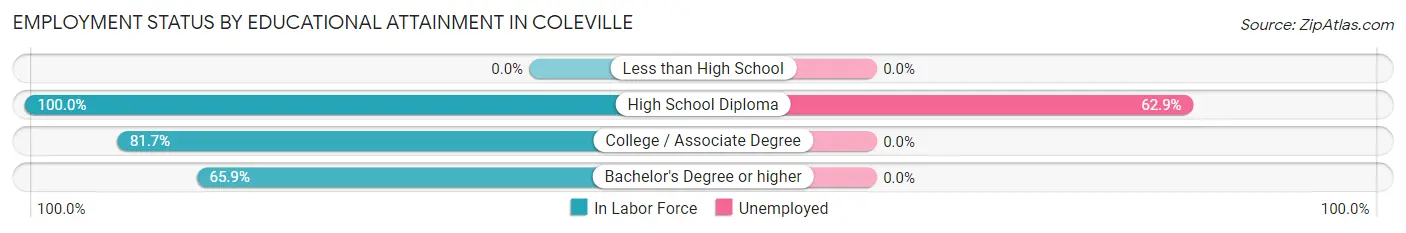
| Educational Attainment | In Labor Force | Unemployed |
| Less than High School | 0 (0.0%) | 0 (0.0%) |
| High School Diploma | 87 (100.0%) | 55 (62.9%) |
| College / Associate Degree | 49 (81.7%) | 0 (0.0%) |
| Bachelor's Degree or higher | 29 (65.9%) | 0 (0.0%) |
| Total | 165 (86.4%) | 66 (34.4%) |
Employment Occupations by Sex in Coleville
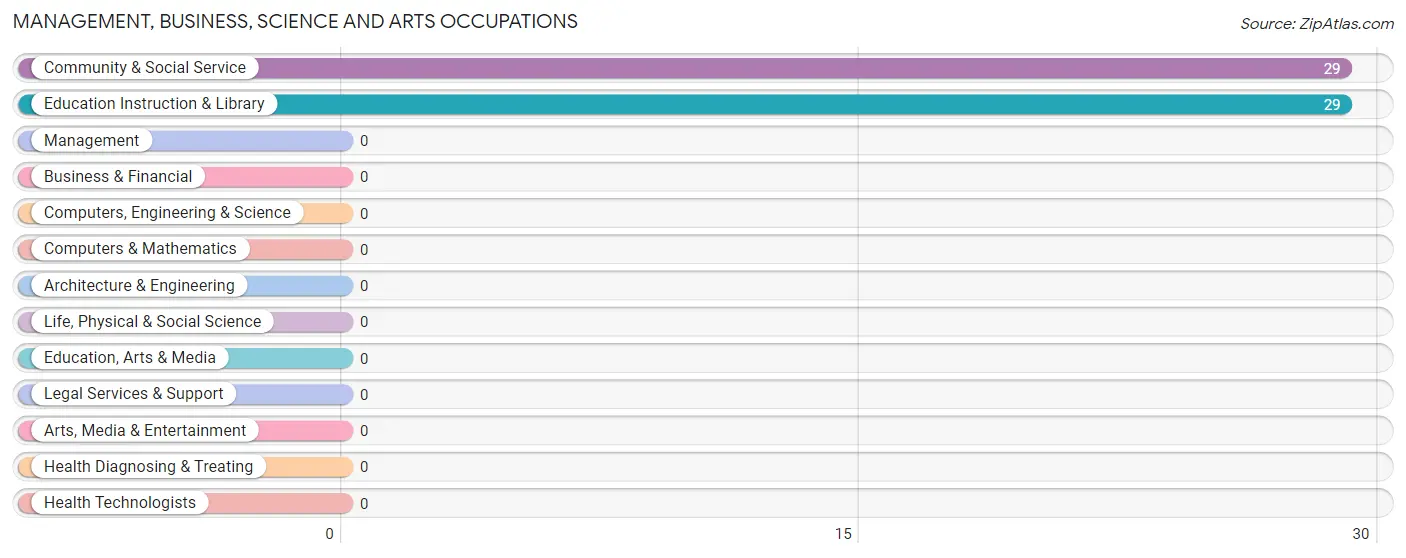
Management, Business, Science and Arts Occupations
The most common Management, Business, Science and Arts occupations in Coleville are Community & Social Service (29 | 69.1%), and Education Instruction & Library (29 | 69.1%).
Management, Business, Science and Arts Occupations by Sex
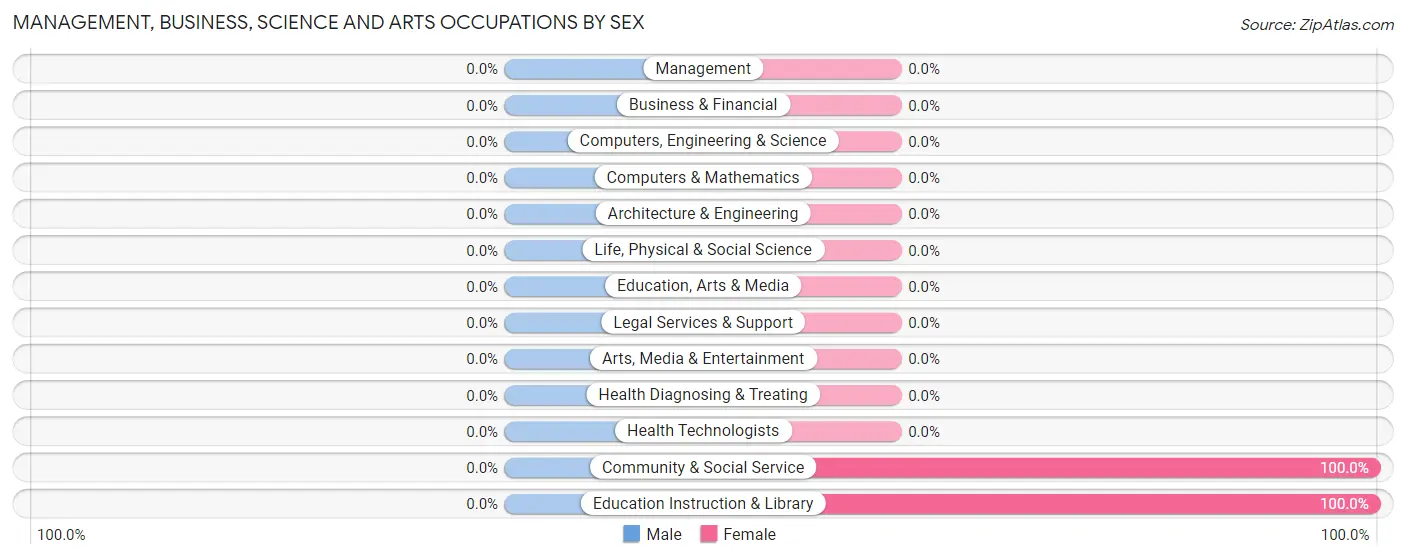
| Occupation | Male | Female |
| Management | 0 (0.0%) | 0 (0.0%) |
| Business & Financial | 0 (0.0%) | 0 (0.0%) |
| Computers, Engineering & Science | 0 (0.0%) | 0 (0.0%) |
| Computers & Mathematics | 0 (0.0%) | 0 (0.0%) |
| Architecture & Engineering | 0 (0.0%) | 0 (0.0%) |
| Life, Physical & Social Science | 0 (0.0%) | 0 (0.0%) |
| Community & Social Service | 0 (0.0%) | 29 (100.0%) |
| Education, Arts & Media | 0 (0.0%) | 0 (0.0%) |
| Legal Services & Support | 0 (0.0%) | 0 (0.0%) |
| Education Instruction & Library | 0 (0.0%) | 29 (100.0%) |
| Arts, Media & Entertainment | 0 (0.0%) | 0 (0.0%) |
| Health Diagnosing & Treating | 0 (0.0%) | 0 (0.0%) |
| Health Technologists | 0 (0.0%) | 0 (0.0%) |
| Total (Category) | 0 (0.0%) | 29 (100.0%) |
| Total (Overall) | 13 (30.9%) | 29 (69.1%) |
Services Occupations
The most common Services occupations in Coleville are , and Personal Care & Service (13 | 30.9%).
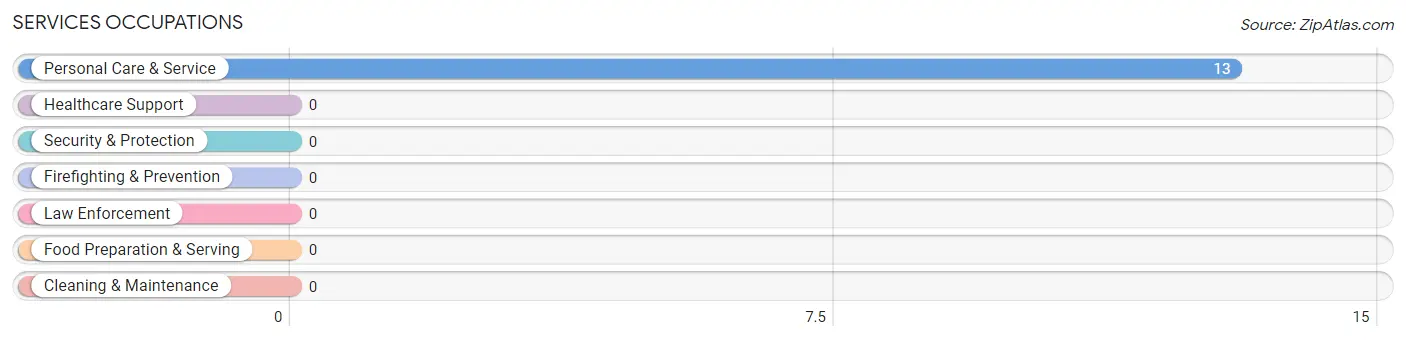
Services Occupations by Sex
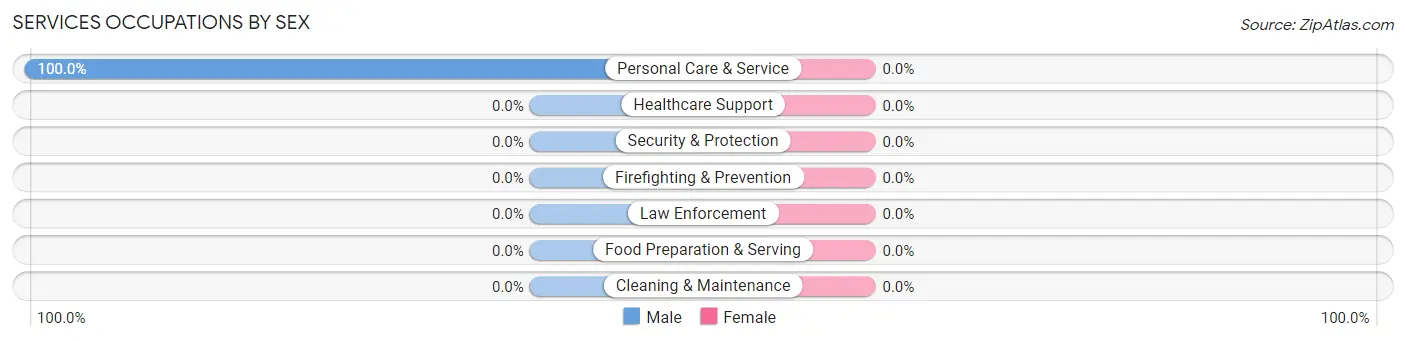
| Occupation | Male | Female |
| Healthcare Support | 0 (0.0%) | 0 (0.0%) |
| Security & Protection | 0 (0.0%) | 0 (0.0%) |
| Firefighting & Prevention | 0 (0.0%) | 0 (0.0%) |
| Law Enforcement | 0 (0.0%) | 0 (0.0%) |
| Food Preparation & Serving | 0 (0.0%) | 0 (0.0%) |
| Cleaning & Maintenance | 0 (0.0%) | 0 (0.0%) |
| Personal Care & Service | 13 (100.0%) | 0 (0.0%) |
| Total (Category) | 13 (100.0%) | 0 (0.0%) |
| Total (Overall) | 13 (30.9%) | 29 (69.1%) |
Sales and Office Occupations
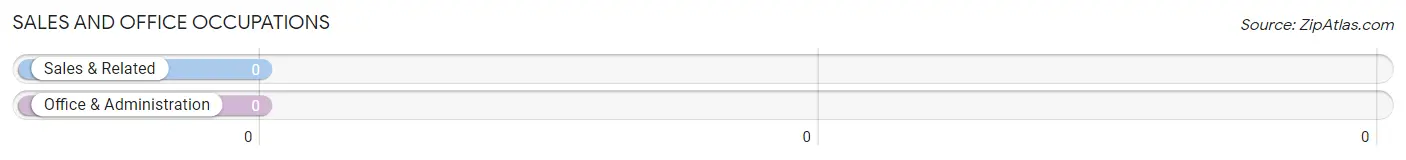
Sales and Office Occupations by Sex
| Occupation | Male | Female |
| Sales & Related | 0 (0.0%) | 0 (0.0%) |
| Office & Administration | 0 (0.0%) | 0 (0.0%) |
| Total (Category) | 0 (0.0%) | 0 (0.0%) |
| Total (Overall) | 13 (30.9%) | 29 (69.1%) |
Natural Resources, Construction and Maintenance Occupations
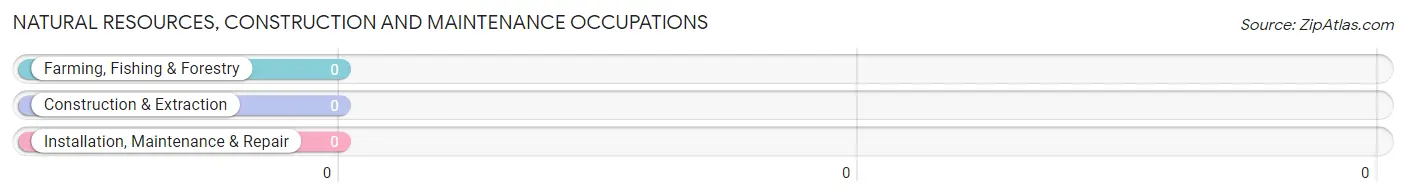
Natural Resources, Construction and Maintenance Occupations by Sex
| Occupation | Male | Female |
| Farming, Fishing & Forestry | 0 (0.0%) | 0 (0.0%) |
| Construction & Extraction | 0 (0.0%) | 0 (0.0%) |
| Installation, Maintenance & Repair | 0 (0.0%) | 0 (0.0%) |
| Total (Category) | 0 (0.0%) | 0 (0.0%) |
| Total (Overall) | 13 (30.9%) | 29 (69.1%) |
Production, Transportation and Moving Occupations
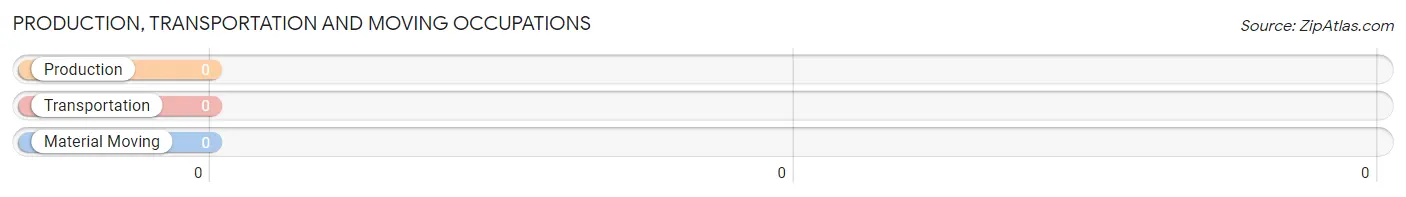
Production, Transportation and Moving Occupations by Sex
| Occupation | Male | Female |
| Production | 0 (0.0%) | 0 (0.0%) |
| Transportation | 0 (0.0%) | 0 (0.0%) |
| Material Moving | 0 (0.0%) | 0 (0.0%) |
| Total (Category) | 0 (0.0%) | 0 (0.0%) |
| Total (Overall) | 13 (30.9%) | 29 (69.1%) |
Employment Industries by Sex in Coleville
Employment Industries in Coleville
The major employment industries in Coleville include Health Care & Social Assistance (29 | 69.1%), and Agriculture, Fishing & Hunting (13 | 30.9%).
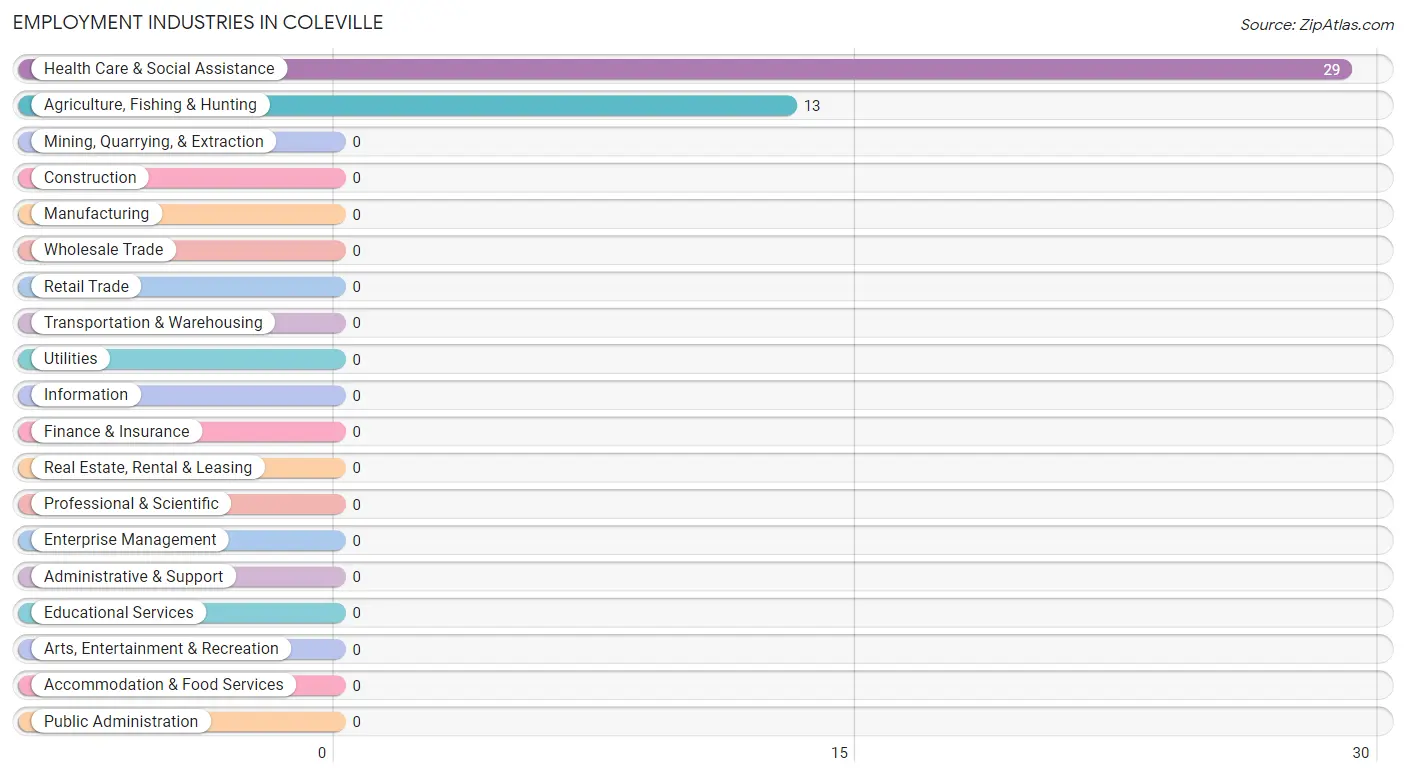
Employment Industries by Sex in Coleville
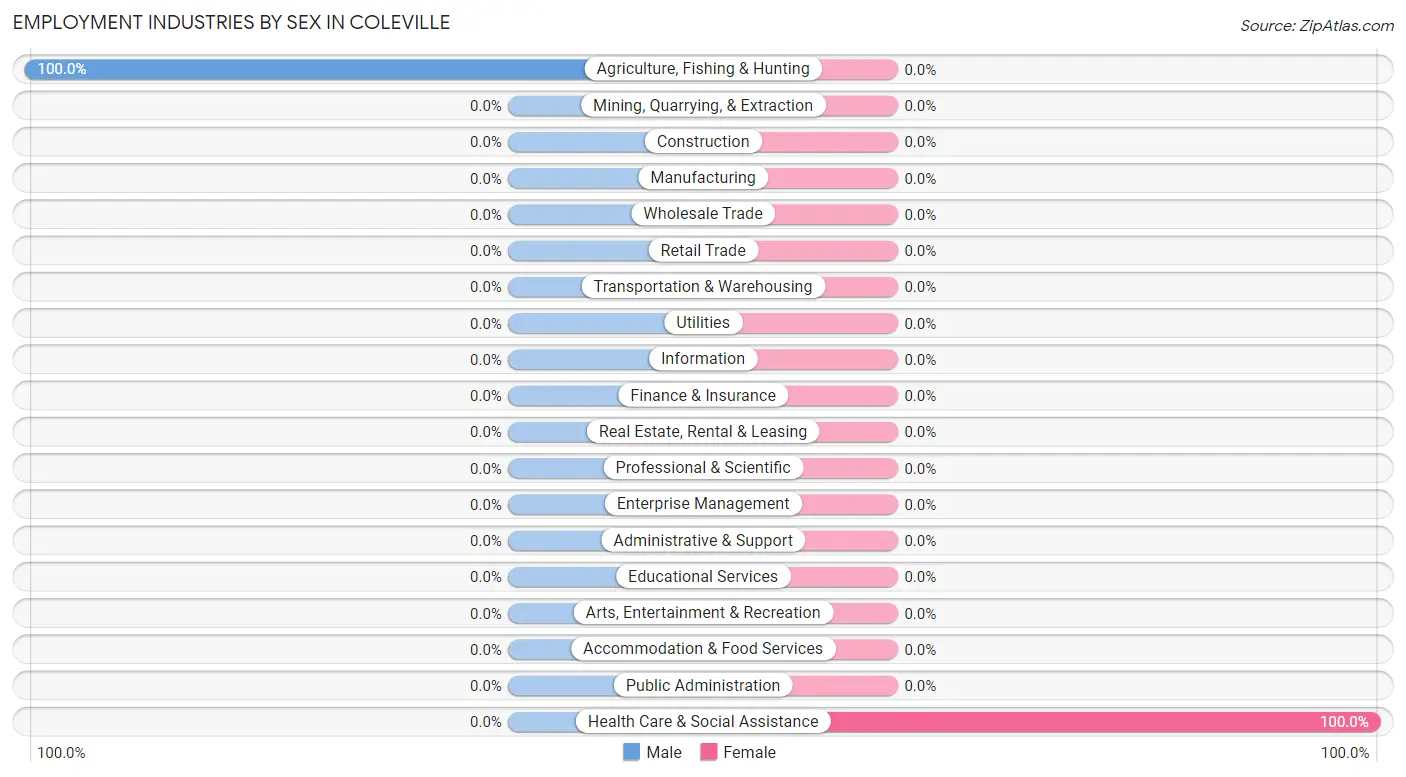
| Industry | Male | Female |
| Agriculture, Fishing & Hunting | 13 (100.0%) | 0 (0.0%) |
| Mining, Quarrying, & Extraction | 0 (0.0%) | 0 (0.0%) |
| Construction | 0 (0.0%) | 0 (0.0%) |
| Manufacturing | 0 (0.0%) | 0 (0.0%) |
| Wholesale Trade | 0 (0.0%) | 0 (0.0%) |
| Retail Trade | 0 (0.0%) | 0 (0.0%) |
| Transportation & Warehousing | 0 (0.0%) | 0 (0.0%) |
| Utilities | 0 (0.0%) | 0 (0.0%) |
| Information | 0 (0.0%) | 0 (0.0%) |
| Finance & Insurance | 0 (0.0%) | 0 (0.0%) |
| Real Estate, Rental & Leasing | 0 (0.0%) | 0 (0.0%) |
| Professional & Scientific | 0 (0.0%) | 0 (0.0%) |
| Enterprise Management | 0 (0.0%) | 0 (0.0%) |
| Administrative & Support | 0 (0.0%) | 0 (0.0%) |
| Educational Services | 0 (0.0%) | 0 (0.0%) |
| Health Care & Social Assistance | 0 (0.0%) | 29 (100.0%) |
| Arts, Entertainment & Recreation | 0 (0.0%) | 0 (0.0%) |
| Accommodation & Food Services | 0 (0.0%) | 0 (0.0%) |
| Public Administration | 0 (0.0%) | 0 (0.0%) |
| Total | 13 (30.9%) | 29 (69.1%) |
Education in Coleville
School Enrollment in Coleville
The most common levels of schooling among the 142 students in Coleville are middle school (93 | 65.5%), kindergarten (27 | 19.0%), and nursery / preschool (14 | 9.9%).
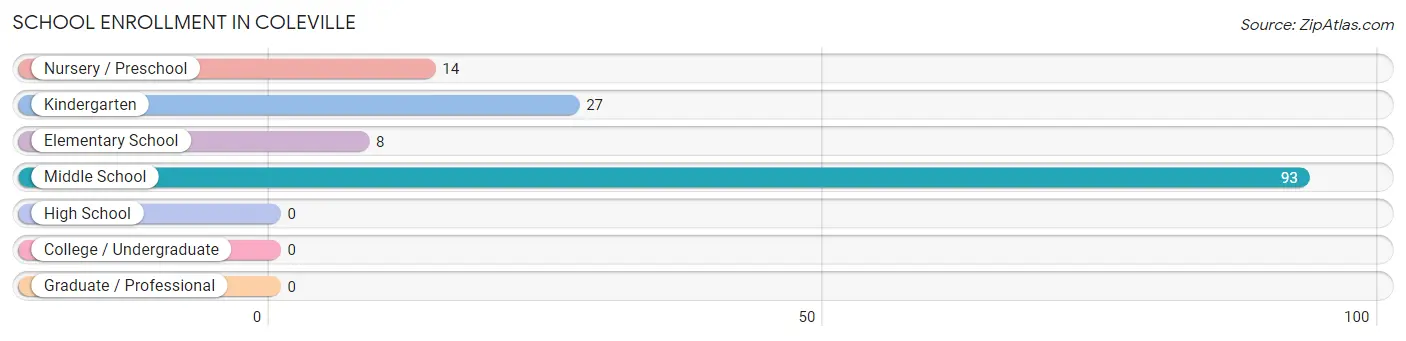
| School Level | # Students | % Students |
| Nursery / Preschool | 14 | 9.9% |
| Kindergarten | 27 | 19.0% |
| Elementary School | 8 | 5.6% |
| Middle School | 93 | 65.5% |
| High School | 0 | 0.0% |
| College / Undergraduate | 0 | 0.0% |
| Graduate / Professional | 0 | 0.0% |
| Total | 142 | 100.0% |
School Enrollment by Age by Funding Source in Coleville
Out of a total of 142 students who are enrolled in schools in Coleville, 20 (14.1%) attend a private institution, while the remaining 122 (85.9%) are enrolled in public schools. The age group of 10 to 14 year olds has the highest likelihood of being enrolled in private schools, with 20 (19.8% in the age bracket) enrolled. Conversely, the age group of 3 to 4 year olds has the lowest likelihood of being enrolled in a private school, with 14 (100.0% in the age bracket) attending a public institution.
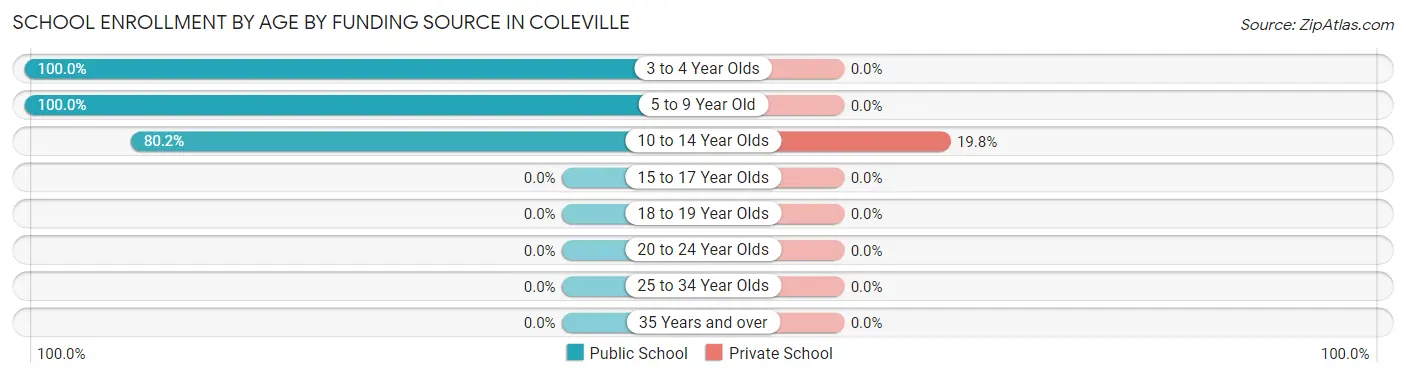
| Age Bracket | Public School | Private School |
| 3 to 4 Year Olds | 14 (100.0%) | 0 (0.0%) |
| 5 to 9 Year Old | 27 (100.0%) | 0 (0.0%) |
| 10 to 14 Year Olds | 81 (80.2%) | 20 (19.8%) |
| 15 to 17 Year Olds | 0 (0.0%) | 0 (0.0%) |
| 18 to 19 Year Olds | 0 (0.0%) | 0 (0.0%) |
| 20 to 24 Year Olds | 0 (0.0%) | 0 (0.0%) |
| 25 to 34 Year Olds | 0 (0.0%) | 0 (0.0%) |
| 35 Years and over | 0 (0.0%) | 0 (0.0%) |
| Total | 122 (85.9%) | 20 (14.1%) |
Educational Attainment by Field of Study in Coleville
Psychology (29 | 65.9%), and education (15 | 34.1%) are the most common fields of study among 44 individuals in Coleville who have obtained a bachelor's degree or higher.
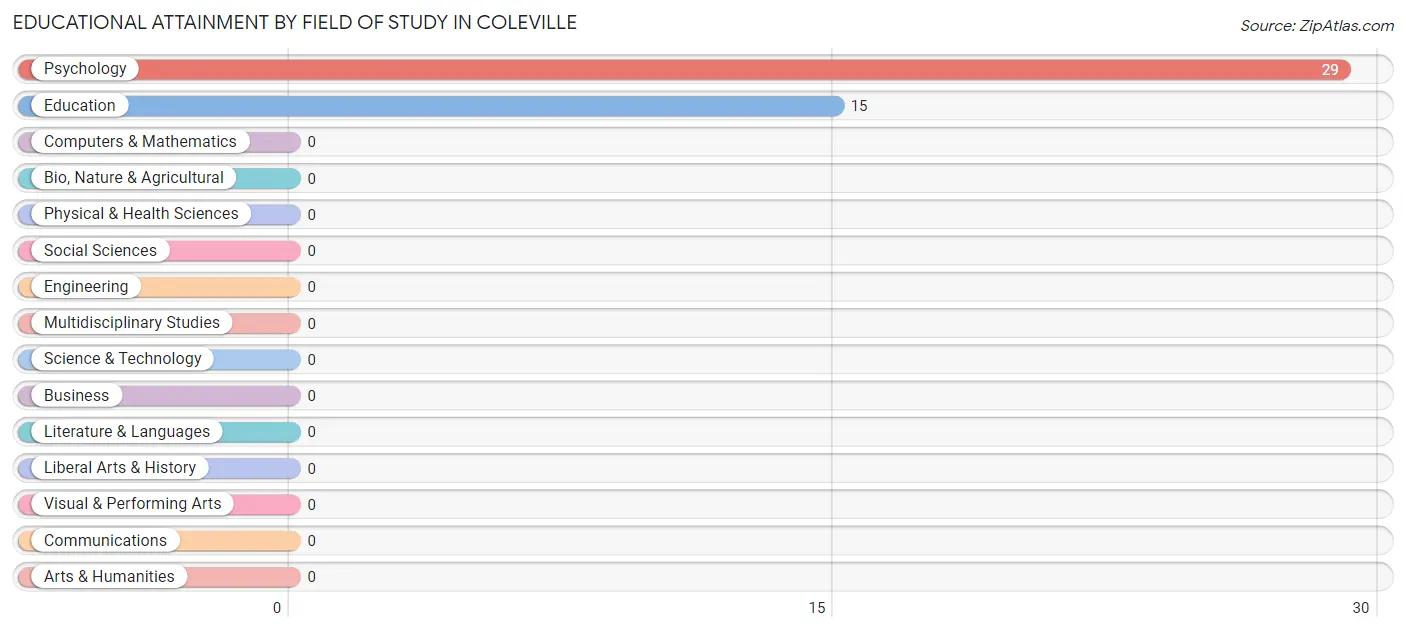
| Field of Study | # Graduates | % Graduates |
| Computers & Mathematics | 0 | 0.0% |
| Bio, Nature & Agricultural | 0 | 0.0% |
| Physical & Health Sciences | 0 | 0.0% |
| Psychology | 29 | 65.9% |
| Social Sciences | 0 | 0.0% |
| Engineering | 0 | 0.0% |
| Multidisciplinary Studies | 0 | 0.0% |
| Science & Technology | 0 | 0.0% |
| Business | 0 | 0.0% |
| Education | 15 | 34.1% |
| Literature & Languages | 0 | 0.0% |
| Liberal Arts & History | 0 | 0.0% |
| Visual & Performing Arts | 0 | 0.0% |
| Communications | 0 | 0.0% |
| Arts & Humanities | 0 | 0.0% |
| Total | 44 | 100.0% |
Transportation & Commute in Coleville
Vehicle Availability by Sex in Coleville
The most prevalent vehicle ownership categories in Coleville are males with 2 vehicles (87, accounting for 76.3%) and females with 2 vehicles (29, making up 300.0%).
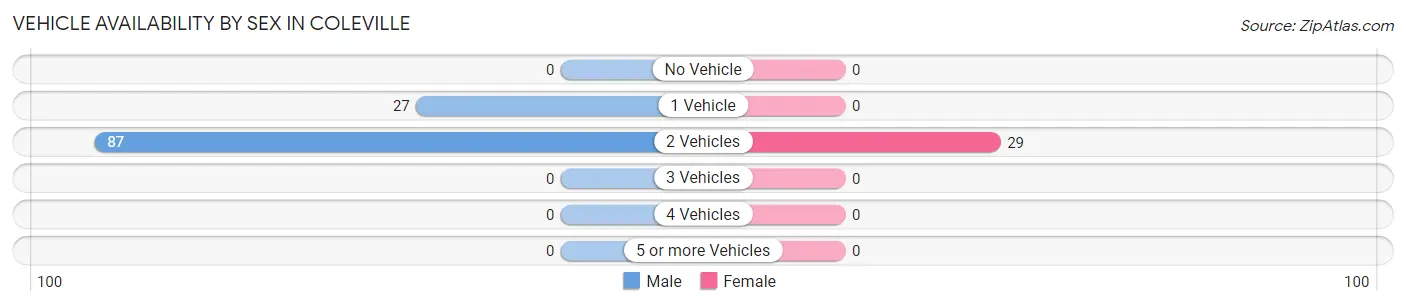
| Vehicles Available | Male | Female |
| No Vehicle | 0 (0.0%) | 0 (0.0%) |
| 1 Vehicle | 27 (23.7%) | 0 (0.0%) |
| 2 Vehicles | 87 (76.3%) | 29 (100.0%) |
| 3 Vehicles | 0 (0.0%) | 0 (0.0%) |
| 4 Vehicles | 0 (0.0%) | 0 (0.0%) |
| 5 or more Vehicles | 0 (0.0%) | 0 (0.0%) |
| Total | 114 (100.0%) | 29 (100.0%) |
Commute Time in Coleville
The most frequently occuring commute durations in Coleville are 30 to 34 minutes (76 commuters, 53.1%), 5 to 9 minutes (29 commuters, 20.3%), and 40 to 44 minutes (25 commuters, 17.5%).
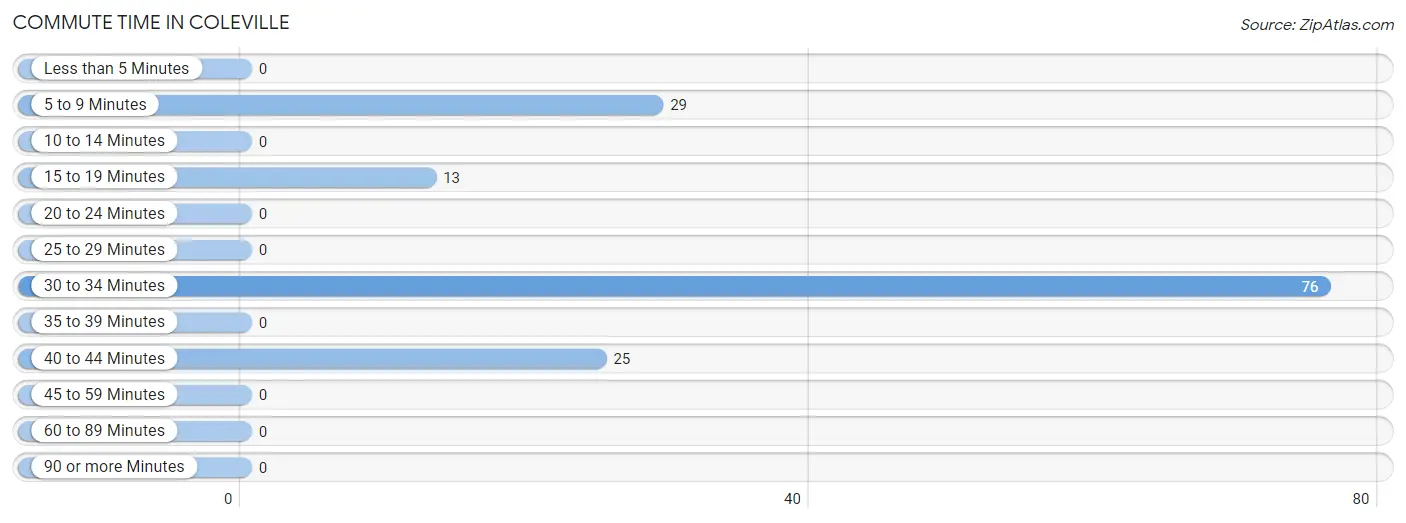
| Commute Time | # Commuters | % Commuters |
| Less than 5 Minutes | 0 | 0.0% |
| 5 to 9 Minutes | 29 | 20.3% |
| 10 to 14 Minutes | 0 | 0.0% |
| 15 to 19 Minutes | 13 | 9.1% |
| 20 to 24 Minutes | 0 | 0.0% |
| 25 to 29 Minutes | 0 | 0.0% |
| 30 to 34 Minutes | 76 | 53.1% |
| 35 to 39 Minutes | 0 | 0.0% |
| 40 to 44 Minutes | 25 | 17.5% |
| 45 to 59 Minutes | 0 | 0.0% |
| 60 to 89 Minutes | 0 | 0.0% |
| 90 or more Minutes | 0 | 0.0% |
Commute Time by Sex in Coleville
The most common commute times in Coleville are 30 to 34 minutes (76 commuters, 66.7%) for males and 5 to 9 minutes (29 commuters, 100.0%) for females.
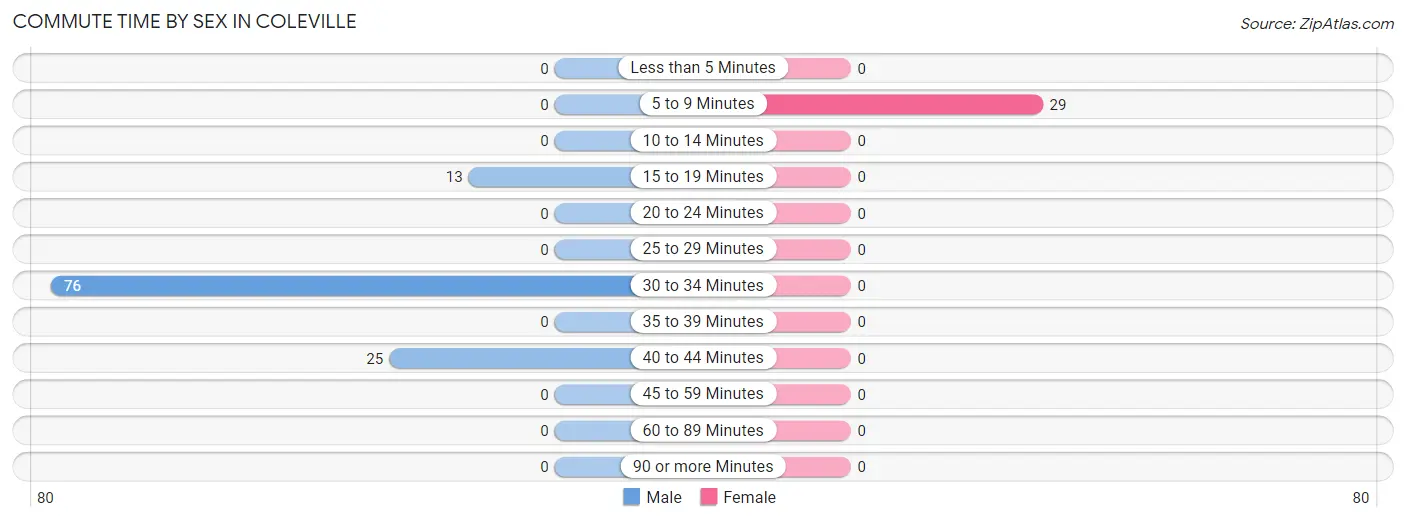
| Commute Time | Male | Female |
| Less than 5 Minutes | 0 (0.0%) | 0 (0.0%) |
| 5 to 9 Minutes | 0 (0.0%) | 29 (100.0%) |
| 10 to 14 Minutes | 0 (0.0%) | 0 (0.0%) |
| 15 to 19 Minutes | 13 (11.4%) | 0 (0.0%) |
| 20 to 24 Minutes | 0 (0.0%) | 0 (0.0%) |
| 25 to 29 Minutes | 0 (0.0%) | 0 (0.0%) |
| 30 to 34 Minutes | 76 (66.7%) | 0 (0.0%) |
| 35 to 39 Minutes | 0 (0.0%) | 0 (0.0%) |
| 40 to 44 Minutes | 25 (21.9%) | 0 (0.0%) |
| 45 to 59 Minutes | 0 (0.0%) | 0 (0.0%) |
| 60 to 89 Minutes | 0 (0.0%) | 0 (0.0%) |
| 90 or more Minutes | 0 (0.0%) | 0 (0.0%) |
Time of Departure to Work by Sex in Coleville
The most frequent times of departure to work in Coleville are 7:00 AM to 7:29 AM (54, 47.4%) for males and 6:30 AM to 6:59 AM (29, 100.0%) for females.
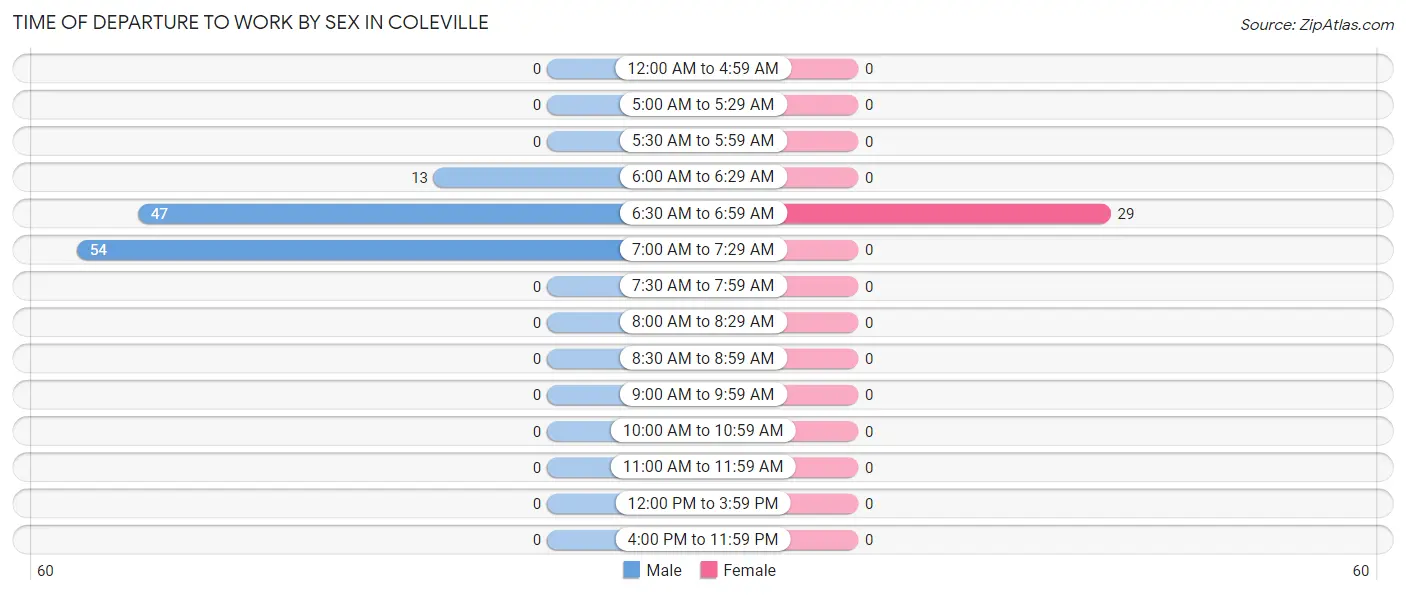
| Time of Departure | Male | Female |
| 12:00 AM to 4:59 AM | 0 (0.0%) | 0 (0.0%) |
| 5:00 AM to 5:29 AM | 0 (0.0%) | 0 (0.0%) |
| 5:30 AM to 5:59 AM | 0 (0.0%) | 0 (0.0%) |
| 6:00 AM to 6:29 AM | 13 (11.4%) | 0 (0.0%) |
| 6:30 AM to 6:59 AM | 47 (41.2%) | 29 (100.0%) |
| 7:00 AM to 7:29 AM | 54 (47.4%) | 0 (0.0%) |
| 7:30 AM to 7:59 AM | 0 (0.0%) | 0 (0.0%) |
| 8:00 AM to 8:29 AM | 0 (0.0%) | 0 (0.0%) |
| 8:30 AM to 8:59 AM | 0 (0.0%) | 0 (0.0%) |
| 9:00 AM to 9:59 AM | 0 (0.0%) | 0 (0.0%) |
| 10:00 AM to 10:59 AM | 0 (0.0%) | 0 (0.0%) |
| 11:00 AM to 11:59 AM | 0 (0.0%) | 0 (0.0%) |
| 12:00 PM to 3:59 PM | 0 (0.0%) | 0 (0.0%) |
| 4:00 PM to 11:59 PM | 0 (0.0%) | 0 (0.0%) |
| Total | 114 (100.0%) | 29 (100.0%) |
Housing Occupancy in Coleville
Occupancy by Ownership in Coleville
Of the total 126 dwellings in Coleville, owner-occupied units account for 12 (9.5%), while renter-occupied units make up 114 (90.5%).
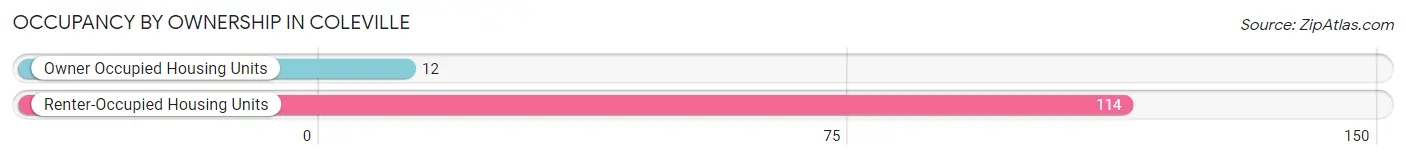
| Occupancy | # Housing Units | % Housing Units |
| Owner Occupied Housing Units | 12 | 9.5% |
| Renter-Occupied Housing Units | 114 | 90.5% |
| Total Occupied Housing Units | 126 | 100.0% |
Occupancy by Household Size in Coleville
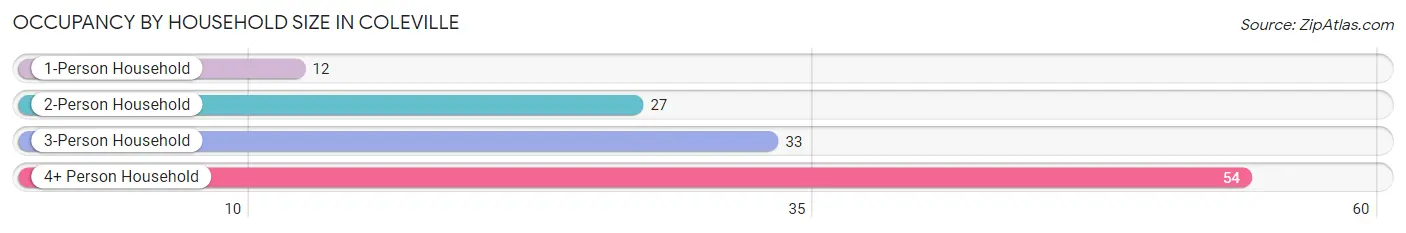
| Household Size | # Housing Units | % Housing Units |
| 1-Person Household | 12 | 9.5% |
| 2-Person Household | 27 | 21.4% |
| 3-Person Household | 33 | 26.2% |
| 4+ Person Household | 54 | 42.9% |
| Total Housing Units | 126 | 100.0% |
Occupancy by Ownership by Household Size in Coleville
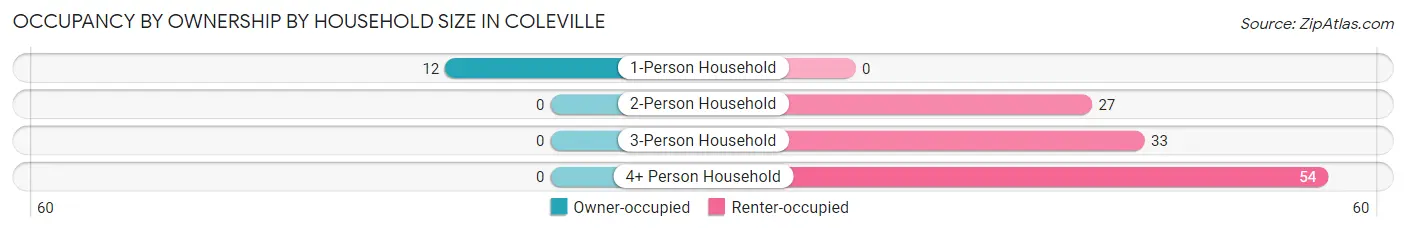
| Household Size | Owner-occupied | Renter-occupied |
| 1-Person Household | 12 (100.0%) | 0 (0.0%) |
| 2-Person Household | 0 (0.0%) | 27 (100.0%) |
| 3-Person Household | 0 (0.0%) | 33 (100.0%) |
| 4+ Person Household | 0 (0.0%) | 54 (100.0%) |
| Total Housing Units | 12 (9.5%) | 114 (90.5%) |
Occupancy by Educational Attainment in Coleville
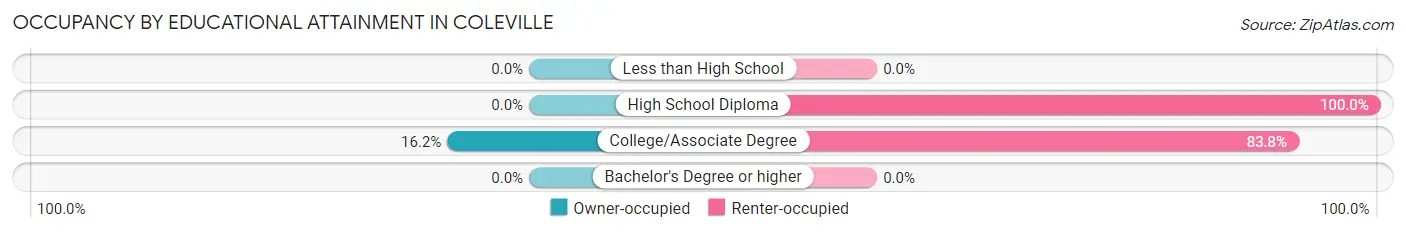
| Household Size | Owner-occupied | Renter-occupied |
| Less than High School | 0 (0.0%) | 0 (0.0%) |
| High School Diploma | 0 (0.0%) | 52 (100.0%) |
| College/Associate Degree | 12 (16.2%) | 62 (83.8%) |
| Bachelor's Degree or higher | 0 (0.0%) | 0 (0.0%) |
Occupancy by Age of Householder in Coleville
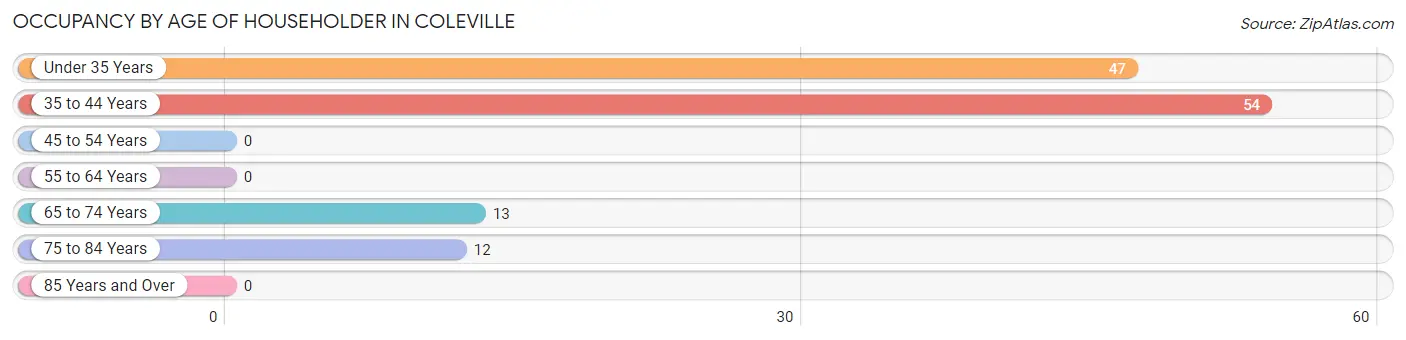
| Age Bracket | # Households | % Households |
| Under 35 Years | 47 | 37.3% |
| 35 to 44 Years | 54 | 42.9% |
| 45 to 54 Years | 0 | 0.0% |
| 55 to 64 Years | 0 | 0.0% |
| 65 to 74 Years | 13 | 10.3% |
| 75 to 84 Years | 12 | 9.5% |
| 85 Years and Over | 0 | 0.0% |
| Total | 126 | 100.0% |
Housing Finances in Coleville
Median Income by Occupancy in Coleville
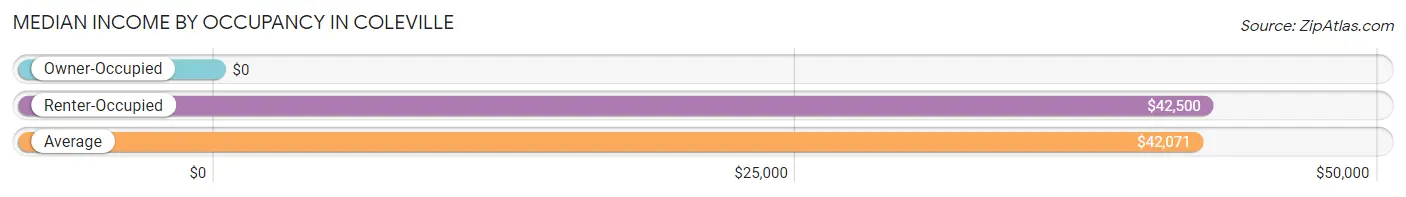
| Occupancy Type | # Households | Median Income |
| Owner-Occupied | 12 (9.5%) | $0 |
| Renter-Occupied | 114 (90.5%) | $42,500 |
| Average | 126 (100.0%) | $42,071 |
Occupancy by Householder Income Bracket in Coleville
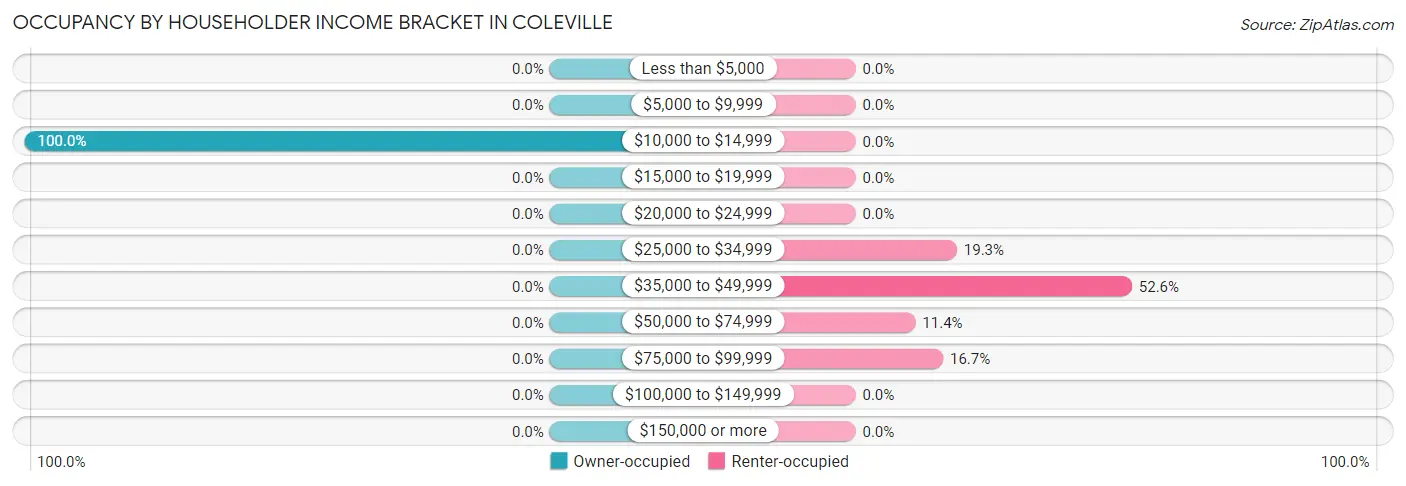
| Income Bracket | Owner-occupied | Renter-occupied |
| Less than $5,000 | 0 (0.0%) | 0 (0.0%) |
| $5,000 to $9,999 | 0 (0.0%) | 0 (0.0%) |
| $10,000 to $14,999 | 12 (100.0%) | 0 (0.0%) |
| $15,000 to $19,999 | 0 (0.0%) | 0 (0.0%) |
| $20,000 to $24,999 | 0 (0.0%) | 0 (0.0%) |
| $25,000 to $34,999 | 0 (0.0%) | 22 (19.3%) |
| $35,000 to $49,999 | 0 (0.0%) | 60 (52.6%) |
| $50,000 to $74,999 | 0 (0.0%) | 13 (11.4%) |
| $75,000 to $99,999 | 0 (0.0%) | 19 (16.7%) |
| $100,000 to $149,999 | 0 (0.0%) | 0 (0.0%) |
| $150,000 or more | 0 (0.0%) | 0 (0.0%) |
| Total | 12 (100.0%) | 114 (100.0%) |
Monthly Housing Cost Tiers in Coleville
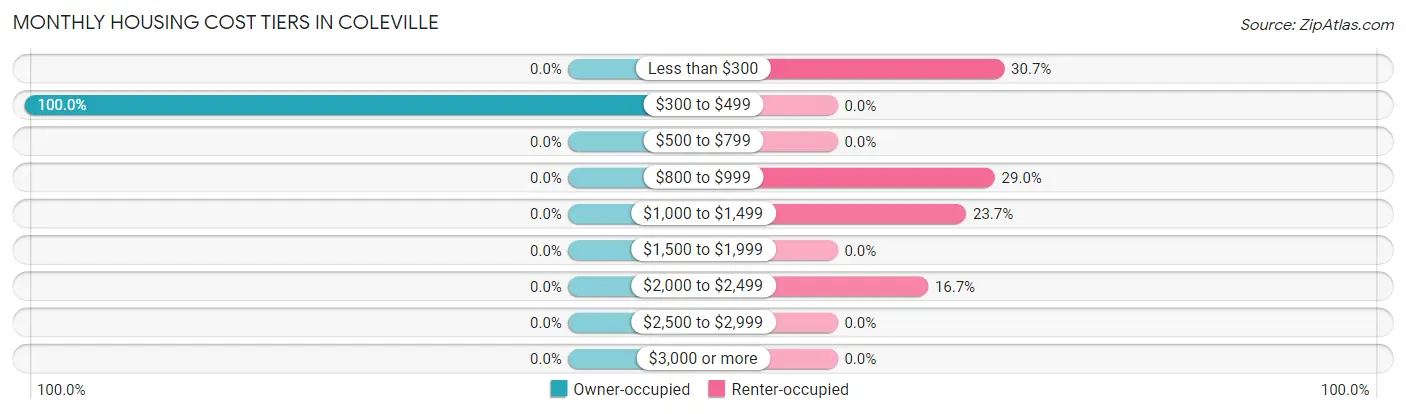
| Monthly Cost | Owner-occupied | Renter-occupied |
| Less than $300 | 0 (0.0%) | 35 (30.7%) |
| $300 to $499 | 12 (100.0%) | 0 (0.0%) |
| $500 to $799 | 0 (0.0%) | 0 (0.0%) |
| $800 to $999 | 0 (0.0%) | 33 (28.9%) |
| $1,000 to $1,499 | 0 (0.0%) | 27 (23.7%) |
| $1,500 to $1,999 | 0 (0.0%) | 0 (0.0%) |
| $2,000 to $2,499 | 0 (0.0%) | 19 (16.7%) |
| $2,500 to $2,999 | 0 (0.0%) | 0 (0.0%) |
| $3,000 or more | 0 (0.0%) | 0 (0.0%) |
| Total | 12 (100.0%) | 114 (100.0%) |
Physical Housing Characteristics in Coleville
Housing Structures in Coleville
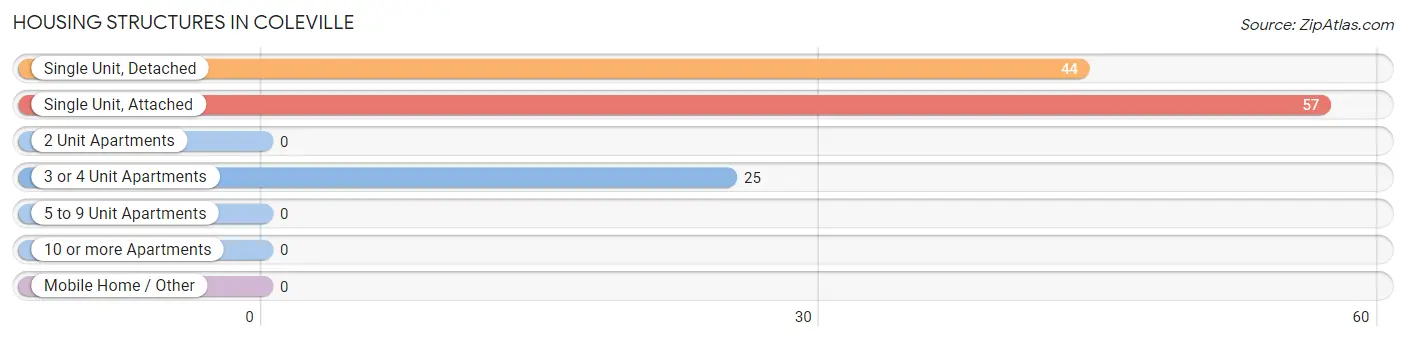
| Structure Type | # Housing Units | % Housing Units |
| Single Unit, Detached | 44 | 34.9% |
| Single Unit, Attached | 57 | 45.2% |
| 2 Unit Apartments | 0 | 0.0% |
| 3 or 4 Unit Apartments | 25 | 19.8% |
| 5 to 9 Unit Apartments | 0 | 0.0% |
| 10 or more Apartments | 0 | 0.0% |
| Mobile Home / Other | 0 | 0.0% |
| Total | 126 | 100.0% |
Housing Structures by Occupancy in Coleville
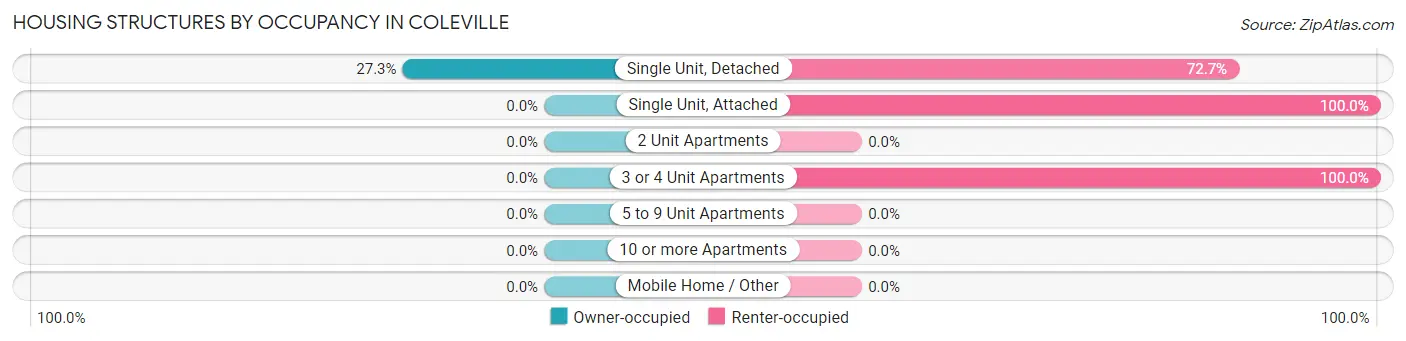
| Structure Type | Owner-occupied | Renter-occupied |
| Single Unit, Detached | 12 (27.3%) | 32 (72.7%) |
| Single Unit, Attached | 0 (0.0%) | 57 (100.0%) |
| 2 Unit Apartments | 0 (0.0%) | 0 (0.0%) |
| 3 or 4 Unit Apartments | 0 (0.0%) | 25 (100.0%) |
| 5 to 9 Unit Apartments | 0 (0.0%) | 0 (0.0%) |
| 10 or more Apartments | 0 (0.0%) | 0 (0.0%) |
| Mobile Home / Other | 0 (0.0%) | 0 (0.0%) |
| Total | 12 (9.5%) | 114 (90.5%) |
Housing Structures by Number of Rooms in Coleville
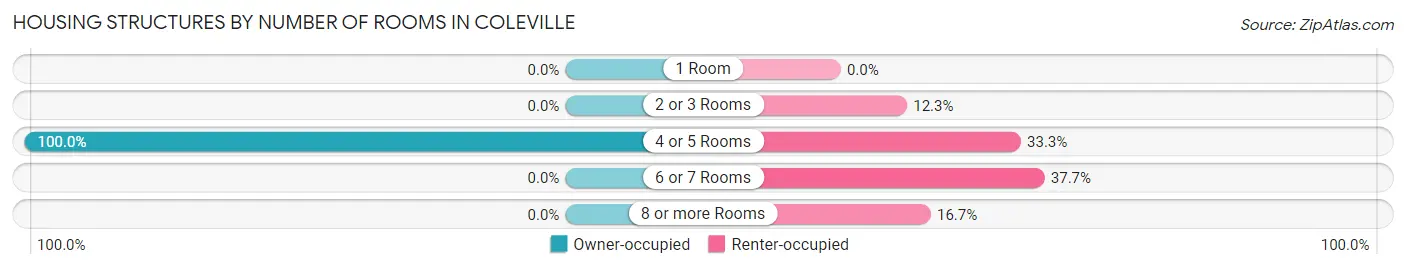
| Number of Rooms | Owner-occupied | Renter-occupied |
| 1 Room | 0 (0.0%) | 0 (0.0%) |
| 2 or 3 Rooms | 0 (0.0%) | 14 (12.3%) |
| 4 or 5 Rooms | 12 (100.0%) | 38 (33.3%) |
| 6 or 7 Rooms | 0 (0.0%) | 43 (37.7%) |
| 8 or more Rooms | 0 (0.0%) | 19 (16.7%) |
| Total | 12 (100.0%) | 114 (100.0%) |
Housing Structure by Heating Type in Coleville
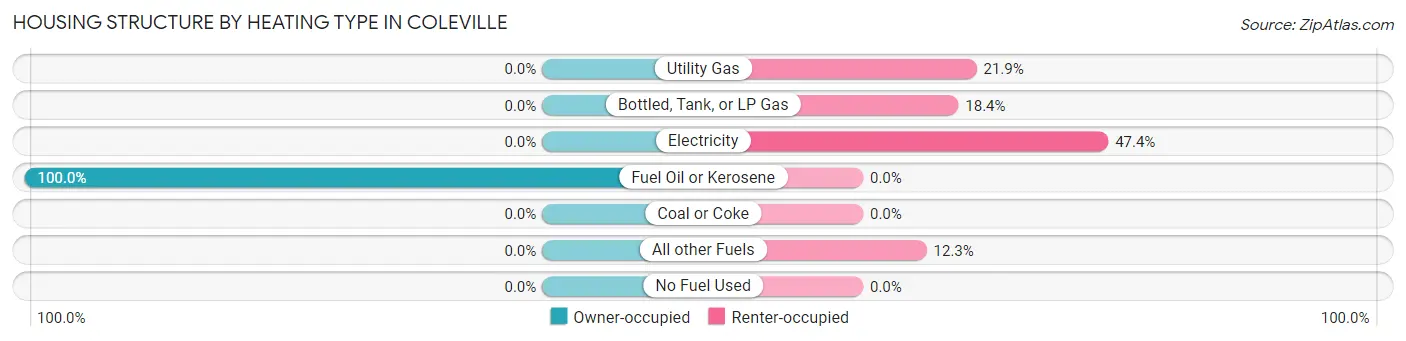
| Heating Type | Owner-occupied | Renter-occupied |
| Utility Gas | 0 (0.0%) | 25 (21.9%) |
| Bottled, Tank, or LP Gas | 0 (0.0%) | 21 (18.4%) |
| Electricity | 0 (0.0%) | 54 (47.4%) |
| Fuel Oil or Kerosene | 12 (100.0%) | 0 (0.0%) |
| Coal or Coke | 0 (0.0%) | 0 (0.0%) |
| All other Fuels | 0 (0.0%) | 14 (12.3%) |
| No Fuel Used | 0 (0.0%) | 0 (0.0%) |
| Total | 12 (100.0%) | 114 (100.0%) |
Household Vehicle Usage in Coleville
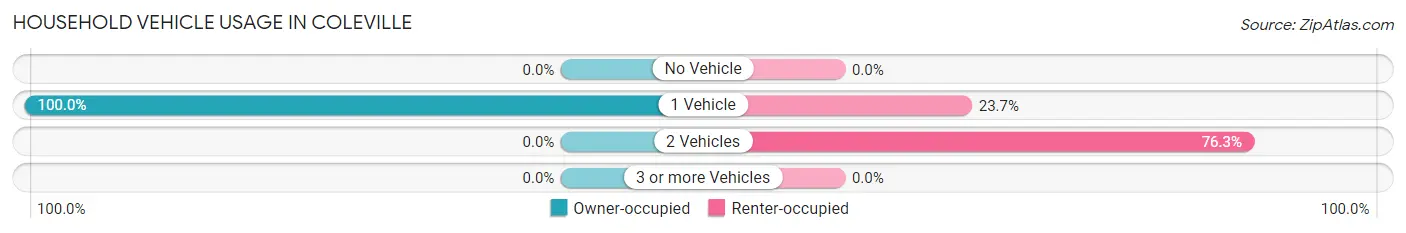
| Vehicles per Household | Owner-occupied | Renter-occupied |
| No Vehicle | 0 (0.0%) | 0 (0.0%) |
| 1 Vehicle | 12 (100.0%) | 27 (23.7%) |
| 2 Vehicles | 0 (0.0%) | 87 (76.3%) |
| 3 or more Vehicles | 0 (0.0%) | 0 (0.0%) |
| Total | 12 (100.0%) | 114 (100.0%) |
Real Estate & Mortgages in Coleville
Real Estate and Mortgage Overview in Coleville
| Characteristic | Without Mortgage | With Mortgage |
| Housing Units | 12 | 0 |
| Median Property Value | - | - |
| Median Household Income | - | - |
| Monthly Housing Costs | - | - |
| Real Estate Taxes | - | - |
Property Value by Mortgage Status in Coleville
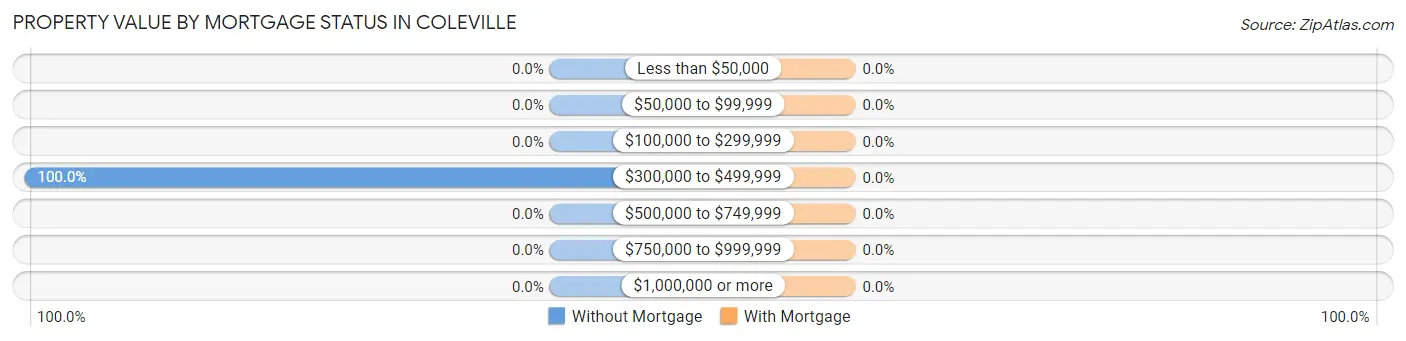
| Property Value | Without Mortgage | With Mortgage |
| Less than $50,000 | 0 (0.0%) | 0 (0.0%) |
| $50,000 to $99,999 | 0 (0.0%) | 0 (0.0%) |
| $100,000 to $299,999 | 0 (0.0%) | 0 (0.0%) |
| $300,000 to $499,999 | 12 (100.0%) | 0 (0.0%) |
| $500,000 to $749,999 | 0 (0.0%) | 0 (0.0%) |
| $750,000 to $999,999 | 0 (0.0%) | 0 (0.0%) |
| $1,000,000 or more | 0 (0.0%) | 0 (0.0%) |
| Total | 12 (100.0%) | 0 (0.0%) |
Household Income by Mortgage Status in Coleville
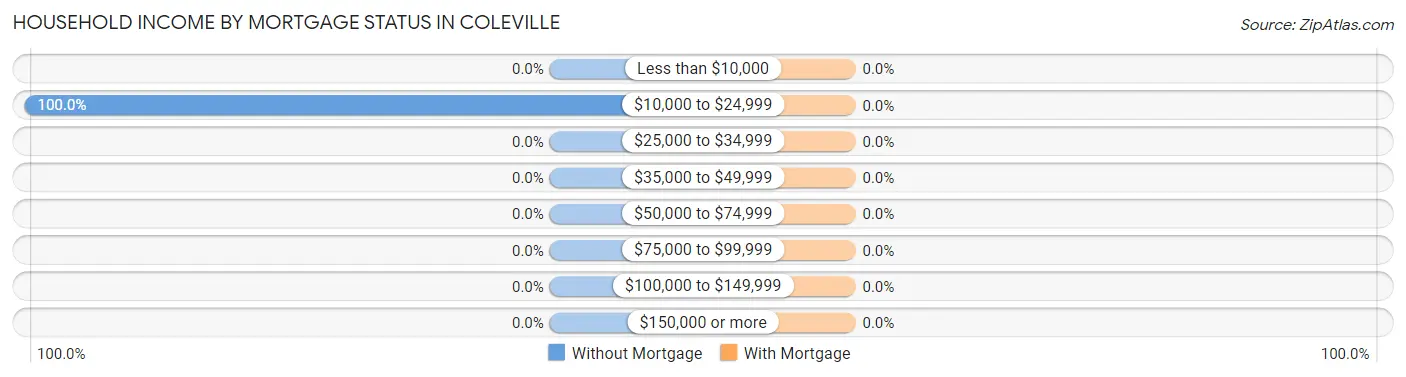
| Household Income | Without Mortgage | With Mortgage |
| Less than $10,000 | 0 (0.0%) | 0 (0.0%) |
| $10,000 to $24,999 | 12 (100.0%) | 0 (0.0%) |
| $25,000 to $34,999 | 0 (0.0%) | 0 (0.0%) |
| $35,000 to $49,999 | 0 (0.0%) | 0 (0.0%) |
| $50,000 to $74,999 | 0 (0.0%) | 0 (0.0%) |
| $75,000 to $99,999 | 0 (0.0%) | 0 (0.0%) |
| $100,000 to $149,999 | 0 (0.0%) | 0 (0.0%) |
| $150,000 or more | 0 (0.0%) | 0 (0.0%) |
| Total | 12 (100.0%) | 0 (0.0%) |
Property Value to Household Income Ratio in Coleville
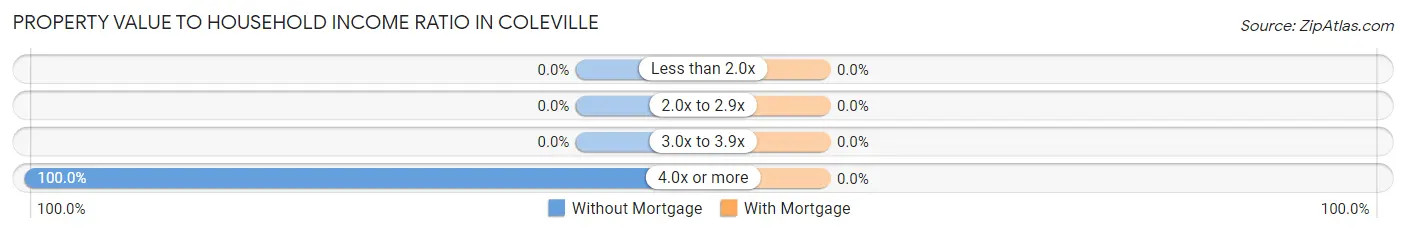
| Value-to-Income Ratio | Without Mortgage | With Mortgage |
| Less than 2.0x | 0 (0.0%) | 0 (0.0%) |
| 2.0x to 2.9x | 0 (0.0%) | 0 (0.0%) |
| 3.0x to 3.9x | 0 (0.0%) | 0 (0.0%) |
| 4.0x or more | 12 (100.0%) | 0 (0.0%) |
| Total | 12 (100.0%) | 0 (0.0%) |
Real Estate Taxes by Mortgage Status in Coleville
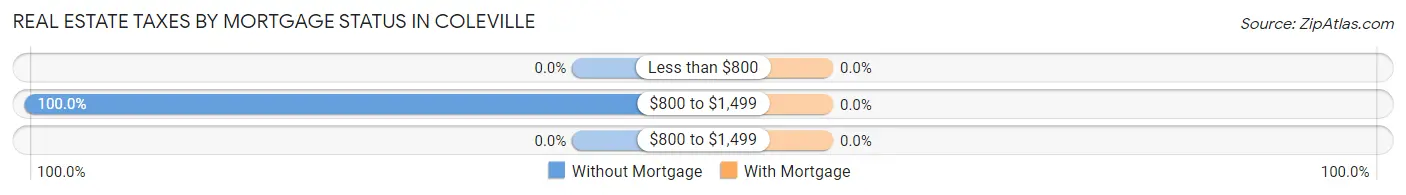
| Property Taxes | Without Mortgage | With Mortgage |
| Less than $800 | 0 (0.0%) | 0 (0.0%) |
| $800 to $1,499 | 12 (100.0%) | 0 (0.0%) |
| $800 to $1,499 | 0 (0.0%) | 0 (0.0%) |
| Total | 12 (100.0%) | 0 (0.0%) |
Health & Disability in Coleville
Health Insurance Coverage by Age in Coleville
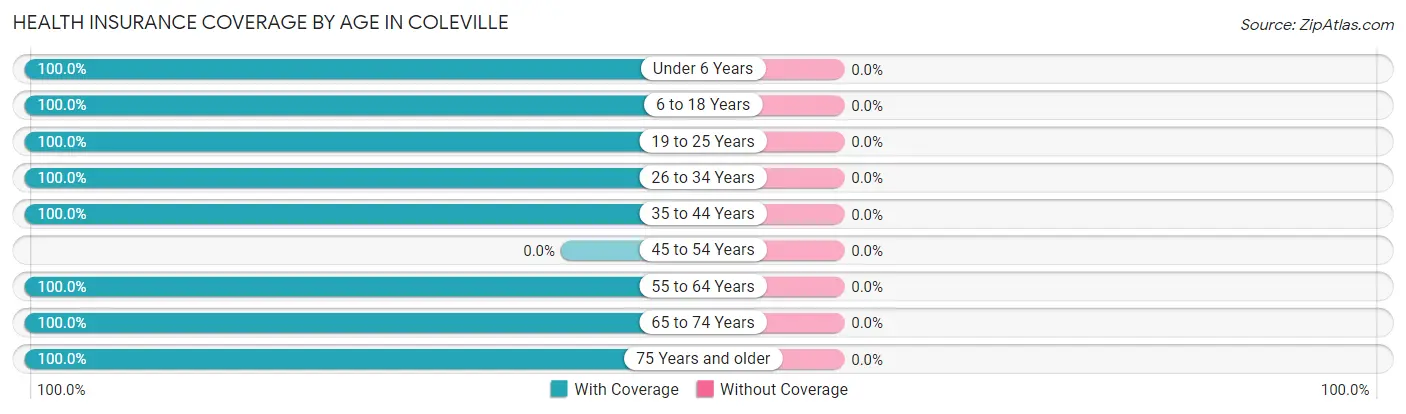
| Age Bracket | With Coverage | Without Coverage |
| Under 6 Years | 56 (100.0%) | 0 (0.0%) |
| 6 to 18 Years | 101 (100.0%) | 0 (0.0%) |
| 19 to 25 Years | 26 (100.0%) | 0 (0.0%) |
| 26 to 34 Years | 51 (100.0%) | 0 (0.0%) |
| 35 to 44 Years | 15 (100.0%) | 0 (0.0%) |
| 45 to 54 Years | 0 (0.0%) | 0 (0.0%) |
| 55 to 64 Years | 13 (100.0%) | 0 (0.0%) |
| 65 to 74 Years | 13 (100.0%) | 0 (0.0%) |
| 75 Years and older | 12 (100.0%) | 0 (0.0%) |
| Total | 287 (100.0%) | 0 (0.0%) |
Health Insurance Coverage by Citizenship Status in Coleville
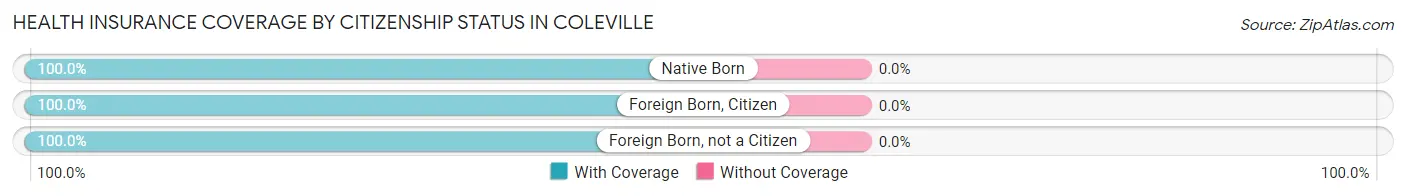
| Citizenship Status | With Coverage | Without Coverage |
| Native Born | 56 (100.0%) | 0 (0.0%) |
| Foreign Born, Citizen | 101 (100.0%) | 0 (0.0%) |
| Foreign Born, not a Citizen | 26 (100.0%) | 0 (0.0%) |
Health Insurance Coverage by Household Income in Coleville
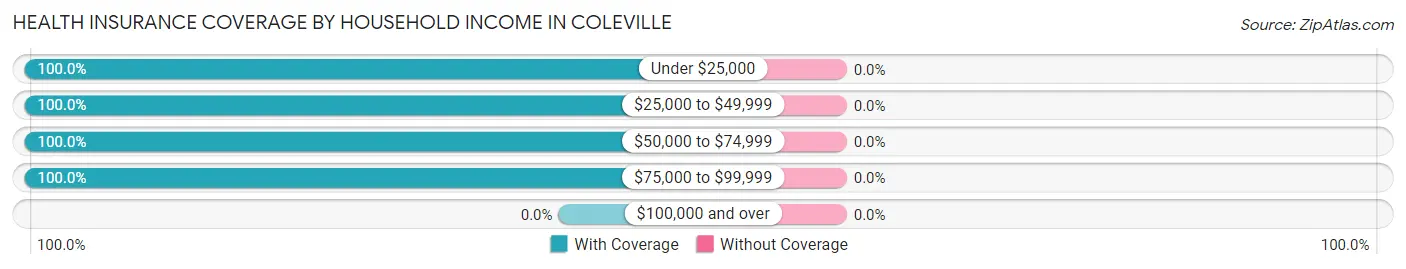
| Household Income | With Coverage | Without Coverage |
| Under $25,000 | 12 (100.0%) | 0 (0.0%) |
| $25,000 to $49,999 | 214 (100.0%) | 0 (0.0%) |
| $50,000 to $74,999 | 26 (100.0%) | 0 (0.0%) |
| $75,000 to $99,999 | 35 (100.0%) | 0 (0.0%) |
| $100,000 and over | 0 (0.0%) | 0 (0.0%) |
Public vs Private Health Insurance Coverage by Age in Coleville
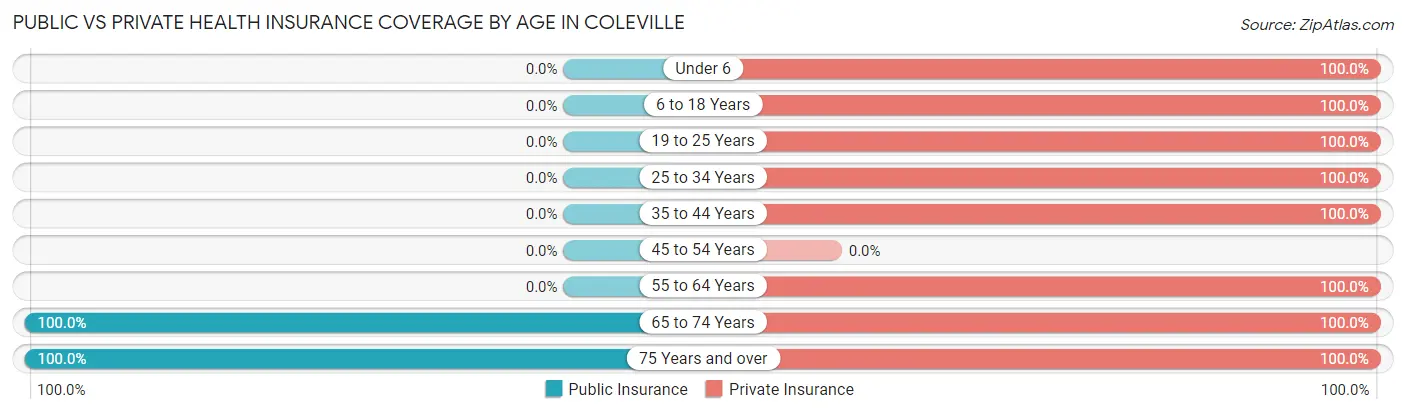
| Age Bracket | Public Insurance | Private Insurance |
| Under 6 | 0 (0.0%) | 56 (100.0%) |
| 6 to 18 Years | 0 (0.0%) | 101 (100.0%) |
| 19 to 25 Years | 0 (0.0%) | 26 (100.0%) |
| 25 to 34 Years | 0 (0.0%) | 51 (100.0%) |
| 35 to 44 Years | 0 (0.0%) | 15 (100.0%) |
| 45 to 54 Years | 0 (0.0%) | 0 (0.0%) |
| 55 to 64 Years | 0 (0.0%) | 13 (100.0%) |
| 65 to 74 Years | 13 (100.0%) | 13 (100.0%) |
| 75 Years and over | 12 (100.0%) | 12 (100.0%) |
| Total | 25 (8.7%) | 287 (100.0%) |
Disability Status by Sex by Age in Coleville
| Age Bracket | Male | Female |
| Under 5 Years | 0 (0.0%) | 0 (0.0%) |
| 5 to 17 Years | 0 (0.0%) | 0 (0.0%) |
| 18 to 34 Years | 0 (0.0%) | 0 (0.0%) |
| 35 to 64 Years | 0 (0.0%) | 0 (0.0%) |
| 65 to 74 Years | 0 (0.0%) | 0 (0.0%) |
| 75 Years and over | 0 (0.0%) | 0 (0.0%) |
Disability Class by Sex by Age in Coleville
Disability Class: Hearing Difficulty
| Age Bracket | Male | Female |
| Under 5 Years | 0 (0.0%) | 0 (0.0%) |
| 5 to 17 Years | 0 (0.0%) | 0 (0.0%) |
| 18 to 34 Years | 0 (0.0%) | 0 (0.0%) |
| 35 to 64 Years | 0 (0.0%) | 0 (0.0%) |
| 65 to 74 Years | 0 (0.0%) | 0 (0.0%) |
| 75 Years and over | 0 (0.0%) | 0 (0.0%) |
Disability Class: Vision Difficulty
| Age Bracket | Male | Female |
| Under 5 Years | 0 (0.0%) | 0 (0.0%) |
| 5 to 17 Years | 0 (0.0%) | 0 (0.0%) |
| 18 to 34 Years | 0 (0.0%) | 0 (0.0%) |
| 35 to 64 Years | 0 (0.0%) | 0 (0.0%) |
| 65 to 74 Years | 0 (0.0%) | 0 (0.0%) |
| 75 Years and over | 0 (0.0%) | 0 (0.0%) |
Disability Class: Cognitive Difficulty
| Age Bracket | Male | Female |
| 5 to 17 Years | 0 (0.0%) | 0 (0.0%) |
| 18 to 34 Years | 0 (0.0%) | 0 (0.0%) |
| 35 to 64 Years | 0 (0.0%) | 0 (0.0%) |
| 65 to 74 Years | 0 (0.0%) | 0 (0.0%) |
| 75 Years and over | 0 (0.0%) | 0 (0.0%) |
Disability Class: Ambulatory Difficulty
| Age Bracket | Male | Female |
| 5 to 17 Years | 0 (0.0%) | 0 (0.0%) |
| 18 to 34 Years | 0 (0.0%) | 0 (0.0%) |
| 35 to 64 Years | 0 (0.0%) | 0 (0.0%) |
| 65 to 74 Years | 0 (0.0%) | 0 (0.0%) |
| 75 Years and over | 0 (0.0%) | 0 (0.0%) |
Disability Class: Self-Care Difficulty

| Age Bracket | Male | Female |
| 5 to 17 Years | 0 (0.0%) | 0 (0.0%) |
| 18 to 34 Years | 0 (0.0%) | 0 (0.0%) |
| 35 to 64 Years | 0 (0.0%) | 0 (0.0%) |
| 65 to 74 Years | 0 (0.0%) | 0 (0.0%) |
| 75 Years and over | 0 (0.0%) | 0 (0.0%) |
Technology Access in Coleville
Computing Device Access in Coleville
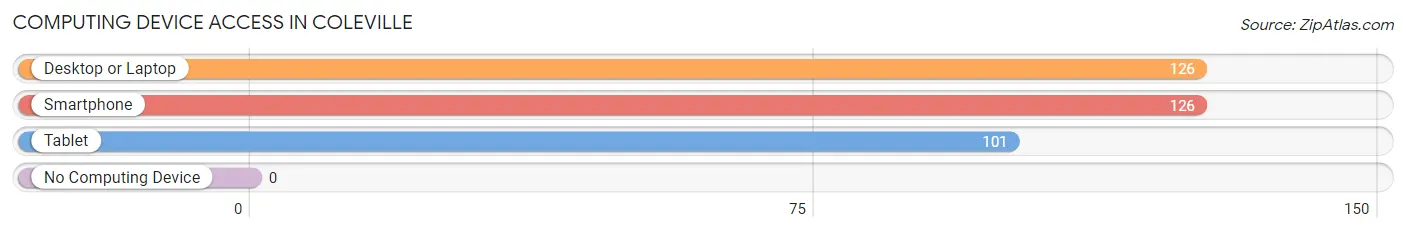
| Device Type | # Households | % Households |
| Desktop or Laptop | 126 | 100.0% |
| Smartphone | 126 | 100.0% |
| Tablet | 101 | 80.2% |
| No Computing Device | 0 | 0.0% |
| Total | 126 | 100.0% |
Internet Access in Coleville
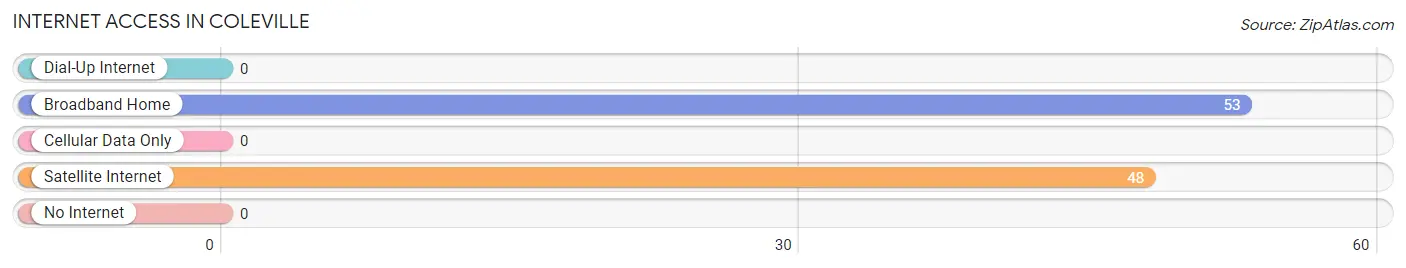
| Internet Type | # Households | % Households |
| Dial-Up Internet | 0 | 0.0% |
| Broadband Home | 53 | 42.1% |
| Cellular Data Only | 0 | 0.0% |
| Satellite Internet | 48 | 38.1% |
| No Internet | 0 | 0.0% |
| Total | 126 | 100.0% |
Coleville Summary
Coleville is a small unincorporated community located in Mono County, California. It is situated in the Sierra Nevada mountain range, approximately 20 miles east of Bridgeport. The town is located at an elevation of 6,400 feet and has a population of approximately 200 people.
History
Coleville was founded in 1864 by a group of miners who were searching for gold in the area. The town was named after one of the miners, William Cole. The town quickly grew and by 1868, it had a population of over 500 people. The town was home to several businesses, including a hotel, saloon, and general store.
In 1872, the town was destroyed by a fire that started in the saloon. The town was rebuilt, but the population never returned to its previous level. In the late 1800s, the town became a center for logging and ranching.
Geography
Coleville is located in the Sierra Nevada mountain range, approximately 20 miles east of Bridgeport. The town is situated at an elevation of 6,400 feet. The town is surrounded by the Toiyabe National Forest and is located near the headwaters of the Walker River.
The climate in Coleville is semi-arid, with hot summers and cold winters. The average annual temperature is approximately 50 degrees Fahrenheit. The average annual precipitation is approximately 10 inches.
Economy
The economy of Coleville is largely based on tourism and ranching. The town is a popular destination for outdoor recreation, such as fishing, hunting, and camping. The town is also home to several small businesses, including a general store, restaurant, and bar.
Demographics
As of the 2010 census, the population of Coleville was approximately 200 people. The racial makeup of the town was 95.0% White, 0.5% African American, 0.5% Native American, 0.5% Asian, and 3.5% from other races. The median household income was $37,500.
Conclusion
Coleville is a small unincorporated community located in Mono County, California. It is situated in the Sierra Nevada mountain range, approximately 20 miles east of Bridgeport. The town is located at an elevation of 6,400 feet and has a population of approximately 200 people. The economy of Coleville is largely based on tourism and ranching. The town is a popular destination for outdoor recreation, such as fishing, hunting, and camping. The racial makeup of the town was 95.0% White, 0.5% African American, 0.5% Native American, 0.5% Asian, and 3.5% from other races. The median household income was $37,500.
Common Questions
What is Per Capita Income in Coleville?
Per Capita income in Coleville is $14,891.
What is the Median Family Income in Coleville?
Median Family Income in Coleville is $42,500.
What is the Median Household income in Coleville?
Median Household Income in Coleville is $42,071.
What is Inequality or Gini Index in Coleville?
Inequality or Gini Index in Coleville is 0.24.
What is the Total Population of Coleville?
Total Population of Coleville is 388.
What is the Total Male Population of Coleville?
Total Male Population of Coleville is 180.
What is the Total Female Population of Coleville?
Total Female Population of Coleville is 208.
What is the Ratio of Males per 100 Females in Coleville?
There are 86.54 Males per 100 Females in Coleville.
What is the Ratio of Females per 100 Males in Coleville?
There are 115.56 Females per 100 Males in Coleville.
What is the Median Population Age in Coleville?
Median Population Age in Coleville is 25.7 Years.
What is the Average Family Size in Coleville
Average Family Size in Coleville is 3.3 People.
What is the Average Household Size in Coleville
Average Household Size in Coleville is 3.1 People.
How Large is the Labor Force in Coleville?
There are 165 People in the Labor Forcein in Coleville.
What is the Percentage of People in the Labor Force in Coleville?
71.4% of People are in the Labor Force in Coleville.
What is the Unemployment Rate in Coleville?
Unemployment Rate in Coleville is 34.4%.