Cities with the Highest Percentage of Population Employed in Community & Social Service in South Dakota
RELATED REPORTS & OPTIONS
Community & Social Service
South Dakota
Compare Cities
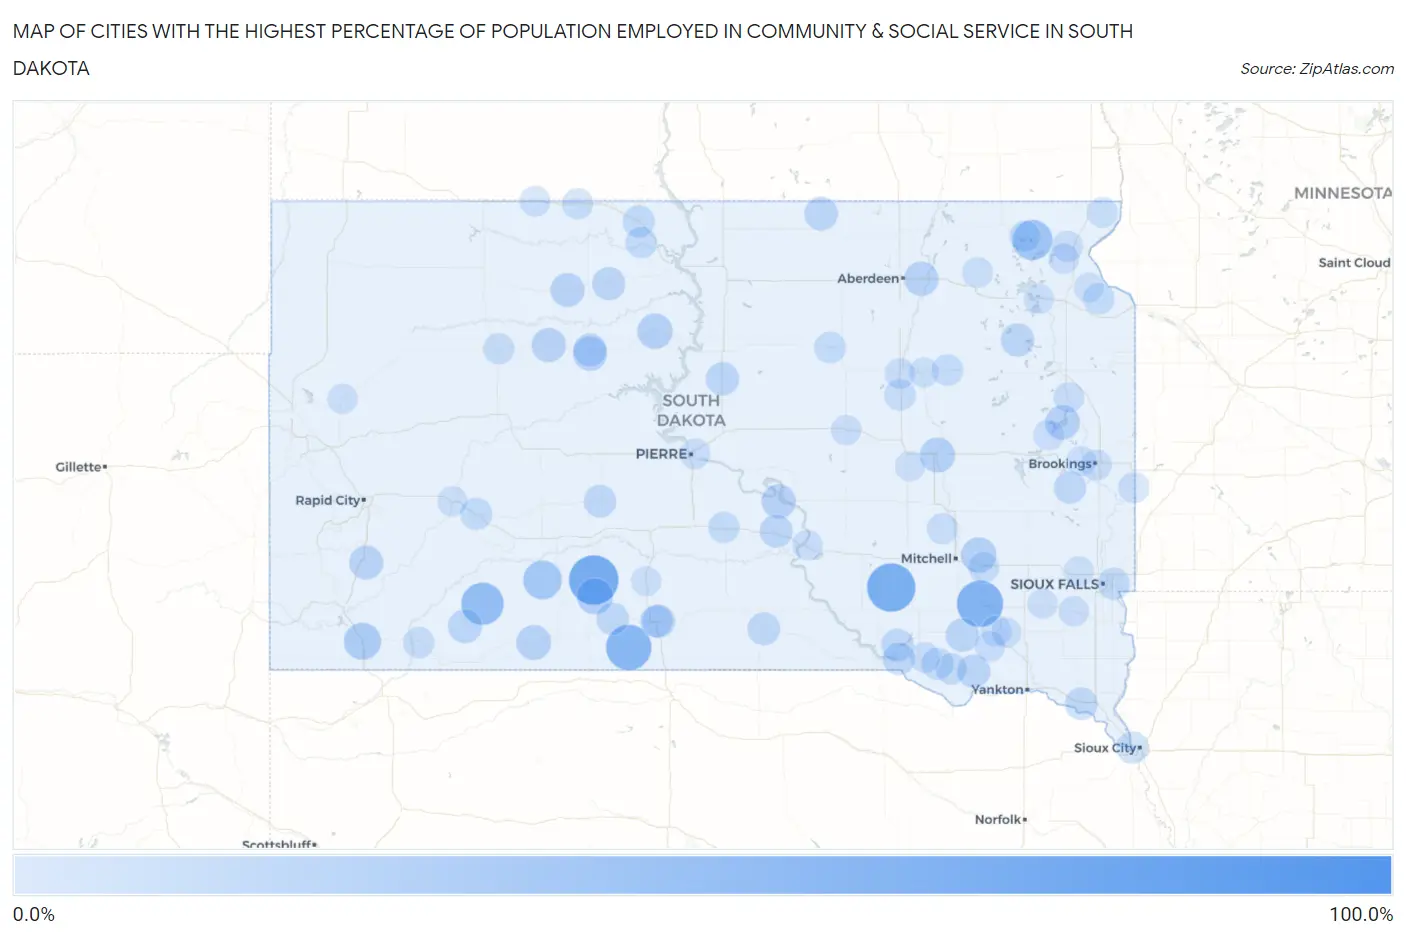
Map of Cities with the Highest Percentage of Population Employed in Community & Social Service in South Dakota
0.0%
100.0%
Cities with the Highest Percentage of Population Employed in Community & Social Service in South Dakota
| City | % Employed | vs State | vs National | |
| 1. | Bridger | 100.0% | 9.8%(+90.2)#1 | 11.2%(+88.8)#13 |
| 2. | Cameron Colony | 100.0% | 9.8%(+90.2)#2 | 11.2%(+88.8)#24 |
| 3. | Spring Lake Colony | 100.0% | 9.8%(+90.2)#3 | 11.2%(+88.8)#26 |
| 4. | Rockport Colony | 100.0% | 9.8%(+90.2)#4 | 11.2%(+88.8)#32 |
| 5. | Stephan | 82.9% | 9.8%(+73.1)#5 | 11.2%(+71.6)#58 |
| 6. | Corn Creek | 70.0% | 9.8%(+60.2)#6 | 11.2%(+58.8)#85 |
| 7. | Aurora Center | 66.7% | 9.8%(+56.9)#7 | 11.2%(+55.5)#95 |
| 8. | Milltown | 60.0% | 9.8%(+50.2)#8 | 11.2%(+48.8)#118 |
| 9. | St Francis | 57.3% | 9.8%(+47.5)#9 | 11.2%(+46.1)#132 |
| 10. | Kyle | 48.3% | 9.8%(+38.5)#10 | 11.2%(+37.1)#218 |
| 11. | Golden View Colony | 44.2% | 9.8%(+34.5)#11 | 11.2%(+33.0)#285 |
| 12. | Sicangu | 44.1% | 9.8%(+34.3)#12 | 11.2%(+32.9)#287 |
| 13. | Clear Lake | 41.7% | 9.8%(+31.9)#13 | 11.2%(+30.5)#331 |
| 14. | Wanblee | 37.0% | 9.8%(+27.2)#14 | 11.2%(+25.8)#434 |
| 15. | Crook | 35.8% | 9.8%(+26.1)#15 | 11.2%(+24.6)#466 |
| 16. | Spring Creek Colony | 32.9% | 9.8%(+23.1)#16 | 11.2%(+21.7)#596 |
| 17. | Oelrichs | 32.4% | 9.8%(+22.6)#17 | 11.2%(+21.1)#617 |
| 18. | Norris | 29.4% | 9.8%(+19.6)#18 | 11.2%(+18.2)#798 |
| 19. | Fulton | 27.5% | 9.8%(+17.7)#19 | 11.2%(+16.3)#952 |
| 20. | La Plant | 27.3% | 9.8%(+17.5)#20 | 11.2%(+16.1)#975 |
| 21. | Morningside | 26.6% | 9.8%(+16.8)#21 | 11.2%(+15.3)#1,050 |
| 22. | Martin | 25.9% | 9.8%(+16.1)#22 | 11.2%(+14.7)#1,107 |
| 23. | Prairiewood | 25.7% | 9.8%(+16.0)#23 | 11.2%(+14.5)#1,128 |
| 24. | Lake Poinsett | 25.0% | 9.8%(+15.2)#24 | 11.2%(+13.8)#1,214 |
| 25. | Dupree | 24.6% | 9.8%(+14.8)#25 | 11.2%(+13.4)#1,288 |
| 26. | Bath Corner | 24.4% | 9.8%(+14.7)#26 | 11.2%(+13.2)#1,317 |
| 27. | Eagle Butte | 24.4% | 9.8%(+14.6)#27 | 11.2%(+13.2)#1,319 |
| 28. | Lower Brule | 24.0% | 9.8%(+14.2)#28 | 11.2%(+12.8)#1,401 |
| 29. | Isabel | 23.9% | 9.8%(+14.1)#29 | 11.2%(+12.7)#1,408 |
| 30. | Fairburn | 23.5% | 9.8%(+13.8)#30 | 11.2%(+12.3)#1,487 |
| 31. | Porcupine | 23.0% | 9.8%(+13.2)#31 | 11.2%(+11.8)#1,608 |
| 32. | Tripp | 22.2% | 9.8%(+12.4)#32 | 11.2%(+11.0)#1,766 |
| 33. | Long Lake | 22.2% | 9.8%(+12.4)#33 | 11.2%(+11.0)#1,783 |
| 34. | Wallace | 21.4% | 9.8%(+11.7)#34 | 11.2%(+10.2)#1,954 |
| 35. | Tyndall | 21.4% | 9.8%(+11.6)#35 | 11.2%(+10.2)#1,965 |
| 36. | Timber Lake | 21.3% | 9.8%(+11.5)#36 | 11.2%(+10.0)#1,993 |
| 37. | Agar | 21.2% | 9.8%(+11.4)#37 | 11.2%(+9.94)#2,021 |
| 38. | Kenel | 21.0% | 9.8%(+11.2)#38 | 11.2%(+9.75)#2,072 |
| 39. | North Eagle Butte | 20.8% | 9.8%(+11.0)#39 | 11.2%(+9.60)#2,113 |
| 40. | Antelope | 20.5% | 9.8%(+10.8)#40 | 11.2%(+9.32)#2,194 |
| 41. | Reliance | 20.5% | 9.8%(+10.7)#41 | 11.2%(+9.30)#2,202 |
| 42. | Colome | 19.8% | 9.8%(+9.99)#42 | 11.2%(+8.55)#2,494 |
| 43. | Midland | 19.7% | 9.8%(+9.95)#43 | 11.2%(+8.50)#2,511 |
| 44. | Lake Andes | 19.7% | 9.8%(+9.89)#44 | 11.2%(+8.45)#2,526 |
| 45. | Vermillion | 19.4% | 9.8%(+9.63)#45 | 11.2%(+8.19)#2,638 |
| 46. | Peever Flats | 19.4% | 9.8%(+9.58)#46 | 11.2%(+8.14)#2,662 |
| 47. | Pickstown | 19.3% | 9.8%(+9.49)#47 | 11.2%(+8.05)#2,699 |
| 48. | Parmelee | 19.1% | 9.8%(+9.34)#48 | 11.2%(+7.90)#2,747 |
| 49. | Nunda | 19.0% | 9.8%(+9.27)#49 | 11.2%(+7.83)#2,778 |
| 50. | Mission | 19.0% | 9.8%(+9.26)#50 | 11.2%(+7.82)#2,783 |
| 51. | Dante | 18.5% | 9.8%(+8.69)#51 | 11.2%(+7.25)#3,027 |
| 52. | Pine Lakes Addition | 18.4% | 9.8%(+8.62)#52 | 11.2%(+7.18)#3,063 |
| 53. | Dakota Dunes | 18.2% | 9.8%(+8.41)#53 | 11.2%(+6.97)#3,153 |
| 54. | Mclaughlin | 17.9% | 9.8%(+8.11)#54 | 11.2%(+6.67)#3,304 |
| 55. | Horse Creek | 17.9% | 9.8%(+8.08)#55 | 11.2%(+6.64)#3,323 |
| 56. | Wall | 17.7% | 9.8%(+7.95)#56 | 11.2%(+6.51)#3,388 |
| 57. | Little Eagle | 16.7% | 9.8%(+6.89)#57 | 11.2%(+5.45)#3,990 |
| 58. | Corona | 16.7% | 9.8%(+6.89)#58 | 11.2%(+5.45)#4,021 |
| 59. | Avon | 16.5% | 9.8%(+6.71)#59 | 11.2%(+5.27)#4,151 |
| 60. | Faulkton | 16.4% | 9.8%(+6.64)#60 | 11.2%(+5.19)#4,192 |
| 61. | Presho | 16.2% | 9.8%(+6.40)#61 | 11.2%(+4.96)#4,363 |
| 62. | Doland | 16.0% | 9.8%(+6.23)#62 | 11.2%(+4.79)#4,477 |
| 63. | Tulare | 15.9% | 9.8%(+6.08)#63 | 11.2%(+4.64)#4,584 |
| 64. | West Brule | 15.8% | 9.8%(+6.02)#64 | 11.2%(+4.58)#4,632 |
| 65. | Oglala | 15.6% | 9.8%(+5.87)#65 | 11.2%(+4.43)#4,760 |
| 66. | Faith | 15.5% | 9.8%(+5.71)#66 | 11.2%(+4.27)#4,892 |
| 67. | Mcintosh | 15.2% | 9.8%(+5.44)#67 | 11.2%(+4.00)#5,125 |
| 68. | Lake City | 15.2% | 9.8%(+5.38)#68 | 11.2%(+3.94)#5,188 |
| 69. | Brookings | 15.1% | 9.8%(+5.37)#69 | 11.2%(+3.93)#5,196 |
| 70. | Alexandria | 15.1% | 9.8%(+5.35)#70 | 11.2%(+3.90)#5,219 |
| 71. | Letcher | 15.1% | 9.8%(+5.34)#71 | 11.2%(+3.90)#5,225 |
| 72. | Ward | 15.0% | 9.8%(+5.23)#72 | 11.2%(+3.79)#5,343 |
| 73. | Sisseton | 14.5% | 9.8%(+4.77)#73 | 11.2%(+3.33)#5,803 |
| 74. | Wakpala | 14.3% | 9.8%(+4.51)#74 | 11.2%(+3.07)#6,070 |
| 75. | Olivet | 14.3% | 9.8%(+4.51)#75 | 11.2%(+3.07)#6,096 |
| 76. | Castlewood | 14.2% | 9.8%(+4.47)#76 | 11.2%(+3.03)#6,131 |
| 77. | Wagner | 14.1% | 9.8%(+4.33)#77 | 11.2%(+2.89)#6,268 |
| 78. | Badger | 14.1% | 9.8%(+4.33)#78 | 11.2%(+2.89)#6,273 |
| 79. | Agency Village | 14.1% | 9.8%(+4.32)#79 | 11.2%(+2.88)#6,284 |
| 80. | Pierpont | 13.9% | 9.8%(+4.12)#80 | 11.2%(+2.67)#6,523 |
| 81. | Rosholt | 13.9% | 9.8%(+4.08)#81 | 11.2%(+2.64)#6,561 |
| 82. | Redfield | 13.8% | 9.8%(+4.07)#82 | 11.2%(+2.63)#6,579 |
| 83. | Pierre | 13.7% | 9.8%(+3.88)#83 | 11.2%(+2.44)#6,806 |
| 84. | Chamberlain | 13.6% | 9.8%(+3.85)#84 | 11.2%(+2.41)#6,858 |
| 85. | Morristown | 13.5% | 9.8%(+3.74)#85 | 11.2%(+2.30)#6,986 |
| 86. | Mina | 13.2% | 9.8%(+3.45)#86 | 11.2%(+2.01)#7,388 |
| 87. | Scotland | 13.2% | 9.8%(+3.44)#87 | 11.2%(+2.00)#7,407 |
| 88. | Miller | 13.1% | 9.8%(+3.36)#88 | 11.2%(+1.92)#7,512 |
| 89. | Chancellor | 13.1% | 9.8%(+3.33)#89 | 11.2%(+1.89)#7,549 |
| 90. | Wasta | 12.9% | 9.8%(+3.13)#90 | 11.2%(+1.69)#7,842 |
| 91. | Wilmot | 12.7% | 9.8%(+2.93)#91 | 11.2%(+1.49)#8,101 |
| 92. | Volga | 12.7% | 9.8%(+2.91)#92 | 11.2%(+1.47)#8,132 |
| 93. | Hartford | 12.6% | 9.8%(+2.87)#93 | 11.2%(+1.43)#8,203 |
| 94. | Waubay | 12.6% | 9.8%(+2.81)#94 | 11.2%(+1.37)#8,283 |
| 95. | Marion | 12.5% | 9.8%(+2.73)#95 | 11.2%(+1.29)#8,396 |
| 96. | Virgil | 12.5% | 9.8%(+2.73)#96 | 11.2%(+1.29)#8,448 |
| 97. | White River | 12.5% | 9.8%(+2.68)#97 | 11.2%(+1.24)#8,497 |
| 98. | Newell | 12.5% | 9.8%(+2.68)#98 | 11.2%(+1.24)#8,498 |
| 99. | Menno | 12.4% | 9.8%(+2.60)#99 | 11.2%(+1.16)#8,619 |
| 100. | Frankfort | 12.3% | 9.8%(+2.51)#100 | 11.2%(+1.07)#8,770 |
Common Questions
What are the Top 10 Cities with the Highest Percentage of Population Employed in Community & Social Service in South Dakota?
Top 10 Cities with the Highest Percentage of Population Employed in Community & Social Service in South Dakota are:
#1
70.0%
#2
66.7%
#3
60.0%
#4
57.3%
#5
48.3%
#6
41.7%
#7
37.0%
#8
32.4%
#9
29.4%
#10
27.5%
What city has the Highest Percentage of Population Employed in Community & Social Service in South Dakota?
Corn Creek has the Highest Percentage of Population Employed in Community & Social Service in South Dakota with 70.0%.
What is the Percentage of Population Employed in Community & Social Service in the State of South Dakota?
Percentage of Population Employed in Community & Social Service in South Dakota is 9.8%.
What is the Percentage of Population Employed in Community & Social Service in the United States?
Percentage of Population Employed in Community & Social Service in the United States is 11.2%.