Cities with the Highest Percentage of Population Employed in Community & Social Service in Virginia
RELATED REPORTS & OPTIONS
Community & Social Service
Virginia
Compare Cities
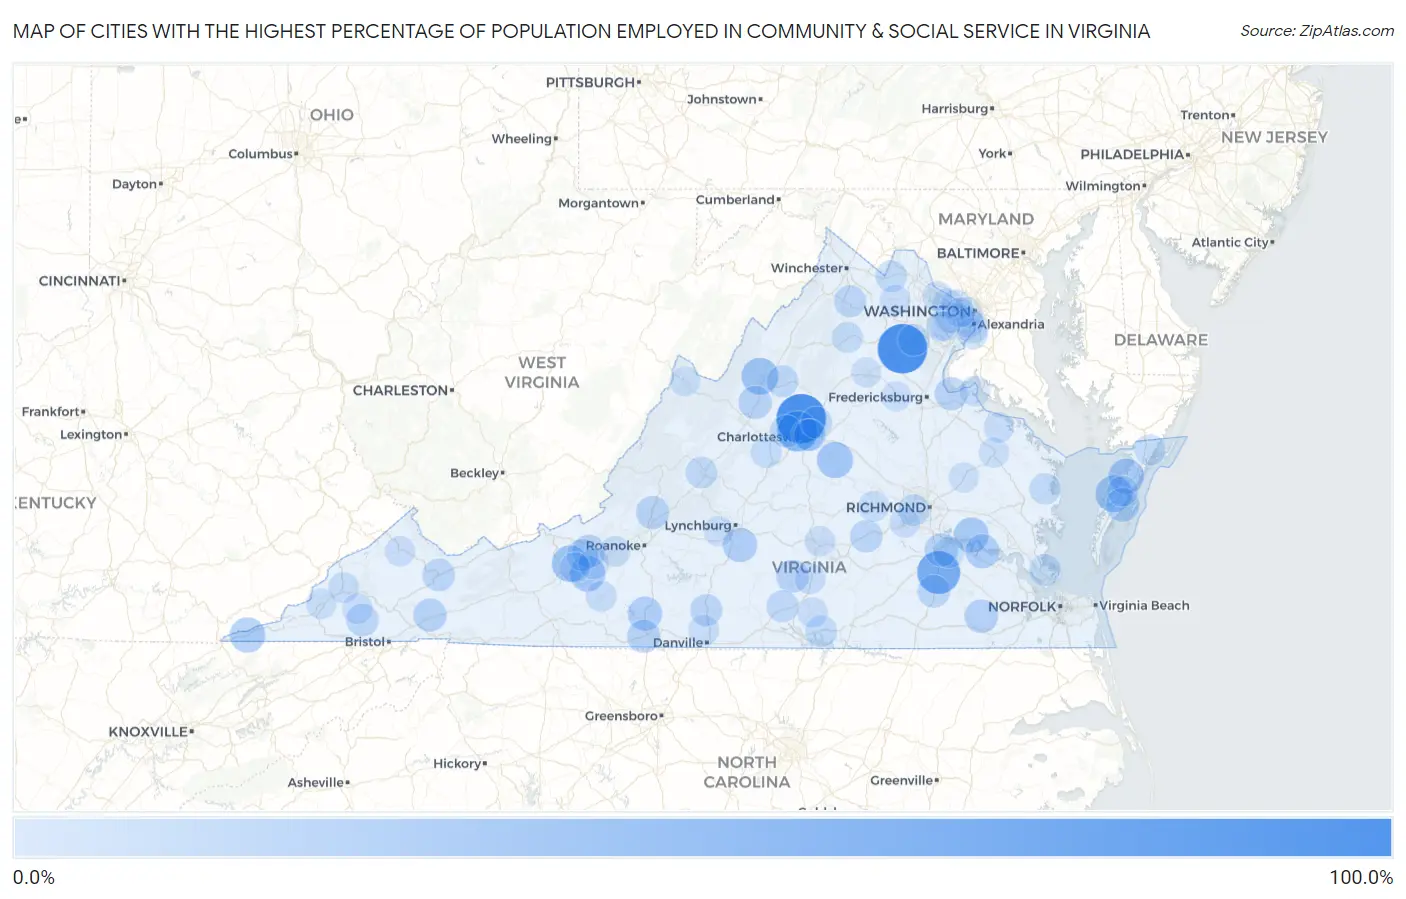
Map of Cities with the Highest Percentage of Population Employed in Community & Social Service in Virginia
0.0%
100.0%
Cities with the Highest Percentage of Population Employed in Community & Social Service in Virginia
| City | % Employed | vs State | vs National | |
| 1. | Free Union | 100.0% | 12.1%(+87.9)#1 | 11.2%(+88.8)#5 |
| 2. | Calverton | 100.0% | 12.1%(+87.9)#2 | 11.2%(+88.8)#20 |
| 3. | Templeton | 70.5% | 12.1%(+58.4)#3 | 11.2%(+59.3)#84 |
| 4. | Aldie | 64.3% | 12.1%(+52.2)#4 | 11.2%(+53.1)#105 |
| 5. | Ivy | 59.8% | 12.1%(+47.7)#5 | 11.2%(+48.6)#119 |
| 6. | Brucetown | 52.7% | 12.1%(+40.5)#6 | 11.2%(+41.5)#165 |
| 7. | Mcdowell | 50.0% | 12.1%(+37.9)#7 | 11.2%(+38.8)#193 |
| 8. | Belmont Estates | 45.2% | 12.1%(+33.1)#8 | 11.2%(+34.0)#264 |
| 9. | Pungoteague | 43.8% | 12.1%(+31.6)#9 | 11.2%(+32.5)#296 |
| 10. | Camp Barrett | 42.9% | 12.1%(+30.7)#10 | 11.2%(+31.6)#307 |
| 11. | New River | 42.4% | 12.1%(+30.2)#11 | 11.2%(+31.2)#321 |
| 12. | Palmyra | 41.6% | 12.1%(+29.5)#12 | 11.2%(+30.4)#332 |
| 13. | Innovation | 39.6% | 12.1%(+27.4)#13 | 11.2%(+28.3)#360 |
| 14. | Riner | 39.2% | 12.1%(+27.0)#14 | 11.2%(+28.0)#367 |
| 15. | Bayside | 38.4% | 12.1%(+26.3)#15 | 11.2%(+27.2)#391 |
| 16. | Stickleyville | 37.9% | 12.1%(+25.8)#16 | 11.2%(+26.7)#398 |
| 17. | Ewing | 37.4% | 12.1%(+25.3)#17 | 11.2%(+26.2)#420 |
| 18. | Charles City | 36.8% | 12.1%(+24.7)#18 | 11.2%(+25.6)#441 |
| 19. | Rustburg | 33.9% | 12.1%(+21.8)#19 | 11.2%(+22.7)#544 |
| 20. | Oak Level | 33.5% | 12.1%(+21.4)#20 | 11.2%(+22.3)#553 |
| 21. | North Garden | 33.0% | 12.1%(+20.9)#21 | 11.2%(+21.8)#585 |
| 22. | Claremont | 33.0% | 12.1%(+20.8)#22 | 11.2%(+21.8)#587 |
| 23. | Quinby | 32.1% | 12.1%(+20.0)#23 | 11.2%(+20.9)#631 |
| 24. | Sedley | 30.0% | 12.1%(+17.8)#24 | 11.2%(+18.8)#760 |
| 25. | Hilltown | 29.8% | 12.1%(+17.7)#25 | 11.2%(+18.6)#770 |
| 26. | Emory | 29.5% | 12.1%(+17.4)#26 | 11.2%(+18.3)#791 |
| 27. | Fincastle | 29.5% | 12.1%(+17.4)#27 | 11.2%(+18.3)#792 |
| 28. | Fort Lee | 29.4% | 12.1%(+17.3)#28 | 11.2%(+18.2)#796 |
| 29. | Mount Sidney | 29.2% | 12.1%(+17.0)#29 | 11.2%(+17.9)#818 |
| 30. | Horse Pasture | 29.0% | 12.1%(+16.9)#30 | 11.2%(+17.8)#827 |
| 31. | Blacksburg | 28.2% | 12.1%(+16.1)#31 | 11.2%(+17.0)#889 |
| 32. | Fairview Beach | 28.1% | 12.1%(+15.9)#32 | 11.2%(+16.8)#907 |
| 33. | Charlotte Court House | 27.8% | 12.1%(+15.6)#33 | 11.2%(+16.6)#922 |
| 34. | Big Rock | 27.6% | 12.1%(+15.5)#34 | 11.2%(+16.4)#942 |
| 35. | Stony Creek | 27.0% | 12.1%(+14.8)#35 | 11.2%(+15.7)#1,011 |
| 36. | Moneta | 26.9% | 12.1%(+14.7)#36 | 11.2%(+15.7)#1,019 |
| 37. | Claypool Hill | 26.3% | 12.1%(+14.2)#37 | 11.2%(+15.1)#1,070 |
| 38. | Crozet | 26.3% | 12.1%(+14.2)#38 | 11.2%(+15.1)#1,074 |
| 39. | Amelia Court House | 26.2% | 12.1%(+14.0)#39 | 11.2%(+15.0)#1,090 |
| 40. | University Of Virginia | 25.9% | 12.1%(+13.7)#40 | 11.2%(+14.6)#1,117 |
| 41. | Nickelsville | 25.6% | 12.1%(+13.5)#41 | 11.2%(+14.4)#1,139 |
| 42. | Great Falls Crossing | 25.4% | 12.1%(+13.2)#42 | 11.2%(+14.2)#1,165 |
| 43. | Chatham | 24.8% | 12.1%(+12.7)#43 | 11.2%(+13.6)#1,259 |
| 44. | Shenandoah Shores | 24.6% | 12.1%(+12.4)#44 | 11.2%(+13.4)#1,294 |
| 45. | Clover | 24.2% | 12.1%(+12.0)#45 | 11.2%(+12.9)#1,362 |
| 46. | Prices Fork | 24.0% | 12.1%(+11.8)#46 | 11.2%(+12.8)#1,402 |
| 47. | Hollymead | 23.5% | 12.1%(+11.4)#47 | 11.2%(+12.3)#1,494 |
| 48. | Massanutten | 23.4% | 12.1%(+11.3)#48 | 11.2%(+12.2)#1,509 |
| 49. | Lexington | 23.2% | 12.1%(+11.0)#49 | 11.2%(+12.0)#1,556 |
| 50. | Charlottesville | 23.1% | 12.1%(+11.0)#50 | 11.2%(+11.9)#1,573 |
| 51. | Boydton | 22.8% | 12.1%(+10.7)#51 | 11.2%(+11.6)#1,648 |
| 52. | Bethel Manor | 22.8% | 12.1%(+10.6)#52 | 11.2%(+11.5)#1,656 |
| 53. | Nokesville | 22.8% | 12.1%(+10.6)#53 | 11.2%(+11.5)#1,657 |
| 54. | Round Hill | 22.4% | 12.1%(+10.3)#54 | 11.2%(+11.2)#1,727 |
| 55. | Bon Air | 22.4% | 12.1%(+10.2)#55 | 11.2%(+11.2)#1,744 |
| 56. | Belle Haven | 22.2% | 12.1%(+10.0)#56 | 11.2%(+10.9)#1,796 |
| 57. | The University Of Virginia's College At Wise | 21.7% | 12.1%(+9.59)#57 | 11.2%(+10.5)#1,887 |
| 58. | Irvington | 21.5% | 12.1%(+9.40)#58 | 11.2%(+10.3)#1,926 |
| 59. | Washington | 20.6% | 12.1%(+8.45)#59 | 11.2%(+9.37)#2,178 |
| 60. | Prince George | 20.5% | 12.1%(+8.37)#60 | 11.2%(+9.29)#2,203 |
| 61. | Wattsville | 20.5% | 12.1%(+8.35)#61 | 11.2%(+9.28)#2,205 |
| 62. | Nellysford | 20.2% | 12.1%(+8.05)#62 | 11.2%(+8.97)#2,331 |
| 63. | Keysville | 19.9% | 12.1%(+7.80)#63 | 11.2%(+8.72)#2,437 |
| 64. | Powhatan | 19.8% | 12.1%(+7.68)#64 | 11.2%(+8.61)#2,472 |
| 65. | Earlysville | 19.5% | 12.1%(+7.39)#65 | 11.2%(+8.31)#2,597 |
| 66. | Christiansburg | 19.4% | 12.1%(+7.24)#66 | 11.2%(+8.16)#2,650 |
| 67. | Goose Creek | 19.4% | 12.1%(+7.23)#67 | 11.2%(+8.15)#2,654 |
| 68. | Mantua | 19.2% | 12.1%(+7.11)#68 | 11.2%(+8.03)#2,701 |
| 69. | Wise | 19.1% | 12.1%(+6.93)#69 | 11.2%(+7.85)#2,762 |
| 70. | Floyd | 19.0% | 12.1%(+6.84)#70 | 11.2%(+7.76)#2,801 |
| 71. | Fort Hunt | 18.9% | 12.1%(+6.76)#71 | 11.2%(+7.68)#2,836 |
| 72. | Mclean | 18.9% | 12.1%(+6.73)#72 | 11.2%(+7.65)#2,851 |
| 73. | Mount Hermon | 18.8% | 12.1%(+6.68)#73 | 11.2%(+7.60)#2,877 |
| 74. | Arlington | 18.6% | 12.1%(+6.42)#74 | 11.2%(+7.34)#2,982 |
| 75. | Middleburg | 18.5% | 12.1%(+6.37)#75 | 11.2%(+7.29)#3,002 |
| 76. | Dahlgren Center | 18.5% | 12.1%(+6.36)#76 | 11.2%(+7.28)#3,007 |
| 77. | Lafayette | 18.4% | 12.1%(+6.29)#77 | 11.2%(+7.21)#3,041 |
| 78. | Pounding Mill | 18.4% | 12.1%(+6.27)#78 | 11.2%(+7.19)#3,057 |
| 79. | Melfa | 18.4% | 12.1%(+6.24)#79 | 11.2%(+7.16)#3,069 |
| 80. | Wolf Trap | 18.3% | 12.1%(+6.15)#80 | 11.2%(+7.08)#3,114 |
| 81. | Chase City | 18.2% | 12.1%(+6.08)#81 | 11.2%(+7.00)#3,146 |
| 82. | Farmville | 18.1% | 12.1%(+5.99)#82 | 11.2%(+6.91)#3,197 |
| 83. | Radford | 18.0% | 12.1%(+5.90)#83 | 11.2%(+6.82)#3,238 |
| 84. | Dungannon | 18.0% | 12.1%(+5.84)#84 | 11.2%(+6.76)#3,263 |
| 85. | Alexandria | 17.9% | 12.1%(+5.73)#85 | 11.2%(+6.65)#3,315 |
| 86. | Vansant | 17.8% | 12.1%(+5.69)#86 | 11.2%(+6.61)#3,341 |
| 87. | Montross | 17.8% | 12.1%(+5.62)#87 | 11.2%(+6.54)#3,374 |
| 88. | Dranesville | 17.7% | 12.1%(+5.56)#88 | 11.2%(+6.48)#3,400 |
| 89. | Burke Centre | 17.6% | 12.1%(+5.42)#89 | 11.2%(+6.34)#3,488 |
| 90. | Big Stone Gap | 17.5% | 12.1%(+5.36)#90 | 11.2%(+6.28)#3,537 |
| 91. | Brandermill | 17.5% | 12.1%(+5.33)#91 | 11.2%(+6.26)#3,547 |
| 92. | Forest | 17.2% | 12.1%(+5.08)#92 | 11.2%(+6.00)#3,687 |
| 93. | Central Garage | 17.2% | 12.1%(+5.04)#93 | 11.2%(+5.96)#3,704 |
| 94. | Lake Wilderness | 17.2% | 12.1%(+5.04)#94 | 11.2%(+5.96)#3,708 |
| 95. | Tappahannock | 17.2% | 12.1%(+5.02)#95 | 11.2%(+5.94)#3,727 |
| 96. | Difficult Run | 17.0% | 12.1%(+4.84)#96 | 11.2%(+5.76)#3,826 |
| 97. | Falls Church | 16.9% | 12.1%(+4.76)#97 | 11.2%(+5.69)#3,862 |
| 98. | Fairfax Station | 16.8% | 12.1%(+4.67)#98 | 11.2%(+5.59)#3,916 |
| 99. | Monterey | 16.7% | 12.1%(+4.53)#99 | 11.2%(+5.45)#4,009 |
| 100. | Culpeper | 16.7% | 12.1%(+4.53)#100 | 11.2%(+5.45)#4,035 |
Common Questions
What are the Top 10 Cities with the Highest Percentage of Population Employed in Community & Social Service in Virginia?
Top 10 Cities with the Highest Percentage of Population Employed in Community & Social Service in Virginia are:
#1
100.0%
#2
100.0%
#3
70.5%
#4
59.8%
#5
45.2%
#6
43.8%
#7
42.4%
#8
41.6%
#9
39.2%
#10
38.4%
What city has the Highest Percentage of Population Employed in Community & Social Service in Virginia?
Free Union has the Highest Percentage of Population Employed in Community & Social Service in Virginia with 100.0%.
What is the Percentage of Population Employed in Community & Social Service in the State of Virginia?
Percentage of Population Employed in Community & Social Service in Virginia is 12.1%.
What is the Percentage of Population Employed in Community & Social Service in the United States?
Percentage of Population Employed in Community & Social Service in the United States is 11.2%.