Cities with the Highest Percentage of Population Employed in Community & Social Service in Texas
RELATED REPORTS & OPTIONS
Community & Social Service
Texas
Compare Cities
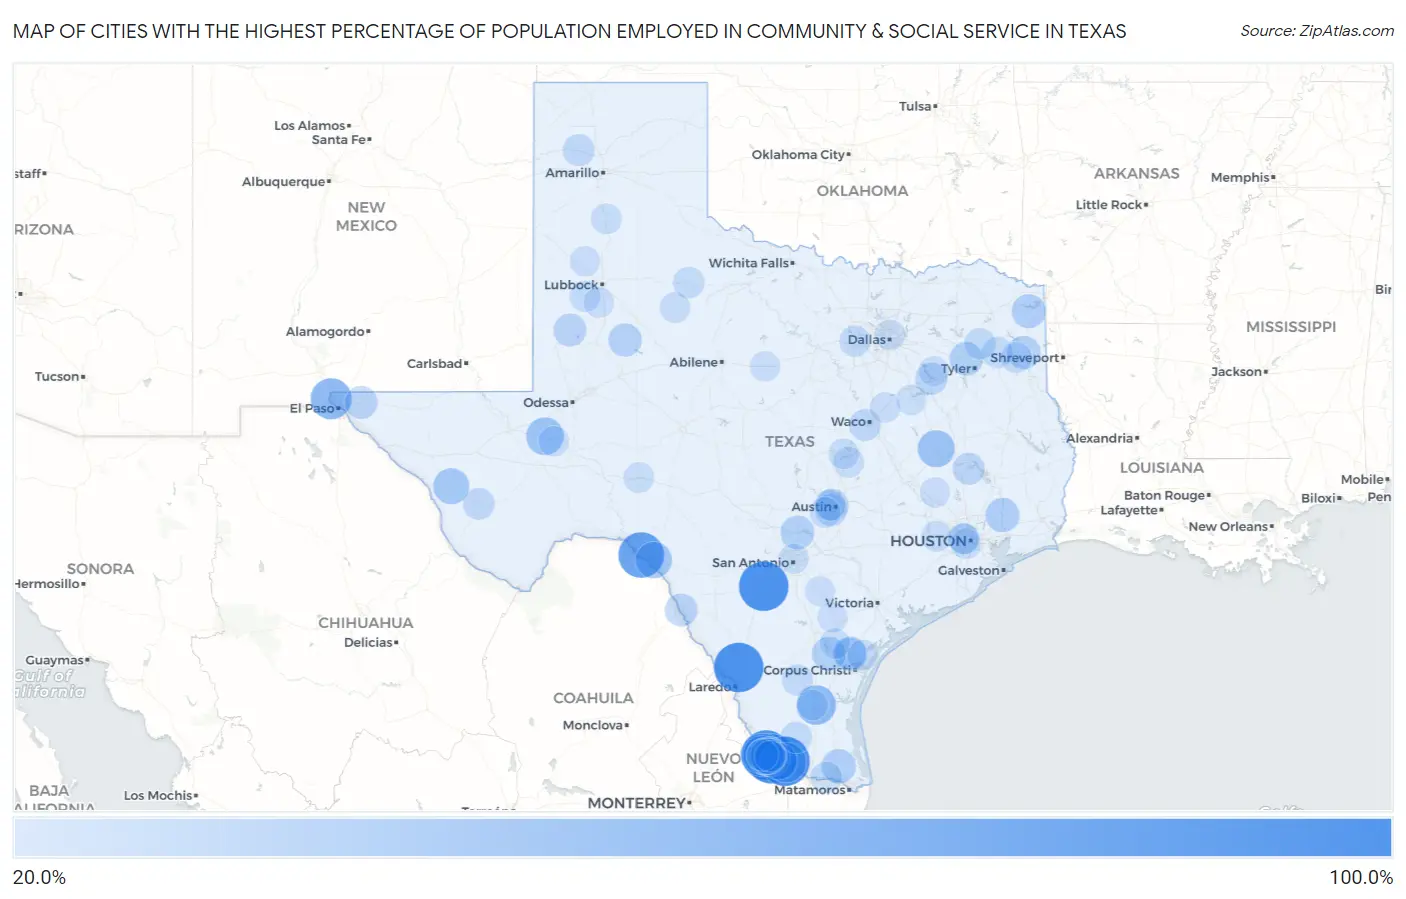
Map of Cities with the Highest Percentage of Population Employed in Community & Social Service in Texas
0.0%
100.0%
Cities with the Highest Percentage of Population Employed in Community & Social Service in Texas
| City | % Employed | vs State | vs National | |
| 1. | North Escobares | 100.0% | 10.5%(+89.5)#1 | 11.2%(+88.8)#4 |
| 2. | Moore | 100.0% | 10.5%(+89.5)#2 | 11.2%(+88.8)#9 |
| 3. | Sunset Acres | 100.0% | 10.5%(+89.5)#3 | 11.2%(+88.8)#33 |
| 4. | Santel | 100.0% | 10.5%(+89.5)#4 | 11.2%(+88.8)#45 |
| 5. | Gutierrez | 100.0% | 10.5%(+89.5)#5 | 11.2%(+88.8)#46 |
| 6. | Sheffield | 86.4% | 10.5%(+75.9)#6 | 11.2%(+75.1)#54 |
| 7. | Box Canyon | 84.2% | 10.5%(+73.7)#7 | 11.2%(+73.0)#55 |
| 8. | Barksdale | 75.9% | 10.5%(+65.4)#8 | 11.2%(+64.6)#72 |
| 9. | Ramos | 73.3% | 10.5%(+62.8)#9 | 11.2%(+62.1)#81 |
| 10. | Prado Verde | 64.8% | 10.5%(+54.3)#10 | 11.2%(+53.5)#103 |
| 11. | Shelbyville | 60.2% | 10.5%(+49.7)#11 | 11.2%(+49.0)#114 |
| 12. | La Paloma Ranchettes | 60.0% | 10.5%(+49.5)#12 | 11.2%(+48.8)#117 |
| 13. | Airport Road Addition | 58.5% | 10.5%(+48.0)#13 | 11.2%(+47.3)#123 |
| 14. | Garceno | 57.1% | 10.5%(+46.6)#14 | 11.2%(+45.9)#134 |
| 15. | Rancho Viejo | 56.4% | 10.5%(+45.9)#15 | 11.2%(+45.1)#145 |
| 16. | Evergreen | 56.0% | 10.5%(+45.4)#16 | 11.2%(+44.7)#147 |
| 17. | Salineno North | 52.4% | 10.5%(+41.9)#17 | 11.2%(+41.2)#167 |
| 18. | Ranchitos Del Norte | 51.5% | 10.5%(+41.0)#18 | 11.2%(+40.3)#174 |
| 19. | Grandfalls | 50.8% | 10.5%(+40.3)#19 | 11.2%(+39.6)#182 |
| 20. | Leona | 49.0% | 10.5%(+38.5)#20 | 11.2%(+37.8)#214 |
| 21. | Chaparrito | 47.8% | 10.5%(+37.3)#21 | 11.2%(+36.6)#230 |
| 22. | Lake View | 47.0% | 10.5%(+36.5)#22 | 11.2%(+35.8)#241 |
| 23. | J F Villareal | 45.7% | 10.5%(+35.2)#23 | 11.2%(+34.5)#256 |
| 24. | Valentine | 44.4% | 10.5%(+33.9)#24 | 11.2%(+33.2)#277 |
| 25. | Richards | 43.9% | 10.5%(+33.4)#25 | 11.2%(+32.7)#291 |
| 26. | Miguel Barrera | 43.6% | 10.5%(+33.1)#26 | 11.2%(+32.4)#297 |
| 27. | San Juan | 43.5% | 10.5%(+33.0)#27 | 11.2%(+32.3)#299 |
| 28. | Tow | 42.9% | 10.5%(+32.4)#28 | 11.2%(+31.6)#308 |
| 29. | Los Ebanos Cdp Starr County | 42.0% | 10.5%(+31.5)#29 | 11.2%(+30.8)#327 |
| 30. | Alamo Beach | 39.1% | 10.5%(+28.6)#30 | 11.2%(+27.9)#369 |
| 31. | Loma Linda | 38.8% | 10.5%(+28.3)#31 | 11.2%(+27.6)#377 |
| 32. | Lasana | 38.0% | 10.5%(+27.5)#32 | 11.2%(+26.8)#397 |
| 33. | Dayton Lakes | 37.5% | 10.5%(+27.0)#33 | 11.2%(+26.3)#415 |
| 34. | Douglassville | 37.2% | 10.5%(+26.7)#34 | 11.2%(+26.0)#424 |
| 35. | Sandia | 36.7% | 10.5%(+26.1)#35 | 11.2%(+25.4)#446 |
| 36. | Spring Branch | 36.2% | 10.5%(+25.7)#36 | 11.2%(+25.0)#456 |
| 37. | Hideaway | 36.0% | 10.5%(+25.5)#37 | 11.2%(+24.8)#463 |
| 38. | Nesbitt | 34.6% | 10.5%(+24.1)#38 | 11.2%(+23.4)#515 |
| 39. | Gail | 34.1% | 10.5%(+23.6)#39 | 11.2%(+22.9)#538 |
| 40. | Butterfield | 32.4% | 10.5%(+21.9)#40 | 11.2%(+21.2)#613 |
| 41. | Loop | 32.4% | 10.5%(+21.8)#41 | 11.2%(+21.1)#618 |
| 42. | Las Quintas Fronterizas | 32.0% | 10.5%(+21.5)#42 | 11.2%(+20.8)#635 |
| 43. | Rochelle | 32.0% | 10.5%(+21.4)#43 | 11.2%(+20.7)#639 |
| 44. | Sylvester | 31.6% | 10.5%(+21.1)#44 | 11.2%(+20.4)#657 |
| 45. | Bluff Dale | 31.2% | 10.5%(+20.7)#45 | 11.2%(+20.0)#675 |
| 46. | Sunset Valley | 30.4% | 10.5%(+19.9)#46 | 11.2%(+19.2)#729 |
| 47. | West Lake Hills | 30.0% | 10.5%(+19.5)#47 | 11.2%(+18.8)#750 |
| 48. | Star Harbor | 29.8% | 10.5%(+19.3)#48 | 11.2%(+18.6)#767 |
| 49. | Kopperl | 29.8% | 10.5%(+19.3)#49 | 11.2%(+18.6)#769 |
| 50. | Riverside | 29.6% | 10.5%(+19.1)#50 | 11.2%(+18.4)#789 |
| 51. | Woodway | 28.6% | 10.5%(+18.1)#51 | 11.2%(+17.4)#851 |
| 52. | South Frydek | 28.6% | 10.5%(+18.1)#52 | 11.2%(+17.4)#855 |
| 53. | Marfa | 28.5% | 10.5%(+18.0)#53 | 11.2%(+17.3)#870 |
| 54. | La Paloma Addition | 28.4% | 10.5%(+17.9)#54 | 11.2%(+17.2)#874 |
| 55. | Boys Ranch | 28.2% | 10.5%(+17.7)#55 | 11.2%(+17.0)#891 |
| 56. | Spring Valley Village | 27.7% | 10.5%(+17.2)#56 | 11.2%(+16.5)#936 |
| 57. | Relampago | 27.6% | 10.5%(+17.1)#57 | 11.2%(+16.3)#945 |
| 58. | San Isidro | 27.5% | 10.5%(+17.0)#58 | 11.2%(+16.3)#955 |
| 59. | Poetry | 27.5% | 10.5%(+17.0)#59 | 11.2%(+16.2)#956 |
| 60. | Union Grove | 27.0% | 10.5%(+16.5)#60 | 11.2%(+15.8)#999 |
| 61. | Guthrie | 27.0% | 10.5%(+16.5)#61 | 11.2%(+15.8)#1,008 |
| 62. | Fronton Ranchettes | 26.7% | 10.5%(+16.2)#62 | 11.2%(+15.5)#1,042 |
| 63. | Westover Hills | 26.6% | 10.5%(+16.1)#63 | 11.2%(+15.4)#1,046 |
| 64. | Holly Lake Ranch | 26.4% | 10.5%(+15.9)#64 | 11.2%(+15.2)#1,062 |
| 65. | Center Point | 26.3% | 10.5%(+15.8)#65 | 11.2%(+15.1)#1,071 |
| 66. | Benavides | 26.3% | 10.5%(+15.8)#66 | 11.2%(+15.1)#1,075 |
| 67. | Wadsworth | 26.1% | 10.5%(+15.6)#67 | 11.2%(+14.9)#1,094 |
| 68. | Lost Creek | 25.9% | 10.5%(+15.4)#68 | 11.2%(+14.7)#1,112 |
| 69. | Beauxart Gardens | 25.8% | 10.5%(+15.3)#69 | 11.2%(+14.6)#1,119 |
| 70. | Hallsville | 25.1% | 10.5%(+14.6)#70 | 11.2%(+13.9)#1,194 |
| 71. | Ropesville | 25.0% | 10.5%(+14.5)#71 | 11.2%(+13.8)#1,215 |
| 72. | Santo | 24.9% | 10.5%(+14.4)#72 | 11.2%(+13.7)#1,252 |
| 73. | Bear Creek | 24.7% | 10.5%(+14.2)#73 | 11.2%(+13.5)#1,277 |
| 74. | Jayton | 24.5% | 10.5%(+14.0)#74 | 11.2%(+13.3)#1,312 |
| 75. | Pattison | 24.4% | 10.5%(+13.9)#75 | 11.2%(+13.2)#1,322 |
| 76. | Ozona | 24.2% | 10.5%(+13.7)#76 | 11.2%(+13.0)#1,354 |
| 77. | Benjamin Perez | 24.1% | 10.5%(+13.6)#77 | 11.2%(+12.9)#1,365 |
| 78. | Tradewinds | 24.1% | 10.5%(+13.6)#78 | 11.2%(+12.9)#1,372 |
| 79. | Tulia | 24.0% | 10.5%(+13.5)#79 | 11.2%(+12.8)#1,400 |
| 80. | Salado | 23.9% | 10.5%(+13.4)#80 | 11.2%(+12.7)#1,415 |
| 81. | Nolanville | 23.8% | 10.5%(+13.3)#81 | 11.2%(+12.6)#1,439 |
| 82. | Falfurrias | 23.7% | 10.5%(+13.2)#82 | 11.2%(+12.5)#1,454 |
| 83. | Imperial | 23.5% | 10.5%(+13.0)#83 | 11.2%(+12.3)#1,499 |
| 84. | University Park | 23.4% | 10.5%(+12.9)#84 | 11.2%(+12.2)#1,507 |
| 85. | New Home | 23.4% | 10.5%(+12.9)#85 | 11.2%(+12.2)#1,525 |
| 86. | Mount Calm | 23.3% | 10.5%(+12.8)#86 | 11.2%(+12.1)#1,544 |
| 87. | Cisco | 23.1% | 10.5%(+12.6)#87 | 11.2%(+11.9)#1,564 |
| 88. | Tynan | 23.1% | 10.5%(+12.6)#88 | 11.2%(+11.9)#1,581 |
| 89. | Southside Place | 22.9% | 10.5%(+12.4)#89 | 11.2%(+11.7)#1,618 |
| 90. | Richland | 22.8% | 10.5%(+12.3)#90 | 11.2%(+11.6)#1,635 |
| 91. | Anderson | 22.8% | 10.5%(+12.3)#91 | 11.2%(+11.6)#1,636 |
| 92. | Tuleta | 22.7% | 10.5%(+12.2)#92 | 11.2%(+11.5)#1,663 |
| 93. | Spade | 22.6% | 10.5%(+12.1)#93 | 11.2%(+11.4)#1,689 |
| 94. | Hilshire Village | 22.6% | 10.5%(+12.1)#94 | 11.2%(+11.3)#1,694 |
| 95. | Eustace | 22.5% | 10.5%(+12.0)#95 | 11.2%(+11.3)#1,708 |
| 96. | Mound | 22.5% | 10.5%(+12.0)#96 | 11.2%(+11.3)#1,716 |
| 97. | Falls City | 22.4% | 10.5%(+11.9)#97 | 11.2%(+11.2)#1,735 |
| 98. | Olmos Park | 22.4% | 10.5%(+11.9)#98 | 11.2%(+11.2)#1,739 |
| 99. | Rice Tracts | 21.9% | 10.5%(+11.4)#99 | 11.2%(+10.7)#1,849 |
| 100. | May | 21.7% | 10.5%(+11.2)#100 | 11.2%(+10.5)#1,893 |
Common Questions
What are the Top 10 Cities with the Highest Percentage of Population Employed in Community & Social Service in Texas?
Top 10 Cities with the Highest Percentage of Population Employed in Community & Social Service in Texas are:
#1
100.0%
#2
100.0%
#3
100.0%
#4
100.0%
#5
100.0%
#6
84.2%
#7
73.3%
#8
64.8%
#9
60.0%
#10
58.5%
What city has the Highest Percentage of Population Employed in Community & Social Service in Texas?
North Escobares has the Highest Percentage of Population Employed in Community & Social Service in Texas with 100.0%.
What is the Percentage of Population Employed in Community & Social Service in the State of Texas?
Percentage of Population Employed in Community & Social Service in Texas is 10.5%.
What is the Percentage of Population Employed in Community & Social Service in the United States?
Percentage of Population Employed in Community & Social Service in the United States is 11.2%.